Abstract
Additive manufactured (AM) metals are attractive materials for medical implants, as their geometries are directly produced from computer-aided design (CAD)/computer-aided manufacturing (CAM) data. However, the fatigue properties of AM metals are weak compared with bulk metals, which is an obstacle to the practical applications of AM metals. To improve the fatigue properties of AM metals, we developed a mechanical surface treatment using laser cavitation. When we irradiate a pulsed laser to a metallic surface in water, laser ablation is generated, and a bubble that behaves like a cavitation is produced. The bubble is referred to as a “laser cavitation”. In the surface treatment using laser cavitation, we use the plastic deformation caused by the impact force at the bubble collapse and pulsed laser energy that produces local melting at the same time. Thus, the mechanical surface treatment using laser cavitation is a type of surface mechanical alloying. In this study, to demonstrate the improvement in the fatigue properties of AM metals, we treated titanium alloy Ti6Al4V, which was manufactured by direct metal laser sintering (DMLS), with laser cavitation, and we evaluated the surface morphology, roughness, residual stress, hardness, and finally tested it using a torsion fatigue test. Unmelted particles on the DMLS surface, which cause fatigue cracks, were melted and resolidified using laser cavitation, resulting in a reduction of the maximum heights of roughness (Rz) of about 75% and the arithmetical mean roughness (Ra) of about 84% of the non-peened one. Although tensile residual stresses of about 80–180 MPa were generated on the as-built surface, compressive residual stresses of about −80 MPa were introduced by laser cavitation. Furthermore, laser cavitation formed Ti4O5 oxide film, which increased the surface hardness by about 106%. Finally, we performed torsional fatigue tests and revealed that laser cavitation extended the fatigue life from 19,791 cycles to 36,288 cycles at an applied shear stress (τa) at 460 MPa, which is effective in suppressing crack initiation.
1. Introduction
We can use additive manufacturing (AM) to directly and rapidly manufacture complex shapes using computer-aided manufacturing (CAM) based on the design data created by computer-aided design (CAD) [1]. Titanium, which is a material that is used in AM, is considered biocompatible because of its low electrical conductivity and the formation of a thin oxide film with high corrosion resistance by electrochemical oxidation, which makes it an attractive material for medical implants [2,3]. In particular, the titanium alloy Ti6Al4V, which was originally developed for aviation and aerospace applications [4,5], has become the most widely used titanium alloy for biological implants, which require high strength [2]. Specifically, the tensile properties of annealed AM Ti6Al4V satisfy the American Society of Testing and Materials (ASTM) specifications for use as a medical material [6]. However, the fatigue properties of the as-built AM metals, including Ti6Al4V, are weaker than those of conventionally wrought bulk materials [7,8,9,10,11], which has become an obstacle to their practical application. The fatigue properties of materials depend on their microstructures, internal defects, residual stresses, surface roughness, etc., which, in turn, depend on the manufacturing processes and post-manufacturing treatments. In addition, fatigue cracks are initiated by defects such as inclusions, vacancies inside the material, the surface roughness, etc.; thus, it is necessary to take measures to improve the fatigue life of AM metals, which contain voids and have heterogeneous microstructures due to insufficient melting [12]. In particular, the surface roughness of AM metals increases due to the presence of unmelted particles on the surface, which is a major cause of the fatigue performance degradation [13,14]. For AM Ti6Al4V, post-heat treatments do not substantially extend the fatigue life because the surface roughness has a more severe effect on the crack initiation than the internal defects [15]. Therefore, surface treatments are an important method for improving the fatigue properties of AM titanium metals.
To improve the fatigue properties of AM metals, researchers have developed a mechanical surface treatment using laser cavitation [16,17,18]. When a pulsed laser is irradiated to a metallic surface in water, laser ablation (LA) is generated, and a bubble that behaves similar to a cavitation is produced [19,20]. The bubble generated by the negative pressure wave after the shockwave generated by the LA is referred to as a “laser cavitation (LC)” [21]. Sasoh et al. measured the amplitude of pressure waves in water using a submerged shockwave sensor, and they demonstrated that the amplitude of the shockwave produced from LA was larger than that produced from LC [22]. Conversely, Soyama developed a method to directly measure the impact force that passes through the target using a polyvinylidene fluoride (PVDF) sensor and found that the impact force due to the LC collapse was larger than that of LA [17,18]. Consequently, LC is an excellent surface treatment method for introducing high-impact forces to material surfaces. In the surface treatment using LC, we use the plastic deformation caused by the impact force at the bubble collapse and pulsed laser energy that produces local melting at the same time [23]. Thus, the mechanical surface treatment using LC is a type of surface mechanical alloying.
Researchers have confirmed the fatigue improvement in surface-treated AM Ti6Al4V with plane-bending fatigue tests [24]; however, according to the multiaxial fatigue behavior of surface-treated AM Ti6Al4V, torsional fatigue strength is required. For example, the fatigue life of a notched specimen under the uniaxial loading of a constant amplitude and the multiaxial fatigue life measured by the torsion test differ depending on the loading method, even under the same equivalent nominal stress [25]. Furthermore, depending on the surface roughness and notch geometry, there are differences in the fatigue life between tensile and multiaxial loading [26]. Therefore, when investigating the effect of the surface properties on the fatigue life, it is necessary to perform torsion tests with multiaxial loading. However, multi-axial fatigue tests require high-precision centering, etc., thus conventional machines are not suitable for evaluation. Therefore, we have developed an attachment to a load-controlled plane bending machine that enables torsion tests that consider the effect of AM surface roughness [27]. We have been evaluating the fatigue life of AM Ti6Al4V with various surface treatment methods employing the developed torsional fatigue evaluation system [27]. However, the number of evaluation points is still not enough to the comprehensive evaluation of the torsional fatigue properties for AM Ti6Al4V, and further evaluation is required.
In this paper, therefore, the mechanical surface treatment was performed using the laser treatment conditions that most improved fatigue life in previous studies [27], and the effect of high torsional loading, which had not been performed before, on fatigue life was investigated. We treated titanium alloy Ti6Al4V manufactured by direct metal laser sintering (DMLS) with LC. We investigated the effects of the surface treatment using LC on the surface characteristics, residual stress, and hardness of the AM metal, and we studied the effects on the fatigue properties by performing the torsion fatigue test.
2. Materials and Methods
2.1. Torsion Test Specimens
In this study, we prepared the torsional fatigue test specimens using Ti6Al4V, which is an AM titanium alloy, using DMLS. The DMLS process was developed by EOS GmbH of Munich, Germany, and commercial laser sintering machines have been on the market since 1995 [28]. In this procedure, a high-power CO2 laser beam is scanned and irradiated directly onto the metal powder layer without the aid of binders, sintering the particles according to a CAD file and generating a thin metal layer [29]. The atmosphere in the chamber is controlled by an inert gas, which is usually argon [30]. The mean diameter of the Ti6Al4V particles used in this study was about 40 µm. We selected the DMLS conditions based on our previous study [24,27]. The laser beam diameter, power, and scanning speed were 0.1 mm, 400 W, and 7 m/s, respectively, and the layer thickness was 60 µm [24]. We annealed the prepared specimens at 923 K for 3 hours to release the residual stresses, which we followed by vacuum solution annealing at 1208 K for 105 minutes and cooling under argon gas [24]. Finally, we vacuum-aged the specimens at 978 K for 2 hours and again cooled them under argon gas [24].
We present the geometry of the fatigue specimen determined by preliminary experiments in Figure 1. The specimen was a round bar with a neck in the center, and we performed the torsion test by gripping both ends without the neck. The minimum diameter at the center of the specimen (dmin), the diameter, and the length of the gripping area were 4.55 ± 0.05, 10 ± 0.1, and 38 ± 0.1 mm, respectively. Because the fatigue properties of AM metals strongly depend on the direction of the building material [31], we built the specimens from the bottom to the top in Figure 1 so that the building and axial directions corresponded to each other, as in the previous study [27]. To ensure that we would be able to grasp the specimens during the test, we removed any unmelted particles adhering to the gripping area of the specimens by grinding the surface with a lathe and cloth file for a few seconds.
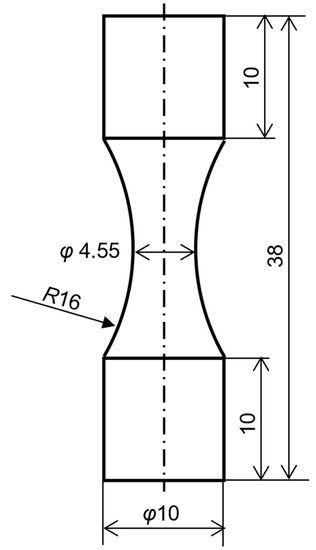
Figure 1.
Geometry of fatigue specimen (unit: mm).
2.2. LC by Pulsed Laser
We subjected the torsion specimens to surface treatment with LC. We present a schematic diagram of the LC surface treatment configuration in Figure 2. We placed the torsion specimen in a chamber made of 3 mm thick glass and that was 150 mm wide and high, and we filled it with deionized water. We held the specimen by the specimen holder and axially moved it while rotating it by two stepping motors, which enabled us to treat the entire surface of the specimen.
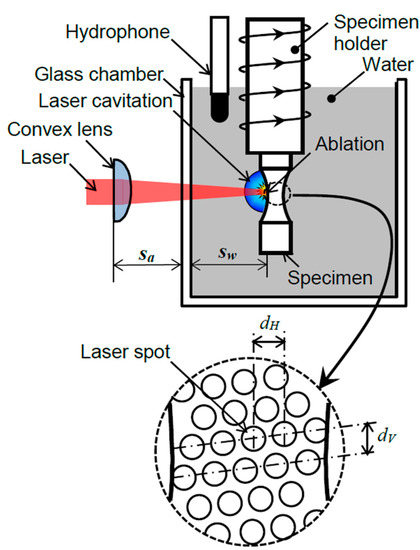
Figure 2.
Schematic diagram of mechanical surface treatment using laser cavitation.
The pulsed laser used in this study was a neodymium: yttrium–aluminum–garnet (Nd:YAG) laser with a quality switch (Q-switch). In the research on the dynamics of cavitation bubbles in water, the authors used 1064 nm to harness the heat, which is the fundamental wavelength of the Nd:YAG laser [32]. In this study, we also used a laser wavelength of 1064 nm because we used the bubbles caused by LC for the surface treatment. The maximum energy, beam diameter, pulse width, and pulse repetition frequency of the laser were 0.35 J, 6 mm, 6 ns, and 10 Hz, respectively. Note that, as shown in Figure 2, we placed the pulsed laser outside of the chamber, and we focused on the sample in the water-filled glass chamber using a convex lens with a focal distance of 100 mm. In this case, the standoff distances in air (sa) and water (sw) were 67 mm and 34 mm, respectively, and the diameter of the laser spot on the sample surface was about 0.8 mm. We continuously changed the water in the chamber at a rate of 5 L/min to remove the particles generated in it during the LC due to the ablation on the sample surface. As shown in Figure 2, we can control the laser pulse density (dL) by the horizontal spacing (dH) and vertical spacing (dV), and we can express it with the following equation [27]:
The maximum pulse density of this system was 80 pulses/mm2, which corresponds to the minimum step of the stepping motor used. Because the diameter of the laser spot on the sample surface was about 0.8 mm, the overlap ratio at this maximum pulse density was about 4000%.
In addition, we placed a hydrophone with a maximum response frequency of 100 kHz inside the chamber to measure the sound pressure waves generated in the water. At the same time, we used a high-speed camera with a frame rate of 23,000 frames/s to capture the behavior of the LC bubbles from the start of the LA to their collapse.
2.3. Torsion Fatigue Test
We present the torque-controlled torsional fatigue testing machine fabricated based on the Schenck-type load-controlled plane-bending fatigue testing machine in Figure 3 [27]. Figure 3a is a photograph of the machine and (c) is a schematic, and (b) is an attachment that enables torsional fatigue testing. Unlike the conventional displacement-controlled plane-bending fatigue testing machines on the market, this testing machine uses a custom servo motor to realize the load-controlled plane-bending fatigue testing. We performed torsional fatigue tests with both ends of the specimen fixed to an attachment. We monitored and recorded both the torsional angle (θ) and torque (Mt) during the test, and we determined that the specimen failed when the θ reached +10° or −10°. The resolutions of the recorded θ and Mt were 0.005° and 0.01 Nm, respectively. Any misalignment of the specimen caused by the DMLS process or LC was corrected by the angle of the servomotor. The test frequency of the fatigue test was 2 Hz, and we set the stress ratio (R) to −1. We calculated the applied shear stress (τa) by the following equation to evaluate the fatigue properties of the specimens [27]:
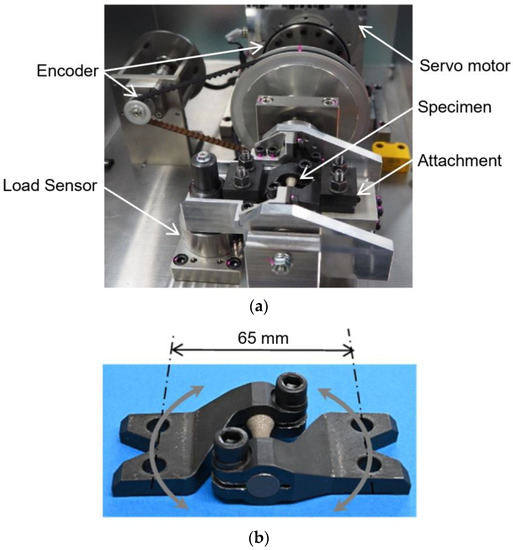
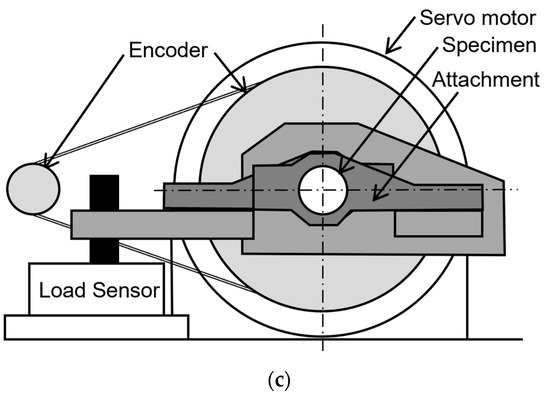
Figure 3.
Torsion fatigue testing machine: (a) photograph of the machine; (b) specimen with attachment for torsion fatigue testing; (c) schematic diagram of the machine [27].
2.4. Evaluation Methods of Surface Characteristics
We observed and evaluated the surface properties before and after the LC using a digital microscope. We measured the arithmetical mean roughness (Ra), maximum roughness height (Rz), and skewness (Rsk) three times each in different areas of 700 × 500 μm before and after the LC, and we calculated the mean values and standard deviations. We used scanning electron microscopy (SEM) to observe the surfaces before and after the LC in more detail.
We measured the residual stresses on the sample surface using the X-ray diffraction (XRD) system (Bruker Japan K. K., Tokyo, Japan) with a two-dimensional position sensitive proportional counter (2D-PSPC) and the two-dimensional (2D) method [33]. When we irradiate crystal materials with X-rays, the X-rays reflected from the crystal lattice planes are strengthened by interference and form a diffraction pattern in the form of rings called Debye rings. In the commonly used sin2ψ method [34], a one-dimensional detector is used, which can only obtain diffraction information on a small area of the Debye rings, while in the 2D method, a two-dimensional detector is used to obtain the diffraction information over a wide area, which enables highly accurate structural analyses [35]. We present the configuration of the 2D method used in this measurement in Figure 4. We narrowed the X-ray irradiation diameter using a collimator, and we controlled the X-ray incidence direction by the φ, ψ, and ω of the XRD system. For the characteristic X-ray beam, we used Cu-Kα rays (wavelength: 0.1540 Å, 40 kV, 40 mA), and the collimator diameter was 0.8 mm. The used lattice plane (h k l) was the Ti (2 1 3) plane, and the diffraction angle without strain was 139.3 degrees. We obtained the diffraction from the surface by oscillating the specimen in the ω-direction by 8 degrees during the measurement. The initial ω angle was 110 degrees. We used the relevant software (Leptos version 7.9, Bruker Japan K. K., Tokyo, Japan) for the residual stress analysis, and we set the Young’s modulus and Poisson’s ratio to 113 GPa and 0.32, respectively. We defined the analyzed area of the obtained X-ray diffraction as the range of the diffraction angle (2θ = 138–145 degrees) in which the diffraction peak of the crystal appears, and the analyzed area of the Debye ring direction (χ) is in the range of χ = 70–110 degrees. We present the measurement conditions for the 2D method in Table 1. We measured a total of 20 flames by changing the X-ray irradiation angle for each measurement. To investigate the influence of the measurement time per frame on the accuracy of the residual stress measurement, we changed the measurement time in the range of 0.5–30 min/flame. We defined the axial residual stress and circumferential residual stress on the specimen surface as σ22 and σ11, respectively. For the composition analysis before and after the surface treatment, we performed a 10-minute measurement under the following measurement conditions: φ = 0 degrees; ψ = 0 degrees; ω = 20 degrees. We obtained the one-dimensional diffraction pattern from the two-dimensional Debye rings that appeared on the 2D-PSPC.
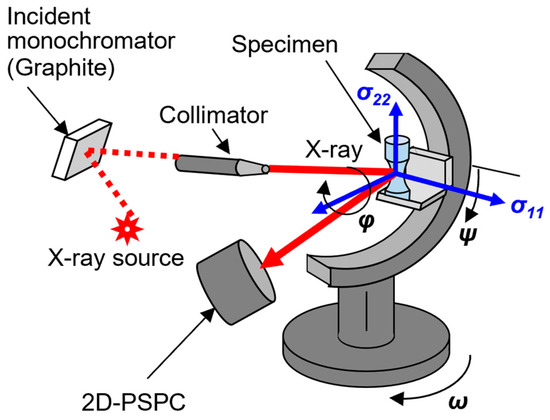
Figure 4.
Schematic diagram of XRD system.

Table 1.
Measuring conditions for 2D method.
We evaluated the Vickers hardness in the cross-sectional area of the specimen before and after the LC by an indentation tester using a Vickers indenter. We set the test load at 0.98 N. We held the specimens at the maximum load point for 10 s, and we then unloaded them. We defined the distance from the specimen surface as z. We measured the hardness in the region of z, which was less than 200 μm, three times for each z condition, and we calculated the mean value and standard deviation.
3. Results and Discussions
3.1. Surface Treatment Behavior with Submerged Laser Irradiation
We present the single-pulse laser irradiation on the sample surface observed using a high-speed video camera in Figure 5a, and we present the sound pressure wave detected using a hydrophone in Figure 5b. As shown in Figure 5, when the laser pulse impacted the sample surface at t = 0 ms, LA was generated, and the amplitude of the acoustic pressure wave increased. Subsequently, bubbles were generated, shrunk, and collapsed, and we observed LC at t = 0.83 ms, which again indicated the increase in the amplitude, which indicated that the surface treatment was also performed by the LC induced by the LA, and that it can be performed twice with a single laser irradiation. Moreover, as shown in Figure 5a, after the LC collapse, a secondary collapse occurred at t = 1.22 ms due to the rebound of the bubbles. However, according to the hydrophone amplitude measurement results for the single-pulse laser irradiation in Figure 5b, there was a large noise and no clear shockwave signal of the secondary collapse.
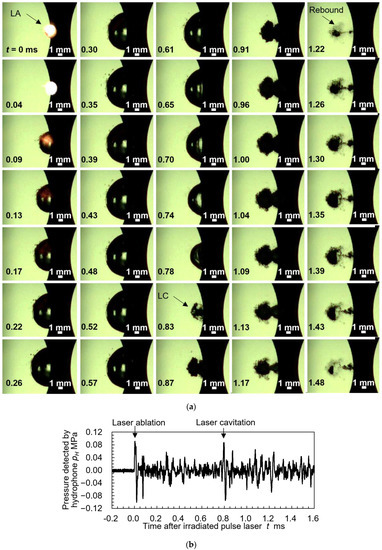
Figure 5.
Laser ablation and laser cavitation induced by single pulsed laser: (a) aspects of laser ablation and laser cavitation; (b) signal from hydrophone.
We present the amplitude of the sound pressure wave detected by the hydrophone when we continuously irradiated the laser pulse at a repetition rate of 10 Hz in Figure 6. The noise was substantially reduced compared with the sound pressure waveform of the single-pulse laser irradiation in Figure 5, which resulted in the appearance of large amplitudes due to the LA and LC at t = 0 ms and around t = 0.7 ms, respectively.
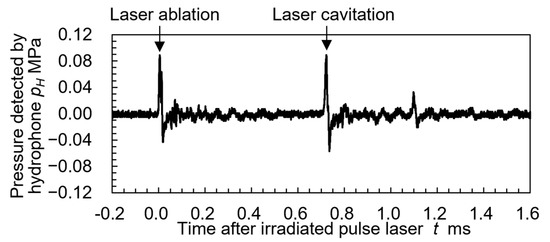
Figure 6.
Signal from hydrophone during mechanical surface treatment using pulsed laser.
The sound pressure waves due to the secondary collapse of the bubbles, which we do not see in Figure 5, appeared around t = 1.1 ms. When a bubble collapses in water, tiny bubbles, which are called residual bubbles, are generated. Soyama revealed that the residual bubbles of the vortex cavitation in a Venturi tube disappear due to pressure waves [36]. In this study, although we constantly replaced the water in the chamber with the water flow during the surface treatment, residual bubbles remained in the chamber under continuous irradiation conditions. Therefore, we considered that the residual bubbles absorbed the acoustic waves, which became noise and disappeared, which resulted in the clear acoustic pressure waveforms up to the second collapse in Figure 6.
3.2. Effect of Submerged Laser Peening on Surface Morphologies
We present the appearance of the torsion specimens before and after the surface treatment in Figure 7. For simplicity, we will refer to the as-built specimen as the non-peening (NP) sample, and we will refer to the specimen after surface treatment as the laser-peening (LP) sample. In Figure 7, we can see that the NP sample exhibits a silvery luster in the evaluation area, while the color of the LP sample changed to black. We investigate the reason for this color change in detail in Section 3.3. Moreover, as shown in Figure 7, in the residual stress measurement by 2D method, we defined the axial residual stress and circumferential residual stress on the specimen surface as σ22 and σ11, respectively. In this section, we evaluate the surface morphologies of both the NP and LP samples.
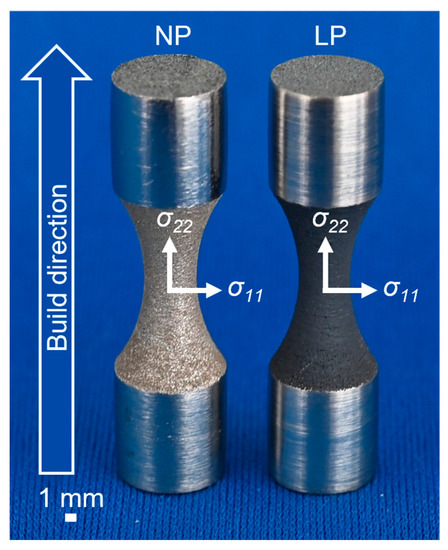
Figure 7.
Aspects of as-built and treated specimens.
We present the (a) surface of the NP sample and (b) surface of the LP sample observed with a digital microscope and SEM in Figure 8 and Figure 9. The spherical grains on the surface of the NP sample seen in Figure 8a and Figure 9a are the unmelted particles that were adhered during the AM. There was a large number of unmelted particles on the NP sample surface (Figure 8a and Figure 9a) but not on the LP sample surface (Figure 8b and Figure 9b), which could have been due to the melting of the unmelted particles by the LA and their removal by the impact during the LC collapse. Nakamura et al. also performed laser surface treatment on AM Al alloy and reported that the surface as shown in Figure 8b was obtained by melting the unmelted particles [37]. Therefore, we assumed that the submerged laser irradiation generated enough heat to melt the unmelted particles, and that the black surface of the LP was due to the oxidized film. Furthermore, in the as-built NP sample shown in Figure 8a, multiple lines can be seen perpendicular to the building direction on the base material surface to which the unmelted particles adhere. SEM observation revealed that the lines in Figure 8a are cracks, as indicated by the white arrows in Figure 9a, and that there are weak joints between the layers of the as-built AM metal, resulting in cracks between the layers. In contrast, the LP sample surface in Figure 8b and Figure 9b show that although the surface is uneven, there are no large-scale cracks. Therefore, it is clear that LP also suppresses interlaminar cracks, which are fatigue crack initiation points, by melting and solidifying the surface.
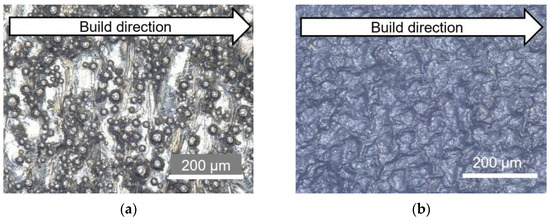
Figure 8.
Aspects of specimen surfaces observed by digital microscope: (a) as-built specimen; (b) specimen treated with laser cavitation.
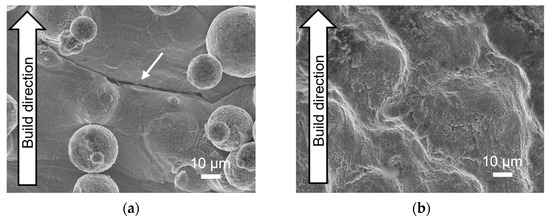
Figure 9.
Aspects of specimen surfaces observed by scanning electron microscope: (a) as-built specimen; (b) specimen treated with laser cavitation.
To quantify the morphological characteristics of each observed surface, we evaluated three types of surface roughness using a digital microscope. We present the difference between the maximum and minimum values of the roughness curve (Rz) in Figure 10a, the mean height of the reference area (Ra) in Figure 10b, and the parameter that expresses the symmetry of the peaks and valleys when the mean plane is the center (Rsk) in Figure 10c. Each bar represents the average roughness measured in the three different regions, and the error bars are the standard deviations. According to Figure 10a, the Rz of the NP sample is about 40 μm higher than that of the LP sample. The diameter of the Ti6Al4V particles used for the AM was approximately 40 μm, which indicates that the height of the unmelted particles in the LP sample was reduced due to the melting or removal of the unmelted particles by the effects of the LA and LC. In addition, the Ra and Rz decreased with the melting and/or removal of the unmelted particles (Figure 10b). Similar to our report, surface treatment with laser on AM Ti6Al4V has been reported to reduce surface roughness [38]. Thus, the entire roughness of the LP sample was uniformly reduced compared with that of the NP sample. Finally, the NP and LP samples both had a Rsk > 0 (Figure 10c), which indicates that the morphological characteristics were completely different. In the case of the NP, the Rsk was positive, and the surface had many fine peaks, as shown in Figure 8 and Figure 9. In contrast, the unmelted particles were melted and smoothed by the LA, and the impact from the LC collapse formed many deep valleys, which was the reason for the negative Rsk value in the LP sample.
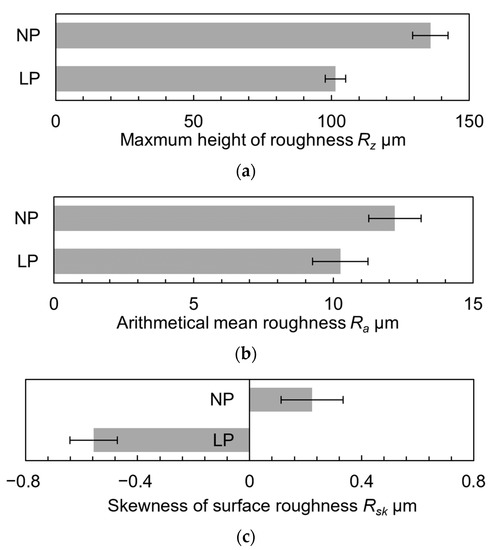
Figure 10.
Surface roughness: (a) maximum heights of roughness profiles: Rz; (b) arithmetical mean roughness: Ra; (c) skewness of surface roughness: Rsk.
3.3. Residual Stress Evaluation by 2D Method and Composition Effect on Vickers Hardness
We evaluated the residual stresses on the NP and LP surfaces, the surface topographies of which we evaluate in Section 3.2, using the 2D method. To investigate the effect of the measurement time on the measurement accuracy, we varied the measurement time per frame from 0.5 to 30 minutes. As described in Section 2.4, we measured 20 frames at different X-ray incident angles in one measurement. We present the measured residual stresses on the sample surfaces with (a) the average residual stress and standard deviation error bars and (b) only the standard deviation in Figure 11. In the figure, we indicate the NP and LP samples by the red and purple markers, respectively. We indicate the residual stress (σ11) in the circumferential direction of the sample by the filled marker, and we indicate the residual stress (σ22) in the axial direction, which is the direction of the AM building, by the hollow marker. First, we considered the effect of the measurement time on the accuracy of the residual stress. As shown in Figure 11a,b, we measured the average residual stresses, which ranged from −90 to 70 MPa, when the measurement time per frame was 0.5 min; however, the standard deviation was 50–90 Mpa, which was not a high accuracy. In particular, for the NP sample, the σ11 was higher than the σ22 when the measurement time per frame was 1 min or longer, while the σ22 was higher than the σ11 when the measurement time per frame was 0.5 min. Therefore, when the measurement time was short, we could not sufficiently obtain the diffraction information from the sample surface, which resulted in inaccurate output values. However, we increased the average residual stress and standard deviation saturated as the measurement time, and we obtained stable measurement results when the measurement time per frame was longer than 5 min. Therefore, in a comparison of the residual stresses at a measurement time of 5 min per frame, the NP sample had tensile residual stresses of 182.8 ± 9.4 Mpa for the σ11 and 85.1 ± 11.3 Mpa for the σ22, while the LP sample had compressive residual stresses of −80.7 ± 7.3 Mpa for the σ11 and −87.5 ± 8.8 Mpa for the σ22. Several reports have shown that laser surface treatment of AM Al alloys introduces compressive residual stresses similar to those reported by us [37,38,39]. The main reason for the residual stress in the DMLS process is heat cycling, during which the previously solidified layers are repeatedly remelted and cooled with a certain amount of heat as the laser scans each layer [40]. Tensile stress due to thermal expansion acts on the tops of the layers in the planar direction of the built material, and the compressive stress due to cooling acts on the bottoms, which creates a stress gradient between the layers due to the repeated thermal expansion and contraction during the building [41,42]. For this reason, a large amount of tensile stress was introduced in both directions in the NP sample, whereas in the LP sample, similar compressive stresses were introduced in both directions for the σ11 and σ22. In the as-built NP sample, the magnitude of stress in the σ11 and σ22 varied depending on the thickness and number of the layers, which resulted in different values. In the case of the LP sample, the surface was uniformly irradiated by the laser, which may have relaxed the stress gradient between the layers. In addition, the introduction of compressive stress due to the LA impact and surface melting and solidification, as well as the introduction of the impact force generated by the bubble collapse of the LC on the surface, introduced high compressive stress on the LP sample.
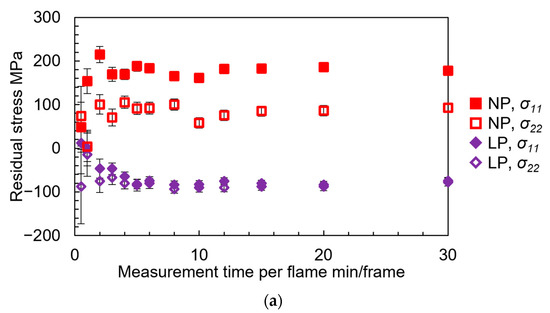
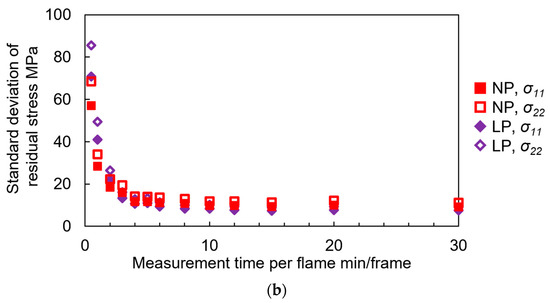
Figure 11.
Residual stress of surface. (a) the average residual stress and standard deviation error bars; (b) only the standard deviation of (a).
We present the XRD analysis results of the NP and LP sample surfaces and the relationship between the Vickers hardness (HV) of the cross section and the distance (z) from the surface in Figure 12 and Figure 13, respectively. We present the 2D X-ray diffraction patterns obtained from the surfaces of the NP and LP samples in Figure 12a,b, respectively. As shown in the figure, the NP sample has spot-like Debye rings, while the LP sample has smooth Debye rings. We obtained smooth Debye rings as the number of crystals increased, which indicated that the surface crystals were refined by the impact of the LP. We obtained the one-dimensional (1D) X-ray diffraction patterns in Figure 12c by integrating the diffraction intensities at 2θ (from 25 to 55 degrees) in the χ direction (from −96 to −84 degrees) of the 2D X-ray diffraction patterns in Figure 12a,b, respectively. Ti and Ti4O5 markers in Figure 12c are the results of XRD diffraction peaks analysis using powder diffraction file (PDF) cards, with Ti corresponding to PDF 00-005-0682 and PDF 00-009-0098 and Ti4O5 corresponding to PDF 01-078-5811. The diffraction peak of the Ti4O5, an oxide of Ti, which we did not detect on the NP sample, appeared on the surface of the LP sample (Figure 12c). Therefore, the black surface formed by LP is an oxide film. Researchers formed a similar oxide film during the laser peening of Ti6Al4V in water, and according to the time-of-flight secondary ion mass spectrometry (TOF-SIMS) analysis, the oxide film was formed by the inward diffusion of oxygen [43]. The LP sample was harder than the NP sample at z < 80 μm, and the hardness of the LP sample increased by about 106% on average in the region of z < 60 μm (Figure 13). The strain-hardening exponent of Ti6Al4V was 0.048, which is small compared with the 0.5 for pure titanium [44]. In fact, no subsurface work hardening occurs when the Ti6Al4V material is surface-treated by shot peening, and no hardening due to physical impact occurs [45]. However, the oxygen-rich oxide film formed on the LP sample surface due to the inward diffusion of oxygen became harder than the substrate Ti6Al4V material [46]. Therefore, the subsurface hardening seen in Figure 13 was not due to work hardening by the LA or LC impact, but to the formation of a black oxide film. In other words, LC, which is a type of mechanical alloying that treats surfaces while causing local melting, is also effective at hardening the surfaces of materials that do not undergo work hardening.
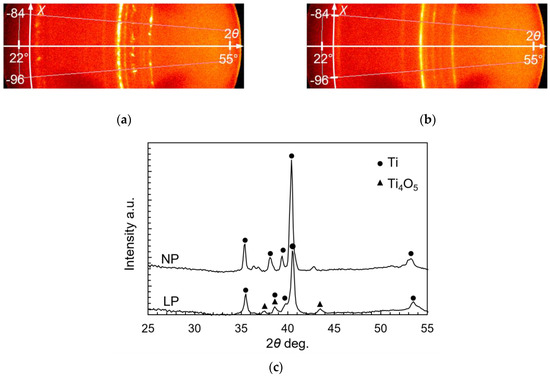
Figure 12.
(a) 2D X-ray diffraction pattern of NP sample surface; (b) 2D X-ray diffraction pattern of LP sample surface; (c) 1D X-ray diffraction patterns from (a,b).
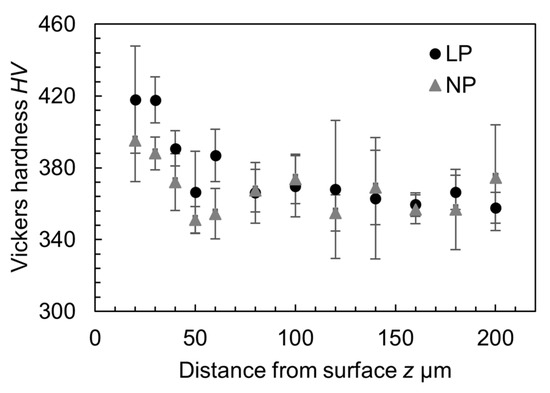
Figure 13.
Hardness of cross-sectional area.
3.4. Improvement of Fatigue Life by Laser Cavitation
We present the results of the torque-controlled torsional fatigue tests for the NP and LP samples at τa = 460 MPa, showing the applied stress as a function of the number of cycles to fatigue (S–N curves), in Figure 14. For comparison, we present the same torsional fatigue test results for various surface treatment conditions and for different τa values [27] from previous fatigue test results. Table 2 shows the sample names and mechanical surface treatment conditions in Figure 14. “NP” is the untreated specimen (same condition as NP sample), “SP” stands for shot peening, “CP” stands for water cavitation jet, and “LP” stands for submerged laser cavitation peening (same condition as LP sample). The following surface treatment conditions for the SP, CP, and LP were the optimum conditions: processing time per unit length (tp): 5 s/mm; tp: 4 s/mm; dL: 80 pulse/mm2; stress ratio (R): −1. Additionally, we indicated the direction of the macrocracks formed by the torsional fatigue test perpendicular to the specimen axis with the filled marker, and we indicated the macrocracks formed at an angle of 45° to the specimen axis with the hollow marker. In this study, three torsional fatigue tests were performed on the NP sample at τa = 460 MPa. The fatigue lives of the NP samples were 19,791, 20,963, and 23,842 cycles, respectively, with a mean value of 21,532 cycles and a standard deviation of 9.7%. In contrast, the fatigue life of the LP sample at τa = 460 MPa was 36,288 cycles, which indicated that the fatigue life of the AM Ti6Al4 was about 1.7 times longer than that of the NP sample, and that the fatigue properties of the AM Ti6Al4 were improved. The results of the NP and LP samples in this test are reasonable because they are almost an extension of the previous results of the as-built and CP by laser samples. Furthermore, in many cases, the fatigue properties of AM Ti6Al4V are affected by the surface roughness and hardness [13,14,15,47,48]. Therefore, LP acts as a type of surface mechanical alloying, and the fatigue life is improved mainly due to the melting and removal of the unmelted particles, which tend to be the starting point of fatigue cracks, and to the increase in the surface hardness by the oxide film.
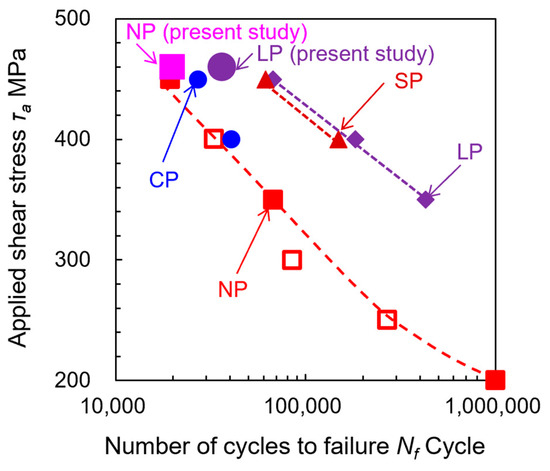
Figure 14.
Comparison of fatigue life at τa = 460 MPa under previous test conditions [27].
Table 2.
Sample names and mechanical surface treatment conditions in Figure 14.
We present the relationship between the amplitude of the torsion angle (θ) and the number of cycles during the fatigue tests at τa = 460 MPa to investigate the mechanism of the improvement in the fatigue properties by the LP sample in Figure 15. We normalized the amplitude of the torsion angle based on its initial amplitude, which was 2.59° for the NP sample and 2.71° for the LP sample. In this figure, two lines are plotted for each sample, one line is the result of the normalized amplitude of angle when τa is added, and the other line is the result of when −τa is added. The torsional angle of the specimen increased with the increasing number of cycles (Figure 15). This increase in the torsional angle indicated crack propagation. In the NP sample, the torsional angle continued to increase with the number of cycles, and the crack began to rapidly propagate at about 15,000 cycles. In contrast, the torsional angle of the LP sample increased more slowly than that of the NP sample, and the crack rapidly propagated from about 30,000 cycles. Therefore, the LP sample was more effective at suppressing crack initiation than crack propagation.

Figure 15.
Torsion angle as function of number of cycles at τa = 460 MPa.
Figure 16 shows SEM images of the fractured surfaces of the specimens after torsional fatigue testing, (a) NP specimen and (b) the LP specimen. In each figure, the crack initiation points are indicated by white arrows. Fatigue cracks in the NP specimen in Figure 16a initiated from unmelted particles as in past reports [12,13,14], while fatigue cracks in the LP specimen were caused by stress concentration at the surface concavity (Figure 16b). Therefore, LP can suppress the typical fatigue crack initiation originating from unmelted particles in as-built AM Ti6Al4V. Furthermore, it is suggested that if a surface with less irregularity can be fabricated by LP, it will contribute to further improvement of fatigue life.
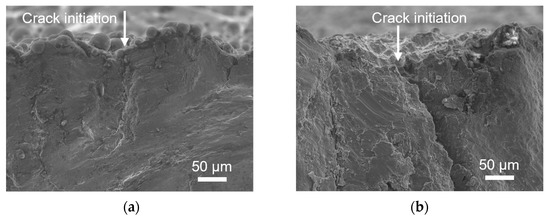
Figure 16.
Fractured surfaces observed using scanning electron microscope: (a) as-built specimen; (b) specimen treated with laser cavitation.
4. Conclusions
To investigate the effect of submerged laser cavitation peening (LP) on the fatigue properties of the additive manufactured (AM) titanium alloy Ti6Al4V, we performed torsional fatigue tests on as-built Ti6Al4V specimens fabricated using direct metal laser sintering (DMLS) and surface-treated with LP. The testing machine for this study was a modified load-controlled plane-bending fatigue testing machine that we fitted with an attachment for the torsion testing. In addition, we corrected the machine for misalignment due to DMLS and LP. We summarize the findings of this study as follows:
- (1)
- LP extends the fatigue life of AM Ti6Al4V, as indicated by the results of the torsional fatigue tests. The main reasons are the introduction of compressive residual stress and surface hardening. At τa = 460 MPa, the surface treatment with LP can extend the fatigue life of AM Ti6Al4V by 1.7 times. Furthermore, the LP was more effective at suppressing crack initiation than crack propagation;
- (2)
- In the residual stress measurement by the 2D method, the measurement time per frame affected the accuracy of the residual stress, which improved when the time per frame was more than 5 min/frame. The tensile residual stresses of σ11 = 182.8 ± 9.4 MPa in the circumferential direction and σ22 = 85.1 ± 11.3 MPa in the axial direction were changed to compressive residual stresses of σ11 = −80.7 ± 7.3 MPa and σ22 = −87.5 ± 8.8 MPa in the axial direction by the LP;
- (3)
- The Vickers hardness (HV) in the region below 60 μm from the surface was increased by about 106% on average by the LP. We attributed this increase in the hardness to the oxide film Ti4O5 formed by the thermal effect of the LP;
- (4)
- The LP acted as a mechanical alloying technique, melting and removing the remaining unmelted particles on the as-built Ti6Al4V specimens, and substantially reducing the surface roughness, which causes fatigue cracking.
Author Contributions
Conceptualization, C.K. and H.S.; methodology, H.S.; investigation, C.K. and H.S.; resources, H.S.; data curation, H.S.; writing—original draft preparation, C.K.; writing—review and editing, H.S.; visualization, C.K.; supervision, H.S.; project administration, H.S.; funding acquisition, H.S. All authors have read and agreed to the published version of the manuscript.
Funding
This work was partly supported by JSPS KAKENHI, grant numbers 20H02021 and 22KK0050, and by The Amada Foundation, AF-2021219-B3.
Data Availability Statement
The data presented in this study are available upon request from the authors.
Conflicts of Interest
The authors declare no conflict of interest.
References
- Abdulhameed, O.; Al-Ahmari, A.; Ameen, W.; Mian, S.H. Additive Manufacturing: Challenges, Trends, and Applications. Adv. Mech. Eng. 2019, 11, 1–27. [Google Scholar] [CrossRef]
- Alipour, S.; Nour, S.; Attari, S.M.; Mohajeri, M.; Kianersi, S.; Taromian, F.; Khalkhali, M.; Aninwene, G.E.; Tayebi, L. A Review on in Vitro/in Vivo Response of Additively Manufactured Ti-6Al-4V Alloy. J. Mater. Chem. B 2022, 10, 9479–9534. [Google Scholar] [CrossRef]
- Zhang, L.C.; Chen, L.Y. A Review on Biomedical Titanium Alloys: Recent Progress and Prospect. Adv. Eng. Mater. 2019, 21, 1801215. [Google Scholar] [CrossRef]
- Ghods, S.; Schur, R.; Montelione, A.; Schleusener, R.; Arola, D.D.; Ramulu, M. Importance of Build Design Parameters to the Fatigue Strength of Ti6Al4V in Electron Beam Melting Additive Manufacturing. Materials 2022, 15, 5617. [Google Scholar] [CrossRef]
- Nianwei, D.; Junxi, Z.; Yang, C.; Lai-Chang, Z. Heat Treatment Degrading the Corrosion Resistance of Selective Laser Melted Ti-6Al-4V Alloy. J. Electrochem. Soc. 2017, 164, C428. [Google Scholar] [CrossRef]
- Hollander, D.A.; von Walter, M.; Wirtz, T.; Sellei, R.; Schmidt-Rohlfing, B.; Paar, O.; Erli, H.J. Structural, Mechanical and in vitro Characterization of Individually Structured Ti-6Al-4V Produced by Direct Laser Forming. Biomaterials 2006, 27, 955–963. [Google Scholar] [CrossRef]
- Walker, K.F.; Liu, Q.; Brandt, M. Evaluation of Fatigue Crack Propagation Behaviour in Ti-6Al-4V Manufactured by Selective Laser Melting. Int. J. Fatigue 2017, 104, 302–308. [Google Scholar] [CrossRef]
- Fatemi, A.; Molaei, R.; Sharifimehr, S.; Phan, N.; Shamsaei, N. Multiaxial Fatigue Behavior of Wrought and Additive Manufactured Ti-6Al-4V Including Surface Finish Effect. Int. J. Fatigue 2017, 100, 347–366. [Google Scholar] [CrossRef]
- Tong, J.; Bowen, C.R.; Persson, J.; Plummer, A. Mechanical Properties of Titanium-based Ti-6Al-4V Alloys Manufactured by Powder Bed Additive Manufacture. Mater. Sci. Technol. 2017, 33, 138–148. [Google Scholar] [CrossRef]
- Zhang, H.Y.; Dong, D.K.; Su, S.P.; Chen, A. Experimental Study of Effect of Post Processing on Fracture Toughness and Fatigue Crack Growth Performance of Selective Laser Melting Ti-6Al-4V. Chin. J. Aeronaut. 2019, 32, 2383–2393. [Google Scholar] [CrossRef]
- Molaei, R.; Fatemi, A.; Sanaei, N.; Pegues, J.; Shamsaei, N.; Shao, S.; Li, P.; Warner, D.H.; Phan, N. Fatigue of Additive Manufactured Ti-6Al-4V, Part II: The Relationship between Microstructure, Material Cyclic Properties, and Component Performance. Int. J. Fatigue 2020, 132, 105363. [Google Scholar] [CrossRef]
- Pegues, J.W.; Shao, S.; Shamsaei, N.; Sanaei, N.; Fatemi, A.; Warner, D.H.; Li, P.; Phan, N. Fatigue of Additive Manufactured Ti-6Al-4V, Part I: The Effects of Powder Feedstock, Manufacturing, and Post-process Conditions on the Resulting Microstructure and Defects. Int. J. Fatigue 2020, 132, 105358. [Google Scholar] [CrossRef]
- Wang, P.; Sin, W.J.; Nai, M.L.S.; Wei, J. Effects of Processing Parameters on Surface Roughness of Additive Manufactured Ti-6Al-4V via Electron Beam Melting. Materials 2017, 10, 1121. [Google Scholar] [CrossRef]
- Gunther, J.; Leuders, S.; Koppa, P.; Troster, T.; Henkel, S.; Biermann, H.; Niendorf, T. On the Effect of Internal Channels and Surface Roughness on the High-cycle Fatigue Performance of Ti-6Al-4V Processed by SLM. Mater. Des. 2018, 143, 1–11. [Google Scholar] [CrossRef]
- Kahlin, M.; Ansell, H.; Moverare, J.J. Fatigue Behaviour of Notched Additive Manufactured Ti6Al4V with As-built Surfaces. Int. J. Fatigue 2017, 101, 51–60. [Google Scholar] [CrossRef]
- Soyama, H. Laser Cavitation Peening and Its Application for Improving the Fatigue Strength of Welded Parts. Metals 2021, 11, 531. [Google Scholar] [CrossRef]
- Soyama, H. Cavitation Peening: A Review. Metals 2020, 10, 270. [Google Scholar] [CrossRef]
- Soyama, H.; Korsunsky, A.M. A critical Comparative Review of Cavitation Peening and Other Surface Peening Methods. J. Mater. Process. Technol. 2022, 305, 117586. [Google Scholar] [CrossRef]
- Sano, Y.; Obata, M.; Kubo, T.; Mukai, N.; Yoda, M.; Masaki, K.; Ochi, Y. Retardation of Crack Initiation and Growth in Austenitic Stainless Steels by Laser Peening Without Protective Coating. Mater. Sci. Eng. A-Struct. Mater. Prop. Microstruct. Process. 2006, 417, 334–340. [Google Scholar] [CrossRef]
- Sano, Y. Quarter Century Development of Laser Peening without Coating. Metals 2020, 10, 152. [Google Scholar] [CrossRef]
- Gu, J.Y.; Luo, C.H.; Ma, P.C.A.; Xu, X.C.; Wu, Y.; Ren, X.D. Study on Processing and Strengthening Mechanisms of Mild Steel Subjected to Laser Cavitation Peening. Appl. Surf. Sci. 2021, 562, 150242. [Google Scholar] [CrossRef]
- Sasoh, A.; Watanabe, K.; Sano, Y.; Mukai, N. Behavior of Bubbles Induced by the Interaction of a Laser Pulse with a Metal Plate in Water. Appl. Phys. A-Mater. 2005, 80, 1497–1500. [Google Scholar] [CrossRef]
- Sano, Y.; Akita, K.; Sano, T. A Mechanism for Inducing Compressive Residual Stresses on a Surface by Laser Peening without Coating. Metals 2020, 10, 816. [Google Scholar] [CrossRef]
- Soyama, H.; Takeo, F. Effect of Various Peening Methods on the Fatigue Properties of Titanium Alloy Ti6Al4V Manufactured by Direct Metal Laser Sintering and Electron Beam Melting. Materials 2020, 13, 2216. [Google Scholar] [CrossRef]
- Nicholas, G.; Ali, F. Notched Fatigue Behavior and Stress Analysis Under Multiaxial States of Stress. Int. J. Fatigue 2014, 67, 2–14. [Google Scholar] [CrossRef]
- Berto, F.; Campagnolo, A.; Lazzarin, P. Fatigue Strength of Severely Notched Specimens Made of Ti-6Al-4V Under Multiaxial Loading. Fatigue Fract. Eng. Mater. Struct. 2015, 38, 503–517. [Google Scholar] [CrossRef]
- Soyama, H.; Kuji, C. Improving Effects of Cavitation Peening, Using a Pulsed Laser or a Cavitating Jet, and Shot Peening on the Fatigue Properties of Additively Manufactured Titanium Alloy Ti6Al4V. Surf. Coat. Technol. 2022, 451, 129047. [Google Scholar] [CrossRef]
- Khaing, M.W.; Fuh, J.Y.H.; Lu, L. Direct Metal Laser Sintering for Rapid Tooling: Processing and Characterisation of EOS Parts. J. Mater. Process. Technol. 2001, 113, 269–272. [Google Scholar] [CrossRef]
- Shibli, J.A.; Mangano, C.; Mangano, F.; Rodrigues, J.A.; Cassoni, A.; Bechara, K.; Ferreia, J.D.B.; Dottore, A.M.; Iezzi, G.; Piattelli, A. Bone-to-Implant Contact Around Immediately Loaded Direct Laser Metal-Forming Transitional Implants in Human Posterior Maxilla. J. Periodontol. 2013, 84, 732–737. [Google Scholar] [CrossRef]
- Gregolin, R.F. Development and Mechanical Characterization of a Mandibular Prosthesis in Titanium Alloy Fabricated by Direct Metal Laser Sintering (DMLS). In Proceedings of the 22nd International Congress of Mechanical Engineering (COBEM 2013), Ribeirão Preto, SP, Brazil, 3–7 November 2013. [Google Scholar]
- Theo, P.; Alexis, B.; Guilhem, M.; Jean-Yves, B.; Remy, D.; Eric, M. Effect of Build Orientation on the Fatigue Properties of As-built Electron Beam Melted Ti-6Al-4V Alloy. Int. J. Fatigue 2019, 118, 65–76. [Google Scholar] [CrossRef]
- Philipp, A.; Lauterborn, W. Cavitation Erosion by Single Laser-Produced Bubbles. J. Fluid Mech. 1998, 361, 75–116. [Google Scholar] [CrossRef]
- He, B.B. Two-Dimensional X-ray Diffraction; John Wiley & Sons, Inc.: Hoboken, NJ, USA, 2009; pp. 249–328. [Google Scholar]
- JSMS Committee on X-ray Study on Mechanical Behavior of Material. Standard Method for X-ray Stress Measurement; The Society of Materials Science: Kyoto, Japan, 2005; pp. 1–21. [Google Scholar]
- Soyama, H.; Kuji, C.; Kuriyagawa, T.; Chighizola, C.R.; Hill, M.R. Optimization of Residual Stress Measurement Conditions for a 2D Method Using X-ray Diffraction and Its Application for Stainless Steel Treated by Laser Cavitation Peening. Materials 2021, 14, 2772. [Google Scholar] [CrossRef]
- Soyama, H. Luminescence Intensity of Vortex Cavitation in a Venturi Tube Changing with Cavitation Number. Ultrason. Sonochem. 2021, 71, 105389. [Google Scholar] [CrossRef]
- Nakamura, M.; Takahashi, K.; Saito, Y. Effect of Shot and Laser Peening on Fatigue Strength of Additively Manufactured Aluminum Alloy with Rough Surfaces. J. Mater. Eng. Perform. 2022, 28, 3835–3843. [Google Scholar] [CrossRef]
- Aguado-Montero, S.; Navarro, C.; Vazquez, J.; Lasagni, F.; Slawik, S.; Dominguez, J. Fatigue Behaviour of PBF Additive Manufactured TI6AL4V Alloy After Shot and Laser Peening. Int. J. Fatigue 2022, 154, 106536. [Google Scholar] [CrossRef]
- Navarro, C.; Vazquez, J.; Dominguez, J.; Perinan, A.; Garcia, M.H.; Lasagni, F.; Bernarding, S.; Slawik, S.; Mucklich, F.; Boby, F.; et al. Effect of Surface Treatment on the Fatigue Strength of Additive Manufactured Ti6Al4V Alloy. Frat. Ed Integrita. Strutt. 2020, 53, 337–344. [Google Scholar] [CrossRef]
- Patterson, A.E.; Messimer, S.L.; Farrington, P.A. Overhanging Features and the SLM/DMLS Residual Stresses Problem: Review and Future Research Need. Technologies 2017, 5, 15. [Google Scholar] [CrossRef]
- Knowles, C.R.; Becker, T.H.; Tait, R.B. Residual Stress Measurements and Structural Integrity Implications for Selective Laser Melted TI-6AL-4V. S. Afr. J. Ind. Eng. 2012, 23, 119–129. [Google Scholar] [CrossRef]
- Mercelis, P.; Kruth, J.P. Residual Stresses in Selective Laser Sintering and Selective Laser Melting. Rapid Prototyp. J. 2006, 12, 254–265. [Google Scholar] [CrossRef]
- Crespo, L.; Hierro-Oliva, M.; Barriuso, S.; Vadillo-Rodriguez, V.; Montealegre, M.A.; Saldana, L.; Gomez-Barrena, E.; Gonzalez-Carrasco, J.L.; Gonzalez-Martin, M.L.; Vilaboa, N. On the Interactions of Human Bone Cells with Ti6Al4V Thermally Oxidized by Means of Laser Shock Processing. Biomed. Mater. 2016, 11, 015009. [Google Scholar] [CrossRef]
- Boller, C.; Seeger, T. Materials Data for Cyclic Loading. Part. D: Aluminium and Titanium Alloys; Materials Science Monograph, 42D; Elsevier: Amsterdam, The Netherlands, 1987; p. 127. [Google Scholar]
- Multigner, M.; Frutos, E.; Mera, C.L.; Chao, J.; Gonzalez-Carrasco, J.L. Interrogations on the Sub-surface Strain Hardening of Grit Blasted Ti-6Al-4V Alloy. Surf. Coat. Technol. 2009, 203, 2036–2040. [Google Scholar] [CrossRef]
- Lieblich, M.; Barriuso, S.; Multigner, M.; Gonzalez-Doncel, G.; Gonzalez-Carrasco, J.L. Thermal Oxidation of Medical Ti6Al4V Blasted with Ceramic Particles: Effects on the Microstructure, Residual Stresses and Mechanical Properties. J. Mech. Behav. Biomed. Mater. 2016, 54, 173–184. [Google Scholar] [CrossRef]
- Bagehorn, S.; Wehr, J.; Maier, H.J. Application of Mechanical Surface Finishing Processes for Roughness Reduction and Fatigue Improvement of Additively Manufactured Ti-6Al-4V Parts. Int. J. Fatigue 2017, 102, 135–142. [Google Scholar] [CrossRef]
- Sanders, D.; Soyama, H.; de Silva, C. Use of Cavitation Abrasive Surface Finishing to Improve the Fatigue Properties of Additive Manufactured Titanium Alloy Ti6Al4V. SAE Tech. Pap. 2021, 2001. [Google Scholar] [CrossRef]


Disclaimer/Publisher’s Note: The statements, opinions and data contained in all publications are solely those of the individual author(s) and contributor(s) and not of MDPI and/or the editor(s). MDPI and/or the editor(s) disclaim responsibility for any injury to people or property resulting from any ideas, methods, instructions or products referred to in the content. |
© 2023 by the authors. Licensee MDPI, Basel, Switzerland. This article is an open access article distributed under the terms and conditions of the Creative Commons Attribution (CC BY) license (https://creativecommons.org/licenses/by/4.0/).