Article

Design Optimization and Finite Element Model Validation of LPBF-Printed Lattice-Structured Beams

1
School of Engineering, Swinburne University of Technology, Hawthorn, VIC 3122, Australia
2
DMTC Ltd., Hawthorn, VIC 3122, Australia
*
Author to whom correspondence should be addressed.
Metals 2023, 13(2), 184; https://doi.org/10.3390/met13020184
Submission received: 16 November 2022 / Revised: 10 January 2023 / Accepted: 12 January 2023 / Published: 17 January 2023
(This article belongs to the Special Issue Selective Laser Melting: State-of-the-Art 2022)

Abstract

:
The laser powder bed fusion (LPBF) method, more commonly known as selective laser melting (SLM), is one of the most common metal additive manufacturing (AM) processes. It is a layer-by-layer fabrication process where each powder layer is melted and fused by a laser beam, which traverses over the designated part geometry cross-section, as defined by a sliced CAD model. The LPBF process is being popularly used to manufacture end products of intricate geometry for various industries, such as the automobile, aerospace, defence, and biomedical industries. In designing parts, the topology optimisation (TO) technique can be effectively employed to optimise the distribution of material throughout the part and obtain the minimum volume/weight without compromising the mechanical performance of the component. This study focusses on the design optimisation and validation of the optimisation approaches used for LPBF-printed AlSi12 metal parts. The mechanical performance of three different topologically optimised lattice beams, viz. 1 × 1, 8 × 3, and 12 × 3, printed using the LPBF process, was investigated. When the beams were tested in bending, it was found that these TO LPBF-printed beams behaved differently when compared to the LPBF-printed solid beam. The 1 × 1 lattice beam performed better than the other two lattice beams due to the lower number of links where premature failure was delayed. The 1 × 1 lattice beam exhibited a load-bearing capacity of 17 ± 2 kN, whereas the 8 × 3 and 12 × 3 lattice beams showed load capacities of 13 ± 1 kN and 10 ± 1 kN, respectively. This mechanical behaviour was modelled and simulated by using a finite element analysis, and it was found that the LPBF-printed material property was affected by the design elements present in the beam. It was also found that each topology-optimised beam fits a different material model when compared to the SLM-printed solid beam. Therefore, a new material model or simulation technique needs to be developed to overcome this issue.

1. Introduction

The automobile and aerospace industries develop and implement enhanced technologies and techniques that can result in an improvement in component performance, along with a reduction in weight. Topology optimisation (TO) is one such design solution which mathematically solves for optimal material distribution within the required design domain under a set of constraints [1], ideally generating components with desired functionalities. Moreover, design-optimised parts can also significantly lower the part-production costs [2]. Out of the several TO techniques, Solid Isotropic Material with Penalization (SIMP) and Bidirectional Evolutionary Structural Optimisation (BESO) are widely popular in generating designs that are suitable for practical applications [3,4,5].
The SIMP technique considers element density as a variable, and based on the stiffness values, it assigns relative densities to each element [6,7]. The solution from a SIMP optimisation algorithm yields intermediate relative densities between 0 and 1, which are difficult to manufacture without converting the intermediate density regions into solid regions. This approach has been embedded in commercial software such as TOSCA for ABAQUS [8], GTAM for ANSYS [9], and Inspire for Altair Hyperworks [10]. Most commercial software uses iso-surfacing techniques to convert the intermediate density elements (having relative densities between 0 and 1) into solid elements (relative density of 1), which would slightly increase the volume of the material in a topology-optimised design.
On the other hand, BESO method considers elemental densities as design variables for structural optimisation but only assigns elemental densities with discrete values, 0 or 1 [11,12]. As a result, the design solution from a BESO algorithm consists of void or solid elements. This approach is more suited to additive manufacturing (AM) techniques. AM is defined as ‘a process to make parts from 3D model data, usually layer upon layer, as opposed to subtractive manufacturing and formative manufacturing methodologies’ [13]. AM provides an opportunity for various industries, especially automotive and aerospace, to redesign and redevelop their structural and non-structural components with reduced weight and desired functionalities [14].
Lattice structures are an ideal weight-reducing solution which have been widely studied. As per ISO/ASTM 52900, lattice structures are defined as ‘geometric arrangement composed of connective links between vertices (points) creating a functional structure’ [13]. Structural members consisting of repetitive lattice units have been found to have better structural properties [15,16] and would find application in various industries [17,18]. Moreover, there is a need to incorporate lattice units which are optimised to undertake loads pertaining to specific design problems. Moreover, there is commercial software such as nTopology [19] and Autodesk Netfabb [20] that have successfully incorporated lattice design optimisation.
Topology-optimised complex designs have been successfully manufactured by using plastic 3D printing and have performed as per design requirements [21,22,23]. Most studies have been directed towards manufacturing TO design products with plastics-based AM processes such as Fused Deposition Modelling (FDM) and Selective Laser Printing (SLS). Very limited studies have been undertaken to apply methods to couple TO designs with a metal-additive technique such as Selective Laser Melting (SLM) [24]. SLM (LPBF) is a metal-powder-bed additive manufacturing technique wherein the powder is melted with the help of laser source and is solidified quickly in an inert atmosphere. With precise control over the melting of the metal powder, the LPBF can fabricate complex topology-optimised parts with high dimensional accuracy [25]. The TO design algorithm considers the material property as an input to generate designs, which can then be manufactured by the AM process.
This paper presents a comprehensive investigation on generating topology-optimised beams for three-point flexural (bending) testing, using lattice units, and subsequently comparing the flexural properties of topology-optimised LPBF-printed beams with the LPBF-printed solid beam. There were two primary objectives of this study. The first was to use the BESO-topology-optimisation tool to generate optimised lattice structures with repetitive unit cell arrangement and to compare their mechanical performance in terms of bending strength with that of a solid beam. A modified BESO-topology optimisation algorithm is used to generate two repetitive lattice units within the design region of the beam. The solid and topology-optimised beams were printed by using the LPBF process, with the machine-specified processing parameters. It was observed that topology-optimised beams absorbed seven times more energy per unit volume till the displacement of maximum bending load, as compared to the solid beam at the same displacement.
The second primary objective was to evaluate the material properties of the LPBF-printed solid beam and assess its application to simulate the mechanical performance of LPBF-printed BESO-optimised lattice structures in comparison with experimental mechanical test data. This study revealed an important consideration to be taken into account when modelling and simulating the mechanical performance of LPBF-printed structures. It was observed that the material dataset of the LPBF-printed solid beam cannot be directly implemented to evaluate the model performance of the LPBF-printed lattice structures.

2. Experimental Methods

2.1. LPBF Process Parameters

The ProX200 SLM processing parameters selected to print AlSi12 samples with different design variations are presented in Table 1. Based on the findings from a previous study [26], the energy per layer was considered to select the scan speed. Based on the various design features and printability of the samples, the scan speed of 2500 mm/s was selected.

2.2. BESO-Optimised Lattice Unit Module

A module which works in conjunction with the Finite Element Analysis (FEA) software ABAQUS, which was developed by Huang and Xie [27], was used in this study. The module takes the input (.inp) file of the ABAQUS 2D models of the design as an input for structural topology optimisation. Two different element sets are required to be created in the ABAQUS model, which represent the design and non-design region of the model. The design region would be optimised by using the BESO algorithm [27], whereas the non-design region would not be subjected to topology optimisation and would remain intact. An illustration of the design and non-design regions of a bending beam considered in this study is shown in Figure 1. The module provides a provision to specify a number of lattice units within the design region. This could be achieved by specifying the number of lattice units in the X and Y direction of the model.

2.3. Bending Test

The bending tests were carried out on the MTS 50 kN machine, with the test setup shown in Figure 2. The bending test was performed as per ASTM standard E290-14 [28]. The force values were recorded with the help of the machine dynamometer, and the deflection of the beam was recorded with the displacement of the roller. The span between the two circular rollers was set to 70 mm. All the test samples were tested to complete failure to understand the failure patterns. At least three samples of each design variation were tested.

3. BESO-Topology-Optimised Design Variations

In this section, a description of two different topology optimisation techniques using BESO is provided. For a simplified application and validations of the designs, a case study of a simple beam under bending was considered. A beam simply supported between a span of 70 mm, having a total length of 90 mm and a square cross-section of 22.5 mm side, with a mid-point load, was considered for topology optimisation. The beam dimensions and span length were selected based on a published work by Rahman Rashid et. al. [29]. In this study, a volume reduction of 50%, when compared with a solid beam of the same dimensions, was achieved by using three different lattice units, i.e., triangular, circular, and honeycomb.
In their study, Rahman Rashid et al. [29] found that the beam with triangular units showed an improved flexural strength when compared to the circular and honeycomb units. Hence, for this study, it was determined that a careful selection of optimised design would lead to improved mechanical properties with a significant reduction in volume. Instead of selecting a design based on arbitrary shapes, the topology-optimisation technique provides volume reduction of the design via a mathematical distribution of material. Additionally, stiffer lattice units could be obtained by combining the topology-optimisation technique with a repetitive design constraint in improved algorithms. With this as the motivation for further investigation, two different topology-optimisation schemes were considered in this study, i.e., topology optimisation of an entire beam and topology optimisation of lattice units in the beam.

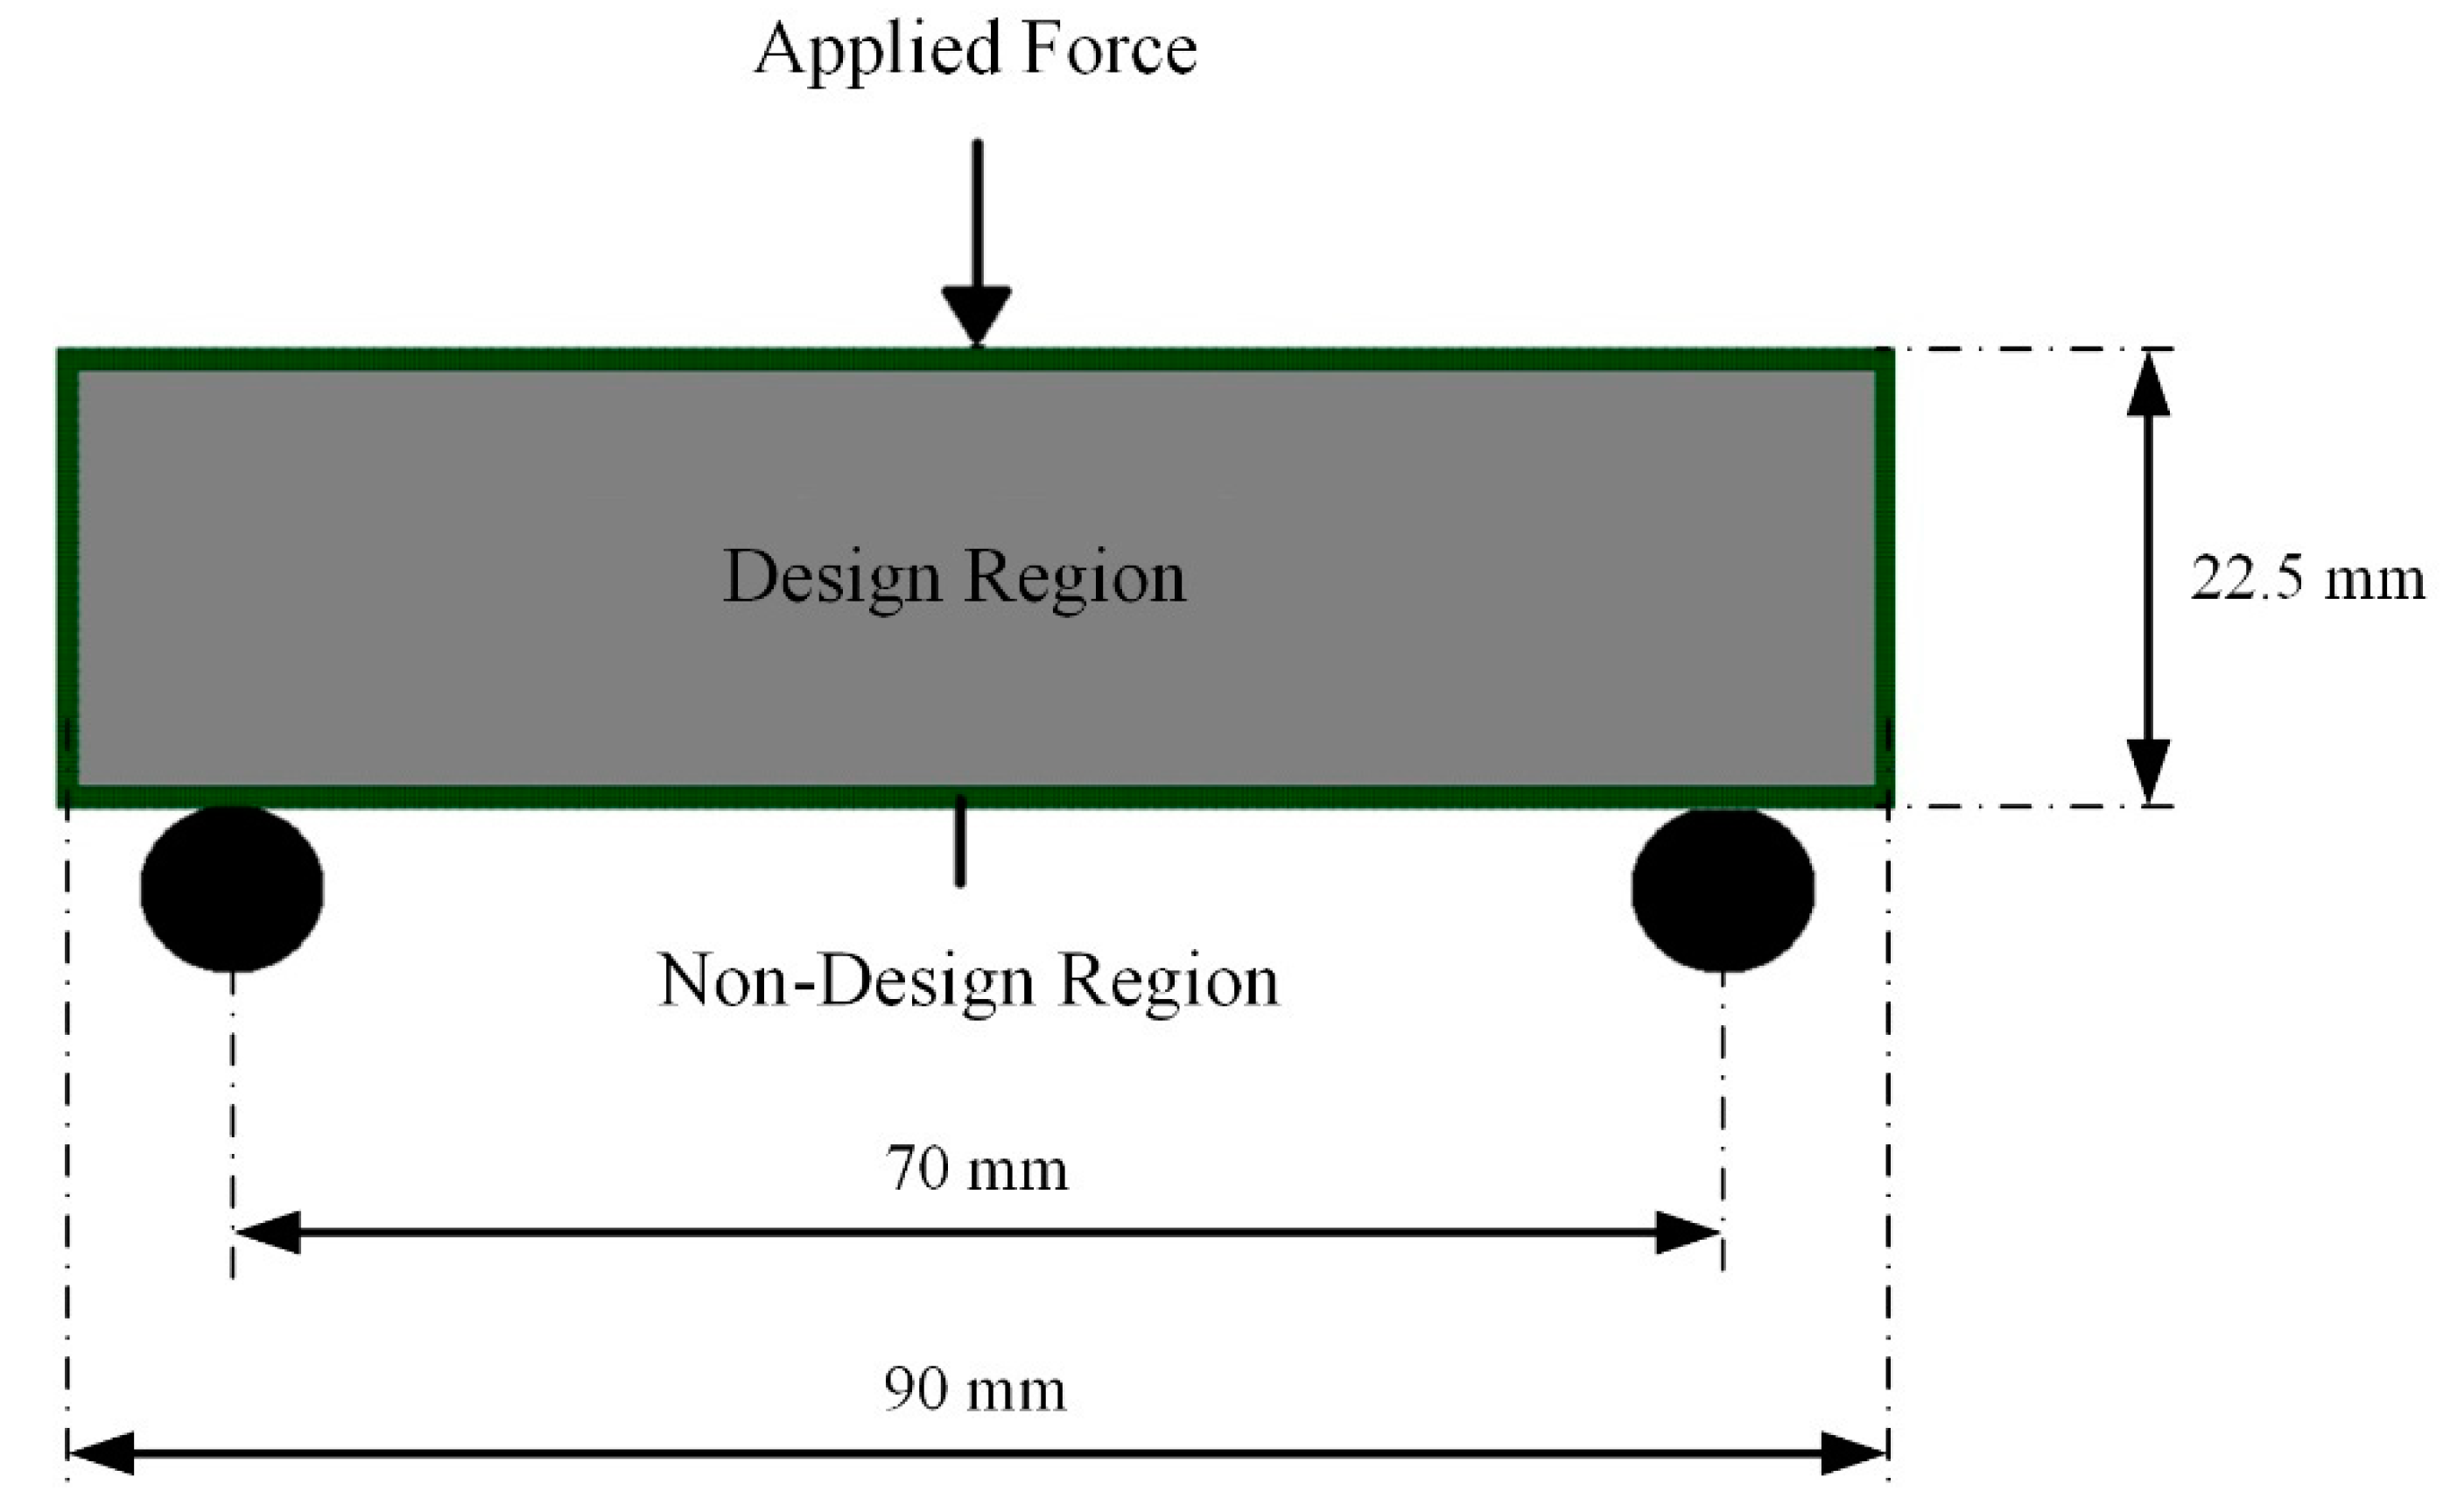
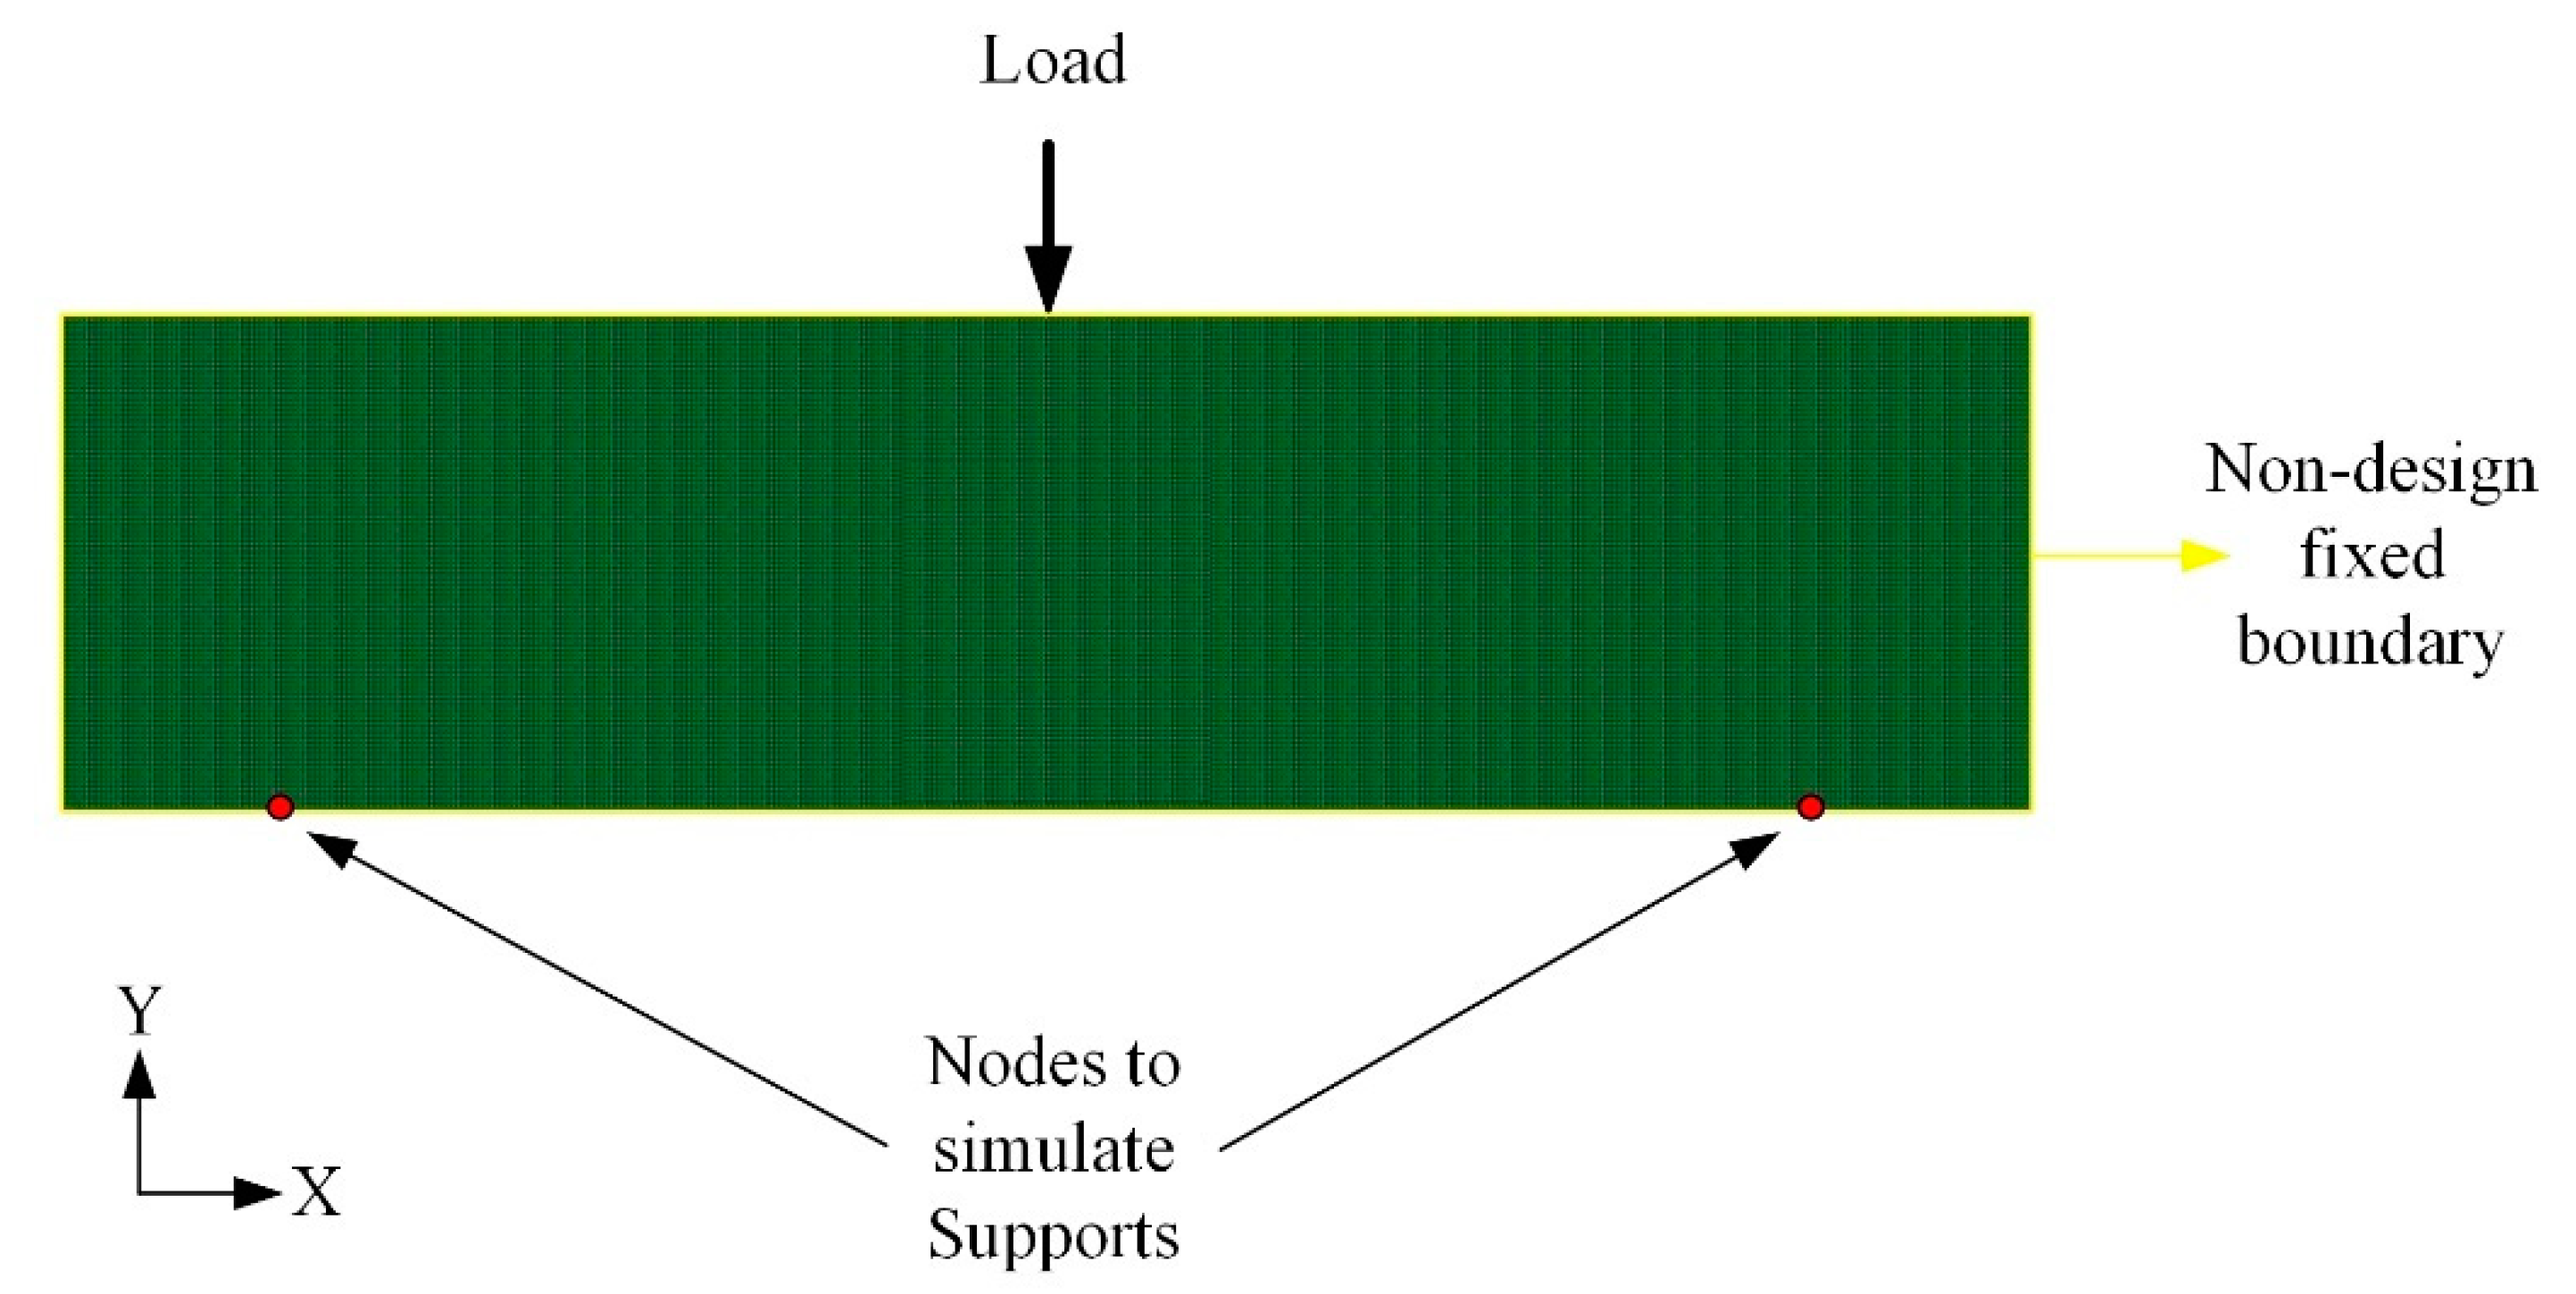
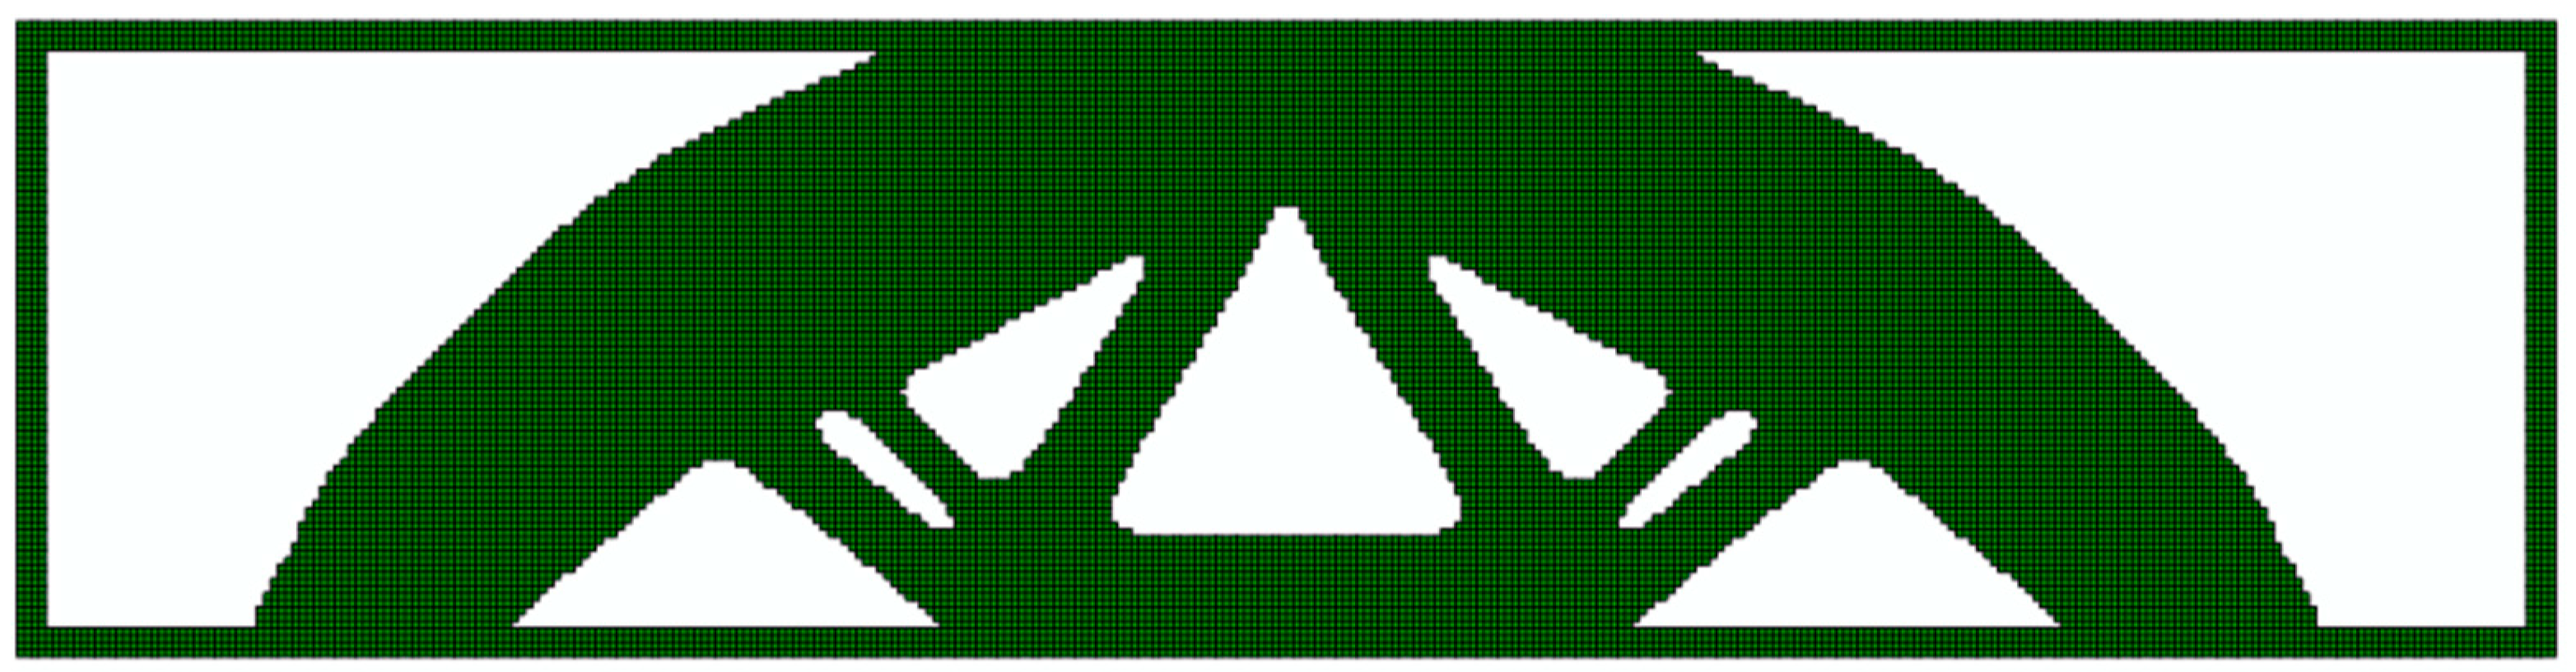
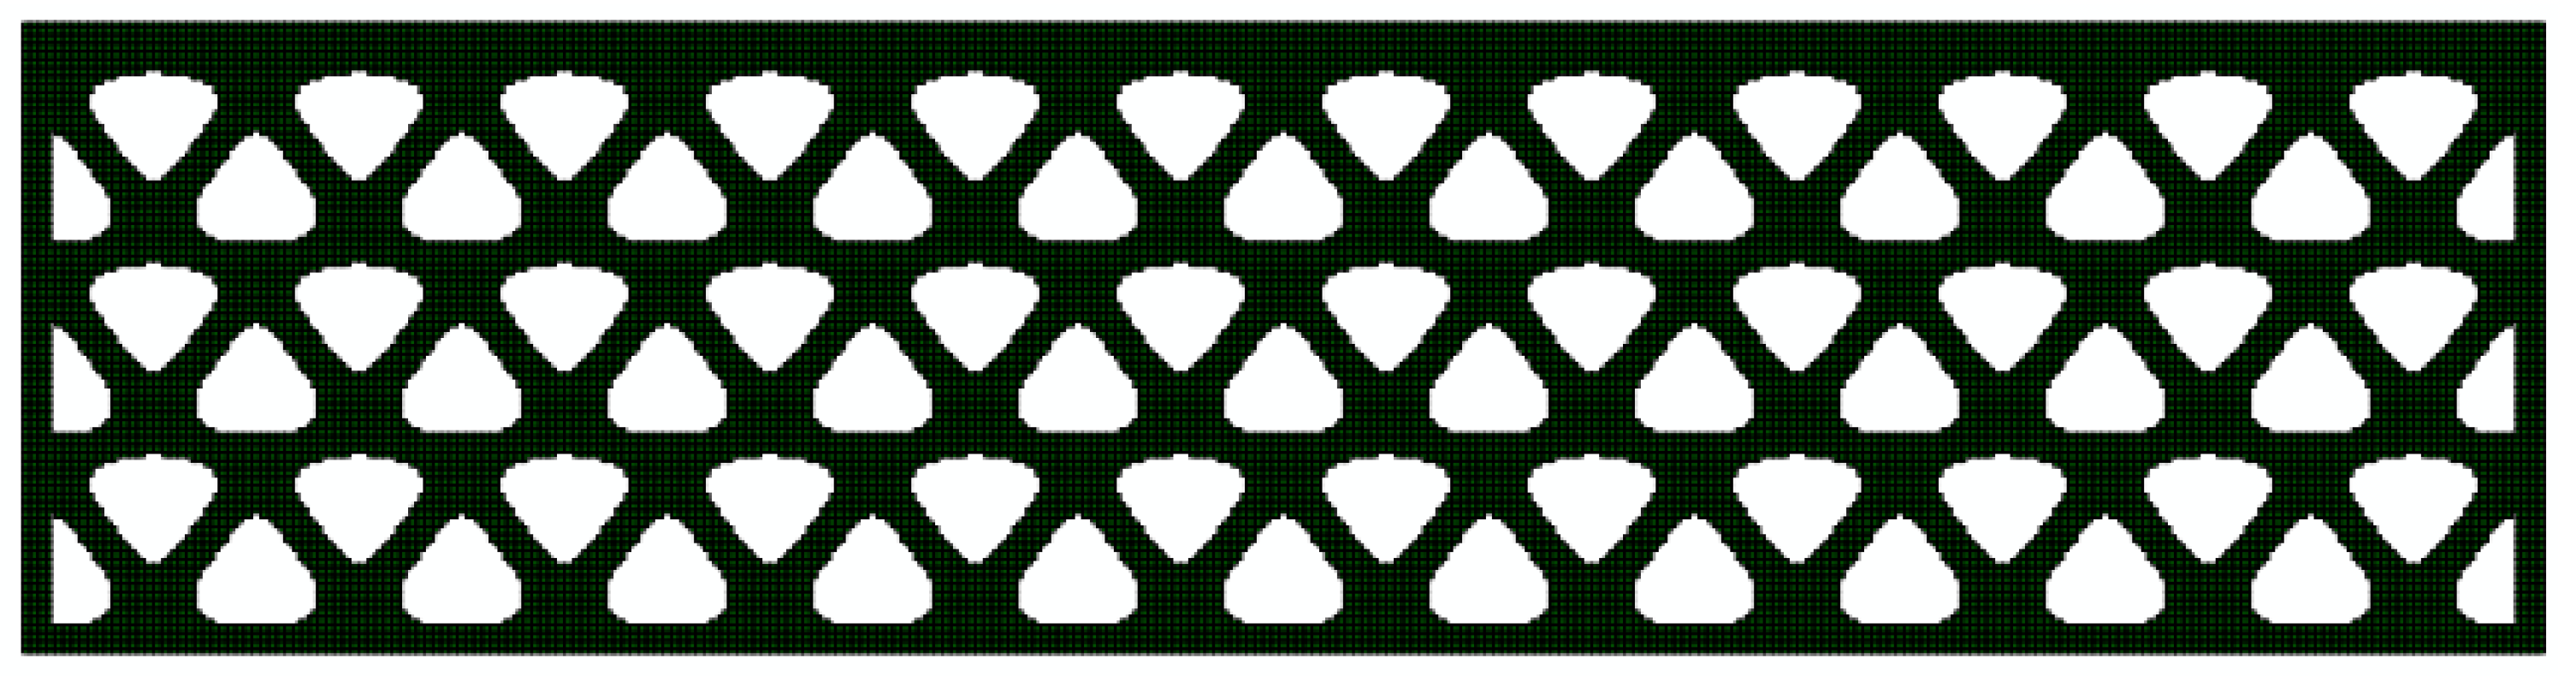
3.1. Topology Optimisation of a Beam

The topology-optimisation scheme considered in this study is BESO. The following design and boundary conditions (Figure 3) were considered to set up the finite element (FE) input file:
  • In order to simplify the computational time, the beam was divided into plain strain quad elements.
  • In order to improve the resolution of the design iterations, the computation of the beam was performed by considering the length and the width of the beam to be 180 mm × 50 mm (more than twice of the considered beam dimensions).
  • The element size was 0.5 mm × 0.5 mm.
  • An arbitrary load of 100 N was applied centrally, acting in the downward direction.
  • Two nodes (140 mm) apart from each other were fixed to simulate the simply supported bending beam.
  • The material property considered for the design optimisation was an isotropic material with a Young’s Modulus of 1 GPa and a Poisson’s ratio of 0.3.
  • The optimisation was performed to maximise the stiffness of the beam while reducing the volume of the beam to 50%.
In order to retain the edges of the beam, a non-design region was assigned in the ABAQUS file. This was achieved by creating a set of elements that would not be affected by the topology-optimisation algorithm. The elements, which were added/removed during design iteration, were contained in the design region. The design and non-design regions for the beam are shown in Figure 1. When the structural BESO algorithm [27] is applied to the non-design region, a design solution is obtained as shown in Figure 4. Additionally, this design could be considered as having 1 lattice unit. Henceforth, this beam design would be referred to as 1 × 1 beam.

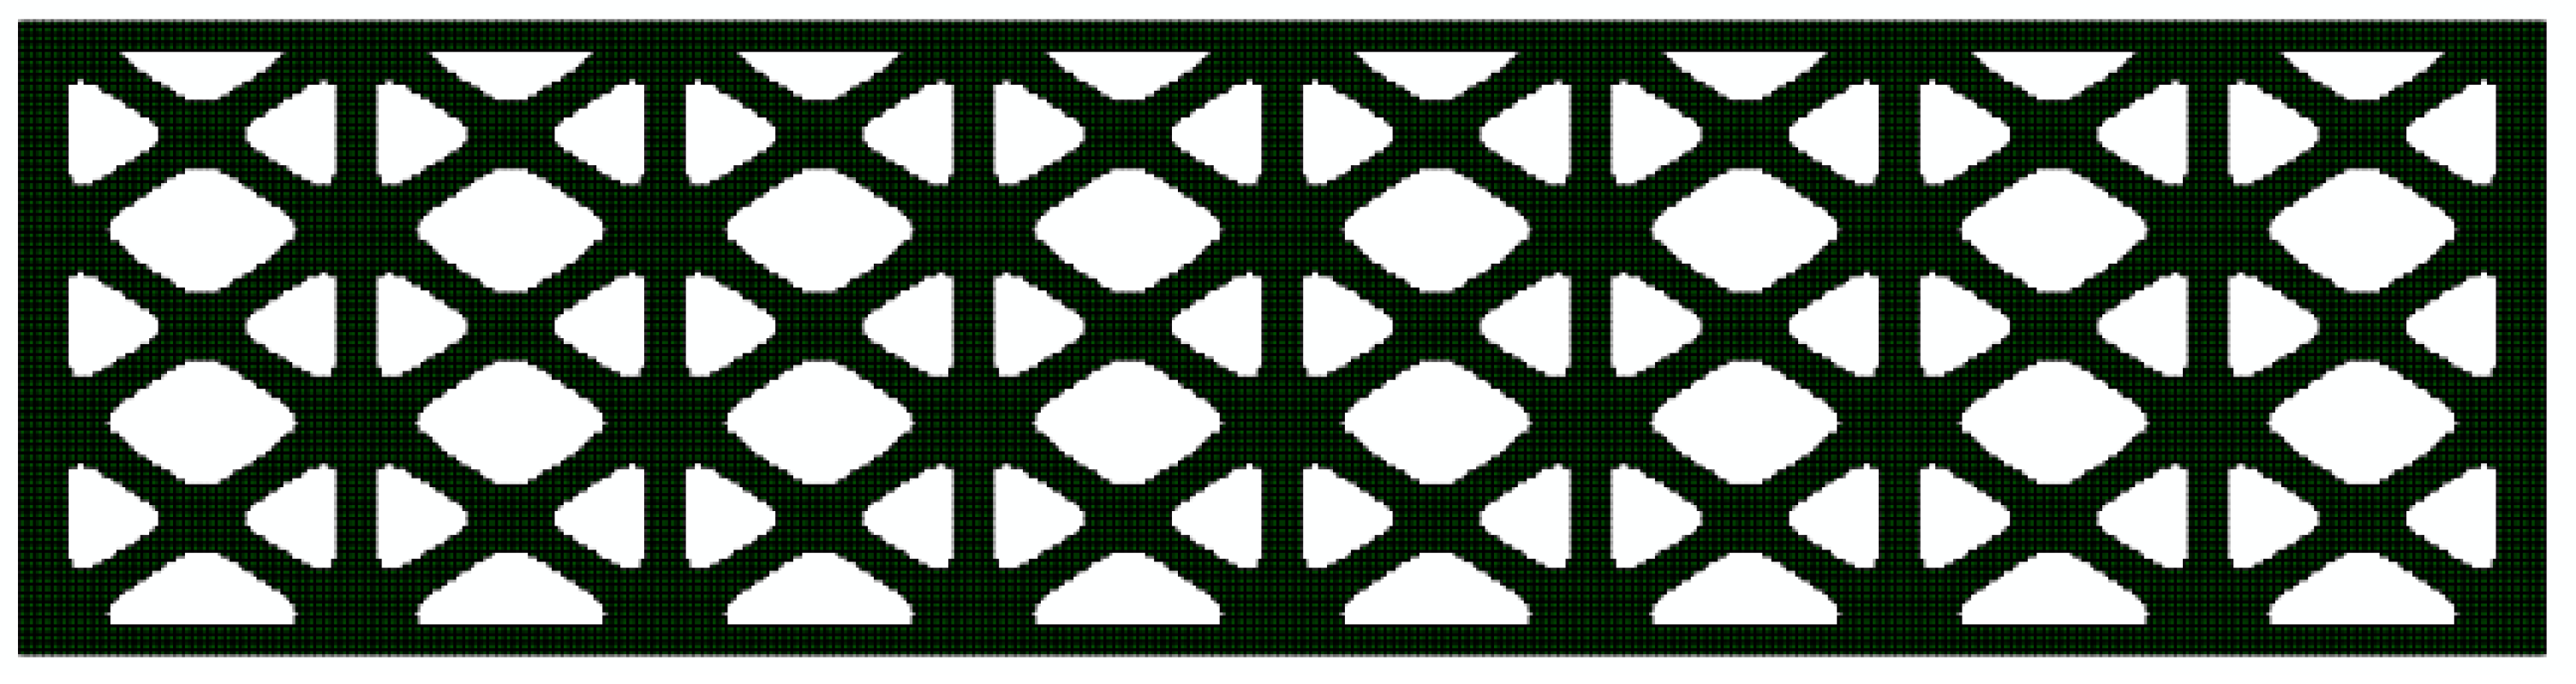
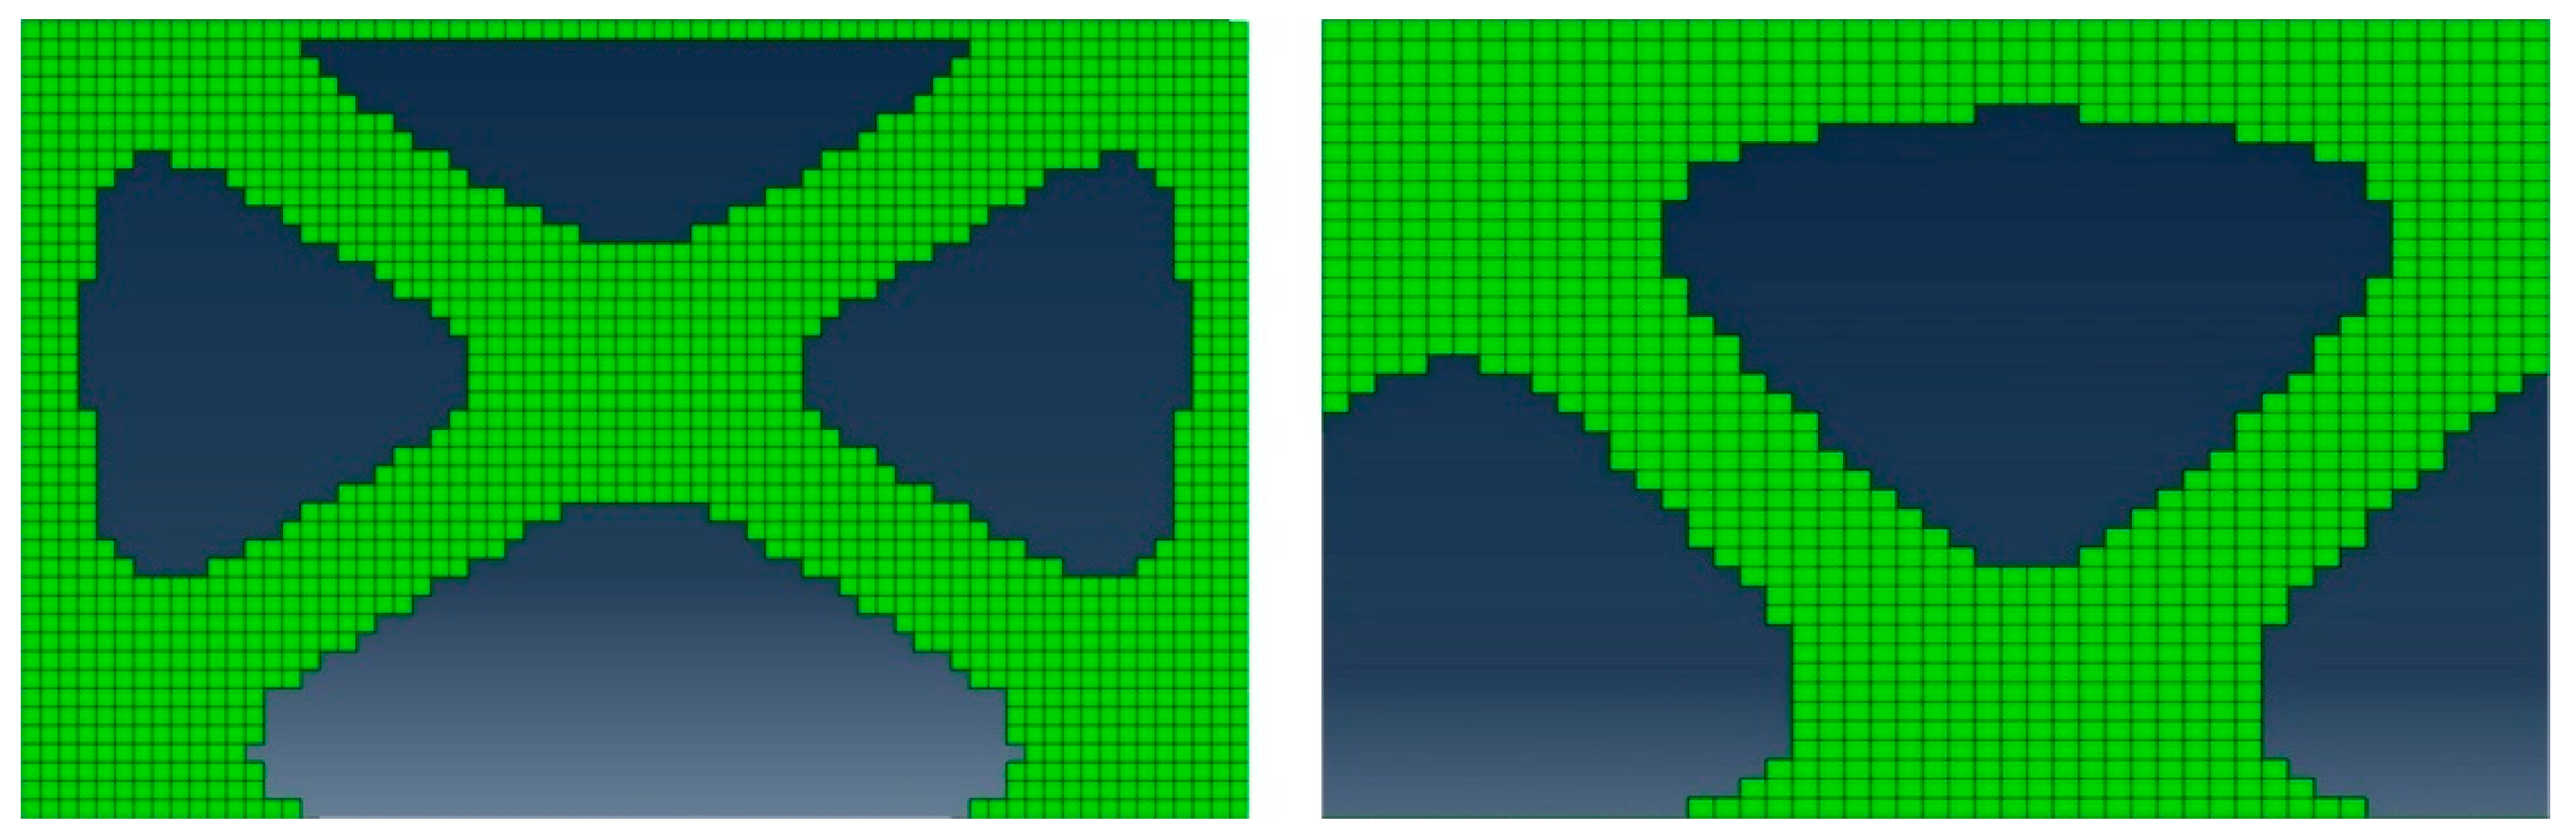
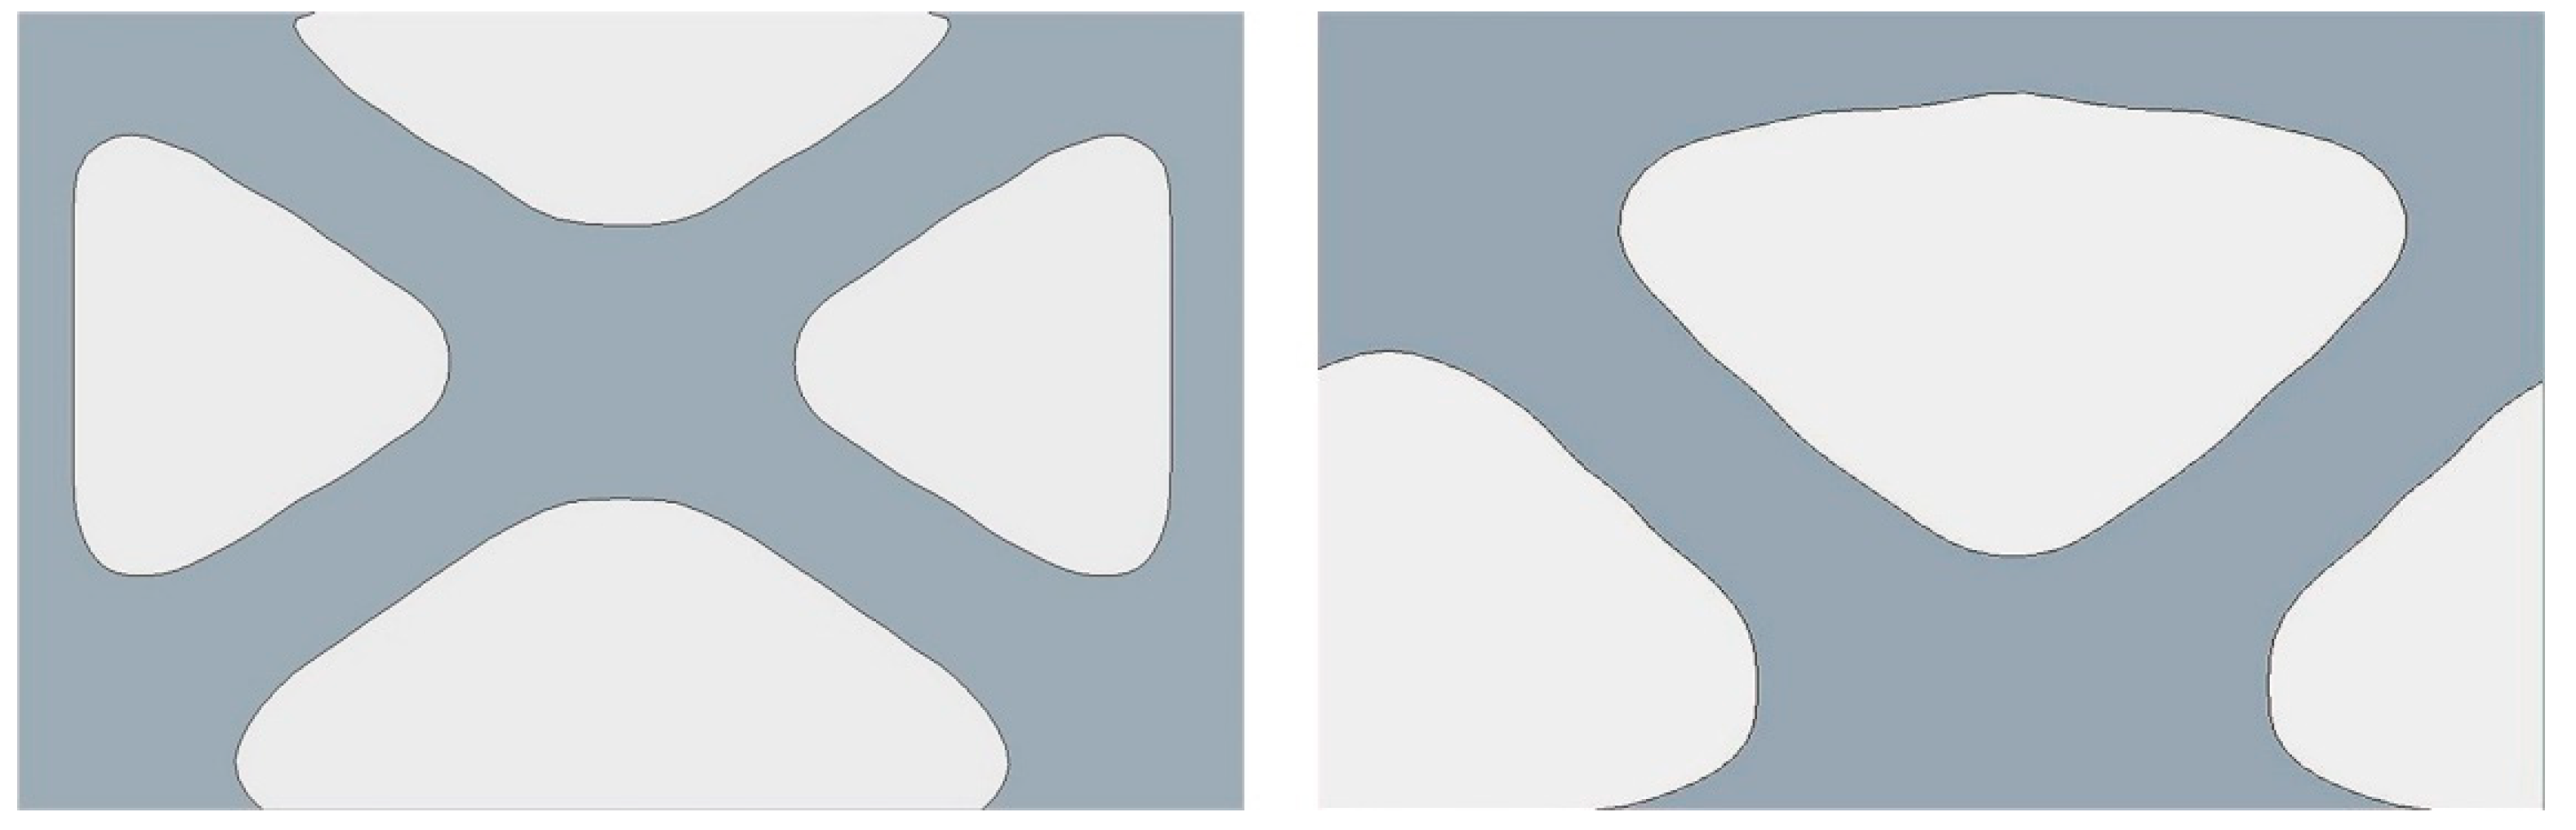
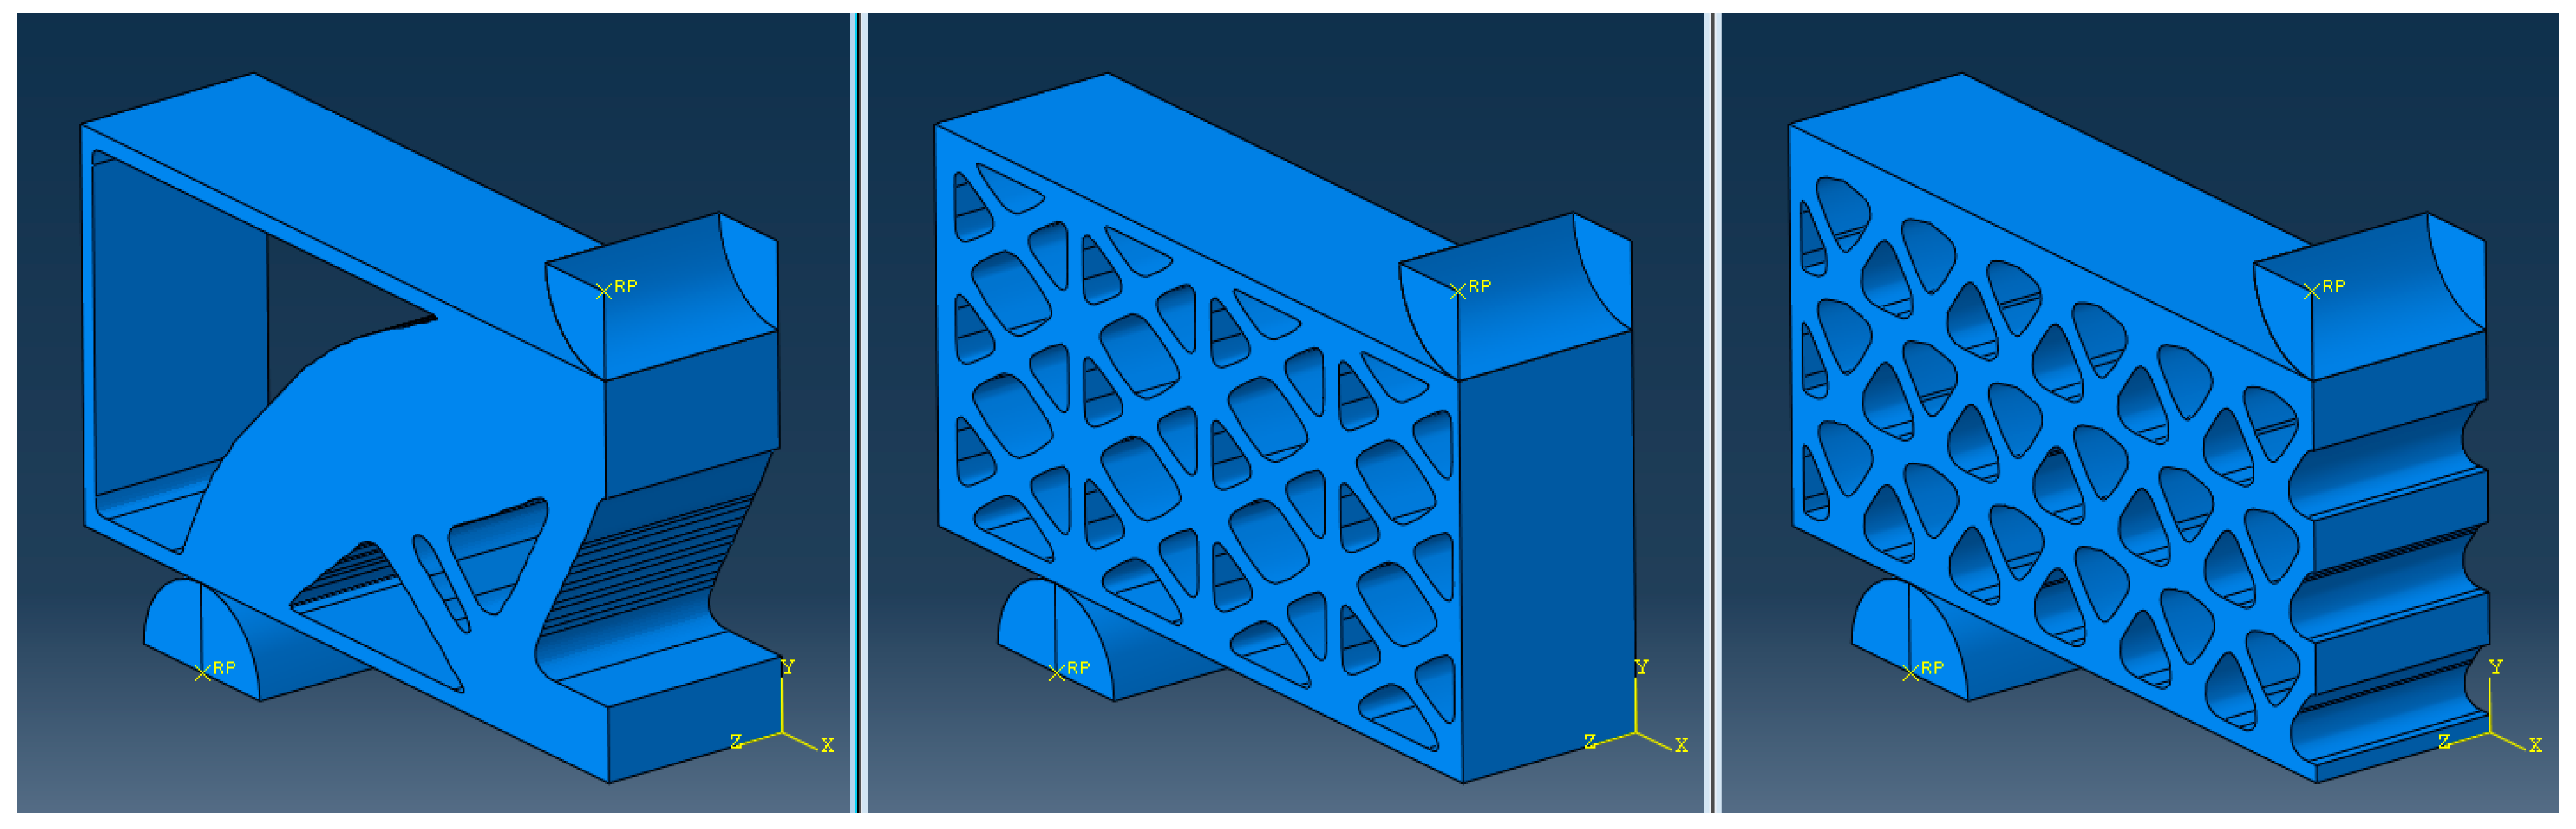
3.2. Topology-Optimised Lattice Units

Topology optimisation could be used for this problem to generate homogeneous, symmetric, or periodic material distributed designs with the help of optimised lattice units. Huang and Xie [27] reported that a modified BESO algorithm could be used to obtain unique topology-optimised lattice units. The algorithm divides the design region into A × B lattice units, with A as the number of lattice units in the X direction, and B as number of lattice units in the Y direction. The number of lattice units along the X and Y directions are selected by the designer. As an illustration, the design region shown in Figure 5 is divided into lattice units with 4 and 3 lattice units along the X and Y directions, respectively. Therefore, the algorithm allows designers to select different periodic lattice units within the design region, leading to unique designs.
The conventional BESO method permits the addition or removal of elements from the entire design space based on their stiffness values. On the other hand, in this algorithm, the elements are added or removed from each lattice unit design region simultaneously. For example, the elements shown in the grey colour in Figure 5 are linked to each other due to their similar location within the lattice units. The removal (or addition) of one such element in one lattice unit based on its stiffness value would correspond to the removal (or addition) of similarly located elements in other lattice units. This leads to the same lattice unit design within the design region. The algorithm could also be used to vary the design of the lattice units by controlling the number of units along the X and Y directions.
Based on this algorithm, an ABAQUS subroutine was developed to obtain a topology-optimised beam with lattice units. The beam with the boundary conditions that are the same as shown in Figure 1 and Figure 3 was considered for implementation in the algorithm. Contrary to the 1 × 1 beam, the optimisation was performed to maximise the stiffness of the beam and reduce the volume of the beam to 50%, while having periodic lattice units within the design region.
Two different variations of the optimised lattice units were considered for this study, such that the design space was divided into 8 × 3 and 12 × 3 topology-optimised lattice units. Specifically, the two design solutions had eight and twelve lattice units, respectively, along the length of the beam and three lattice unit along the height of the beam, as shown in Figure 6 and Figure 7. The two beam designs would henceforth be referred to as 8 × 3 beam and 12 × 3 beam, respectively.
Single lattice units from the two periodic designs are shown in Figure 8. The length and width of the lattice unit from the 8 × 3 beam and 12 × 3 beam were 11 mm × 6.83 mm and 7.33 mm × 6.83 mm, respectively. Due to the removal/addition of elements during topology optimisation, the boundaries tend to have jagged boundaries, as shown in Figure 8, which is prominent in topology-optimised design solutions. The irregular boundaries would act as stress concentrators during bending tests, causing early failure of the parts. Therefore, a further boundary-smoothening program (code presented in [30]) was applied to the optimised lattice unit design to obtain smooth boundaries. The smoothened single lattice units are shown in Figure 9.
The BESO lattice unit beam designs were too complex for fabrication using conventional machining. Hence, the beams were manufactured by using a laser-powder bed fusion (LPBF) additive manufacturing process.

3.3. LPBF Printing of the Beams

Using the LPBF processing parameters mentioned in Table 1, the solid beam, 1 × 1, 8 × 3 beam, and 12 × 3 beams were printed in separate batches. Five samples of each type were printed in a batch to avoid batch variability in the samples. The beam dimensions considered for LPBF printing were 90 mm × 22.5 mm × 22.5 mm. The LPBF-printed samples were built with solid support structures of 3 mm, making the entire build height of samples 25.5 mm. Subsequently, the LPBF-printed beams were cut off the substrate and machined to the required height. Figure 10 shows five samples each of the two beams with topology-optimised lattice units. Furthermore, prior to cutting the samples off the substrate plate, stresses in the LPBF-printed samples were minimised by applying stress-relief heat treatment. The stress-relief heat treatment applied was 240 °C × 2 h. The stress-relief cycle was selected based on previous work by Siddique et al. [31].

4. Results

The experimental results were analysed, and the graph between force and displacement was plotted as shown in Figure 11. This figure shows the representative three-point bend-test curves of the AlSi12 LPBF beams printed with different BESO design variations (i.e., 1 × 1, 8 × 3, and 12 × 3). For comparison, a solid AlSi12 LPBF beam was also tested, and a representative curve is shown in the same figure. It was observed that the bend test depended on the type of BESO design considered.
The solid beam samples showed a greater load-bearing capacity (26 ± 2 kN) than 1 × 1 beam (17 ± 2 kN), 8 × 3 beam (13 ± 1 kN), and 12 × 3 beam (10 ± 1 kN). The beam deflections at the maximum bending load for solid, 1 × 1, and 8 × 3 beams were approximately 1 mm, whereas the 12 × 3 beam failed early at approximately 0.85 mm. Additionally, the 8 × 3 and 12 × 3 beams did not fail completely at the maximum load and failed in three steps, which was directly related to the lattice units along the direction of load (i.e., three). A direct comparison between the average maximum load and average deflection of the beam at the maximum load is shown in Figure 12 (top and bottom, respectively).
The average maximum bending load, average deflection of the beam at maximum load, and average deflection of the beam at complete failure of four types of LPBF-printed beams, i.e., solid, 1 × 1, 8 × 3, and 12 × 3 beams, are tabulated in Table 2. ‘Complete failure’ was considered to have been achieved when the load bearing capacity of the test specimen was reduced to zero. Contrary to the solid and 1 × 1 beams, the BESO-optimised lattice beams (i.e., 8 × 3 and 12 × 3 beams) did not completely fail at maximum load. Due to the presence of three lattice units along the direction of load, these beams failed in three different steps.
All beams failed in a brittle manner. It was observed that the BESO-optimised beam’s initial fracture occurred at similar displacements, and the magnitude of the maximum bending load was lower when compared to the solid beam. Additionally, the 8 × 3 and 12 × 3 lattice beams had multiple connecting links, due to which the early failure occurred, followed by total failure in a disrupted fashion. Similar observations were also reported in the previous publication [29], where structures containing triangular and hexagonal lattices showed disruptive failures. Moreover, the fracture patterns of the optimised lattice beams are shown in Figure 13. It was observed that the bottom horizontal link had the first point of failure, followed by the failure in the links as shown in Figure 13.
The beams failed through different profiles under loads applied at the same rate. The TO design was optimised to perform in a similar fashion to the solid beam under bending load. The bending behaviour of the same could be predicted by using FEA simulations.

5. Inverse Material Modelling for Solid Beam

The mechanical response of the LPBF-printed 3D beam could be predicted by using bending-beam equations, if the anisotropic material model of the LPBF printed was found. Anisotropic material is defined by nine constants, namely modulus of elasticity in three directions (Ex, Ey, and Ez), Poisson’s ratio in three planes (νxy, νyz, and νxz), and modulus of shear in three directions (Gxy, Gyz, and Gxz). In order to develop a material model for LPBF-printed AlSi12 parts, the cost undertaken for the printing, testing, and analysis would be beyond the scope of this research. Additionally, Rashid et al. [26] concluded that the LPBF-printed parts not only have different tensile responses in three different orientations but also were affected by the laser energy used to melt each layer. This could lead to added complexity in determining the material model. In order to predict the mechanical response of LPBF-printed materials, the FEA technique was used.
The assumption for topology optimisation was performed so that all the LPBF-printed beams in the same conditions (i.e., solid, 1 × 1, 8 × 3 and 12 × 3) have the same mechanical properties, e.g., modulus of elasticity, onset of yield stress, Poisson’s ratio, etc. However, the bending tests of the different beams under the same conditions yielded different load vs. deflection profiles. In order to validate the assumption, the inverse material modelling technique, in conjunction with FEA, was used. For the inverse material modelling, the FEA of the three-point bending test of the solid beam would be used to develop a material model of the LPBF-printed beam. The material model from the solid beam would then be used with the three-point bending test of TO beams to predict load vs. deflection characteristics and their comparison with the experimental results. In order to set up an accurate inverse material model, the FEA setup needs to be as close as possible to the experimental setup.

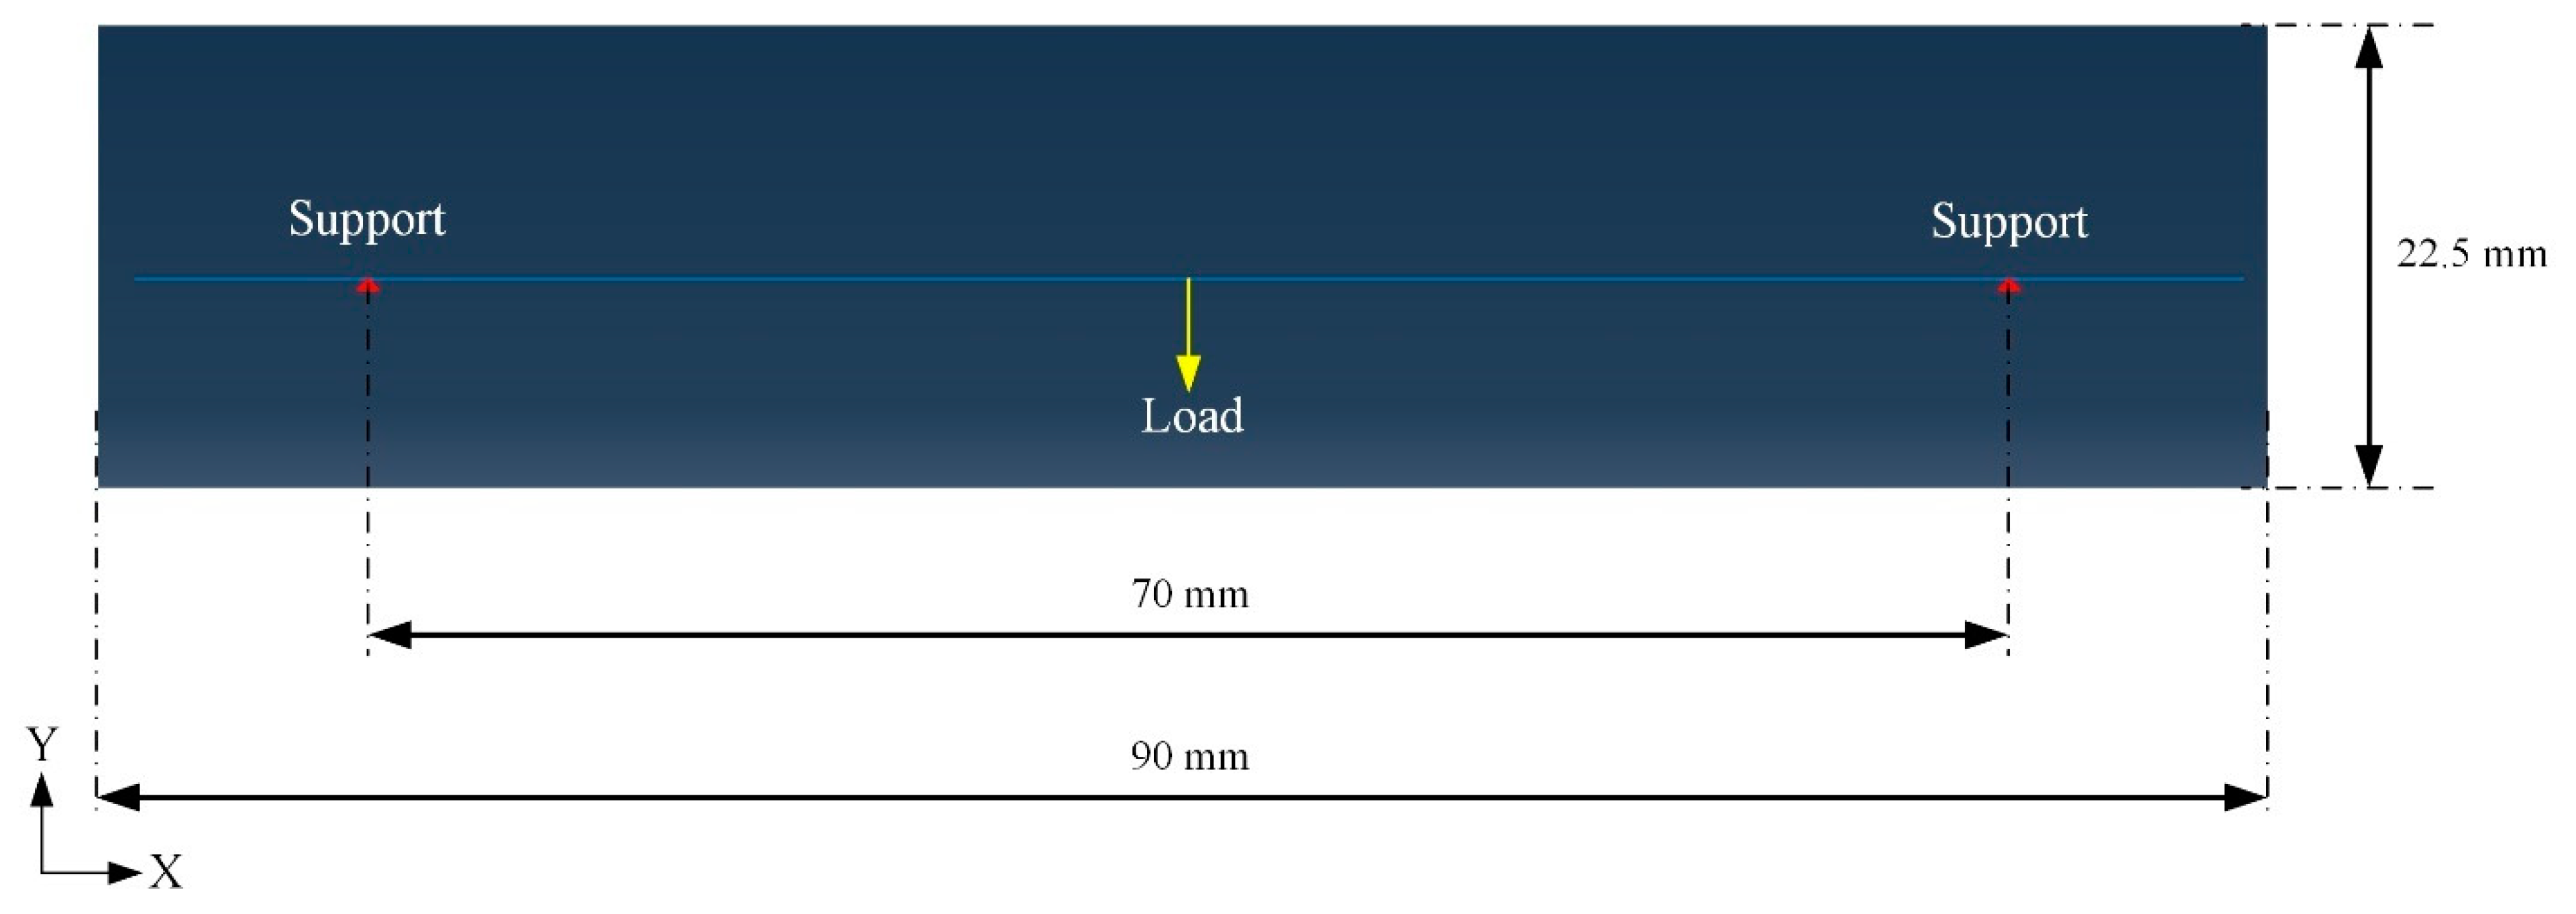
5.1. Simulation of Solid Beam under Bending

The experimental setup of the three-point bending test of LPBF-printed beams is shown in Figure 2. The setup consists of an LPBF-printed beam with the following dimensions: 90 mm × 22.5 mm × 22.5 mm. The fixed support rollers were set at a distance of 70 mm from each, and they were symmetric with respect to the centre of the beam. The loading roller indenter acted centrally to the beam and fixed rollers. The diameters of the fixed support rollers and loading indenter roller were measured as 10 mm each. These dimensions were used to model the solid beam, support rollers, and indenter. The 3D part models were then assembled to replicate the experimental setup, as shown in Figure 14. Furthermore, the beam part model was assigned as the deformable type, which would deform under the application of a load. The support rollers and indenter parts were assigned as discrete rigid parts, which would not deform under applied loads. This holds good for hardened steel rollers when compared to the soft LPBF-printed aluminium samples.
The solid beam was considered to be an elastic isotropic material in order to setup and validate the FE model prior to applying inverse modelling. The modulus of elasticity was arbitrarily selected as averaged values from LPBF-printed AlSi12 tensile samples in horizontal samples, similar to the orientation in which the samples were printed. The modulus of elasticity of 55 GPa was defined in FE material property for the 3D beam. However, the goal was to define the material model of the solid beam through inverse material modelling.
The static analysis was set up, and in order to mimic the experimental test, the displacement boundary condition was to be provided to the indenter while the support rollers were fixed. For discrete rigid parts, the boundary conditions are governed by a single reference point (RP), which was selected as the centre of the circular roller. The support rollers were fixed in all the translational and rotational directions. The indenter was fixed in all the translational and rotational directions, except in the Y translational direction, which was the direction of the indenter displacement. Furthermore, contact interactions were defined between the solid beam and indenter surfaces and solid beam support roller surfaces. For contact definition, the tangential coefficient of friction between the beam, support rollers, and indenter was set as 0.15. The contact-interaction parameters are further described and validated in Section 5.3.
An 8-node linear brick element was selected for the beam, whereas a discrete rigid element was selected for the support rollers and the indenter. The mesh control of the beam was achieved such that all the elements were hexagonal (Hex) shaped in a structured manner. The support rollers and indenter had two types of mesh controls. The mesh closer to the centre of the cylinder was selected to be triangular shaped in a structural manner, while the mesh control towards the edge of the cylinder was selected to be quad in a structural manner. The element size of the support roller and indenter was selected to obtain a uniform mesh. Furthermore, the mesh sizing of the discrete rigid parts does not affect the simulation results. However, the element size of the solid beam needed to be adequate to return accurate results without increasing the computation time. In order to determine the element sizing for the solid beam part, mesh convergence was carried out.

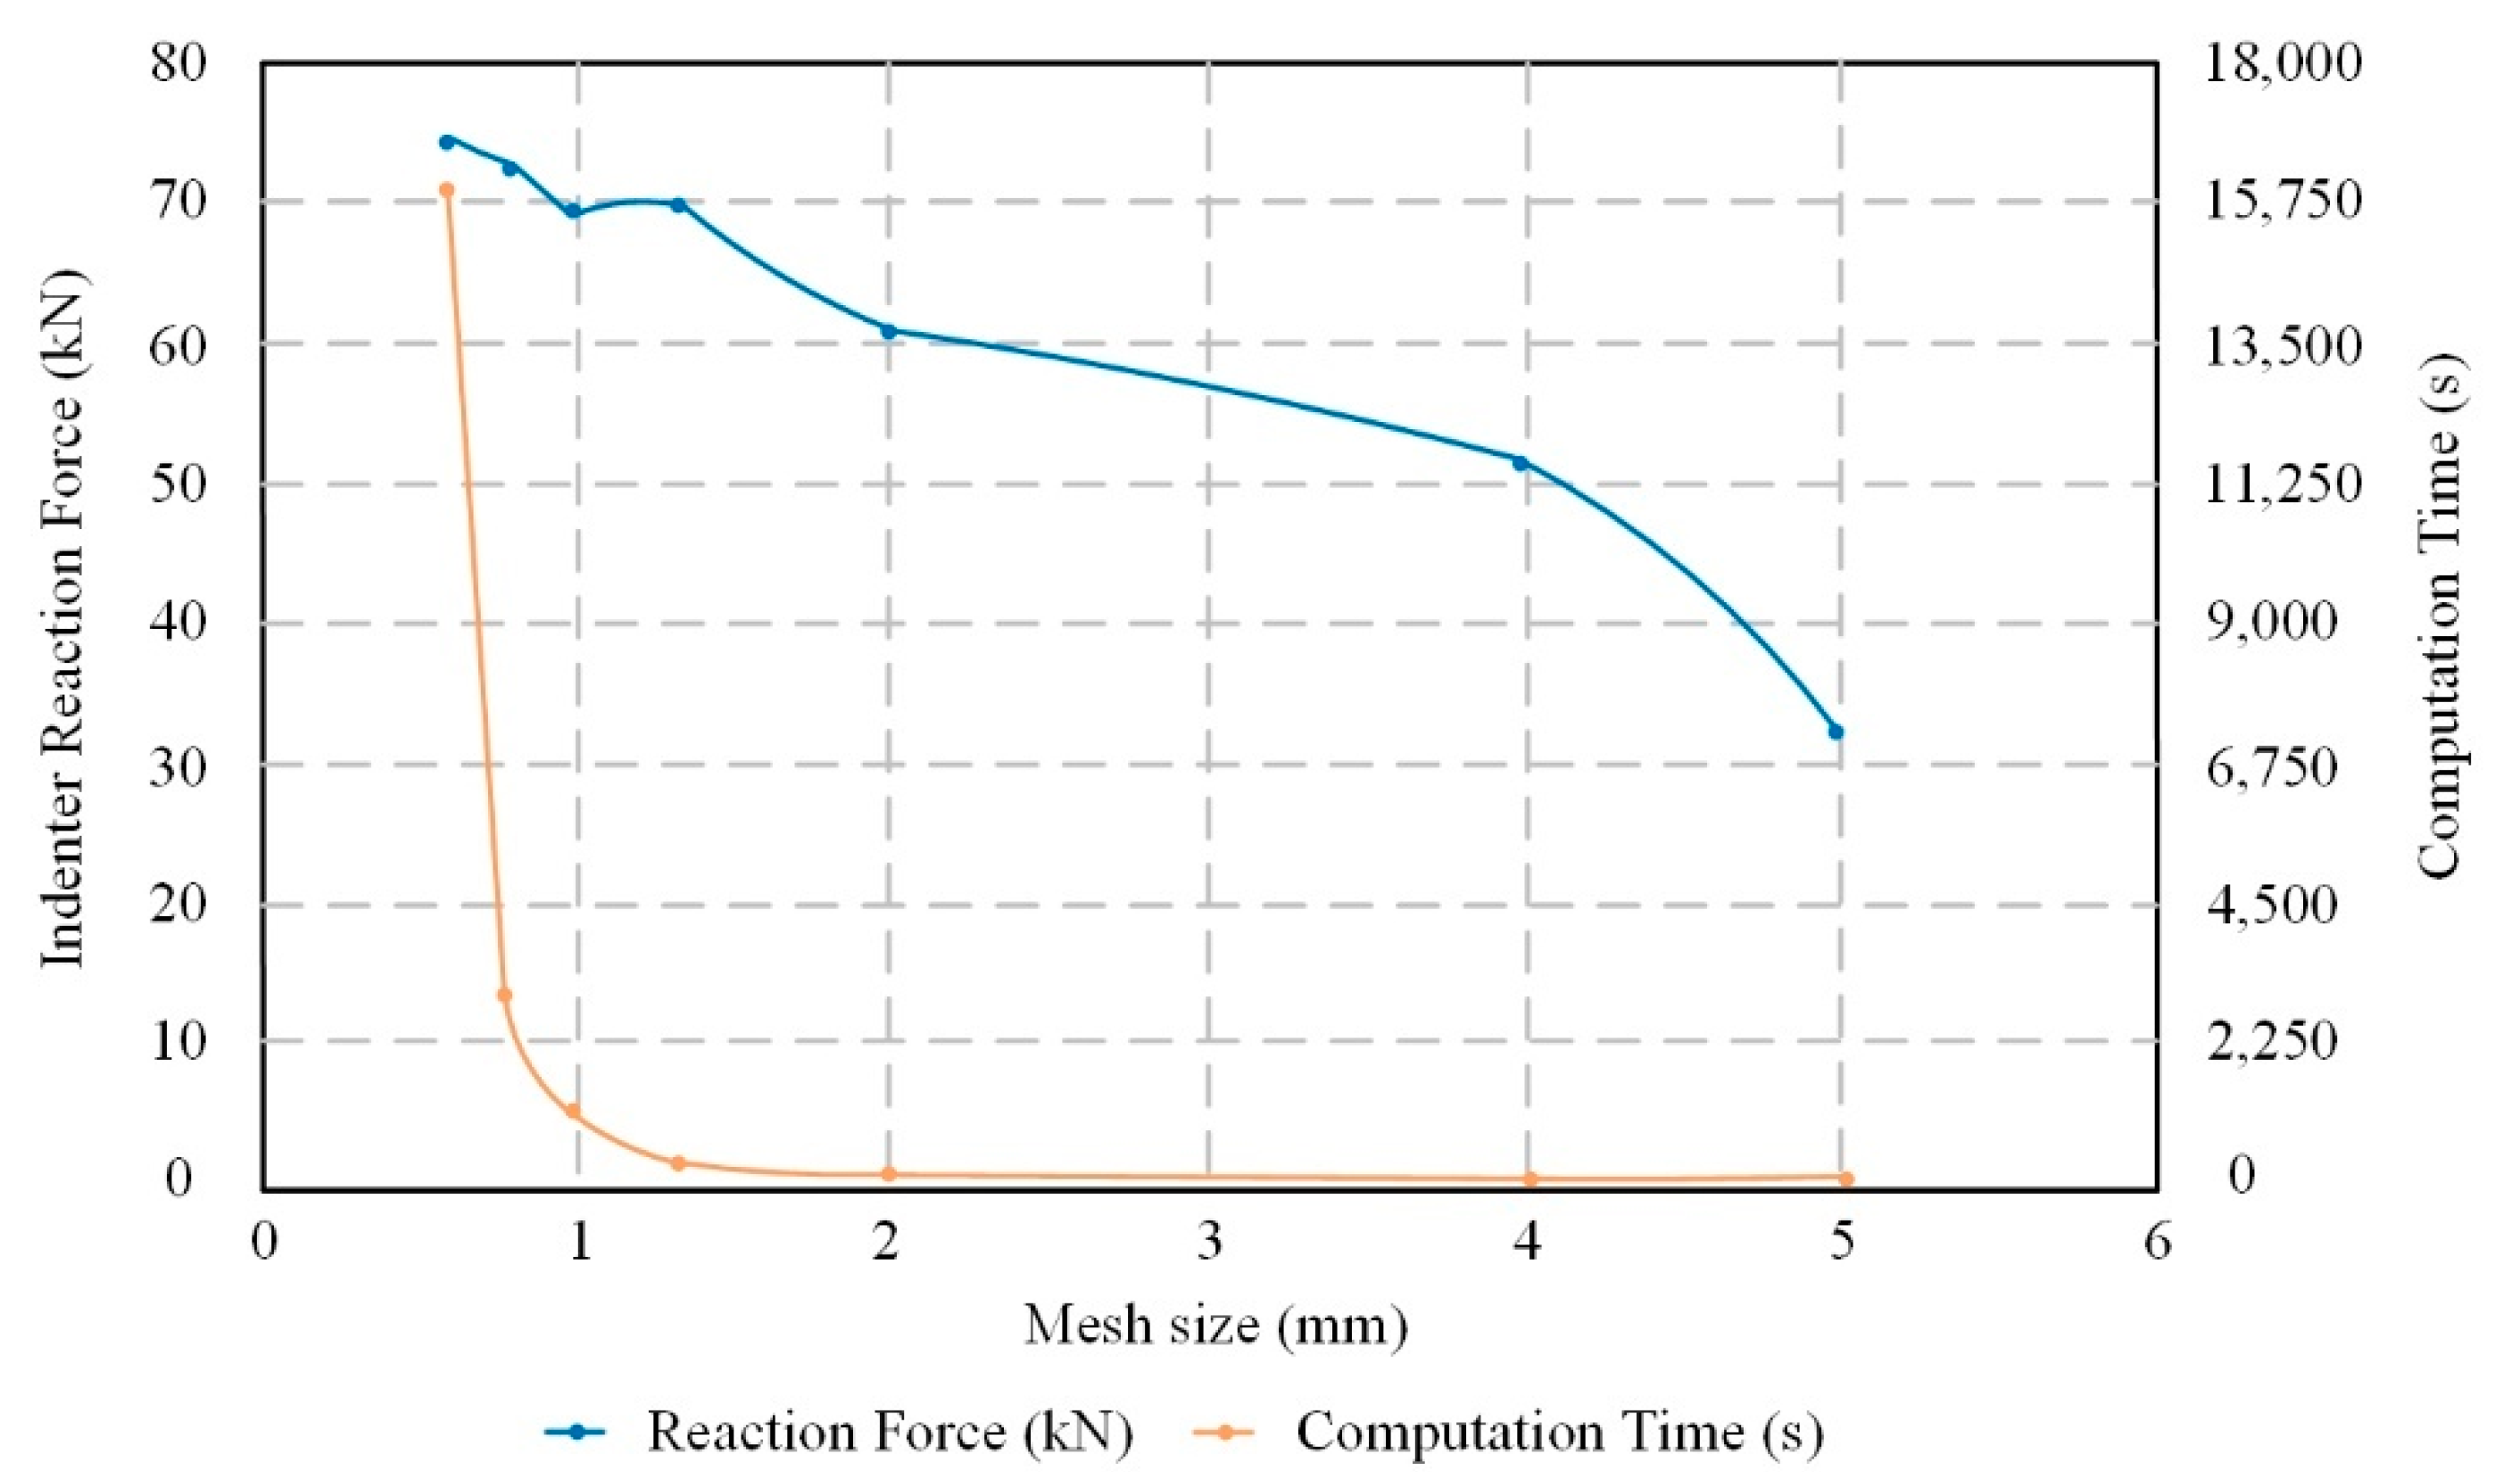
5.2. Mesh Convergence for 3D Solid Beam under Three-Point Bending Test

A mesh convergence study was performed by varying the mesh size in order to obtain an FEA model with an optimum element size that yields accurate results. The mesh size was defined as the side length of the brick element. The reaction force on the indenter was used to inspect the sensitivity of the mesh size. The reaction force on the indenter was selected, as this would be a force measured by UTM force dynamometer in the experimental setup. The target was to obtain a mesh size such that, with a further decrease of the mesh size, the variation in the reaction force would be less than 10%. Another parameter that was considered was the computational time. Since the inverse material modelling would require multiple iterations to obtain a material model resembling the experimental beam, keeping computation time to the minimum without loss of accuracy was required.
The different mesh sizes considered for the mesh-convergence study are shown in Table 3. Furthermore, the relationship between the mesh sizes, indenter reaction force, and computation time is shown in Figure 15. As the mesh was refined, the model converged with respect to an element side length of 1 mm, with the change in the indenter reaction force being approximately 5% with the increase in the mesh density. Additionally, by refining the mesh further after 1 mm, the computational time taken for the analysis took more than 1168.8 s (~19.5 min). Hence, for the solid model, a 1 mm element side length was selected.

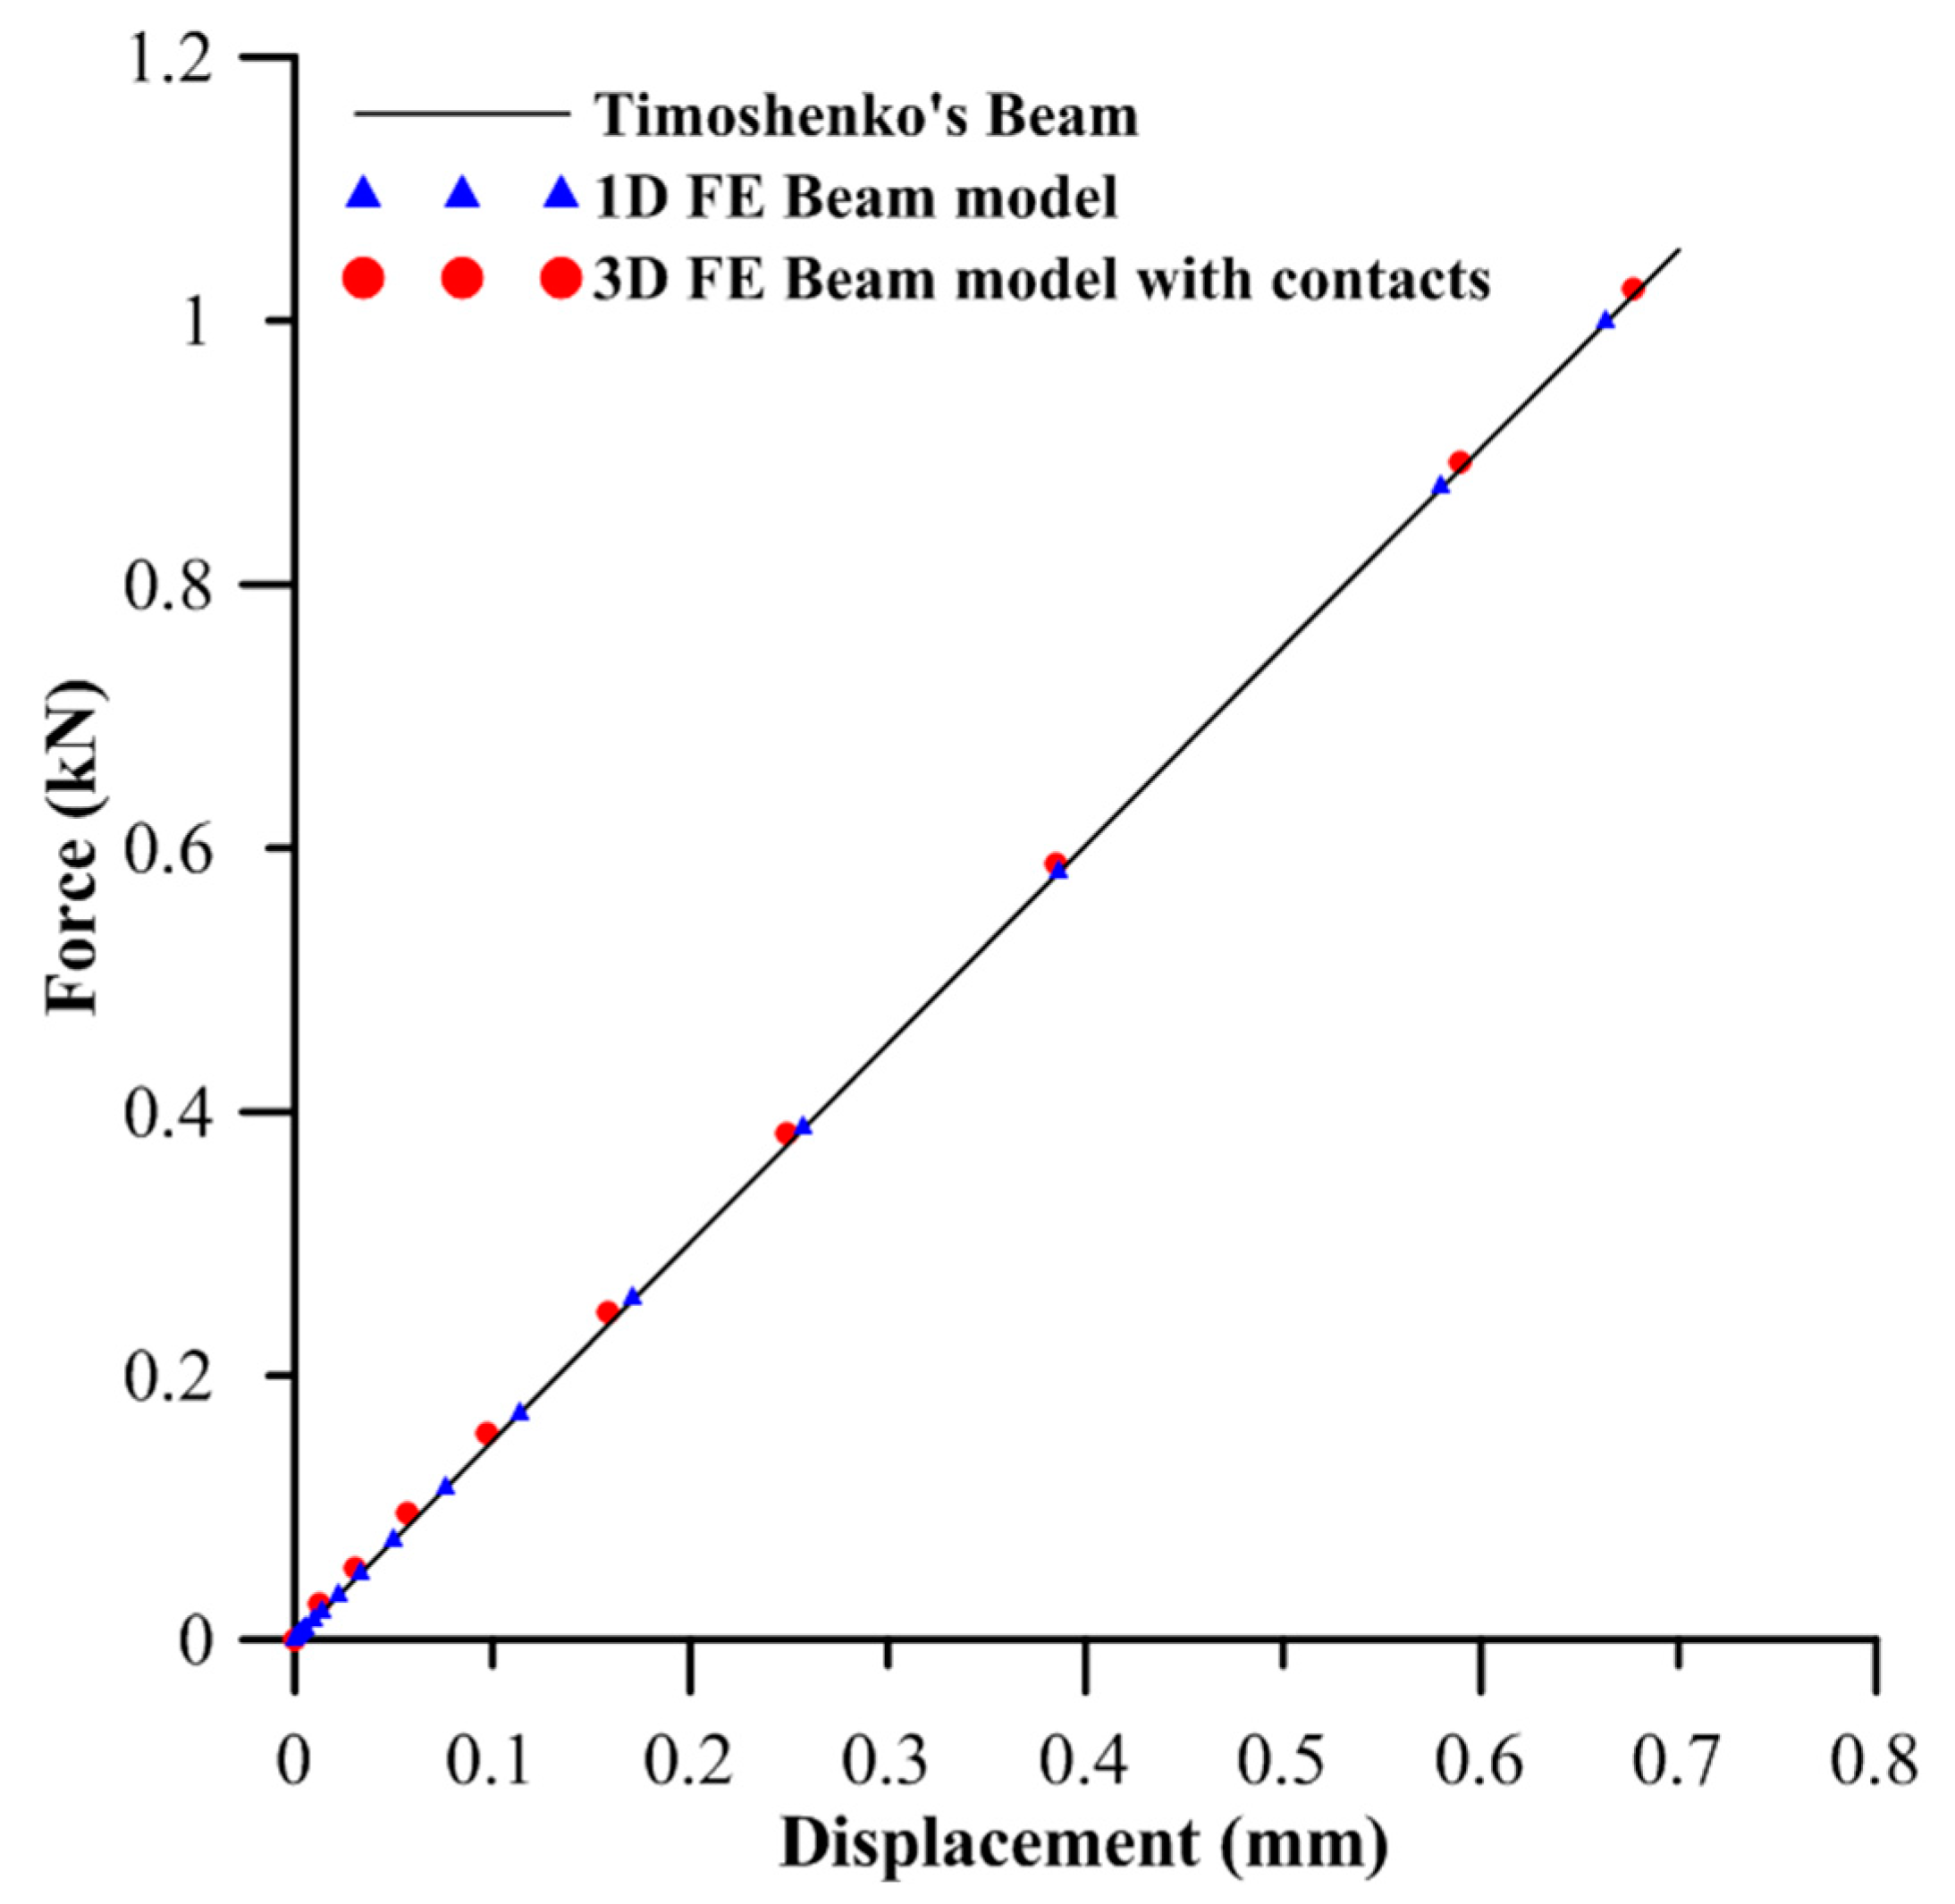
5.3. Validation of 3D Finite Element Contact Modelling

As described in Section 5.1, contact interactions were set up between contact surfaces, i.e., the support rollers and beam contact surfaces, and the indenter and beam contact surface. The contact interactions in ABAQUS CAE were defined by contact frictional properties and contact controls options. For the directional contact properties, a coefficient of friction of 0.15 was selected for tangential contact, and the ABAQUS Default constraint enforcement method was chosen to define normal contact. Furthermore, ABAQUS Default options were used to define contact controls between the interacting surfaces.
The contact surfaces should be modelled accurately to obtain results that are comparable with the experimental results. Furthermore, Lanoue et al. [32] have shown that the default FEA option leads to compromised results and loss of accuracy. However, understanding and implementing most of the complex contact interaction options was beyond the scope of this research. Therefore, in order to validate the 3D FE contact model setup in this study, we compare it against the 1D FE beam model and theoretical calculations.
Commercial FEA software has two types of FE beam elements to define beams in bending, i.e., Euler Bernoulli’s beam element and Timoshenko’s beam element. The Euler Bernoulli’s beam theory holds good for a beam subjected to only deflection along the indenter direction, without any transverse shear deflection, whereas Timoshenko’s beam considers both types of deflections. The 3D beam model has transverse shear deflection in the beam. Therefore, Timoshenko’s beam theory equation was used for comparison with the 3D contact beam model.
However, the 1D Timoshenko’s beam element in ABAQUS is applicable to the beams with a ratio of dimension of cross-section to the axial dimension up to 0.125. However, the beam considered in this study had the ratio of 0.32 (i.e., 22.5 mm/70 mm), which is higher and would not yield accurate results by using 1D Timoshenko’s beam element.
Hence, to inspect the 3D contact modelling between the rollers, indenter, and beam with Timoshenko’s 1D FE model and theory calculations, a beam of a square cross-section with an edge length of 7 mm was selected while keeping all the other parameters of the 3D FE model constant. The ratio of the dimension of the cross-section to the axial dimension for this validation is 0.1 (i.e., 7 mm/70 mm). The 1D FE model of the beam modelled using Timoshenko’s beam elements is shown in Figure 16. The setup is similar to that of the 3D beam model, as explained in Section 5.2, with a beam cross-section of 7 × 7 mm. A 3D beam model setup with the same cross-section is shown in Figure 17. For both the 1D and 3D FE beam models, force vs. displacement was recorded at the centre of the beam, which replicates the experimental setup.
Based on the Timoshenko’s beam theory and study validated by Underwood et al. [33], for a beam with a rectangular cross-section subjected to three-point bending, the central deflection of the beam is given by Equation (1):
δ = δbend + δshear + δcrack
where δ is the total deflection at the centre of the beam (mm), δbend is the deflection at the centre of the beam due to pure bending (mm), δshear is the deflection at the centre of the beam due to transverse shear (mm), and δcrack is the deflection at the centre of the beam due to crack only (mm).
Since the FE models are considered prior to failure in the beams, the deflection in the beam due to cracking, δcrack, is ignored in this study. The deflections δbend and δshear for a square cross-section beam under three-point bending is given by Equations (2) and (3), respectively [34]:
δ bend = P L 3 4 E b 4
δ shear = 0.6   1 + v P L E b 2
where P is the central load (N), δ is the deflection at the centre of the beam (mm), E is the Modulus of elasticity (N/mm2), ν is the Poisson’s ratio, b is the side of the square cross-section (mm), and L is the length between the roller supports (mm).
Using Equations (1)–(3), the relationship between the central load and beam deflection of the centre of the beam is computed, as shown in Equation (4).
P = δ E b 2 L L 2 b 2 + 0.6   1 + v
The modulus of elasticity (E) considered for the simulation of the 1D and 3D beam and the calculation using the beam theory was 55 GPa, which was the averaged modulus elasticity of the LPBF-printed AlSi12 tensile samples in horizontal samples, similar to the orientation in which the samples were printed (mentioned in Section 5.1). The Poisson’s ratio of the LPBF-printed AlSi12 parts was assumed to be 0.33 based on the recent studies [35,36,37]. Moreover, the total deflection in the beam was taken as 0.7 mm, such that the beam was in an elastic region, and the corresponding force was recorded.
The force vs. beam deflection of the two FE beams, i.e., 1D beam element model and 3D brick elements with contacts, along with the calculations using Timoshenko’s Beam theory, is shown in Figure 18. It was found that the 3D beam with contact modelling gave results that were approximately the same as those calculated by using the beam theory and also 1D FE beam elements. Hence, the contact modelling of the FEA model was considered optimum for inverse material modelling.

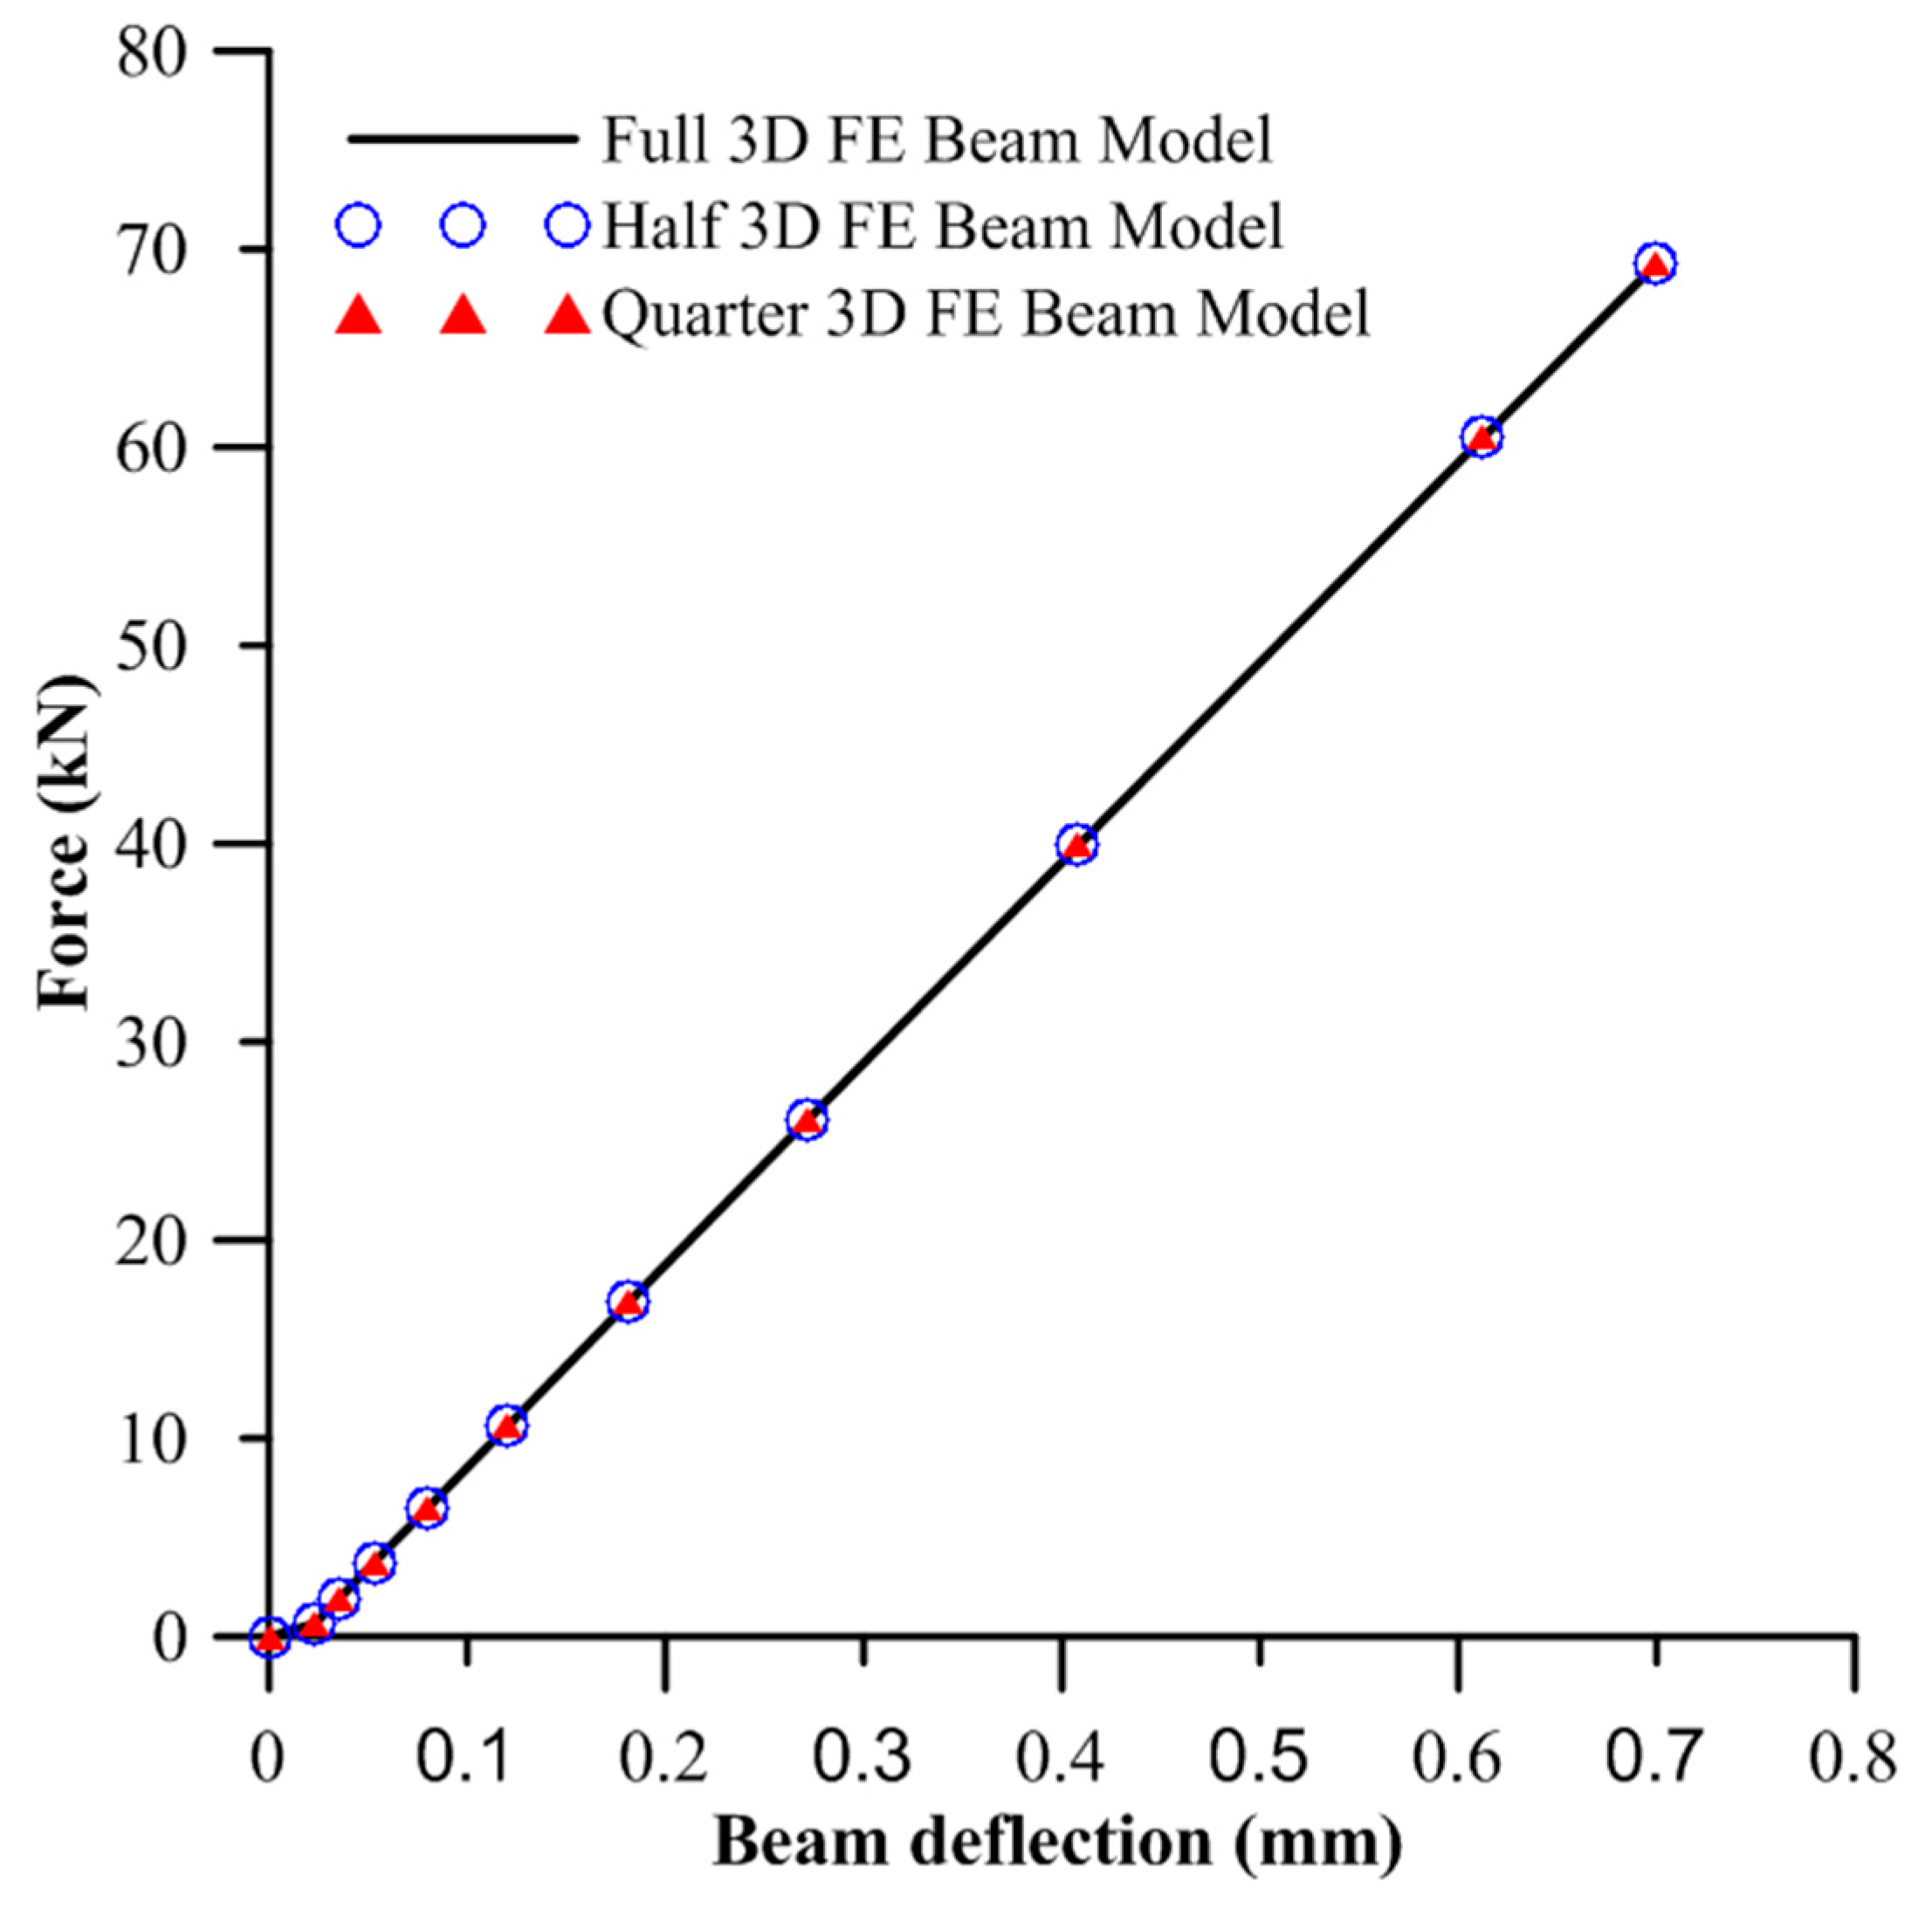
5.4. Validation of Quarter Beam Model for Inverse Material Modelling

The simulation of the 3D solid FE model at the optimum mesh density would take approximately 20 min for analysis. In inverse material modelling, the same model would be run simultaneously a number of times by varying parameters until the desired condition is met. It is anticipated that the inverse modelling using the simulation of the full model would be computationally expensive. Additionally, the beam has two planes of symmetry with respect to geometry and boundary conditions. Hence, the two planes of symmetry of the beam were considered to divide the 3D solid FE model into the half and quarter full model.
The FE setups of the full solid beam, half solid beam, and quarter solid beam are shown in Figure 19. The boundary conditions and mesh density considered for each of the beam fractions was described in Section 5.1 and Section 5.2. Additionally, the boundary conditions for planes of symmetry were applied such that we obtained the following:
  • For half and quarter model of the solid beam, the highlighted face of the beam parallel to the XY plane was constrained for translation in Z and rotation in X and Y directions.
  • For the quarter of the solid beam, the highlighted face of the beam parallel to the XY plane was constrained for translation in X and rotation in Y and Z directions.
The reaction force and indenter deflection were recorded as explained in Section 5.2. The force vs. beam deflection of the three FEA models is shown in Figure 20. It was found that by reducing the beam fractions to half and a quarter of the full beams, using the plane of symmetries, it had a negligible effect on the force vs. deflection behaviour of the 3D FE model. Furthermore, the total computation time for the full, half, and quarter 3D FE beam model was 19.5 min, 6.05 min, and 2.7 min, respectively. The computation time to simulate the quarter solid 3D FE beam was reduced to approximately 14% of the time taken to simulate the full solid 3D FE beam. Therefore, based on these results, it was found that the quarter solid beam would be suitable for the simulation of the 3D FE model with reduced computation space and time, which is desirable for inverse material modelling.

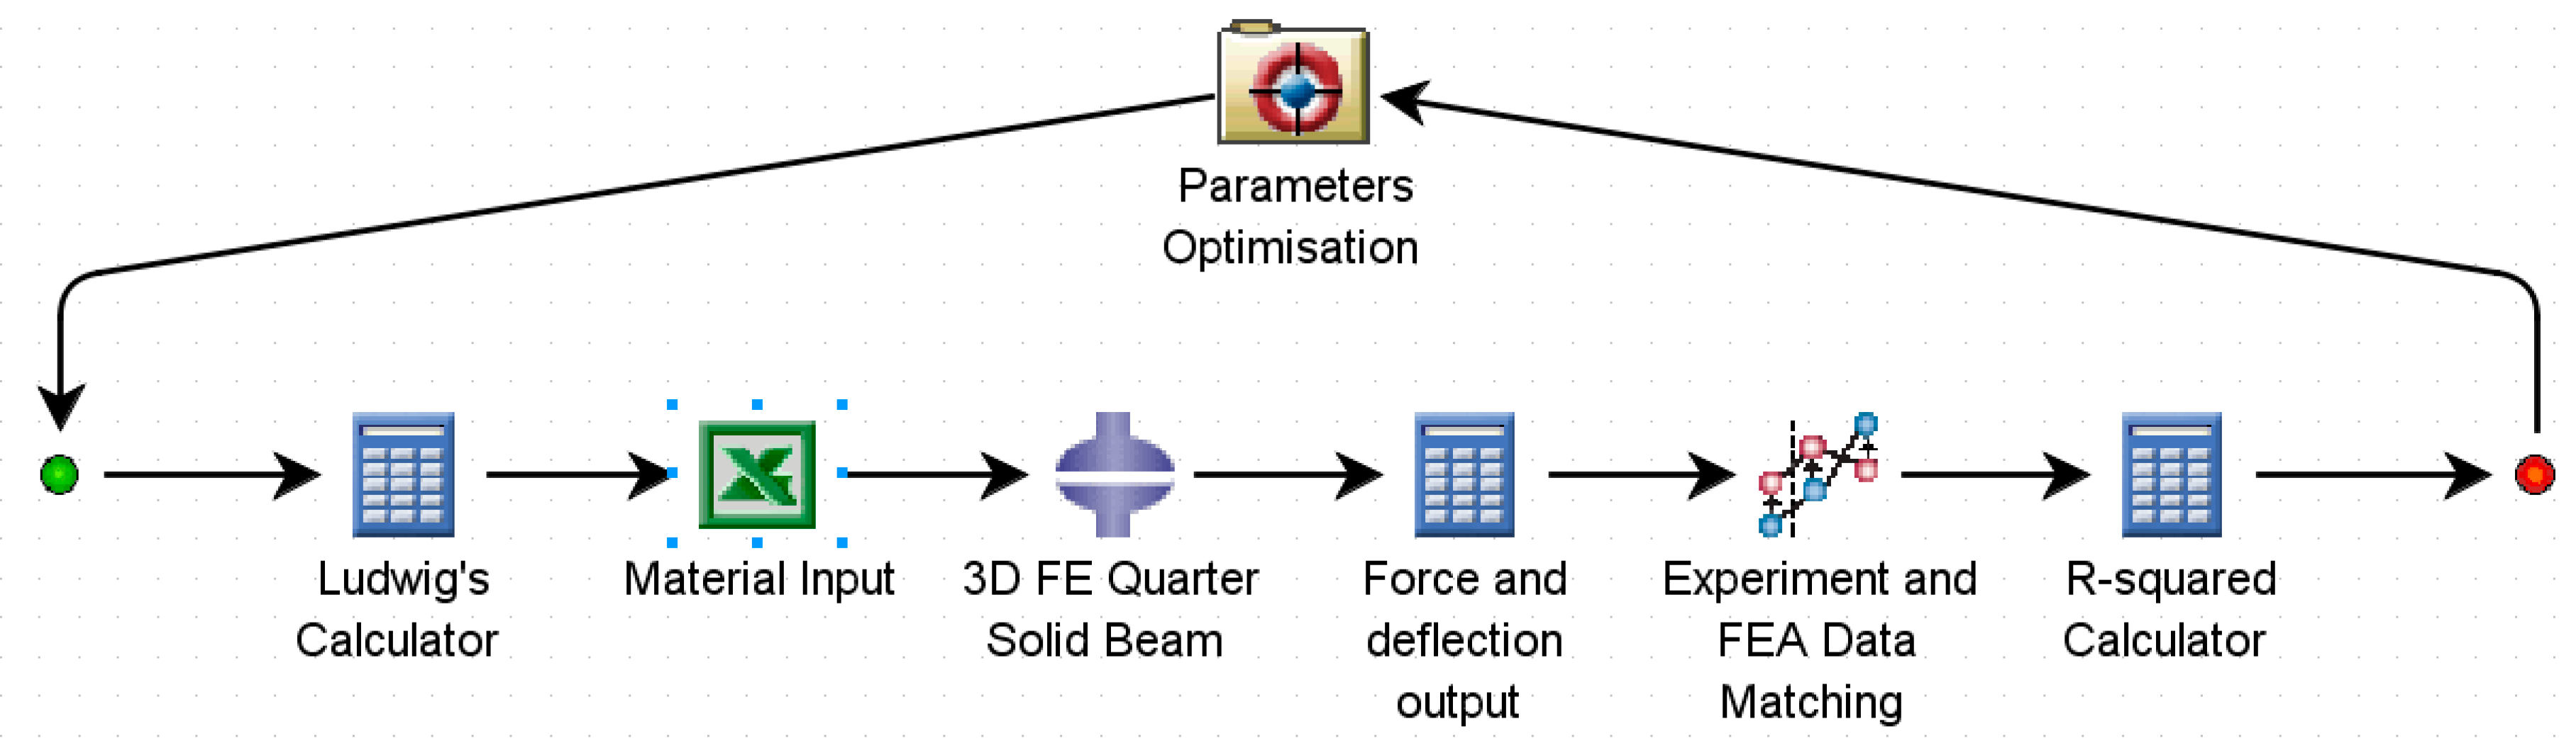
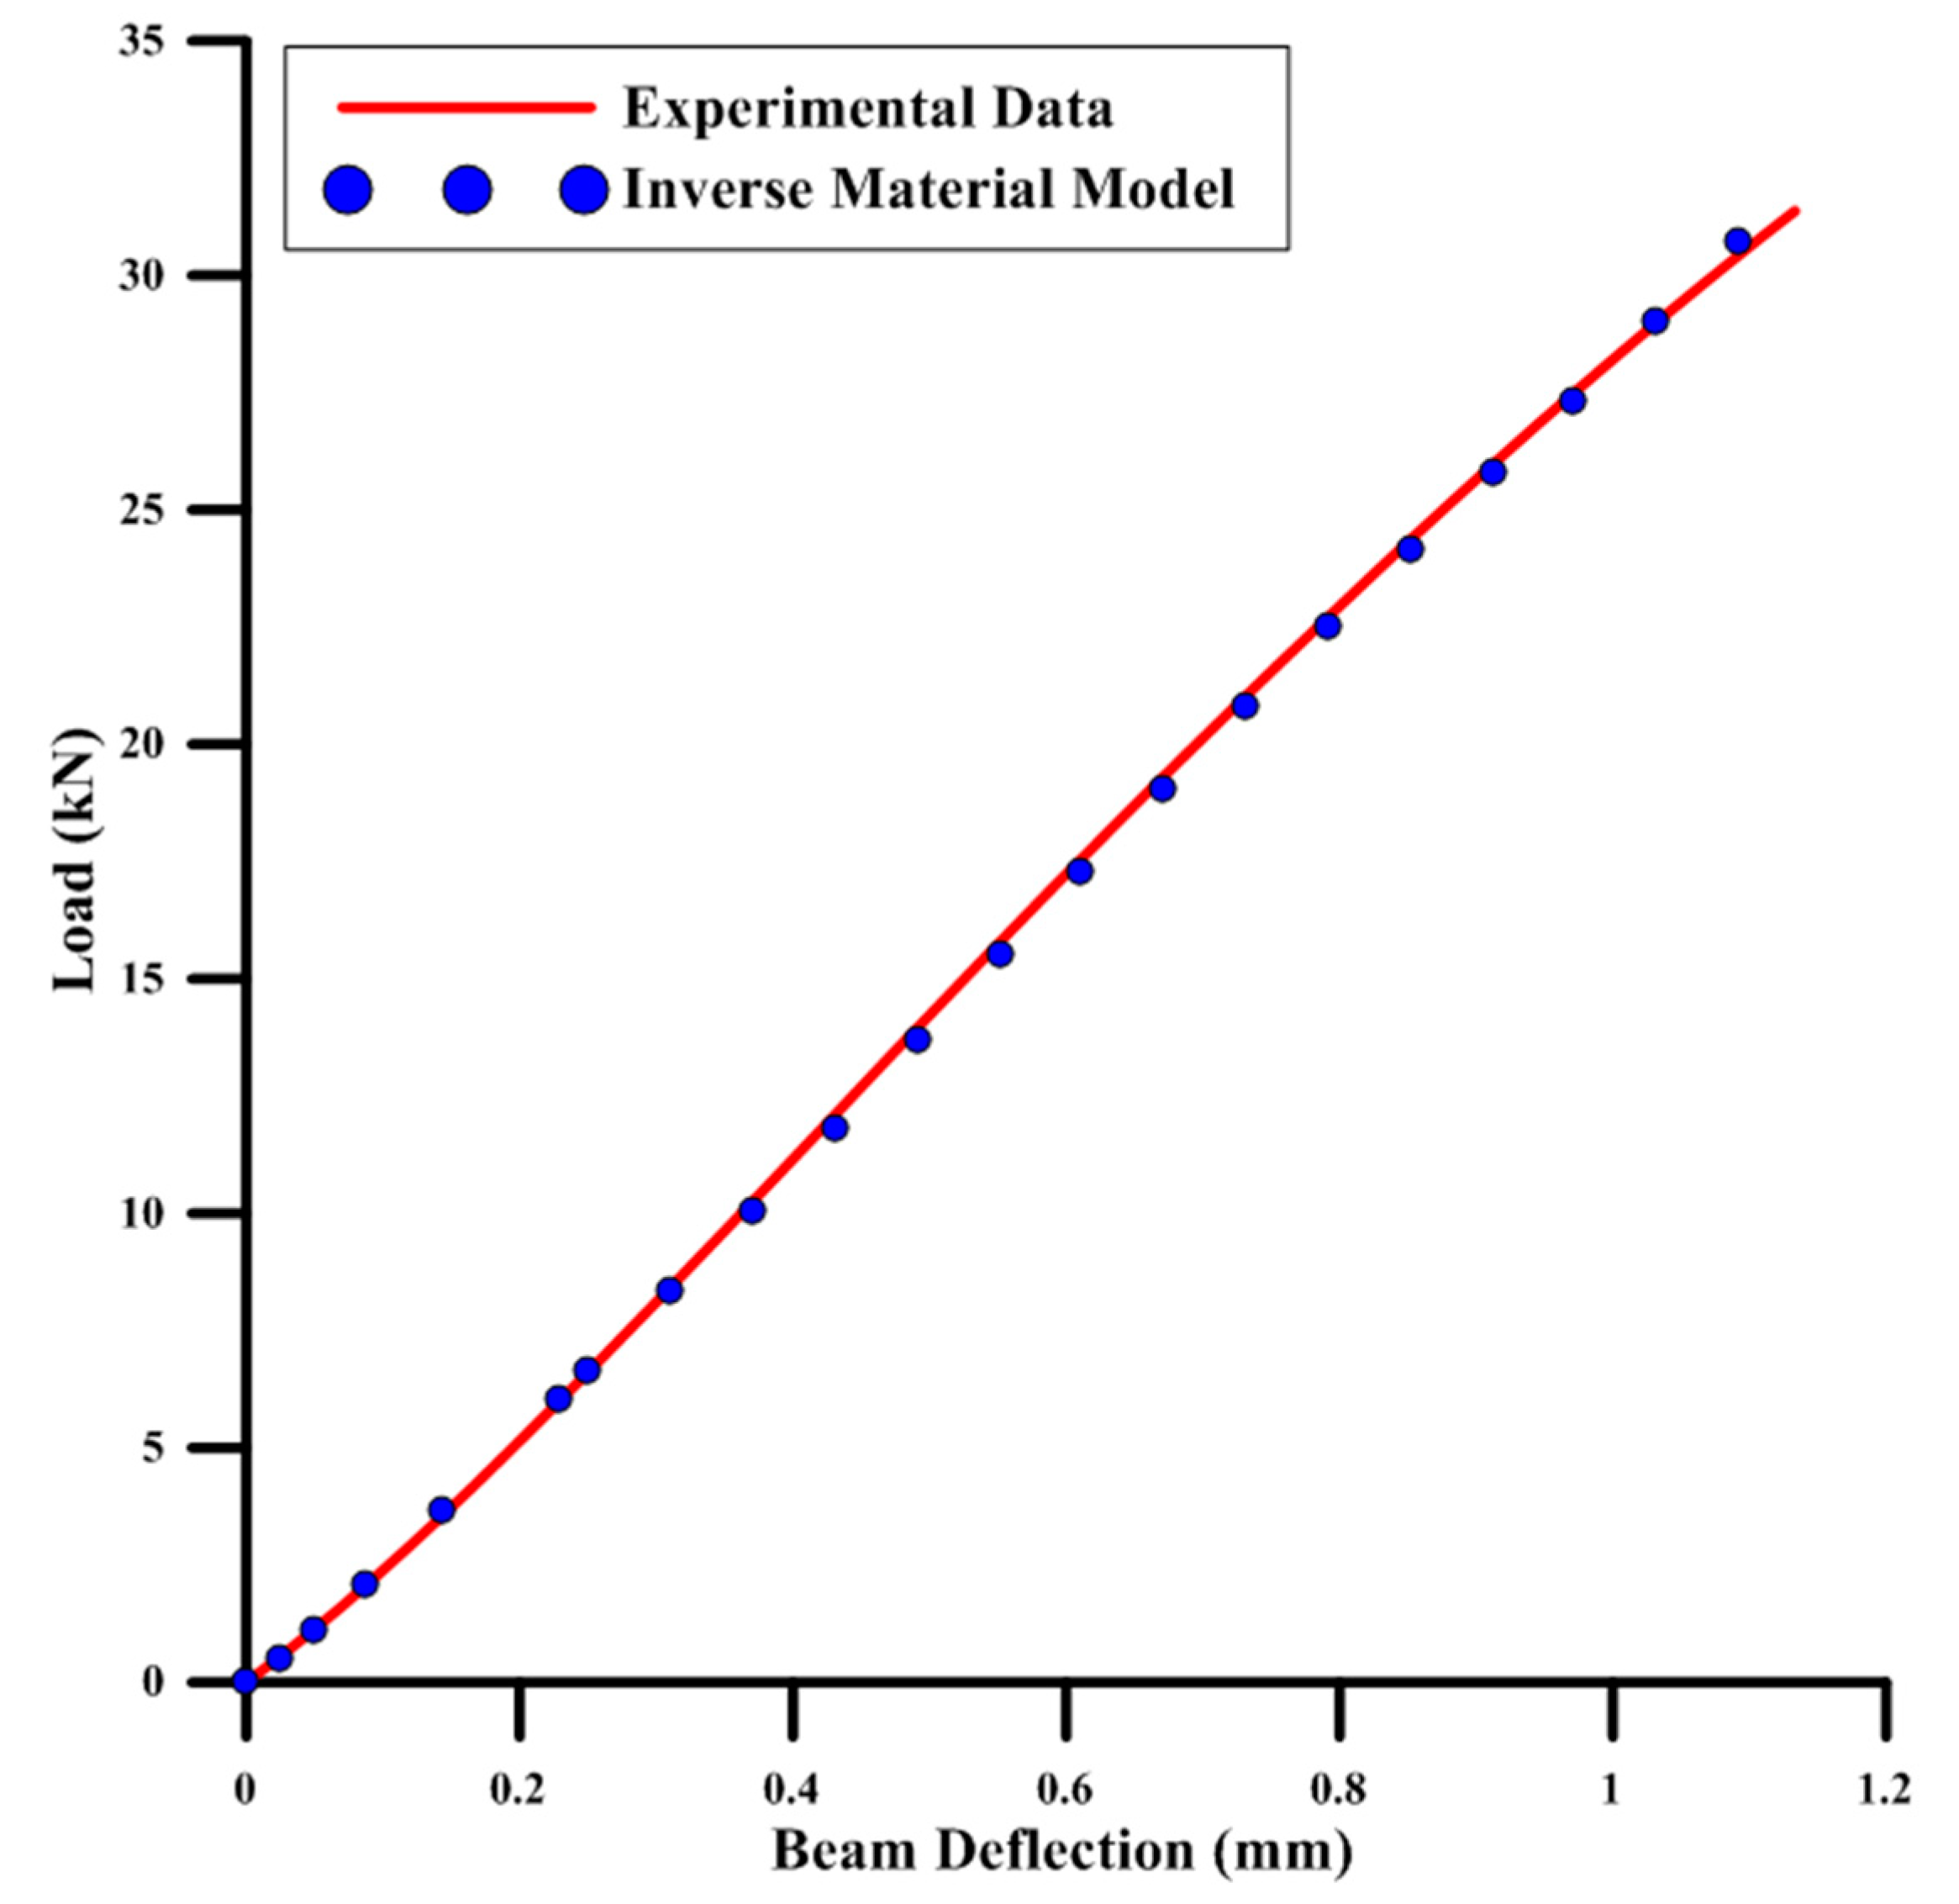
5.5. Solid-Beam Material Modelling

Rashid et al. [26] carried out tensile tests on the LPBF-printed AlSi12 in different orientations, and the plastic behaviour of the LPBF-printed AlSi12 could be predicted by using strain-hardening equations. Ono [38] found that, out of the different strain-hardening equations, Ludwig’s strain-hardening equation could be used to predict the plastic behaviour of a wider range of experimental data. The Ludwig’s equation is described in Equation (5). However, the challenge with the Ludwig’s equation is that an optimum selection of three parameters is required to predict the plasticity of experimental data accurately. This is, however, possible with the help of computer analysis.
σ = σ 0 + K ϵ p n
where σ is the true stress (MPa), σ0 is the yield stress (MPa), K is the strength coefficient (MPa), εp is the plastic strain, and n is the strain hardening index.
In order to determine the material model of LPBF-printed solid beam under the three-point bending test, four parameters were required, namely the modulus of elasticity, yield stress, Ludwig’s strength coefficient, and strain hardening index. The parameters are to be found out by optimising each parameter such that the FE simulation of the 3D solid beam during bending is close to the experimental bend test. This parameter optimisation requires a sophisticated tool which not only automates simulations by varying parameters but also optimises the parameter search. Isight is one such tool which works in conjunction with ABAQUS by inputting parameters, simulating an FE model in ABAQUS, and extracting data from ABAQUS.
In this study, Isight was used as a parameter optimisation tool to determine the values of the abovementioned four parameters. Figure 21 shows the process workflow of parameter optimisation used to determine the solid material model. The functions of each block in the process workflow are described below.
Ludwig’s calculator—This block calculates the true stress based on yield stress, Ludwig’s strength coefficient, and strain-hardening index, which are inputted from the parameters’ optimisation block.
Material Input—This block creates arrays of true stress and plastic strain values, along with the modulus of elasticity variable, which is then inputted to the next ABAQUS block as a material model.
3D FE Quarter Solid Beam—This block runs a simulation of the quarter beam (as explained in Section 5.4) with inputted material properties.
Force and deflection output—This block extracts the indenter reaction force and deflection from the previous block and converts them in absolute values.
Experiment and FEA Data Matching—This block plots FEA indenter force vs. deflection and compares this with experimental force vs. deflection plot (as shown in Figure 11).
R-squared Calculator—This block calculates the R-squared value between the experimental and FEA plots.
Parameters Optimisation—This block optimises the material parameters in order to maximise the R-squared value. The optimisation is carried out by using the Direct Penalty method. The objective of the optimisation is to maximise the R-squared value when data-fitting the FE simulation results (driven by changing parameters) over the experimental data.
The inverse material model for the solid beam was determined as shown in Figure 22. Based on the parameter optimisation workflow on Isight, the material model of the solid beam is as mentioned in Table 4. This material model was used for the simulation of AlSi12 LPBF beams printed with different BESO design variations (i.e., 1 × 1, 8 × 3, and 12 × 3 beams) to predict the bending behaviour of these beams under the same loading conditions.

6. Simulation of BESO-Topology-Optimised Beams

In this section, the material model obtained from the inverse material modelling of three LPBF-printed AlSi12 solid beam in the three-point bend test was used to validate the bending behaviour of the different BESO-topology-optimised beam. The FE models for each of the TO design variations were based on the validations that were presented in Section 5. The considerations were carried out to set up the three BESO-optimised beams were as follows.
  • The quarter beam was selected for FE model setup.
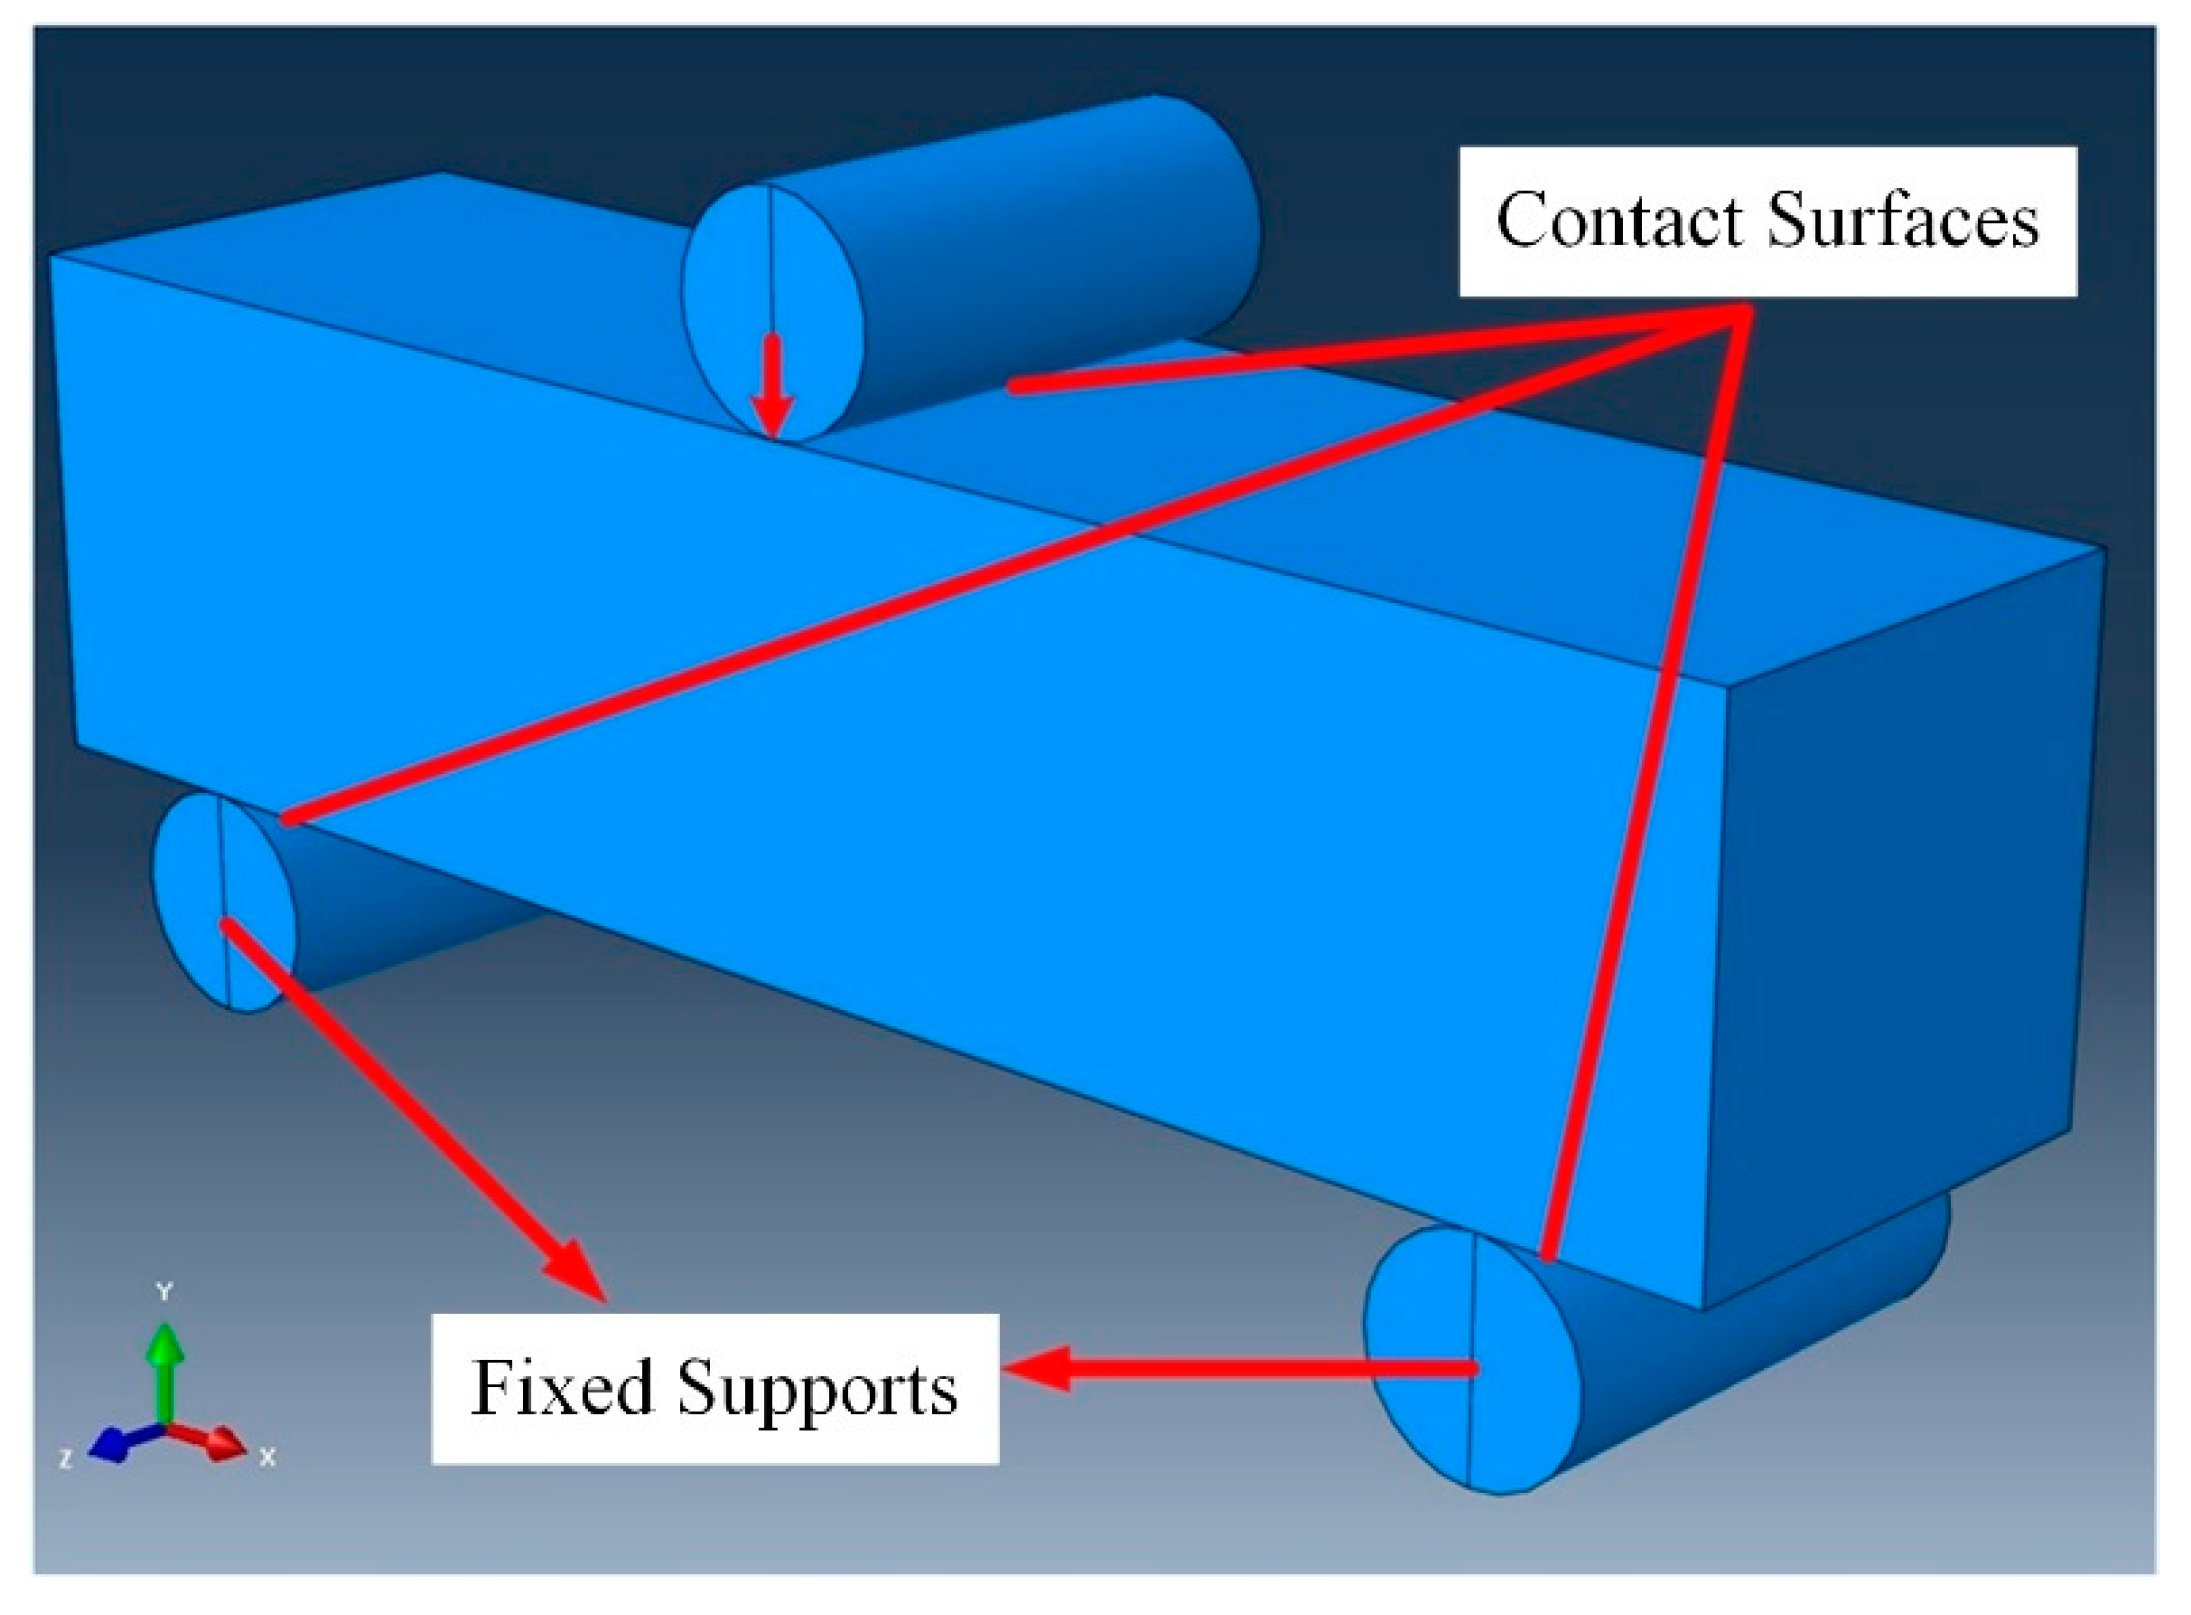
  • The positions of the indenter and roller were as per the experimental setup (explained in Section 5.1).
  • The indenter and roller were set up as discrete rigid parts, while the beam was set as a deformable part.
  • Eight-node brick element was selected for the beams.
  • The material model defined was as per the inverse material model of the LPBF-printed solid beam under the three-point bend test, as mentioned in Table 4.
  • Contact interaction was set up as per the validated contact modelling described in Section 5.3.
  • Displacement boundary conditions applied to indenter to mimic experimental setup.
  • Planes of symmetries’ boundary conditions were applied as described in Section 5.4.
  • Mesh-convergence study was carried out for the three BESO-optimised beams as described in Section 6.1.
  • The reaction force and displacement of the reference point on the indenter were extracted to plot force vs. beam deflection from the FE output file, as described in Section 5.2.
The FE setups of the three BESO-optimised beams for simulation using the solid beam material model are shown in Figure 23.

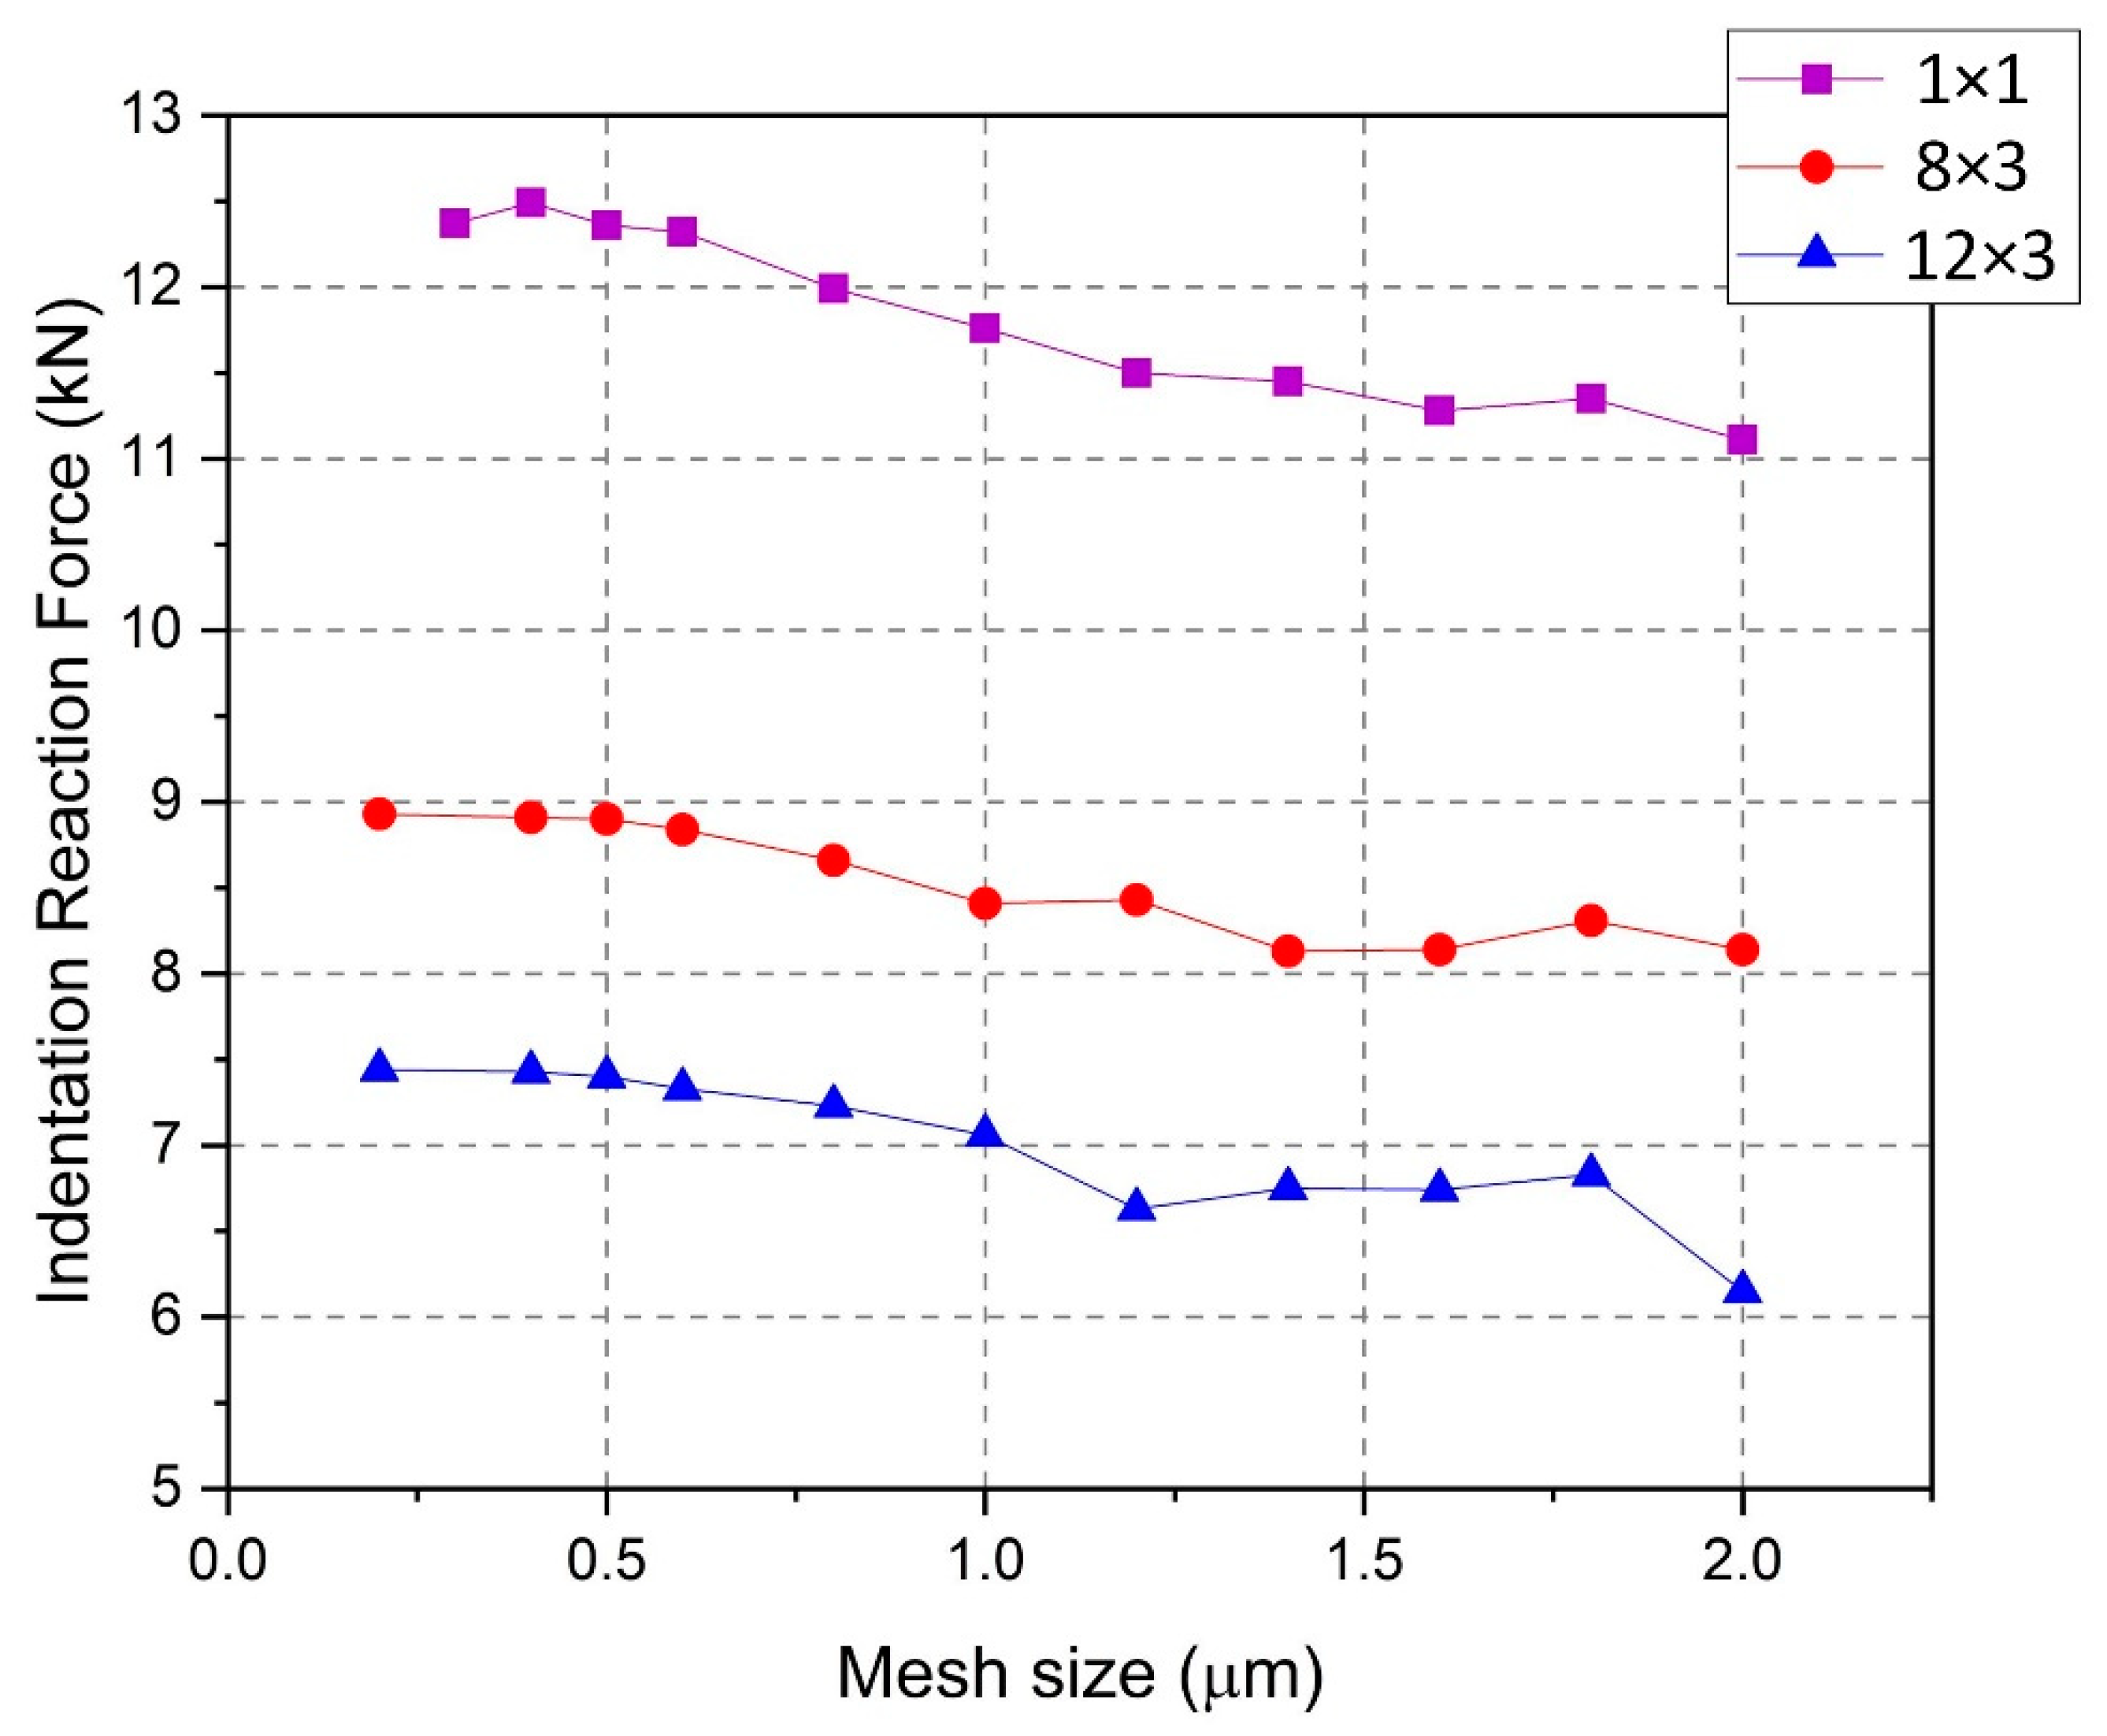
6.1. Mesh Convergence for BESO-Optimised Beams

The mesh-size validation was performed for the FE of the solid beam (as described in Section 5.2) to select the optimum mesh size that would yield accurate results without increasing the computation time. Similarly, the optimum mesh size for the three BESO design variation beams was carried out with convergence validation. The displacement boundary condition of the indenter was selected such that each of the BESO-optimised beams was in the elastic region of the material. The edge side of the eight-node brick elements was varied until the change in the indenter reaction force was within 10%.
The different edge length of the eight-node brick elements for the 1 × 1, 8 × 3, and 12 × 3 BESO beams are tabulated in Table 5, Table 6 and Table 7, respectively. Furthermore, the relationship between the indenter reaction forces with respect to the mesh size for the three BESO beams is shown in Figure 24. For all the three beams, it was found that, as the mesh density was refined, the indenter reaction force increased until it reached a plateau. The mesh size in this plateau region was considered to be the optimum mesh size for the FE simulation of the respective BESO beam. It was found that the reaction force plateaued around a mesh size of 0.5 mm. Hence, the edge-side length of 0.5 mm was selected for the three BESO beams for simulation using the solid beam material model.

6.2. Comparison of Experimental Data with Simulation Results of BESO-Optimised Beams

The three BESO-optimised beams were simulated by using the solid beam material model and using optimum mesh density, as explained in the previous sections. The simulations of the three beams were considered till the point of first failure. This was carried out to avoid complex crack material models, as these were out of the scope of this study. Furthermore, the average of three bend-test results of each BESO beam type was considered instead of considering representative bend test curve. Figure 25 shows the comparison between the average experimental bend test results with the FEA results for the three BESO-optimised beams (i.e., 1 × 1 beam, 8 × 3 beam, and 12 × 3 beam). It was observed that the simulation of the three BESO beams with solid beam material model did not predict the experimental bend test of the respective BESO beams.
It could be observed from Figure 11 and Figure 25 that the experimental bend-test curves for the three BESO beams had a straight section and a curve which could be represented by a polynomial before failure. In other words, it could be said that, in the straight section of the bend curve, most of the LPBF-printed BESO beams are in the elastic regime of the LPBF AlSi12 material, while in the curve section, the beams are in the plastic regime of the LPBF AlSi12 material. On the contrary, from the simulation of the three BESO beams, it could be seen that the simulation bend curve is a straight line. In their study, Calleja-Ochoa et al. [39] studied the design of ultralightweight microstructural features using octahedron cells. They found a similar performance of their parts wherein a ‘fitting factor’ was implemented to adjust the difference in mechanical performance of the designed and manufactured parts.
It could be predicted that, for the simulation of three BESO beams, the material did not enter the plastic regime of the material property. However, the material model from the solid LPBF beam had defined elastic and plastic regimes of the material, which should have shown an effect in the simulation of the three BESO beams. Therefore, it could be concluded that the three LPBF-printed BESO beams show a different material model when compared to the solid LPBF-printed beam in the same orientation.

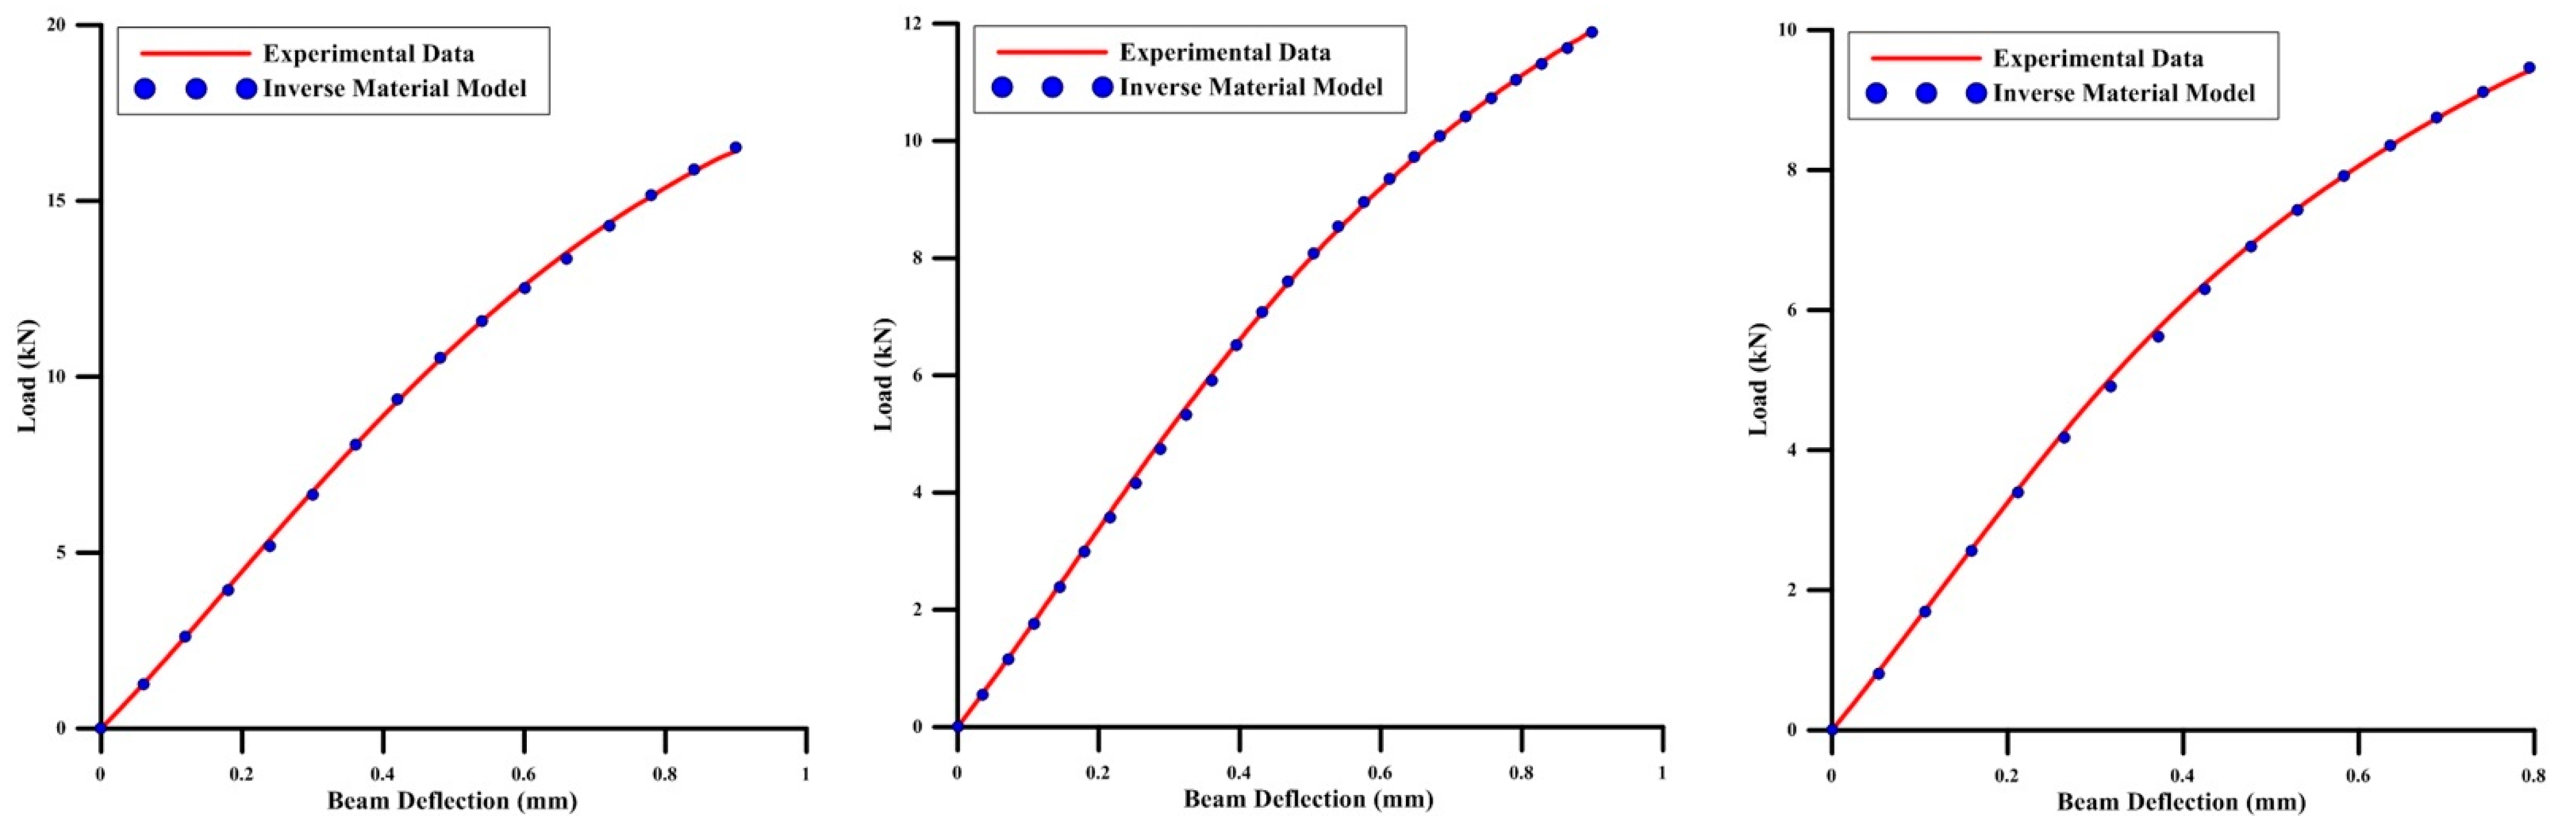
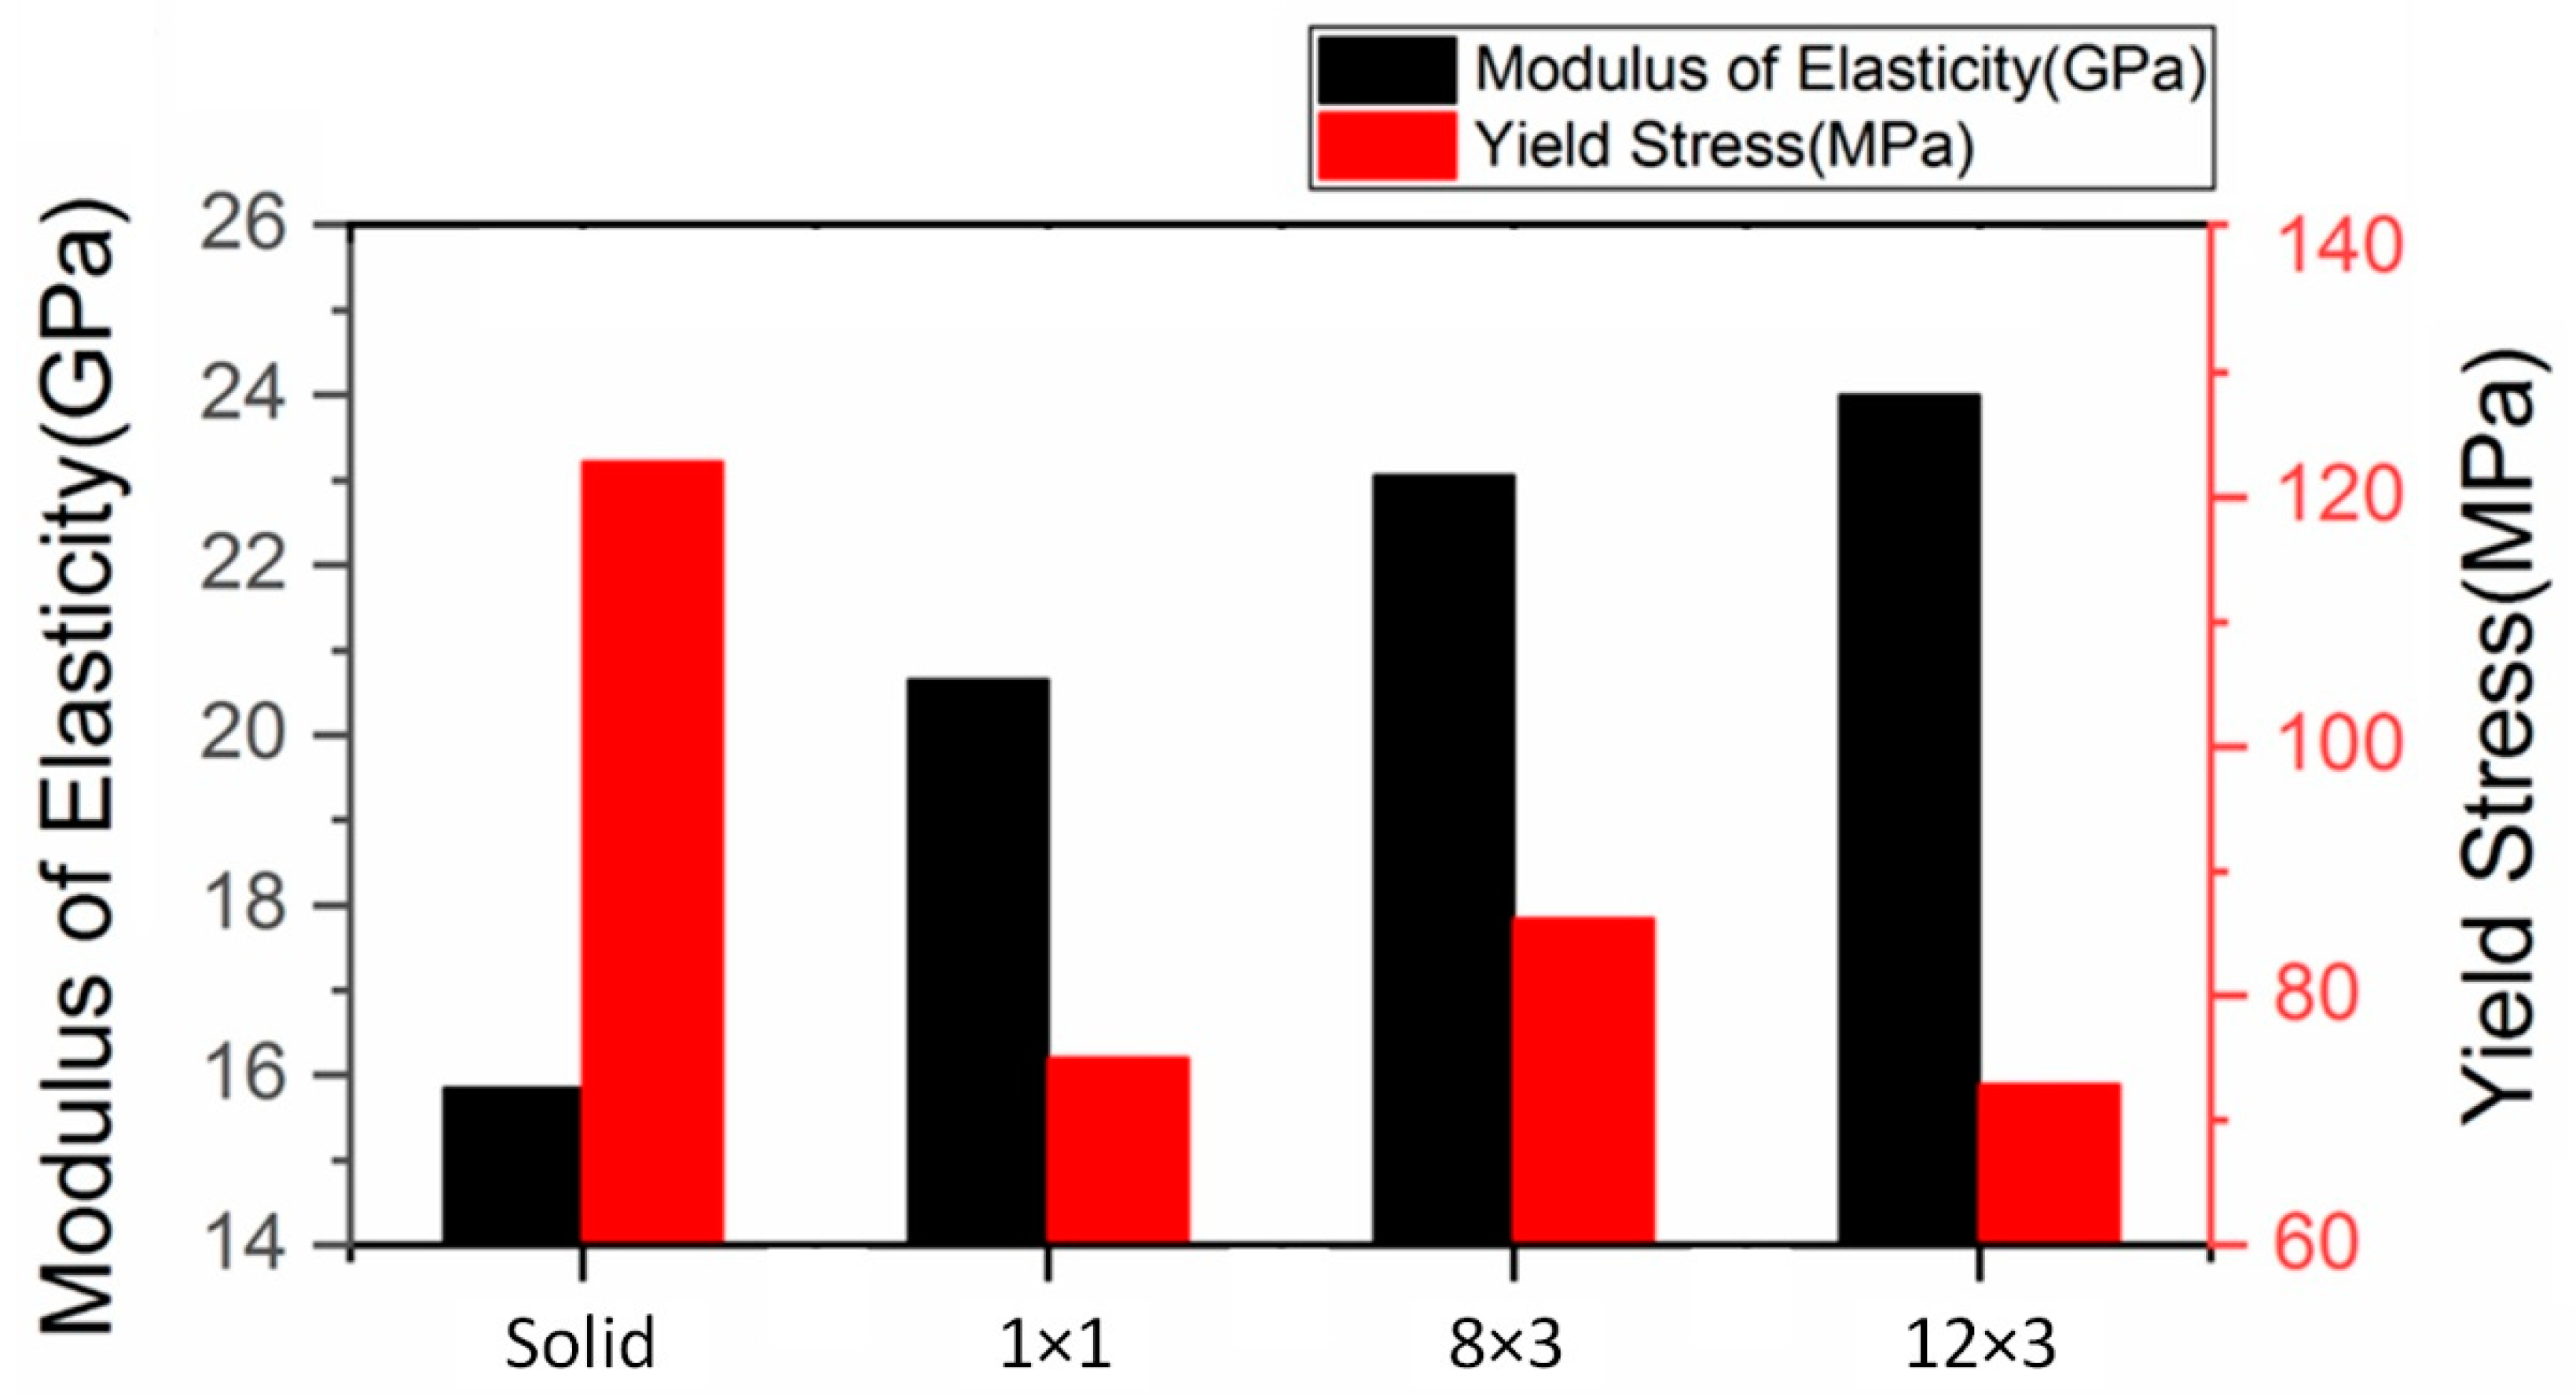
7. Material Models for BESO Design Beams

The material model used to predict the bend-test curve of the three BESO-optimised beams was required in order to understand the effect of the design on the material properties of LPBF-printed material. The inverse material modelling of the three BESO-optimised beams was performed similar to the inverse material modelling performed for the LPBF-printed solid beam, as described in Section 5.5. The modulus of elasticity (E), yield stress (σ0), Ludwig’s strength coefficient (K), and strain hardening index (n) were varied for the three BESO-optimised beams, until the simulation bend-test curve replicated the experimental bend-test curve.
Table 8 shows the material model parameters for the three BESO beams, along with the solid beam, obtained through inverse material modelling. Additionally, the comparison of experimental bend-test curve with inverse material modelling of 1 × 1, 8 × 3, and 12 × 3 beams is shown in Figure 26. Furthermore, it was observed that the LPBF-printed BESO-optimised beams of AlSi12 had a higher modulus of elasticity when compared to the LPBF-printed solid beams. The modulus of elasticity of the 1 × 1, 8 × 3, and 12 × 3 beams was approximately 37%, 52%, and 59% higher than the modulus of elasticity of the solid beam, respectively. Furthermore, it was observed that the LPBF-printed BESO-optimised beams of AlSi12 had lower yield stress when compared to the LPBF-printed solid beam. The yield stress of the 1 × 1, 8 × 3, and 12 × 3 beams was approximately 66%, 61%, and 67% lower than the yield stress of the solid beam, respectively.
The BESO-optimised beams were obtained by reducing the volume of the solid beam by 50%. The BESO optimisation was performed by optimising the 2D plane of the solid beam. Therefore, the reduction in volume of the beam could directly correspond to the reduction in the area of the beam. This could be seen in Figure 1, Figure 2, Figure 3, Figure 4, Figure 5, Figure 6 and Figure 7. This implies that the LPBF printing of BESO design beams had 50% less printing area per layer when compared to the solid beam. As reported by Rashid et al. [26], energy per layer drives the relative density of the LPBF-printed AlSi12. It was found that larger printing areas led to lower relative densities and, consequently, less stiff material. Therefore, it could be concluded that by optimising the beam by making a 50% reduction in volume, the stiffness of the material was improved by reducing the printing area by 50% when compared to the solid beam. This points to another consideration that is to be accounted for while designing parts to be printed using the LPBF process.
Figure 27 shows the variation in modulus of elasticity and yield stress of the material models of the LPBF-printed AlSi12 beams with different design variations. It could be suggested that the yield stress of LPBF-printed AlSi12 depends on the design of the beam under the three-point bend test. In the case of the solid beam, the material has less stiffness. On the other hand, the BESO-design-variation beams showed that the yield stress of LPBF-printed AlSi12 is affected by the design variables, such as the number of lattice units. Therefore, direct application of solid tensile/mechanical properties could not be considered while designing mechanical parts. Understanding the relationship between the mechanical properties and design of parts would require additional work, which should be further investigated in future studies.

8. Conclusions

A detailed study was carried out to investigate the optimised design of a beam subjected to three-point bending, using topology optimisation. With the help of BESO module in conjunction with ABAQUS, three different topology-optimisation solutions were obtained to reduce the volume of the beam by 50%, while maximising the stiffness of the beam. The beam samples with different design variations (i.e., solid, 1 × 1, 8 × 3, and 12 × 3 beams) were printed by using a laser-powder bed fusion (LPBF) process, AlSi12 powder, and the best process parameters to yield dense material.
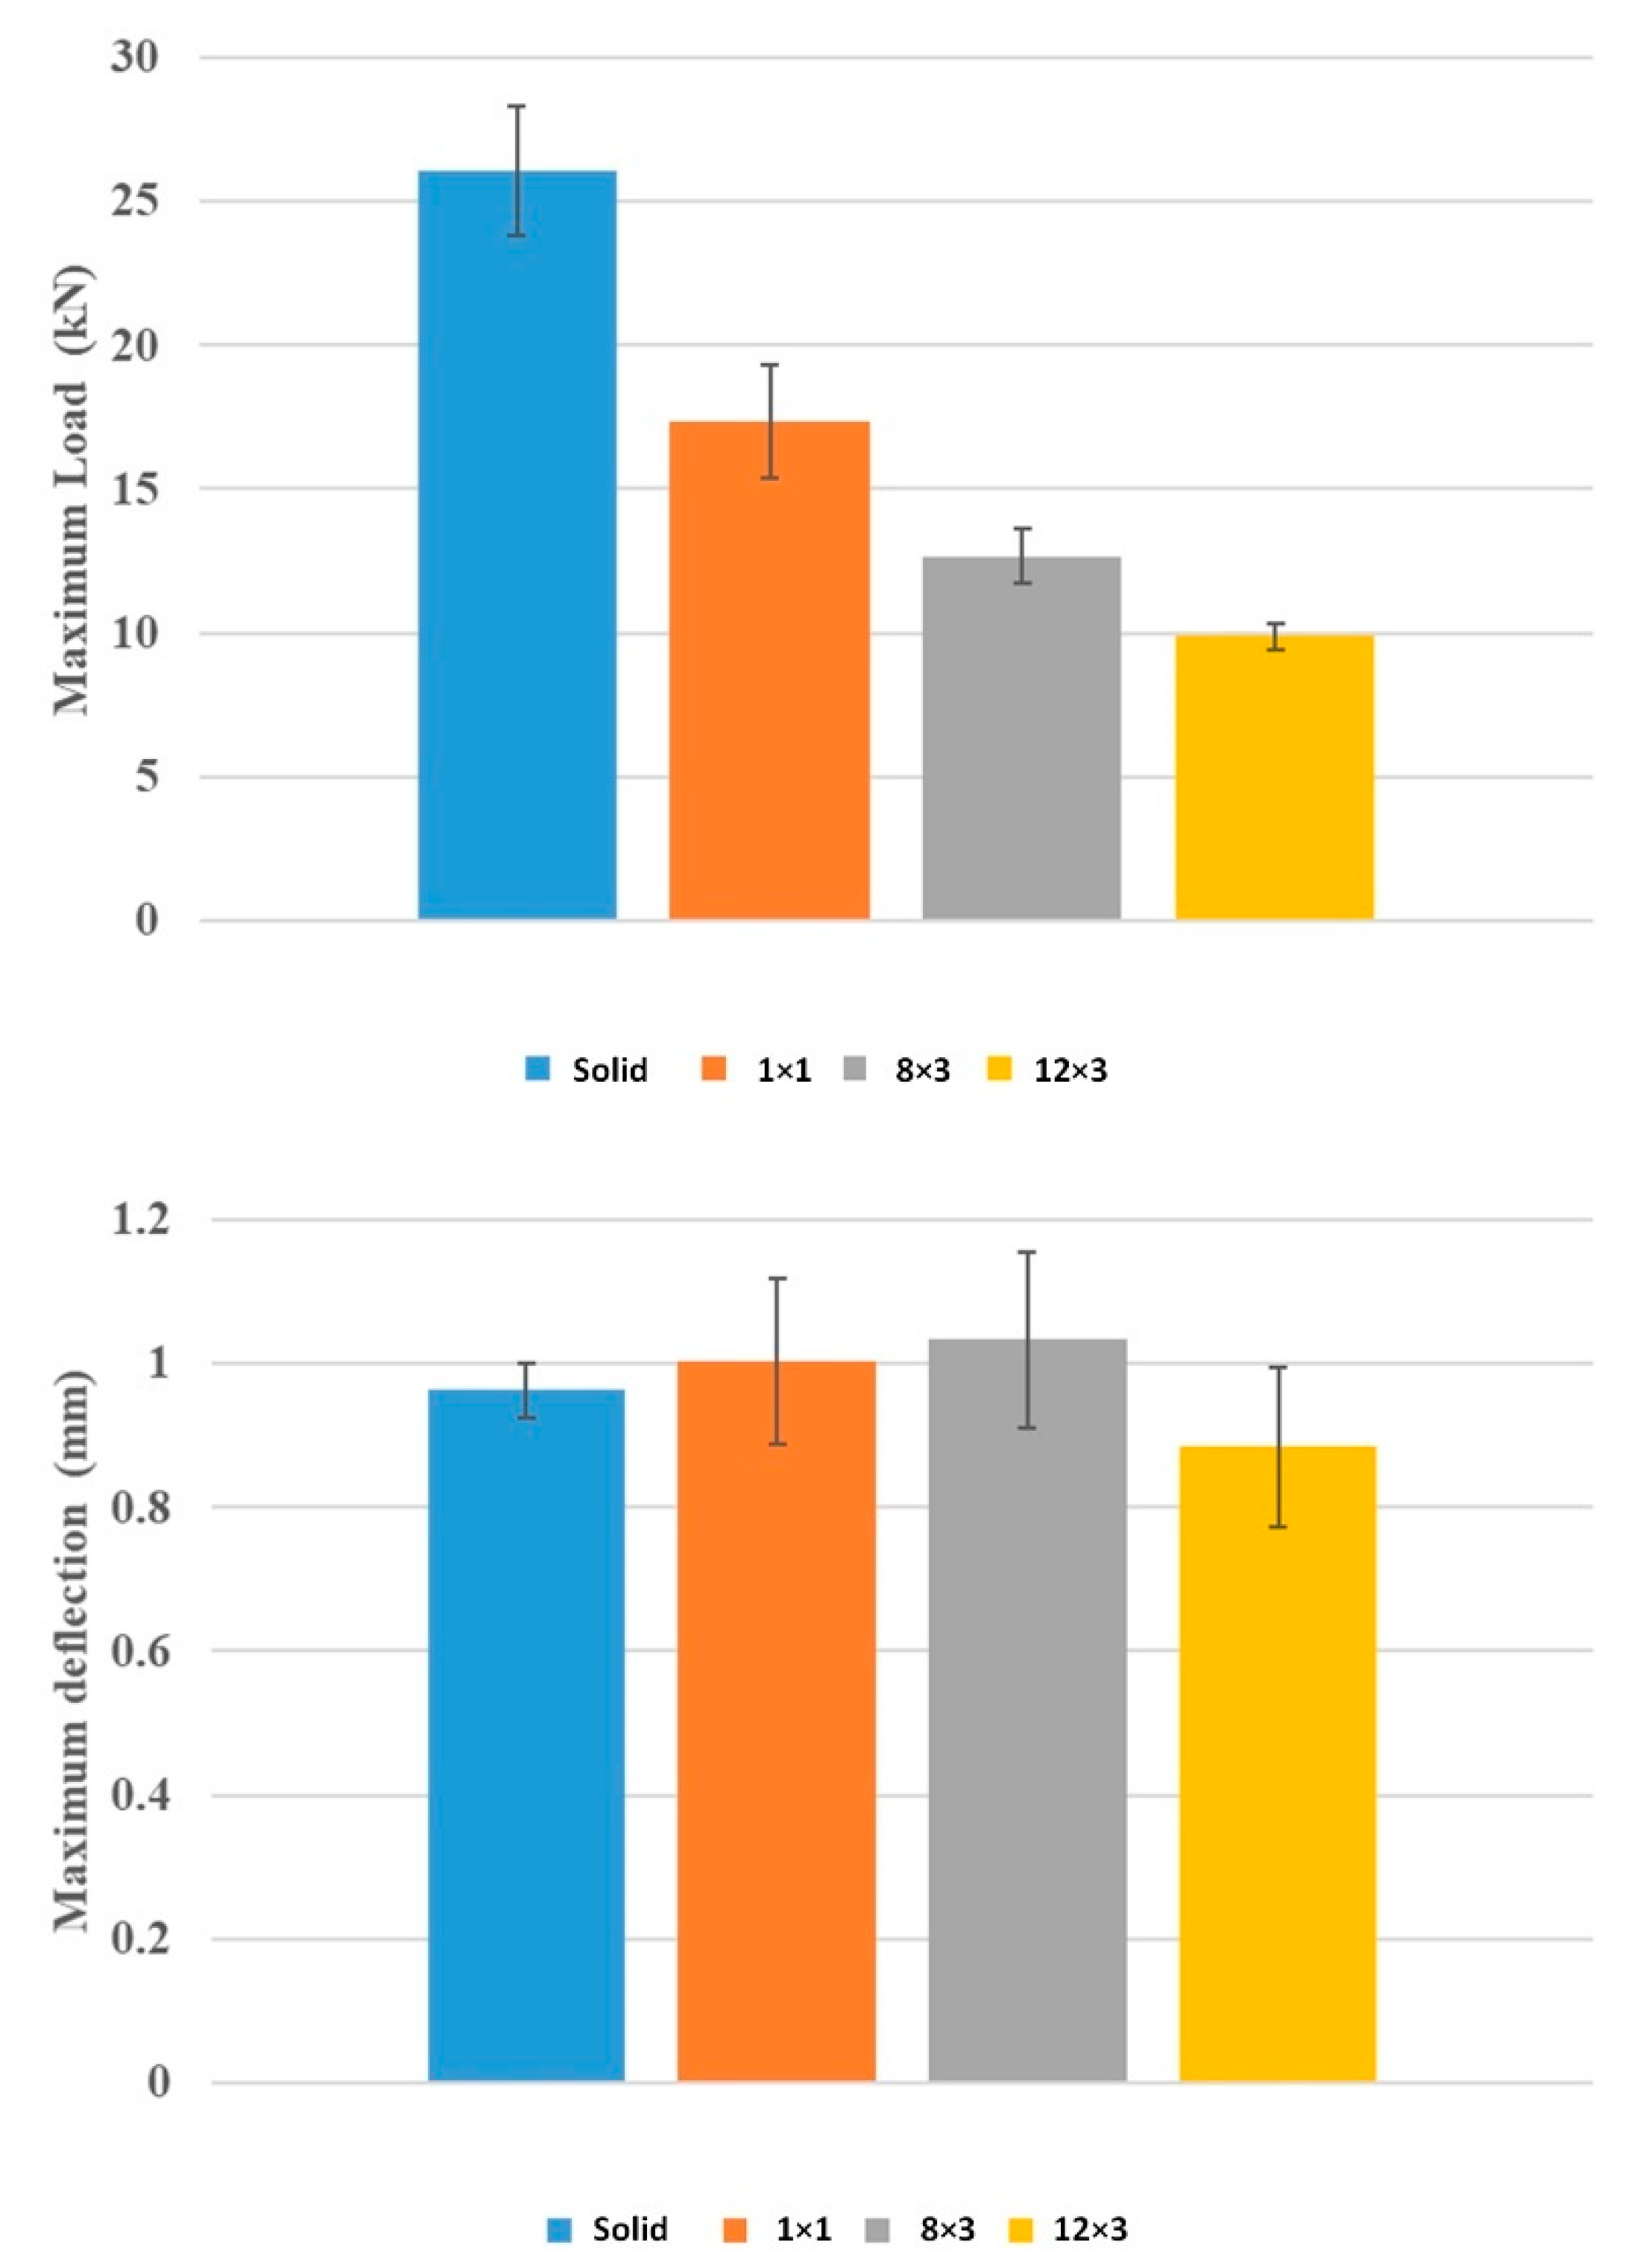
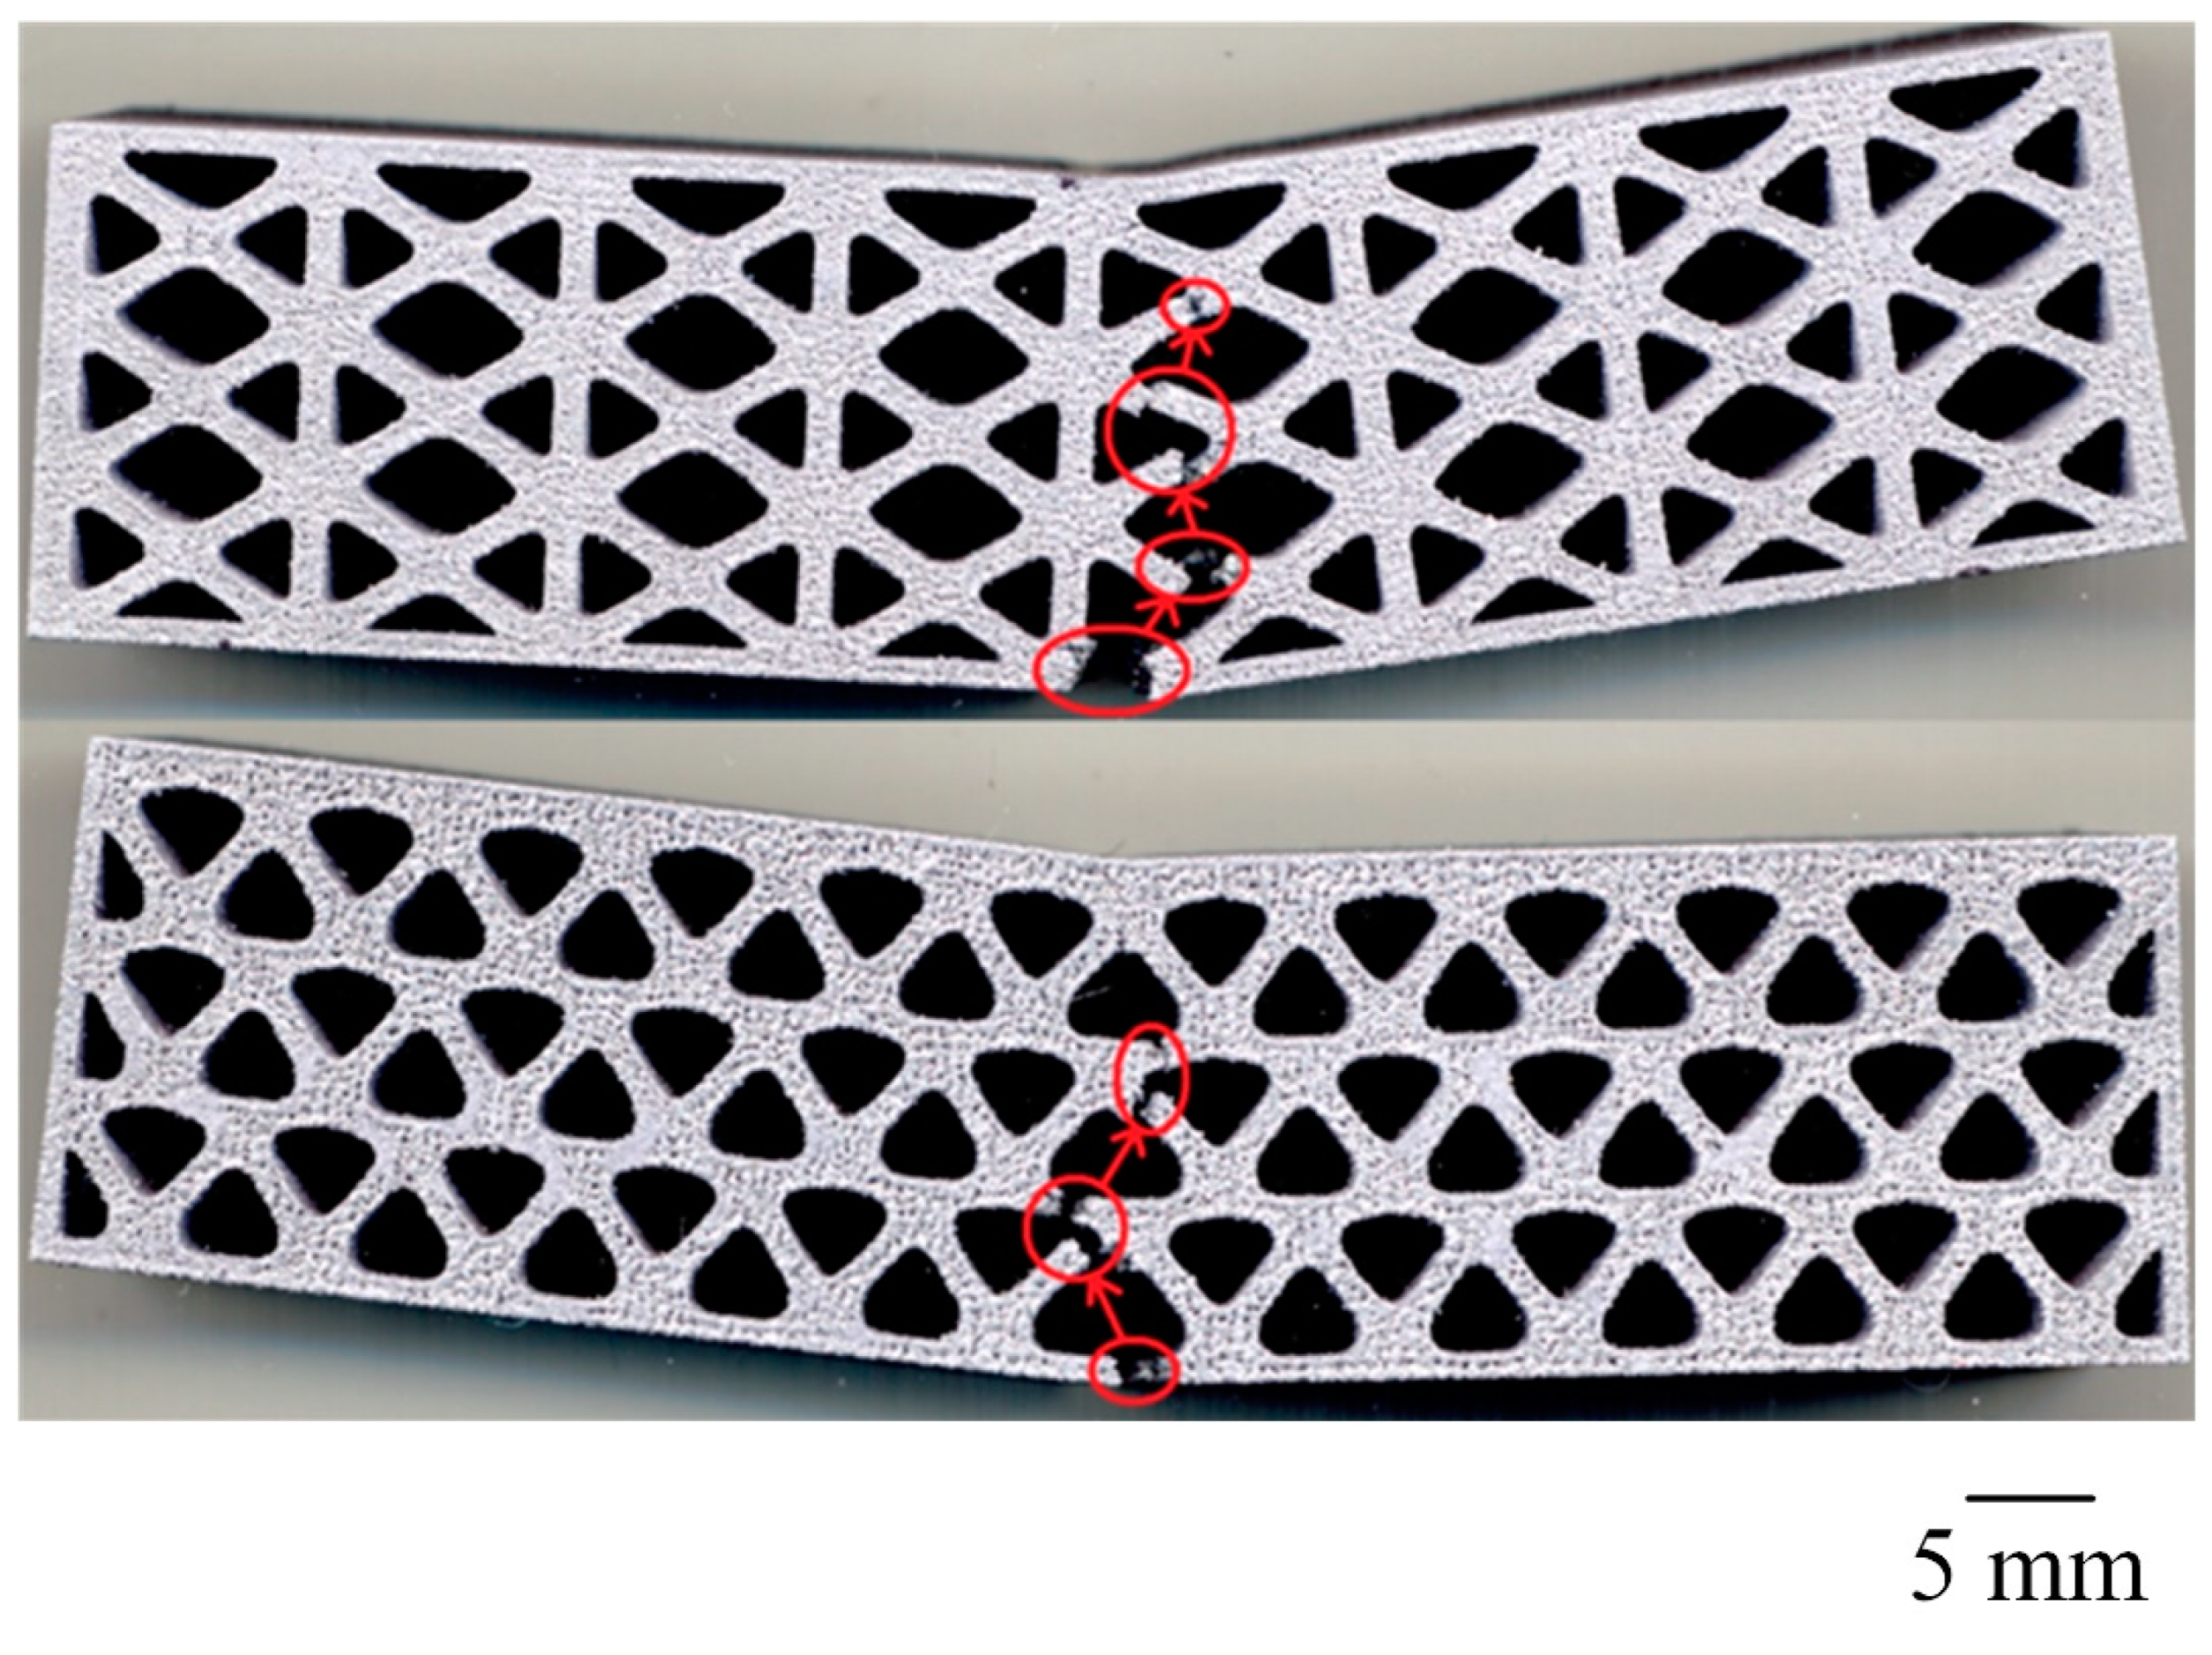
  • The LPBF-printed beams were subjected to standard three-point bending, and a comparison of load–deflection curves of the three types of topology-optimised (TO) beams was made and compared with LPBF-printed solid beam. Out of the three TO lattice beams, the 1 × 1 lattice beam exhibited the best load-bearing capacity at 17 ± 2 kN, followed by the 8 × 3 lattice beam at 13 ± 1 kN and then the 12 × 3 lattice beam at 10 ± 1 kN.
  • The BESO-optimised beams had a lower load-bearing capacity with a similar beam deflection to the solid beam prior to failure, and they all failed in a brittle manner.
In order to predict the bending behaviour of the BESO-optimised LPBF-printed AlSi12 beams, a finite element (FE) simulation was conducted. Since the material model of LPBF-printed AlSi12 would be complex, as concluded from the study, the inverse material modelling of a solid LPBF-printed AlSi12 beam was used. The 3D FE model for the inverse model was set up to replicate the experimental bend test setup, and the mesh density was selected to yield accurate results without increasing the computational cost of analysis.
  • The 3D FE model was compared against Timoshenko’s beam theory, as well as a 1D FE beam model, and the 3D FE model was found to be comparable with theoretical calculations. With the help of the Isight parameter-optimisation tool, along with the 3D FE model, the elastic–plastic material model of the solid LPBF-printed AlSi12 beam was developed. For this study, the material model of the solid LPBF-printed AlSi12 beam was used to predict the bending behaviour of the three BESO-optimised beams. It was found that the experimental bend curves of the three BESO beams were significantly different when compared to their respective FE simulation. It was hypothesised that the LPBF-printed AlSi12 material property depended on the design of the beams, as well as the other LPBF process parameters. This was further investigated by identifying the material models of the three BESO beams with the inverse material modelling technique (similar to the one used for identifying the material model for the solid LPBF-printed AlSi12 beam). It was found that the four material models of LPBF-printed AlSi12 beams (i.e., solid, 1 × 1, 8 × 3, and 12 × 3 beams) showed different yield stresses. The BESO-optimised beams tend to yield earlier when compared to the solid beam.
  • Therefore, it is not possible to accurately simulate the mechanical performance of TO lattice-structured LPBF-printed parts under bending load by using the material properties of an anisotropic LPBF-printed solid component of the same material. Moreover, it can also be concluded that elastic regime properties of anisotropic LPBF-printed material cannot be used for lattice-structured parts since these parts exhibit plastic behaviour upon contact with bending loads.
  • In the future, a new material model or simulation technique needs to be developed that can account for the changes in material behaviour after/during topology optimisation.

Author Contributions

Conceptualization, R.R., S.M., D.R., S.P. and X.H.; methodology, R.R., X.H. and R.A.R.R.; software, R.R., D.R. and X.H.; validation, R.R.; formal analysis, R.R. and R.A.R.R.; investigation, R.R.; resources, S.M., D.R. and S.P.; data curation, R.R.; writing—original draft preparation, R.R. and R.A.R.R.; writing—review and editing, S.M., D.R., S.P., X.H. and R.A.R.R.; supervision, S.M., D.R. and S.P.; project administration, S.M. and S.P.; funding acquisition, S.P. All authors have read and agreed to the published version of the manuscript.

Funding

This research was funded by DMTC Ltd., project number 5.01.

Data Availability Statement

All processed data are presented in this publication. The raw data that support the findings of this study are available from the principal author R.R. upon reasonable request.

Acknowledgments

This research project was supported by the DMTC Limited (Australia). The paper was written in line with the intellectual property rights granted to research partners from the original DMTC project.

Conflicts of Interest

The authors declare no conflict of interest.

References

  1. Kladovasilakis, N.; Tsongas, K.; Karalekas, D.; Tzetzis, D. Architected Materials for Additive Manufacturing: A Comprehensive Review. Materials 2022, 15, 5919. [Google Scholar] [CrossRef] [PubMed]
  2. Rashid, R.; Masood, S.H.; Ruan, D.; Palanisamy, S.; Huang, X.; Rahman Rashid, R.A. Topology Optimisation of Additively Manufactured Lattice Beams for Three-Point Bending Test. In Proceedings of 2018 International Solid Freeform Fabrication Symposium, Austin, Austin, TX, USA, 13–15 August 2018. [Google Scholar]
  3. Sigmund, O.; Maute, K. Topology optimization approaches. Struct. Multidiscip. Optim. 2013, 48, 1031–1055. [Google Scholar] [CrossRef]
  4. Liu, J.; Zhu, N.; Chen, L.; Liu, X. Structural Multi-objective Topology Optimization in the Design and Additive Manufacturing of Spatial Structure Joints. Int. J. Steel Struct. 2022, 22, 649–668. [Google Scholar] [CrossRef]
  5. Aremu, A.; Ashcroft, I.; Hague, R.; Wildman, R.; Tuck, C. Suitability of SIMP and BESO Topology Optimization Algorithms for Additive Manufacture. In Proceedings of 21st Annual International Solid Freeform Fabrication Symposium, Austin, TX, USA, 9–11 August 2010; pp. 679–692. [Google Scholar]
  6. Sigmund, O. A 99 line topology optimization code written in Matlab. Struct. Multidiscip. Optim. 2001, 21, 120–127. [Google Scholar] [CrossRef]
  7. Ntintakis, I.; Stavroulakis, G.E. Infill Microstructures for Additive Manufacturing. Appl. Sci. 2022, 12, 7386. [Google Scholar] [CrossRef]
  8. Dassault Systems Simulia. TOSCA Optimization Technology. Available online: https://www.3ds.com/products-services/simulia/products/tosca/ (accessed on 10 October 2022).
  9. VR&D. GENESIS Structural Optimization Extension for ANSYS® Mechanical. Available online: http://www.vrand.com/products/gsam-gtam/ (accessed on 10 October 2022).
  10. Altair. Altair® Inspire™. Available online: https://www.altair.com/inspire (accessed on 10 October 2022).
  11. Huang, X.; Xie, M. Evolutionary Topology Optimization of Continuum Structures: Methods and Applications; Wiley: Hoboken, NJ, USA, 2010. [Google Scholar]
  12. Spear, D.G.; Lane, J.S.; Palazotto, A.N.; Kemnitz, R.A. Computational based investigation of lattice cell optimization under uniaxial compression load. Results Mater. 2022, 13, 100242. [Google Scholar] [CrossRef]
  13. ISO/ASTM International 52900; Additive Manufacturing—General Principles—Fundamentals and Vocabulary. ISO: Geneva, Switzerland, 2021.
  14. Ponnusamy, P.; Rahman Rashid, R.A.; Masood, S.H.; Ruan, D.; Palanisamy, S. Mechanical Properties of SLM-Printed Aluminium Alloys: A Review. Materials 2020, 13, 4301. [Google Scholar] [CrossRef]
  15. Xiao, Z.; Yang, Y.; Xiao, R.; Bai, Y.; Song, C.; Wang, D. Evaluation of topology-optimized lattice structures manufactured via selective laser melting. Mater. Des. 2018, 143, 27–37. [Google Scholar] [CrossRef]
  16. Wang, X.; Qin, R.; Chen, B. Mechanical properties and energy absorption capability of a topology-optimized lattice structure manufactured via selective laser melting under axial and offset loading. Proc. Inst. Mech. Eng. Part C J. Mech. Eng. Sci. 2022, 236, 10221–10236. [Google Scholar] [CrossRef]
  17. Zhang, B.; Pei, X.; Zhou, C.; Fan, Y.; Jiang, Q.; Ronca, A.; D’Amora, U.; Chen, Y.; Li, H.; Sun, Y.; et al. The biomimetic design and 3D printing of customized mechanical properties porous Ti6Al4V scaffold for load-bearing bone reconstruction. Mater. Des. 2018, 152, 30–39. [Google Scholar] [CrossRef]
  18. García-Moreno, F. Commercial Applications of Metal Foams: Their Properties and Production. Materials 2016, 9, 85. [Google Scholar] [CrossRef] [PubMed]
  19. nTopology. nTopology. Available online: https://ntopology.com/ (accessed on 10 October 2022).
  20. Autodesk. Netfabb. Available online: https://www.autodesk.com.au/products/netfabb/ (accessed on 10 October 2022).
  21. Rezaie, R.; Badrossamay, M.; Ghaie, A.; Moosavi, H. Topology Optimization for Fused Deposition Modeling Process. Procedia CIRP 2013, 6, 521–526. [Google Scholar] [CrossRef] [Green Version]
  22. Castilho, M.; Dias, M.; Gbureck, U.; Groll, J.; Fernandes, P.; Pires, I.; Gouveia, B.; Rodrigues, J.; Vorndran, E. Fabrication of computationally designed scaffolds by low temperature 3D printing. Biofabrication 2013, 5, 035012. [Google Scholar] [CrossRef] [PubMed]
  23. Gardan, N. Knowledge Management for Topological Optimization Integration in Additive Manufacturing. Int. J. Manuf. Eng. 2014, 2014. [Google Scholar] [CrossRef] [Green Version]
  24. Brandt, M.; Sun, S.J.; Leary, M.; Feih, S.; Elambasseril, J.; Liu, Q.C. High-Value SLM Aerospace Components: From Design to Manufacture. Adv. Mater. Res. 2013, 633, 135–147. [Google Scholar] [CrossRef]
  25. Ponnusamy, P.; Masood, S.H.; Ruan, D.; Palanisamy, S.; Rashid, R.A.R.; Mukhlis, R.; Edwards, N.J. Dynamic compressive behaviour of selective laser melted AlSi12 alloy: Effect of elevated temperature and heat treatment. Addit. Manuf. 2020, 36, 101614. [Google Scholar] [CrossRef]
  26. Rashid, R.; Masood, S.H.; Ruan, D.; Palanisamy, S.; Rahman Rashid, R.A.; Elambasseril, J.; Brandt, M. Effect of energy per layer on the anisotropy of selective laser melted AlSi12 aluminium alloy. Addit. Manuf. 2018, 22, 426–439. [Google Scholar] [CrossRef]
  27. Huang, X.; Xie, Y.M. Optimal design of periodic structures using evolutionary topology optimization. Struct. Multidiscip. Optim. 2008, 36, 597–606. [Google Scholar] [CrossRef]
  28. ASTM International E290-14; Standard Test Methods for Bend Testing of Material for Ductility. West Conshohocken: Montgomery County, PA, USA, 2014.
  29. Rahman Rashid, R.A.; Mallavarapu, J.; Palanisamy, S.; Masood, S.H. A comparative study of flexural properties of additively manufactured aluminium lattice structures. Mater. Today Proc. 2017, 4, 8597–8604. [Google Scholar] [CrossRef]
  30. Da, D.; Xia, L.; Li, G.; Huang, X. Evolutionary topology optimization of continuum structures with smooth boundary representation. Struct. Multidiscip. Optim. 2018, 57, 2143–2159. [Google Scholar] [CrossRef]
  31. Siddique, S.; Imran, M.; Walther, F. Very high cycle fatigue and fatigue crack propagation behavior of selective laser melted AlSi12 alloy. Int. J. Fatigue 2017, 94, 246–254. [Google Scholar] [CrossRef]
  32. Lanoue, F.; Vadean, A.; Sanschagrin, B. Finite element analysis and contact modelling considerations of interference fits for fretting fatigue strength calculations. Simul. Model. Pract. Theory 2009, 17, 1587–1602. [Google Scholar] [CrossRef]
  33. Underwood, J.H.; Kapp, J.A.; Witherell, M.D. Fracture Testing with Arc Bend Specimens. In US Army Armament Research and Development Center Large Caliber Weapon Systems Laboratory; US Army ARDC: Watervliet, NY, USA, 1985. [Google Scholar]
  34. Roark, R.J. Formulas for Stress and Strain; R. R. Donnelley & Son: Chicago, IL, USA, 1965; pp. 286–323. [Google Scholar]
  35. Strek, T.; Michalski, J.; Jopek, H. Computational Analysis of the Mechanical Impedance of the Sandwich Beam with Auxetic Metal Foam Core. Phys. Status Solidi (B) 2019, 256, 1800423. [Google Scholar] [CrossRef]
  36. Roy, S.; Gebert, J.-M.; Stasiuk, G.; Piat, R.; Weidenmann, K.A.; Wanner, A. Complete determination of elastic moduli of interpenetrating metal/ceramic composites using ultrasonic techniques and micromechanical modelling. Mater. Sci. Eng. A 2011, 528, 8226–8235. [Google Scholar] [CrossRef]
  37. Alomarah, A.; Zhang, J.; Ruan, D.; Masood, S.; Lu, G. Mechanical Properties of the 2D Re-entrant Honeycomb Made via Direct Metal Printing. IOP Conf. Ser. Mater. Sci. Eng. 2017, 229, 012038. [Google Scholar] [CrossRef] [Green Version]
  38. Ono, K. Strain-Hardening equations and uniform strain. Metall. Mater. Trans. B 1972, 3, 749–751. [Google Scholar] [CrossRef]
  39. Calleja-Ochoa, A.; Gonzalez-Barrio, H.; López de Lacalle, N.; Martínez, S.; Albizuri, J.; Lamikiz, A. A New Approach in the Design of Microstructured Ultralight Components to Achieve Maximum Functional Performance. Materials 2021, 14, 1588. [Google Scholar] [CrossRef]
Figure 1. Solid beam considered for topology optimisation in the design region (grey colour) and non-design fixed boundary region (green colour).
Metals 13 00184 g001
Figure 2. Bending test setup.
Metals 13 00184 g002
Figure 3. Boundary condition setup in ABAQUS.
Metals 13 00184 g003
Figure 4. Topology-optimised beam using BESO algorithm (referred as 1 × 1 beam).
Metals 13 00184 g004
Figure 5. Design space divided into 4 × 3 lattice units, with grey region representing the elements which are linked to each other.
Metals 13 00184 g005
Figure 6. The 8 × 3 periodic lattice topology-optimisation design (referred as 8 × 3 beam).
Metals 13 00184 g006
Figure 7. The 12 × 3 periodic lattice topology-optimisation design (referred as 12 × 3 beam).
Metals 13 00184 g007
Figure 8. A single lattice unit from the 8 × 3 beam (left) and 12 × 3 (right) with jagged boundaries.
Metals 13 00184 g008
Figure 9. A single lattice unit from the 8 × 3 beam (left) and 12 × 3 beam (right) after applying the boundary-smoothening code.
Metals 13 00184 g009
Figure 10. Photographs of AlSi12 LPBF-printed 8 × 3 beams (left) and 12 × 3 beams (right).
Metals 13 00184 g010
Figure 11. Representative three-point bending test force–displacement curves of LPBF-printed AlSi12 beams, using different design optimisations.
Metals 13 00184 g011
Figure 12. Comparison of maximum load (top) and deflection at maximum load (bottom) of LPBF-printed beams with different design variations.
Metals 13 00184 g012
Figure 13. Failure pattern of the optimised lattice beams with paths of crack propagation shown; (top) 8 × 3 lattice beam and (bottom) 12 × 3 lattice beam.
Metals 13 00184 g013
Figure 14. FE model of three-point bending of the LPBF-printed beam.
Metals 13 00184 g014
Figure 15. Effects of mesh density on indenter reaction force and FE computational time.
Metals 13 00184 g015
Figure 16. The 1D beam model setup with the same boundary conditions as the 3D beam model in consideration.
Metals 13 00184 g016
Figure 17. The 3D FE beam model with a reduced cross-section.
Metals 13 00184 g017
Figure 18. Comparison of force–displacement curves, using Timoshenko’s beam theory, 1D FE beam element model, and 3D FE beam model with contacts.
Metals 13 00184 g018
Figure 19. FE setup with the plane of symmetries highlighted: full solid beam (left), half solid beam (centre), and quarter solid beam (right).
Metals 13 00184 g019
Figure 20. Comparison of force–deflection of three different beam fractions (i.e., full, half, and quarter beam).
Metals 13 00184 g020
Figure 21. Parameter optimisation process workflow.
Metals 13 00184 g021
Figure 22. Comparison of the experimental and FEA inverse material model: load–displacement curves.
Metals 13 00184 g022
Figure 23. FEA assembly setup of quarter of BESO-optimised beams—1 × 1 beam (left), 8 × 3 beam (centre), and 12 × 3 beam (right).
Metals 13 00184 g023
Figure 24. Effect of mesh size on indenter reaction force for 1 × 1 (top), 8 × 3 (centre), and 12 × 3 (bottom) beams.
Metals 13 00184 g024
Figure 25. Comparison of average experimental bend test for three BESO beams, with simulation of three beams carried out by using the solid beam material model.
Metals 13 00184 g025
Figure 26. Comparison of experimental and FEA inverse material model of 1 × 1 (left), 8 × 3 (centre), and 12 × 3 (right) beams.
Metals 13 00184 g026
Figure 27. Variation of modulus of elasticity and yield stress of material models with design variations of the LPBF-printed beams.
Metals 13 00184 g027
Table 1. LPBF process parameters for printing different design samples.
MaterialLaser Power (W)Scan Speed (mm/s)Layer Thickness (μm)Hatch Distance (μm)Defocus Distance (mm)Scan StrategyChamber Gas
AlSi12285250040100−4Scan ‘H’ *Argon
* This scan strategy is described in detail in [26].
Table 2. Bending-test results for LPBF-printed beams with different design variations.
Beam TypeMaximum Bending Load (kN)Deflection at Maximum Bending Load (mm)Deflection at Complete Failure (mm)
Solid26.08 ± 2.270.96 ± 0.040.96 ± 0.04
1 × 117.38 ± 1.981.00 ± 0.121.00 ± 0.12
8 × 312.67 ± 0.951.03 ± 0.121.22 ± 0.09
12 × 39.87 ± 0.460.86 ± 0.111.13 ± 0.17
Table 3. Mesh-convergence study.
Mesh Size (mm)Number of 8 Node Brick ElementsIndenter Reaction Force (kN)Change in Indenter Reaction Force (%)
545032.41-
486451.3758.50
2544560.9418.63
1.3319,94169.8114.55
147,61069.26−0.79
0.889,37672.444.59
0.6218,04474.272.53
Table 4. Solid LPBF-printed AlSi12 beam material model obtained through inverse material modelling.
Material ParameterInverse Material Model Value
Modulus of Elasticity (E)15.85 GPa
Yield Strength (σ0)122.88 MPa
Ludwig’s Strength Coefficient (K)718.77 MPa
Ludwig’s Strain Hardening Index (n)0.43
Table 5. Mesh-convergence study for 1 × 1 BESO beam.
Mesh Size (μm)Number of 8-Node Brick ElementsIndentation Reaction Force (kN)Change in Indenter Reaction Force (%)
2517811.11-
1.8559811.352.16
1.6695811.28−0.62
1.4815211.451.51
1.211,08811.50.44
115,37811.762.26
0.826,05411.991.96
0.644,55512.322.75
0.584,73212.360.32
0.4131,01212.491.05
0.3338,35212.37−0.96
Table 6. Mesh-convergence study for 8 × 3 BESO beam.
Mesh Size (μm)Number of 8-Node Brick ElementsIndentation Reaction Force (kN)Change in Indenter Reaction Force (%)
210,4228.14-
1.810,2908.312.09
1.612,2438.14−2.05
1.415,4488.13−0.12
1.219,6118.433.69
126,1918.41−0.24
0.836,8488.662.97
0.669,3318.842.08
0.5100,6488.90.68
0.4152,2928.910.11
0.2990,0248.930.22
Table 7. Mesh-convergence study for 12 × 3 BESO beam.
Mesh Size (μm)Number of 8-Node Brick ElementsIndentation Reaction Force (kN)Change in Indenter Reaction Force (%)
274226.15-
1.879206.8311.06
1.697166.74−1.32
1.412,3206.750.15
1.214,7876.63−1.78
118,5687.066.49
0.827,9447.232.41
0.649,9897.331.38
0.579,3277.40.95
0.4137,8447.430.41
0.2959,0007.440.13
Table 8. LPBF-printed AlSi12 beams’ material models obtained through inverse material modelling.
Material ParameterInverse-Material-Model Values
Solid Beam1 × 1 Beam8 × 3 Beam12 × 3 Beam
Modulus of Elasticity (E, GPa)15.1420.7423.0624.01
Yield Stress (σ0, MPa)218.6875.0686.2372.91
Ludwig’s Strength Coefficient (K, MPa)718.77718.77718.77718.77
Ludwig’s Strain Hardening Index (n)0.430.430.430.43
Disclaimer/Publisher’s Note: The statements, opinions and data contained in all publications are solely those of the individual author(s) and contributor(s) and not of MDPI and/or the editor(s). MDPI and/or the editor(s) disclaim responsibility for any injury to people or property resulting from any ideas, methods, instructions or products referred to in the content.

