Abstract
The effect of peak temperatures on the grain growth, microstructure transformation and Vickers hardness of the weld coarse grain heat-affected zone (CGHAZ) of SA508 Gr.4N steel for nuclear reactor pressure vessel was studied. The results show that different t8/5 time has no obvious effect on grain growth at the same peak temperature, but different peak temperatures have a great influence. The higher the peak temperature, the more obvious the effect on grain growth. The grain size distribution at different peak temperatures and t8/5 time conforms to the Gaussian normal distribution curve, and a grain growth model suitable for CGHAZ of SA508 Gr.4N steel has been established. The room temperature martensite structure can be obtained by treatment at different peak temperatures and t8/5 time. At the same peak temperature, there is no significant difference in martensite structure at different t8/5 time, and the size of martensite lath only increases with the increasing peak temperatures. At different peak temperatures and t8/5 time, grain size has less effect on the Vickers hardness, which is closely related to the room temperature microstructure of the material.
1. Introduction
Nuclear power, as a low-carbon clean energy, is an important basis for the sustainable development of human society in the future. A reactor pressure vessel is one of the most critical components a of nuclear power plant. The life and safety of reactor pressure vessel materials are determined by their durability in a high temperature, high pressure and radiation environment. At present, with the increase in power generation capacity and design life of nuclear power plants, the demand for materials with high strength, high toughness and radiation embrittlement resistance is increasing [1,2]. Reactor pressure vessels are usually made of low alloy steel. SA508 steel has been used to manufacture pressure vessels for many years because of its high strength, good ductility, fracture toughness and uniform mechanical properties. SA508 Gr.3 steel has been in service for more than 30 years, and its manufacturing performance and service performance have reached their limits [3,4].
Therefore, on the basis of SA508 Gr.3 steel, SA508 Gr.4N steel is a new generation of reactor pressure vessel steel, which was obtained by greatly increasing the content of Cr and Ni and reducing the content of Mn. The increase in Cr and Ni contents in SA508 Gr.4N steel can improve the hardenability, strength and fracture toughness of thick members and affect the precipitation form of carbide (mainly Cr element), but Ni may increase the sensitivity of irradiation embrittlement [5,6,7,8]. Pressure vessels are usually made of SA508 steel thick ring forgings or welded steel plates. Increased Cr content may make the welding process of SA508 Gr.4N steel more difficult. For the welding process of steel, the Heat Affected Zone (HAZ) is the location where the microstructure and properties of welded joints are most different from those of the base metal, especially where the performance of the coarse grain heat-affected zone (CGHAZ) deteriorates seriously. However, in the welding process, the width of the coarse grain heat-affected zone is very narrow, so it is necessary to restore the temperature change in the welding process through thermal simulation technology to obtain samples that can be detected and characterized [9]. Zhang [10] et al. used a Gleeble-1500D thermo-mechanical simulator to comparatively study the influence of welding heat inputs, which are characterized by a 800 °C to 500 °C cooling time (t8/5 time), on the microstructure transform, precipitation behavior and mechanical properties of alloy steel simulated CGHAZ. Li [11] studied the mechanical properties and microstructure characteristics of the coarse grain heat-affected zone (CGHAZ) of ASTM 4130 steel by using thermal welding simulation technology, analyzing the influence of post-welding heat treatment and welding heat inputs on the toughness of CGHAZ. The simulation studies on the welding heat-affected zone of pressure vessel steel mostly focus on the effects of welding heat input, grain size, microstructure and base metal elements on impact toughness and temper brittleness [12,13,14,15,16]. In addition, Li et al. [9] studied the influence of non-equilibrium grain boundary segregation on the embrittlement of the coarse grain heat-affected zone of pressure vessel steel. Brayshaw et al. [17] studied the influence of weld filler material on fatigue pre-crack propagation in the coarse grain heat-affected zone of SA508 Gr.4N steel. Additionally, there is the influence of welding method on microstructure and mechanical properties [18,19]. At present, EBSD analysis technology is used to further study the characteristics of the welding heat-affected zone [20,21].
In this study, physical simulation was used to set different peak temperatures (TP) and t8/5 time (800 °C–500 °C cooling time) with a TA Instruments Dilatometer DIL805. In the coarse grain heat-affected zone of welding for reactor pressure vessel SA508 Gr.4N steel, the grain growth and microstructure transformation at different peak temperatures and t8/5 time under the condition of rapid welding heating were investigated. The grain and microstructure were observed by a metallographic optical microscope, scanning electron microscope and electron back-scatter diffraction. Finally, the Vickers hardness was conducted and the influence of grain size and microstructure on hardness was analyzed.
2. Experimental Procedure
2.1. Experimental Materials Preparation
SA508 Gr.4N is a kind of Ni-Cr-Mo low carbon steel. The chemical composition of the test steel was obtained by the chemical analysis method, as shown in Table 1. Except for the low Si content in the test steel, the contents of other alloying elements are within the composition range of the specified ASME [22]. The original state of the experimental material is the forging annealing state. Its microstructure is shown in Figure 1a, and the X-ray diffraction diagram is shown in Figure 1b. Figure 1a shows that the microstructure of the original sample at room temperature is bainite, which is composed of granular bainite and lath bainite. Figure 1b shows the XRD results of the original sample; no precipitates, such as carbide, are detected.

Table 1.
Chemical composition of the experimental SA508 Gr.4N steel (mass fraction, %).
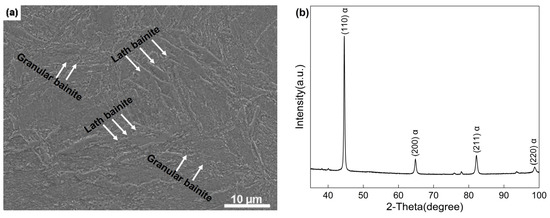
Figure 1.
(a) The microstructure of the original sample. (b) X-ray diffraction of original sample.
2.2. Experimental Procedure
The physical simulation experiment of the welding heat-affected zone was carried out on the TA Instruments Dilatometer DIL805. The sample chamber is shown in Figure 2. The thermocouples were welded on the ϕ4 mm × 10 mm sample to monitor the sample temperature. During the experiment, the samples were heated by the induction coil and fixed with a push rod; meanwhile, the axial expansion of the samples was monitored during heating and cooling. In order to avoid the surface oxidation of samples at high temperature, the samples were, respectively, heated to 1200 °C, 1250 °C and 1300 °C at a heating rate of 200 °C/s after the sample chamber pressure was ≤0.04 Pa. The sample remained at the peak temperature only for 2 s. According to the actual welding process temperature variation, it is more practical to divide the cooling process into two parts. Therefore, in the peak temperature to 800 °C rapid cooling section, the rate of cooling was 40 °C/s, and stayed at 800 °C insulation for 5 s, according to different t8/5 time (20/50/100 s), to take different cooling rates to 50 °C. The experimental process is shown in Figure 3.
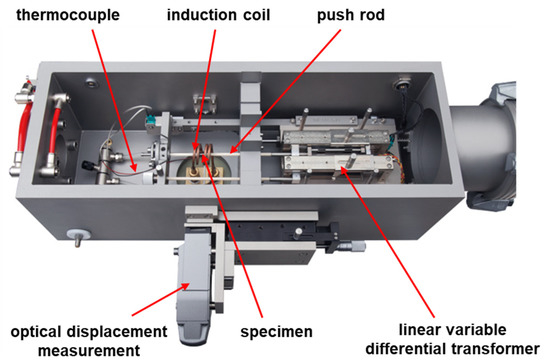
Figure 2.
The sample chamber of TA Instruments Dilatometer DIL805.
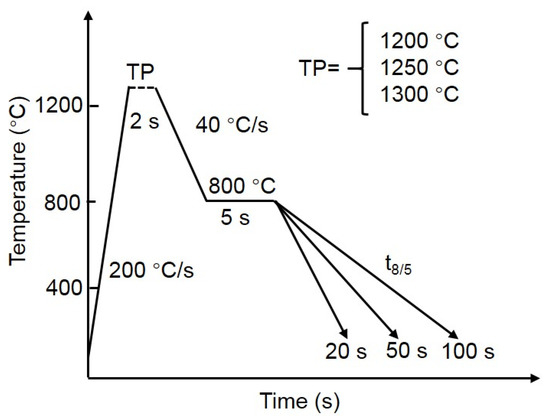
Figure 3.
Thermal simulation test process.
The samples that completed the physical simulation were ground by sandpaper along the radial direction and then polished. The grains and microstructures were etched with a new grain etch agent and 4% nitric acid alcohol, respectively. The microstructure was characterized by optical microscopy (OM, NREEOHY J-X3, Shenzhen NREEOHY Technology Co., Ltd, Shenzhen, China), scanning electron microscope (FE-SEM, JSM-7800, JEOL. Tokyo, Japan) and electron back-scatter diffraction (EBSD, JSM7200F, JEOL, Tokyo, Japan). Particle size distribution software was used to calculate the grain size of the samples. The Vickers hardness of the surface treated samples was tested by a SCTMC hardness tester with a pressure of 9.8 N and holding time of 15 s.
3. Results and Discussion
3.1. Grain Growth Behavior at Different t8/5 Time
Taking the peak temperature 1200 °C as an example to investigate the grain growth behavior at different t8/5 time, Figure 4a shows the grain morphology of the original sample. It can be seen from the figure that the original grain sizes were small and uniform. According to the grain statistics, the average grain size of the original sample was 25.53 μm. Figure 4b–d shows the grain morphology at a 1200 °C peak temperature with t8/5 for 20 s, 50 s and 100 s, respectively. Compared with the original grain size, the grain grew significantly after thermal simulation, and the average grain size increased to 51.255 μm, 56.538 μm and 47.747 μm, respectively. Further, the standard deviation in average grain size was 3.613, and the grain sizes became inhomogeneous. For example, when TP = 1200 °C and t8/5 =20 s (Figure 4b), the maximum grain size was 150.7 μm, while the minimum grain size was only 6.88 μm. The welding heat input provides the driving force for grain growth. However, the time at high temperature is short in the thermal simulation process, so that a few grains have been bound by the surrounding large grains that have completed the grain growth process. This leads to the grain size being inhomogeneous. Figure 5 shows the proportions of different grain sizes between the original sample and TP = 1200 °C. There are no less than 200 grains for size measurement under different t8/5 time conditions of peak temperature of 1200 °C and the original state. It can be seen that the grain sizes of the original sample were mostly concentrated in the range of 20–40 μm. Although the 800 °C is slightly higher than the Ac3 temperature of SA508 Gr.4N steel for the test, and t8/5 time can interconvert with line energy under certain conditions, the regular grain growth was basically the same at the same peak temperature but different t8/5 time. Grain sizes were mostly distributed in the range of 20–40 μm and 40–60 μm, and the proportion of larger grains (such as 60–100 μm) were significantly increased compared with the original state. The proportion of grain size and the gaussian normal distribution fitting at the same peak temperature (1200 °C) and different t8/5 time is shown in Figure 5; it can be seen that the R2 values after gaussian normal distribution fitting were all above 0.96, indicating a good fitting effect. Thus, the grain size distribution at the same peak temperature and different t8/5 time conforms to the regular gaussian normal distribution.
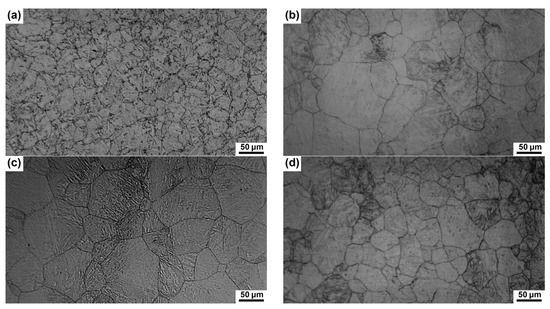
Figure 4.
TP = 1200 °C. Grain morphology at different t8/5 time: (a) Original, (b) 20 s, (c) 50 s, (d) 100 s.
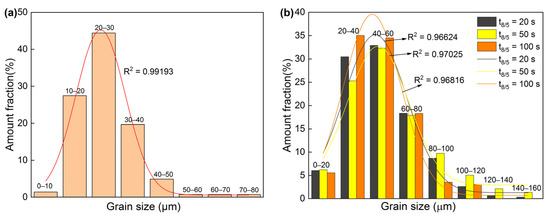
Figure 5.
Grain distribution and normal fitting curve of the original sample and TP = 1200 °C: (a) original, (b) 1200 °C.
3.2. Effect of Peak Temperature on Grain Growth
Figure 6 shows the grain morphology at different peak temperatures and t8/5 time. Through the above analysis, the regular grain growth at the same peak temperature and different t8/5 time is basically the same. Therefore, with a fixed time variable, it can be seen from Figure 6a–i, with the increase in peak temperature, the average grain sizes at 1200 °C, 1250 °C and 1300 °C were 51.847 μm, 68.022 μm and 101.247 μm, respectively. Compared with the original grain size are the grain sizes of the test samples grown abnormally after thermal simulation. Taking the peak temperature at 1300 °C (Figure 6g–i) as an example, the maximum grain size reached 343.5 μm, while the minimum grain size was only 8.49 μm, reflecting the heterogeneity of grain size. It can be seen from Figure 7 that the higher peak temperature, the larger the proportion of large-size grains. At different peak temperature and different t8/5 time, there are also no less than 200 grains for size measurement. For example, compared with the lowest peak temperature of 1200 °C, the grain size distribution was not concentrated at 1300 °C. In addition, the proportion range of the maximum grain size changes from 20 to 60 μm at 1200 °C to 80–120 μm, and larger grains appeared. Thus, peak temperature has a great influence on grain growth. Figure 7 shows the grain distribution histogram and the fitting curve of Gaussian normal distribution. Combined with the fitting evaluation result R2, it can be seen that the fitting results were above 0.95 in all other conditions except for the peak temperature of 1300 °C, and the fitting results basically conform to the rule of Gaussian normal distribution under all test conditions.
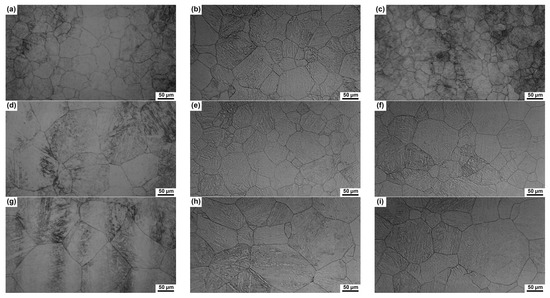
Figure 6.
Grain morphology at different peak temperatures and t8/5 time: (a) 1200 °C, t8/5 = 20 s, (b) 1200 °C, t8/5 = 50 s, (c) 1200 °C, t8/5 = 100 s, (d) 1250 °C, t8/5 = 20 s, (e) 1250 °C, t8/5 = 50 s, (f) 1250 °C, t8/5 = 100 s, (g) 1300 °C, t8/5 = 20 s, (h) 1300 °C, t8/5 = 50 s, (i) 1300 °C, t8/5 = 100 s.
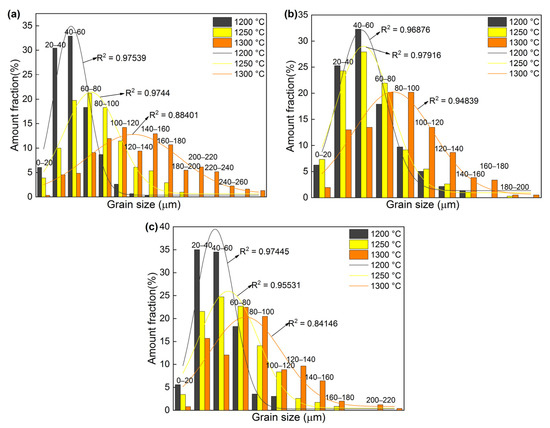
Figure 7.
Grain distribution and normal fitting curves at different peak temperatures with the same t8/5 time: (a) t8/5 = 20 s, (b) t8/5 = 50 s (c) t8/5 = 100 s.
3.3. Kinetics of Grain Growth
According to the experimental data of grain size, the welding process of SA508 Gr.4N steel results in grain size coarsening and is inhomogeneous, due to heat input in the welding heat-affected zone. As is commonly known, coarse grain size has an adverse effect on strength and plasticity and can even reduce plasticity and cause brittle fracture of materials. Therefore, based on the average grain size obtained by the quantitative metallography method, the grain growth dynamics model of welded SA508 Gr.4N steel in the coarse grain heat-affected zone was established. It can preliminarily predict the grain growth at different positions in the CGHAZ. At present, the classical mathematical models for predicting austenite grain growth under different heating temperatures and holding time mainly include the Anelli model [23], Sellars model [24] and Beck model [25]. Based on the Beck model, the austenite grain growth model of SA508 Gr.4N steel was established. For isothermal grain growth, the average grain size D at time t can be expressed as:
In Equation (1), D is the average grain size (μm), K is the grain growth rate, t is holding time (s) and n is the grain growth index. If n is assumed to be temperature independent and there is a reaction activation energy Q in the process, the general equation of D can be obtained under such conditions:
The experimental data were put into the equation for regression processing, and the natural logarithm of the grain size in the experiment was taken and fit with the reciprocal of temperature for regression processing, the activation energy of austenite grain growth of SA508 Gr.4N steel Q = 145,707.83 J/mol, K0 = 1.494 × 10⁶, n = 0.92. The Beck equation of austenite grain growth in the coarse grain heat-affected zone of SA508 Gr.4N steel during welding simulation was established as follows:
In order to verify the accuracy and applicability of the model, the thermal simulation experiment at low peak temperature was supplemented. Table 2 shows the average grain size obtained under different experimental conditions and calculated by the established model. At a higher peak temperature, the average error between the grain size calculated by the model and the experimental value is less than 4%, which indicates that the model can accurately predict the grain size of CGHAZ. When the peak temperature is 1100 °C and 1000 °C, the experimental grain size was 19.57 μm and 8.27 μm, respectively. For the grain size calculated by the mode was 22.67 μm and 9.03 μm, respectively, two grain sizes are still similar, and the model still has good practicality.
Table 2.
The grain size of experiment and model.
Figure 8 shows the correlation between the calculated grain size and the experimental value. Through linear fitting, the correlation between the two sets of data is above 0.99. It indicates that the grain prediction model can be applied, not only to the coarse grain heat-affected zone of SA508 Gr.4N steel, but also to the fine grain heat-affected zone. When the peak temperature continues to decrease (such as 900 °C and 800 °C), the experimental grain sizes were significantly smaller than those calculated by the model, and the model will no longer be applicable. The reason is that lower peak temperature and shorter holding time at the peak temperature will result in the undissolved precipitated phase (such as carbide) remaining. It is necessary to consider the nailing effect of grain boundary migration during the precipitation’s relative grain growth process [26,27].
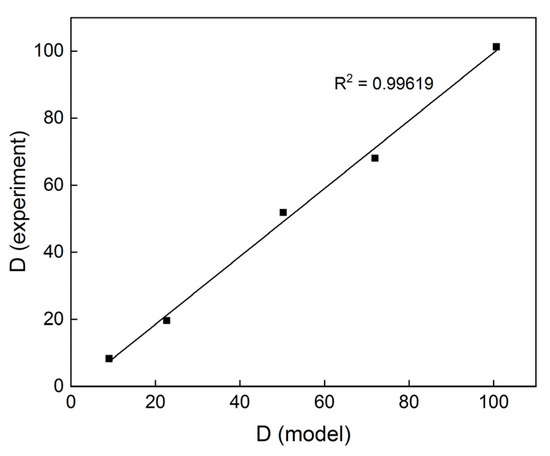
Figure 8.
The correlation of grain size between calculated and experimental.
3.4. Phase Transition at Different Peak Temperatures
According to the CCT curve of SA508 Gr.4N steel obtained in Yang [28], the critical cooling rate of martensite of the test steel was 0.73 °C/s. According to different t8/5 time (20 s, 50 s, 100 s), it can be calculated that the cooling rates during the cooling process were 15 °C/s, 6 °C/s and 3 °C/s, respectively. The cooling rates at each t8/5 time were greater than the critical cooling rate of the test steel. Therefore, the microstructure under different test conditions should be martensite at room temperature. According to the early studies of Takahashi [29] and Onink [30], the microstructure transformation of steel materials during heating or cooling will lead to volume changes. Therefore, the temperature–time-expansion data recorded by the equipment during the test can explain the phase transition of the experimental steel, with the change in temperature in the thermal simulation process. The temperature-expansion volume data in the cooling process were captured and drawn on the curve, as shown in Figure 9. It can be seen from the figure that only martensitic transformation occurred in the expansion curve when the temperature was lower than 360 °C.
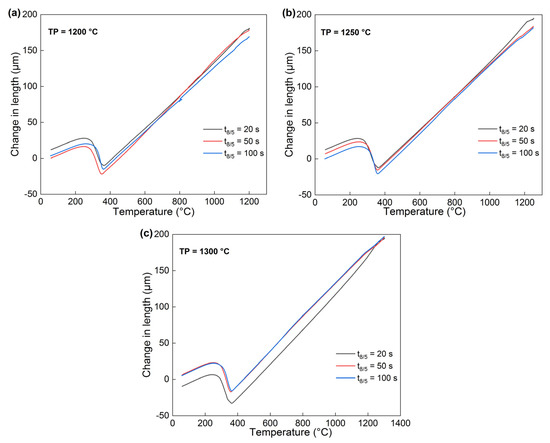
Figure 9.
Cooling expansion curves at different peak temperatures and t8/5 time. (a) TP = 1200 °C expansion curve, (b) TP = 1250 °C expansion curve, (c) TP = 1200 °C expansion curve.
The metallographic microstructure at different peak temperatures and t8/5 time is shown in Figure 10. The microstructures obtained under various test conditions were typical lath martensite, and the stereoscopic form was of a lath group clustered together in long strips. It can be seen from Figure 10b,d,e,g,i that the martensitic lath groups in a primary austenite grain have different orientation relationships. For instance, in grain B in Figure 10d,i, the lath groups were composed of several nearly parallel martensitic laths. In Figure 10b,e,g, and grain A of (d), the slat group was composed of two slat bundles at large angles or nearly vertical. SEM microstructures at different peak temperatures and t8/5 time are shown in Figure 11. At the same t8/5 time, as shown in Figure 11a–i, it can be seen that with the increase in peak temperature, the length of the martensitic lath bundle increases with the growth of grains. The long and narrow martensitic lath can penetrate through the whole original austenite grains, and the distance between martensitic lath increases. Then, the martensite lath became thicker. As shown in Figure 11b, a small number of irregular M-A island structures are formed due to rapid cooling in the cooling process. There are a few carbides precipitated and distributed between martensitic laths, with a regular white short round rod, as shown in Figure 11g. Compared with Figure 11d–f, it can be seen that at the same peak temperature, the martensite morphologies obtained at different t8/5 time are basically the same. Therefore, with the increase in peak temperature, martensitic lath becomes coarser with grain growth. Furthermore, at the same peak temperature, different t8/5 time has no significant effect on martensite structure.
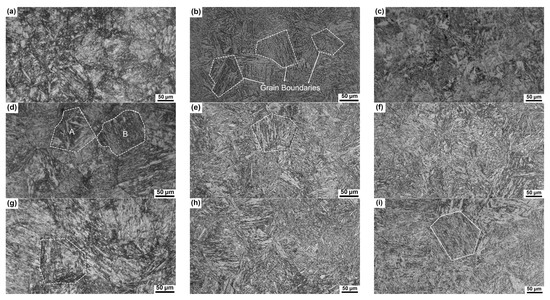
Figure 10.
Metallographic microstructure at different peak temperatures and t8/5 time: (a) 1200 °C, t8/5 = 20 s, (b) 1200 °C, t8/5 = 50 s, (c) 1200 °C, t8/5 = 100 s, (d) 1250 °C, t8/5 = 20 s, (e) 1250 °C, t8/5 = 50 s, (f) 1250 °C, t8/5 = 100 s, (g) 1300 °C, t8/5 = 20 s, (h) 1300 °C, t8/5 = 50 s, (i) 1300 °C, t8/5 = 100 s.
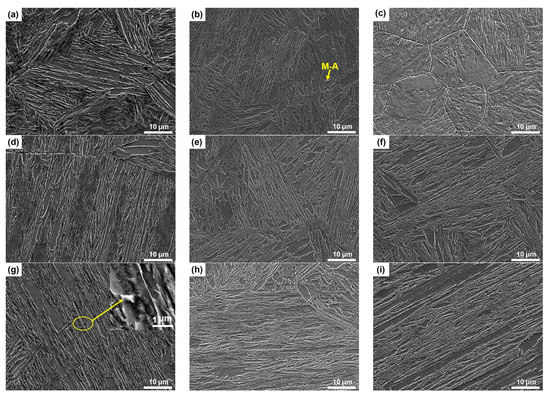
Figure 11.
Microscopic structure at different peak temperatures and t8/5 time: (a) 1200 °C, t8/5 = 20 s, (b) 1200 °C, t8/5 = 50 s, (c) 1200 °C, t8/5 = 100 s, (d) 1250 °C, t8/5 = 20 s, (e) 1250 °C, t8/5 = 50 s, (f) 1250 °C, t8/5 = 100 s, (g) 1300 °C, t8/5 = 20 s, (h) 1300 °C, t8/5 = 50 s, (i) 1300 °C, t8/5 = 100 s.
Phase distribution and band contrast (BC) values mixed with Gaussian fitted curves of samples under different treatments are shown in Figure 12. EBSD detection results show that the microstructure after welding thermal simulation consists of martensite and a small amount of retained austenite. The retained austenite contents at the peak temperatures of 1300 °C, 1250 °C and 1200 °C were 0.614%, 0.685% and 0.776%, respectively. The content of retained austenite increased gradually as temperatures went down, and the retained austenite was distributed in grain boundaries and martensitic lath gaps in granular form. BC value is the contrast degree of the Kikuchi band, which is often used to qualitatively describe the defect density. The lower the BC value, the greater the deformation degree [31]. The BC values obtained in the experiment are all above 100, and show a good correlation with the Gaussian function. Figure 13 is an EBSD analysis of an inverse pole figure (IPF). The martensite bundle within the same grain is composed of approximately parallel martensite slat with different orientations, which is consistent with the characteristics of martensite combination in the OM observations.
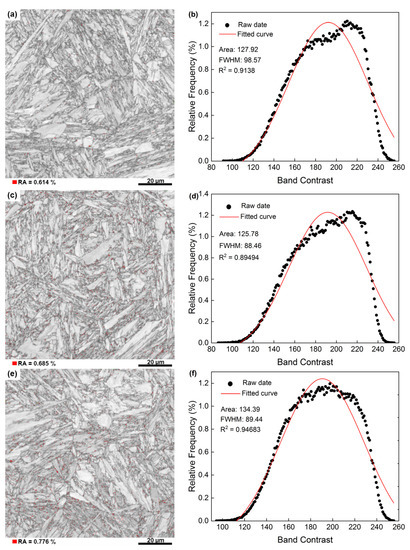
Figure 12.
Phases distribution and BC values mixed with Gaussian fitted curves of samples under different treatments: (a,b) 1300 °C, t8/5 = 20 s; (c,d) 1250 °C, t8/5 = 20 s; (e,f) 1200 °C, t8/5 = 20 s.
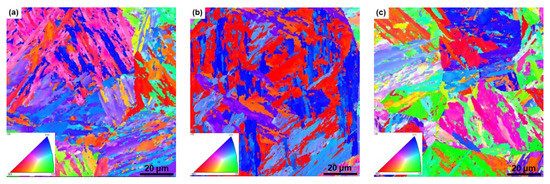
Figure 13.
EBSD analysis using inverse pole figure maps: (a) 1300 °C, t8/5 = 20 s; (b) 1250 °C, t8/5 = 20 s; (c) 1200 °C, t8/5 = 20 s.
3.5. Vickers Hardness
Figure 14 shows the Vickers hardness at different peak temperatures and t8/5 time. The original sample has an average hardness of 309.7 HV. According to Figure 1a, the original structure is the mixed structure of granular bainite and lath bainite, so the hardness value is relatively low. Combining the average value of Vickers hardness in Figure 14 and Table 3, it can be seen that the Vickers hardness values under different experimental conditions are within the martensitic hardness range, which is consistent with the characterized microstructure. When the peak temperatures were 1200 °C and 1250 °C, there was little difference in Vickers hardness at different t8/5 time. When the peak temperature was 1300 °C, the Vickers hardness increased about 10 HV with the increase in t8/5 time. From the grain size change of different t8/5 time at the peak temperature of 1300 °C, it can be inferred that the Vickers hardness increased with the refining of the grainsize. In general, the Vickers hardness is closely related to the microstructure of materials, but is less affected by grain size.
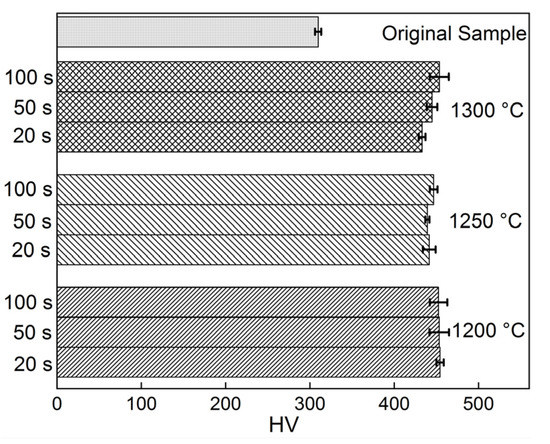
Figure 14.
Vickers hardness at different peak temperatures and t8/5 time.
Table 3.
Average Vickers hardness values at different peak temperatures and t8/5 time.
4. Conclusions
- (1)
- The average grain size of SA508 Gr.4N steel was 25.53 μm after forging annealing. Compared with the original state, the grain size increased obviously after the welding heat-affected zone simulation. Moreover, the proportion of large grain size increased, and the grains were not uniform. The simulation at different peak temperatures and t8/5 time shows that the regular grain growth at the same peak temperature is independent of t8/5 time. The peak temperature has a great influence on grain growth. The average grain size corresponding to the peak temperatures of 1200 °C, 1250 °C and 1300 °C were 51.847 μm, 68.022 μm and 101.247 μm, respectively. The fitting results of grain size distribution under various experimental conditions basically accord with regular Gaussian normal distribution. The grain growth dynamics model of welded SA508 Gr.4N steel in the coarse grain heat-affected zone has been established.
- (2)
- Martensite and a small amount of retained austenite formed in SA508 Gr.4N steel, after a thermal simulation test in welded coarse grain heat-affected zone (CGHAZ) under various experimental conditions. There are martensite structures with different orientation relationships in the same primary austenite grain. The microstructure of martensite became coarse with the increase in peak temperatures, but t8/5 time had little effect on the microstructure of martensite. Carbides and M-A islands were formed during the microstructure’s transformation.
- (3)
- The Vickers hardness of SA508 Gr.4N steel is 309.7 HV after the forging’s annealing. After simulating, the Vickers hardness of the tested steel is within the range of martensite hardness. The Vickers hardness of the tested steel has little difference after different peak temperatures and t8/5 time. It is known that the Vickers hardness is closely related to the microstructure of the material at room temperature, while the grain size has less effect.
Author Contributions
Conceptualization, S.L., S.Z. and Y.D.; methodology, S.L., L.W., S.Z., M.L. and Y.D.; software, S.L., L.W. and H.Y.; validation, S.Z., M.L. and Y.D.; formal analysis, S.L., L.W., H.Y. and Y.D.; investigation, S.L., S.Z. and Z.X.; resources, S.Z., M.L. and Z.X.; data curation, S.L.; writing—original draft preparation, S.L., L.W. and H.Y.; writing—review and editing, S.L. and L.W.; visualization, S.L., L.W. and H.Y.; supervision, S.Z. and M.L.; project administration, S.Z. and M.L.; funding acquisition, S.Z., M.L. and Z.X. All authors have read and agreed to the published version of the manuscript.
Funding
This research was funded by Yunnan Fundamental Research Projects (Grant No. 202101AU070152), Yunnan Ten Thousand Talents Plan Young and Elite Talents Project (Grant No. YNWR-QNBJ-2020-020), Innovation Team Cultivation Project of Yunnan Province (Grant number 202005AE160016) and the Natural Science Research Foundation of Kunming University of Science and Technology (KKZ3202051043).
Data Availability Statement
The raw/processed data required to reproduce these findings cannot be shared at this time due to technical or time limitations.
Acknowledgments
We thank the Yunnan Fundamental Research Projects (Grant No. 202101AU070152), Yunnan Ten Thousand Talents Plan Young and Elite Talents Project (Grant No. YNWR-QNBJ-2020-020), Innovation Team Cultivation Project of Yunnan Province (Grant number 202005AE160016) and the Natural Science Research Foundation of Kunming University of Science and Technology (KKZ3202051043) for their assistance.
Conflicts of Interest
The authors declare no conflict of interest.
References
- Lee, K.H.; Kim, M.C.; Lee, B.S.; Wee, D.M. Master curve characterization of the fracture toughness behavior in SA508 Gr.4N low alloy steels. J. Nucl. Mater. 2010, 403, 68–74. [Google Scholar] [CrossRef]
- Spence, J.; Nash, D.H. Milestones in pressure vessel technology. Int. J. Press. Vessels. Pip. 2004, 81, 89–118. [Google Scholar] [CrossRef]
- Druce, S.G.; Edwards, B.C. Development of PWR pressure vessle steels. Nucl. Energy 1980, 19, 347. [Google Scholar]
- Lee, B.S.; Kim, M.C.; Yoon, J.H.; Hong, J.H. Characterization of high strength and high toughness Ni–Mo–Cr low alloy steels for nuclear application. Int. J. Press. Vessels. Pip. 2010, 87, 74–80. [Google Scholar] [CrossRef]
- Odette, G.R. On the dominant mechanism of irradiation embrittlement of reactor pressure vessel steels. Scr. Metall. 1983, 17, 1183–1188. [Google Scholar] [CrossRef]
- Park, S.G.; Lee, K.H.; Min, K.D.; Kim, M.C.; Lee, B.S. Influence of the thermodynamic parameters on the temper embrittlement of SA508 Gr.4N Ni–Cr–Mo low alloy steel with variation of Ni, Cr and Mn contents. J. Nucl. Mater. 2012, 426, 1–8. [Google Scholar] [CrossRef]
- Park, S.G.; Kim, M.C.; Lee, B.S.; Wee, D.M. Correlation of the thermodynamic calculation and the experimental observation of Ni–Mo–Cr low alloy steel changing Ni, Mo, and Cr contents. J. Nucl. Mater. 2010, 407, 126–135. [Google Scholar] [CrossRef]
- Lee, B.S.; Kim, M.C.; Kim, M.W.; Yoon, J.H.; Hong, J.H. Master curve techniques to evaluate an irradiation embrittlement of nuclear reactor pressure vessels for a long-term operation. Int. J. Press. Vessels. Pip. 2008, 85, 593–599. [Google Scholar] [CrossRef]
- Li, Y.L.; Fu, L.M.; Yu, L.K. Investigation of non-equilibrium grain boundary segregation on CGHAZ in reactor pressure vessel steel. Sci. Technol. Weld. Join. 2015, 20, 395–401. [Google Scholar] [CrossRef]
- Zhang, J.; Xin, W.B.; Luo, G.P.; Wang, R.F.; Meng, Q.Y.; Xian, S.T. Effect of welding heat input on microstructural evolution, precipitation behavior and resultant properties of the simulated CGHAZ in high-N V-alloyed steel. Mater. Charact. 2020, 162, 110201. [Google Scholar] [CrossRef]
- Li, L.Y.; Wang, Y.; Han, T.; Li, C.W. Embrittlement and toughening in CGHAZ of ASTM4130 steel. Sci. China Phys. Mech. Astron. 2011, 54, 1447–1454. [Google Scholar] [CrossRef]
- Kim, S.; Kang, S.Y.; Lee, S.; Oh, S.J.; Kwon, S.J.; Kim, O.H.; Hong, J.H. Correlation of the microstructure and fracture toughness of the heat-affected zones of an SA 508 steel. Metall. Mater. Trans. A 2000, 31, 1107–1119. [Google Scholar] [CrossRef]
- Kuo, H.T.; Wei, R.C.; Wu, W.F.; Yang, J.R. Simulated heat affected zone in ASTM A533-B steel plates under low heat inputs. Mater. Chem. Phys. 2009, 117, 471–477. [Google Scholar] [CrossRef]
- Million, K.; Datta, R.; Zimmermann, H. Effects of heat input on the microstructure and toughness of the 8MnMoNi55 shape-welded nuclear steel. J. Nucl. Mater. 2005, 340, 25–32. [Google Scholar] [CrossRef]
- Zhu, Z.X.; Marimuthu, M.; Kuzmikova, L.; Li, H.J.; Barbaro, F.; Zheng, L.; Bai, M.Z.; Jones, C. Influence of Ti/N ratio on simulated CGHAZ microstructure and toughness in X70 steels. Sci. Technol. Weld. Join. 2013, 18, 45–51. [Google Scholar] [CrossRef]
- Lee, K.H.; Jhung, M.J.; Kim, M.C.; Lee, B.S. Effects of tempering and PWHT on microstructures and mechanical properties of SA508 Gr.4N steel. Nucl. Eng. Technol. 2014, 46, 413–422. [Google Scholar] [CrossRef]
- Brayshaw, W.J.; Cooper, A.J.; Sherry, A.H. Assessment of the micro-mechanical fracture processes within dissimilar metal welds. Eng. Fail. Anal. 2019, 97, 820–835. [Google Scholar] [CrossRef]
- Sun, Y.L.; Vasileiou, A.N.; Pickering, E.J.; Collins, J.; Obasi, G.; Akrivos, V.; Smith, M.C. Impact of weld restraint on the development of distortion and stress during the electron beam welding of a low-alloy steel subject to solid state phase transformation. Int. J. Mech. Sci. 2021, 196, 106244. [Google Scholar] [CrossRef]
- Mohammadijoo, M.; Valloton, J.; Collins, L.; Henein, H.; Ivey, D.G. Characterization of martensite-austenite constituents and micro-hardness in intercritical reheated and coarse-grained heat affected zones of API X70 HSLA steel. Mater. Charact. 2018, 142, 321–331. [Google Scholar] [CrossRef]
- Li, G.; Lu., X.F.; Zhu., X.L.; Huang., J.; Liu., L.W.; Wu. Y., X. The segregation and liquation crackings in the HAZ of multipass laser-welded joints for nuclear power plants. J. Mater. Eng. Perform. 2017, 26, 4083–4091. [Google Scholar] [CrossRef]
- Pugacheva, N.B.; Zadvorkin, S.M.; Michurov, N.S. EBSD analysis of an austenitic Cr-Ni steel laser weld. Phys. Met. Metallogr. 2022, 123, 791–796. [Google Scholar] [CrossRef]
- ASTM SA-508/SA-508M; Specification for Quenched and Tempered Vacuum-Treated Carbon and Alloy Steel Forgings for Pressure Vessels. ASTM International: West Conshohocken, PA, USA, 2004; pp. 939–948.
- Anelli, E. Application of mathematical modeling to hot rolling and controlled cooling of wire rods and bars. ISIJ Int. 1992, 32, 440–449. [Google Scholar] [CrossRef]
- Sellars, C.M.; Whiteman, J.A. Recrystallization and grain growth in hot rolling. Met. Sci. 1979, 13, 187–194. [Google Scholar] [CrossRef]
- Beck, P.A.; Kremer, J.C.; Demer, L. Grain growth in high-purity aluminium-magnesium alloy. Met. Mater. Trans. 1948, 175, 372–394. [Google Scholar]
- Yan, B.Y.; Liu, Y.H.; Wang, Z.J.; Liu, C.X.; Si, Y.H.; Li, H.J.; Yu, J.X. The Effect of Precipitate Evolution on Austenite Grain Growth in RAFM Steel. Materials 2017, 10, 1017. [Google Scholar] [CrossRef]
- Shahandeh, S.; Milizer, M. Grain boundary curvature and grain growth kinetics with particle pinning. Phllos. Mag. 2013, 93, 3231–3247. [Google Scholar] [CrossRef]
- Yang, Z.Q.; Liu, Z.D.; He, X.K.; Qiao, S.B.; Xie, C.S. Effect of microstructure on the impact toughness and temper embrittlement of SA508Gr.4N steel for advanced pressure vessel materials. Sci. Rep. 2018, 8, 207–219. [Google Scholar] [CrossRef]
- Takahashi, M.; Bhadeshia, H.K.D.H. The interpretation of dilatometric data for transformations in steels. J. Mater. Sci. Lett. 1989, 8, 477–478. [Google Scholar] [CrossRef]
- Onink, M.; Tichelaar, F.D.; Brakman, C.M.; Mittemeijer, E.J.; Zwaag, S.; Metallkd, Z. Quantitative analysis of the dilatation by decomposition of Fe-C austenites; Calculation of volume change upon transformation. Int. J. Mater. Res. 1996, 12, 469–495. [Google Scholar] [CrossRef]
- Wang, X.; Chen, J.G.; Su, G.F.; Li, H.Y.; Wang, C. Plastic damage evolution in structural steel and its non-destructive evaluation. J. Mater. Res. Technol. 2020, 9, 1189–1199. [Google Scholar] [CrossRef]


Disclaimer/Publisher’s Note: The statements, opinions and data contained in all publications are solely those of the individual author(s) and contributor(s) and not of MDPI and/or the editor(s). MDPI and/or the editor(s) disclaim responsibility for any injury to people or property resulting from any ideas, methods, instructions or products referred to in the content. |
© 2022 by the authors. Licensee MDPI, Basel, Switzerland. This article is an open access article distributed under the terms and conditions of the Creative Commons Attribution (CC BY) license (https://creativecommons.org/licenses/by/4.0/).