
Study of Trivalent Chromium Conversion Coating Formation at Solution—Metal Interface
 and
and
Abstract
:1. Introduction
2. Experimental Part
2.1. Sample and Microelectrode Materials and Their Preparation Procedures for TCC Formation
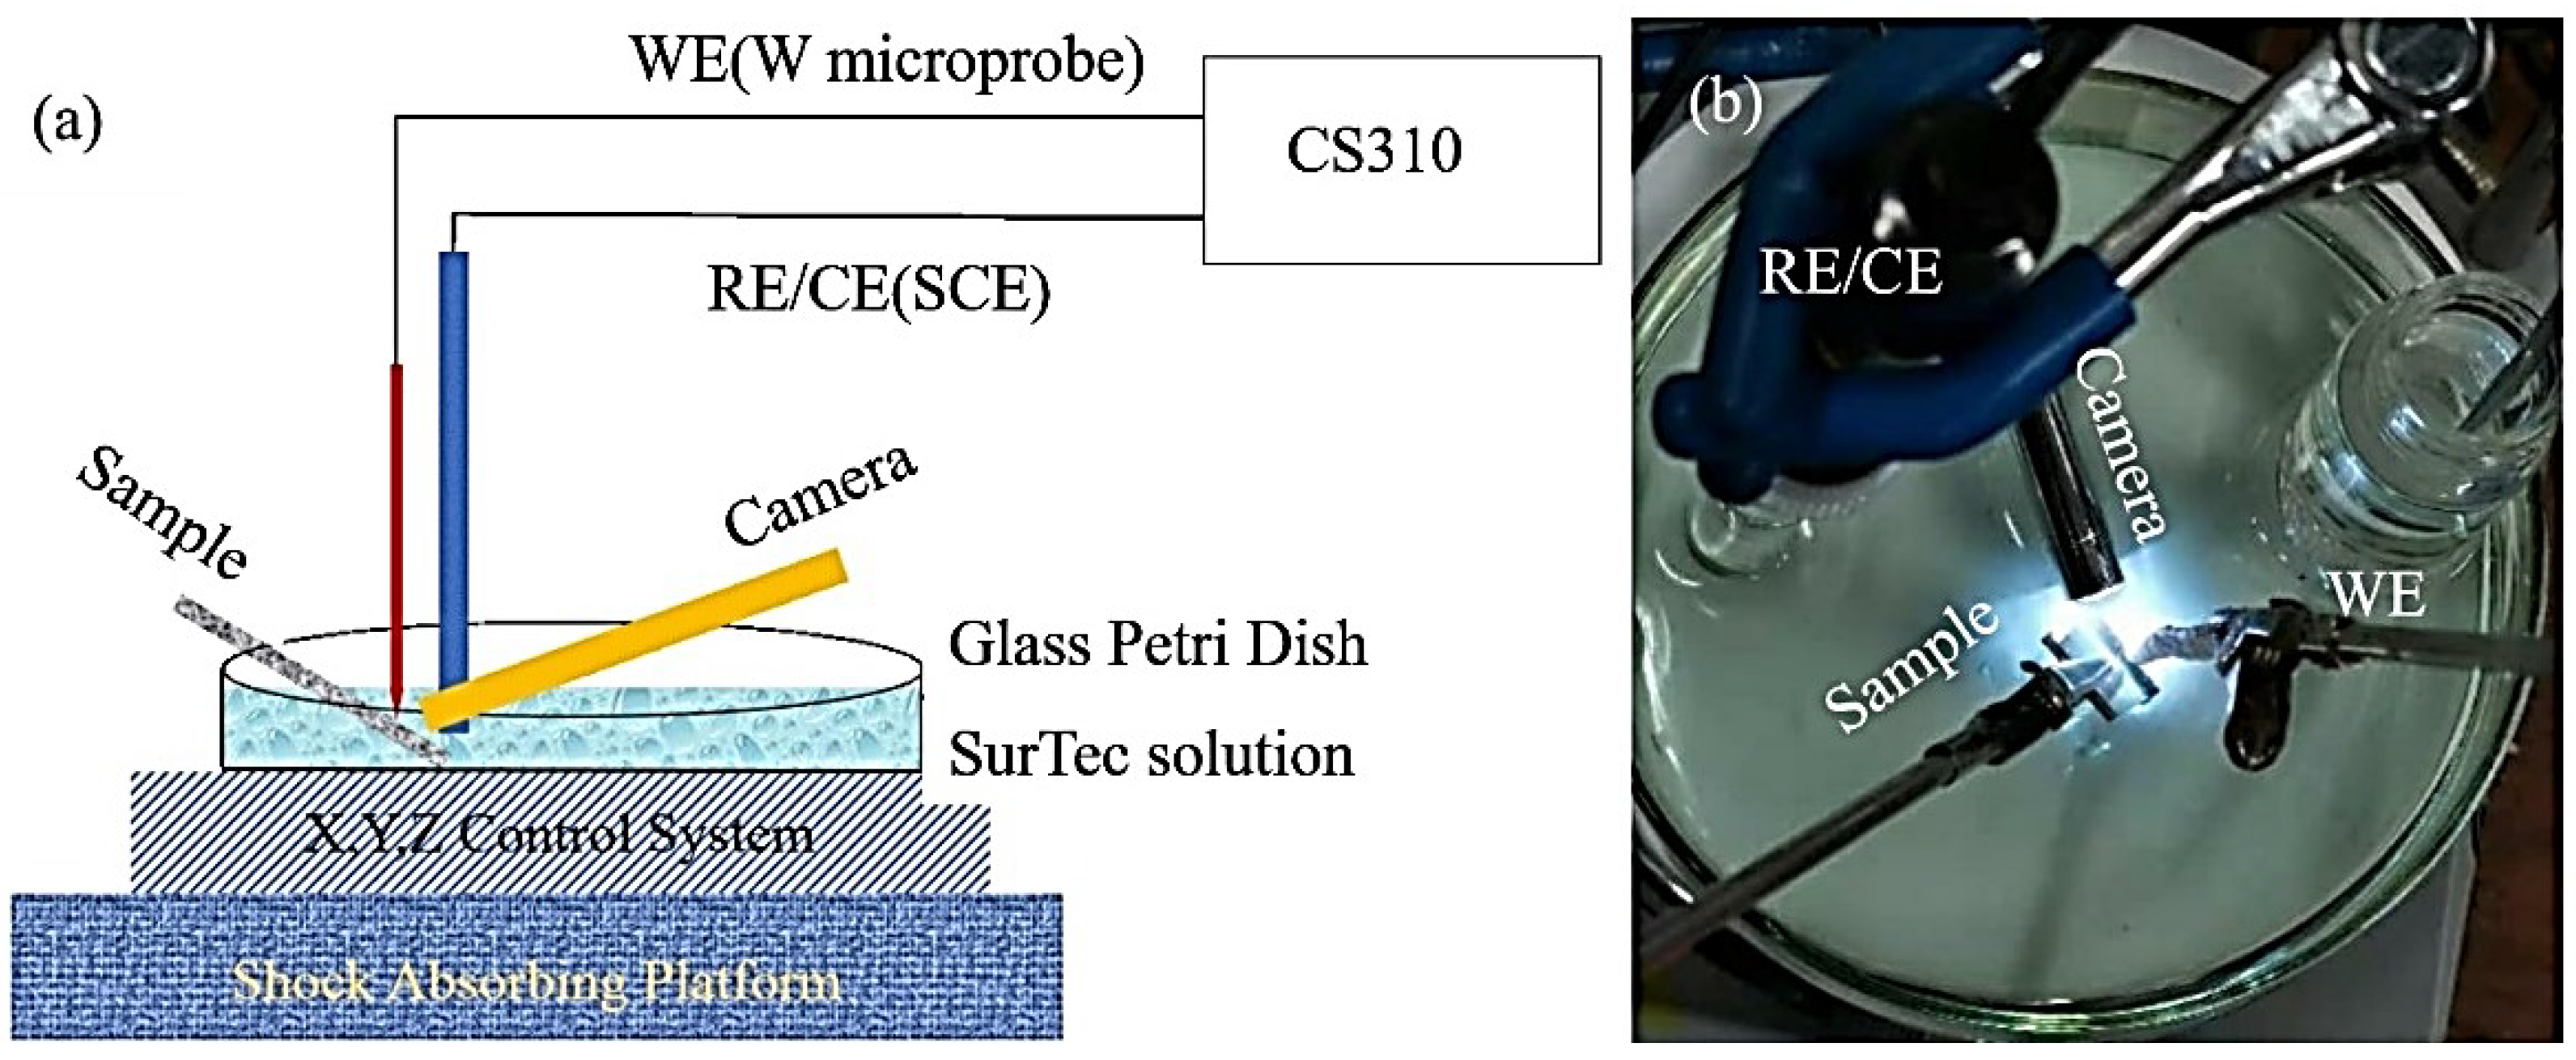
2.2. Installation Scheme and Characterization of Electrolyte pH for TCC Formation, Equipment for Microanalysis and Raman Spectroscopy of Objects of Study and MEDUSA Software for Simulating Chemical Reactions
3. Results and Discussion
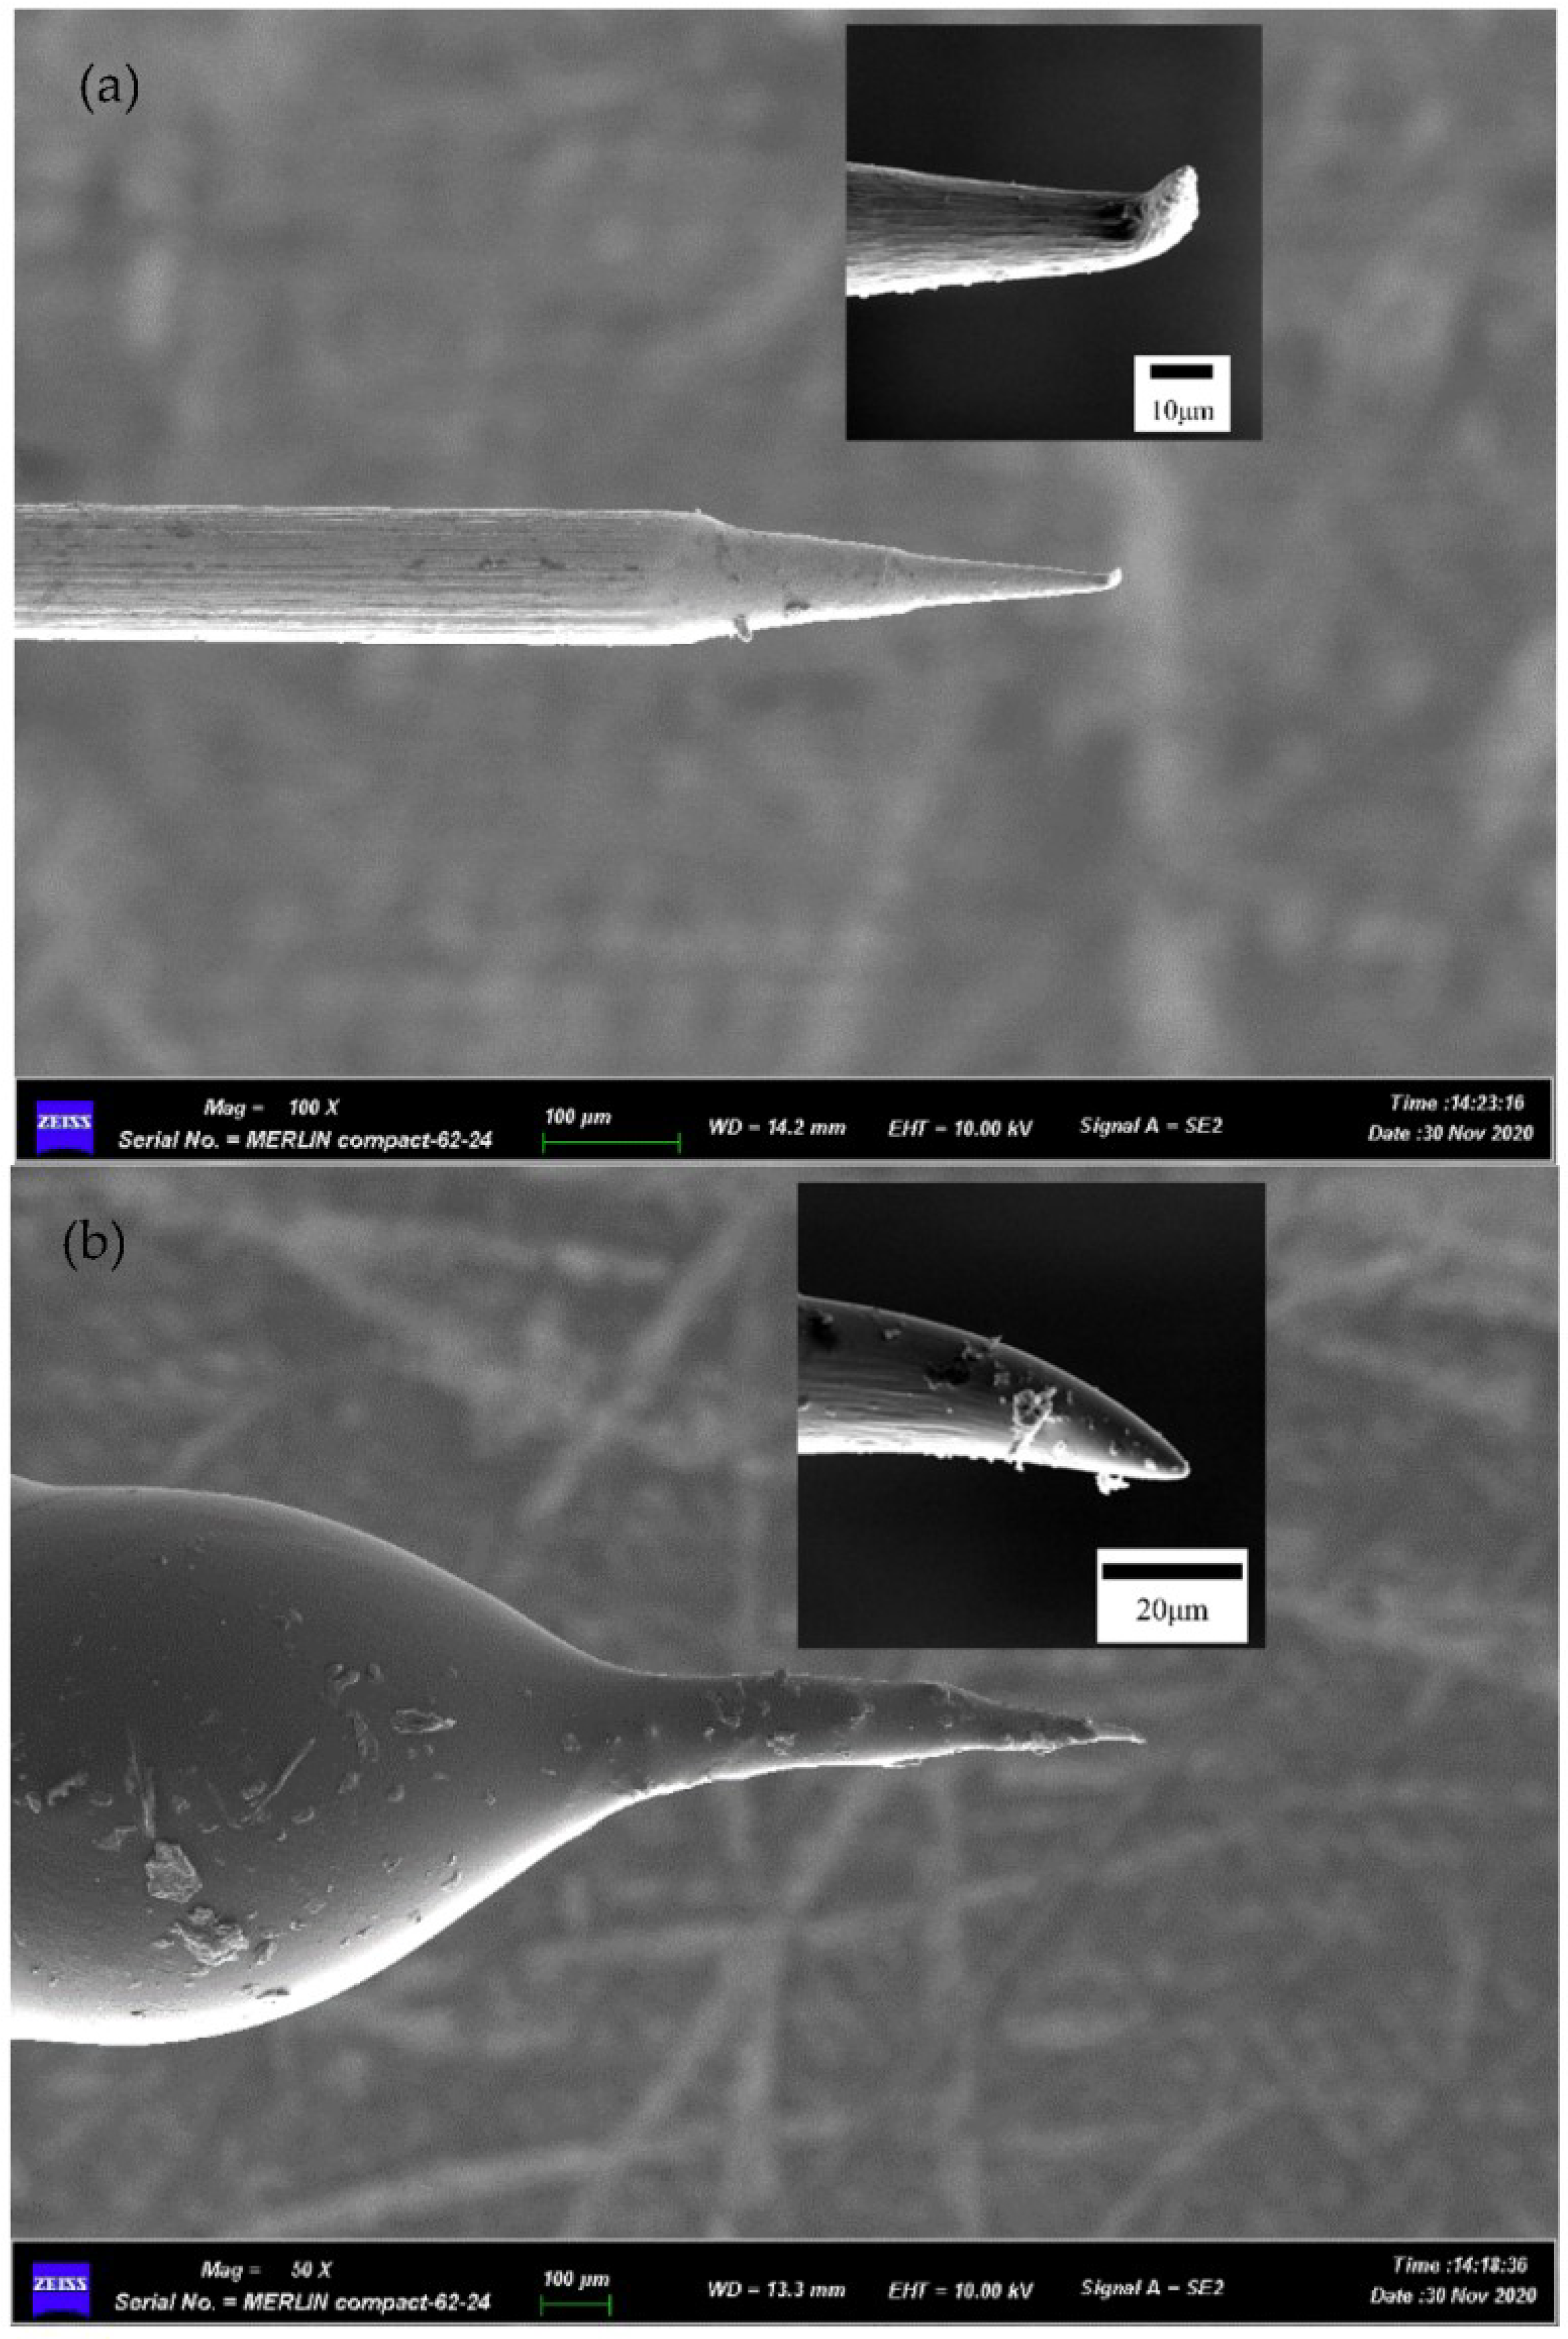
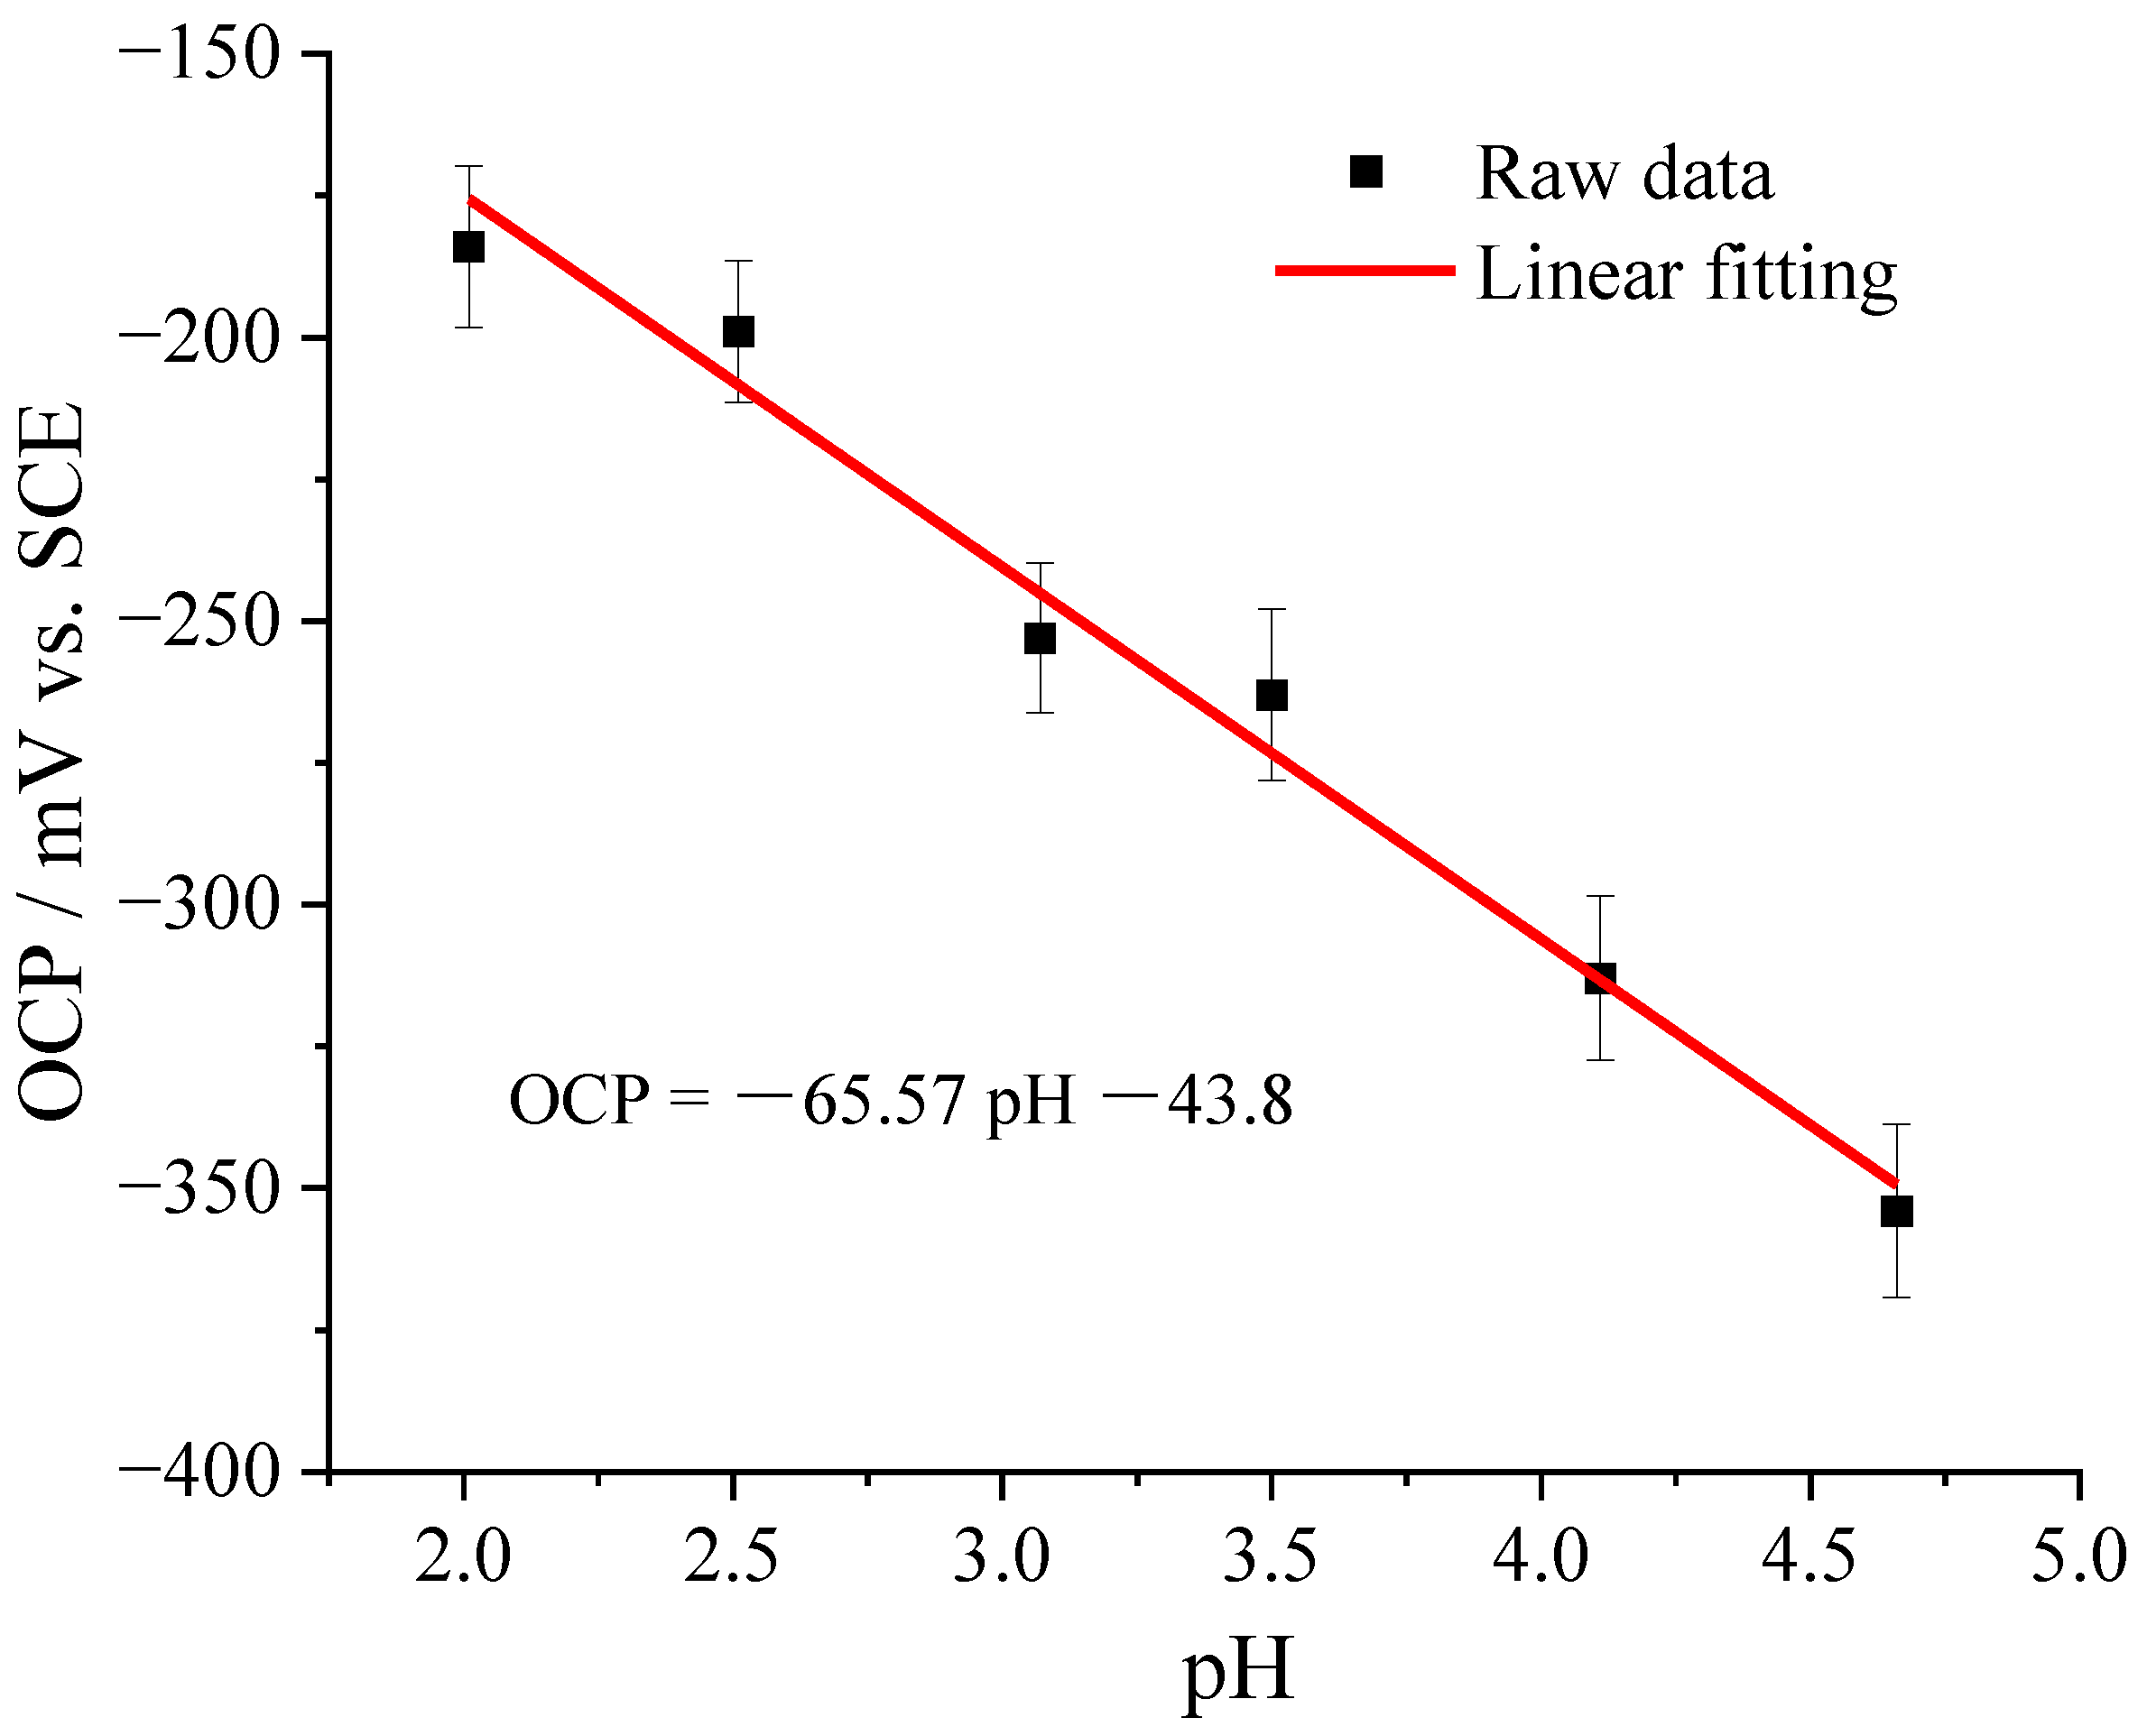
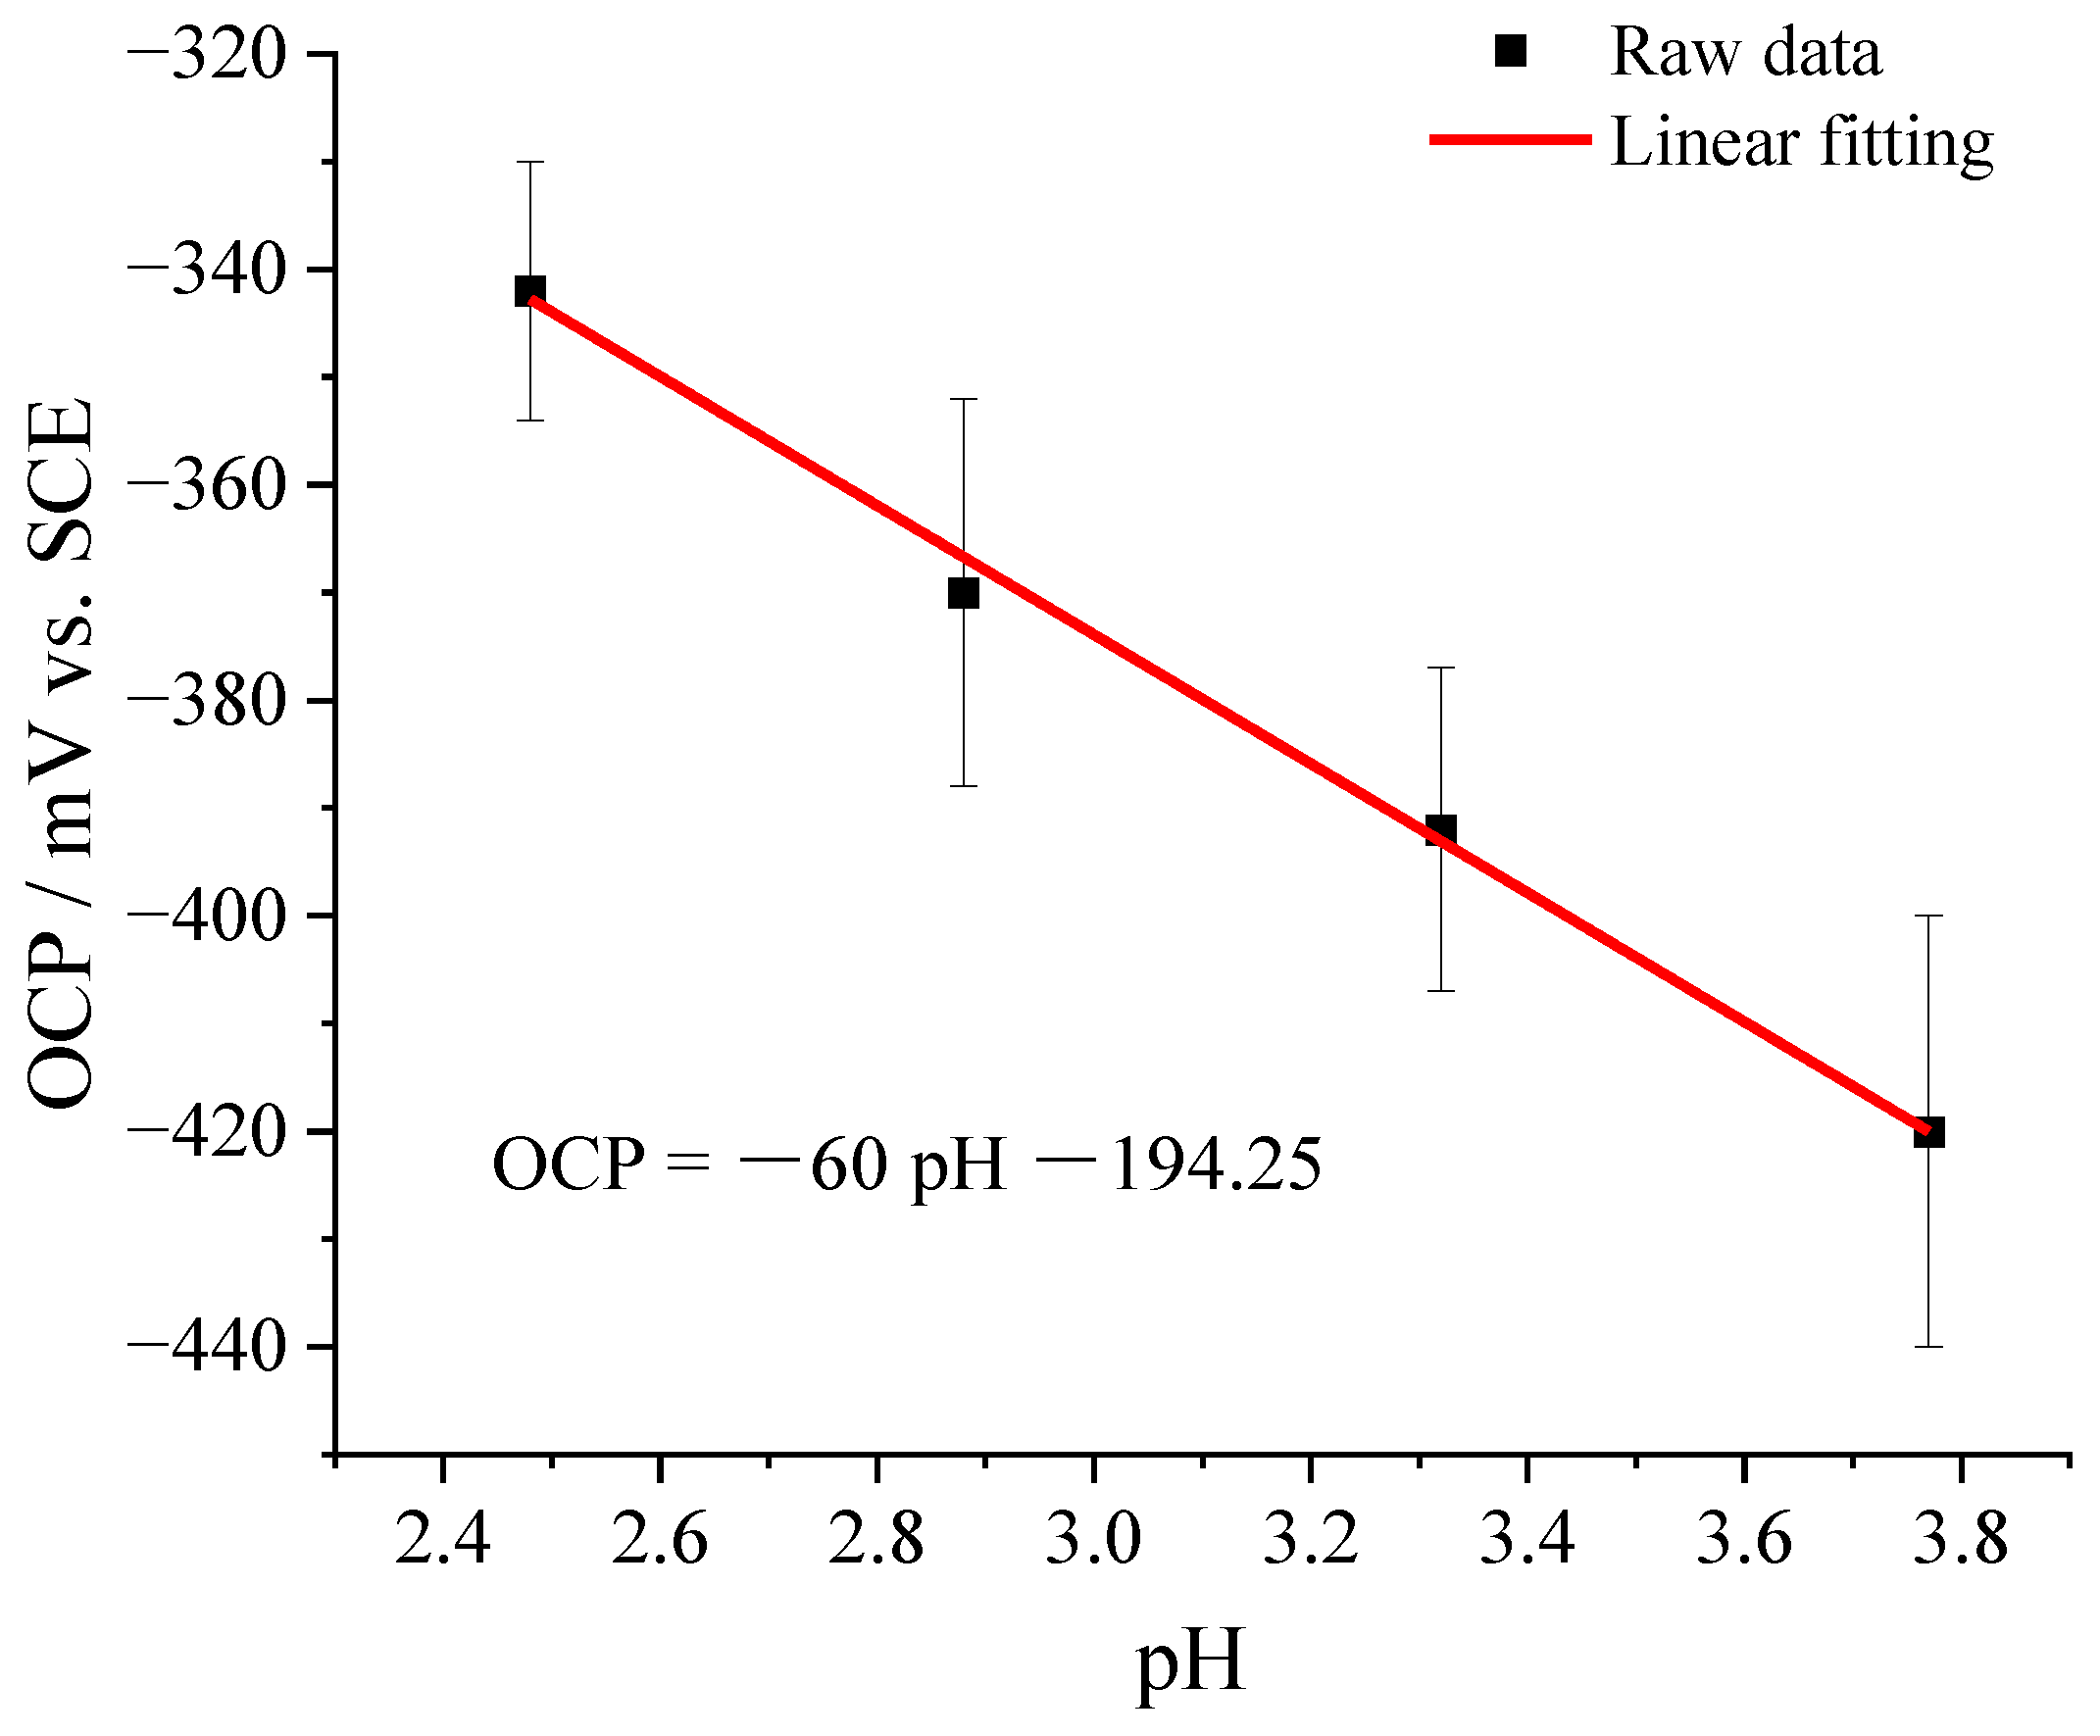
3.1. Tungsten Microelectrode and Calibration
3.2. Comparison of the pH Evolution at Light Alloys–Solution Interface
3.3. Plots of Aqueous Chemistry Balance Simulated with MEDUSA Software
3.4. pH Evolution during Coating Formation and Raman Spectra of SurTec and Cr/Zr Solution
4. Conclusions
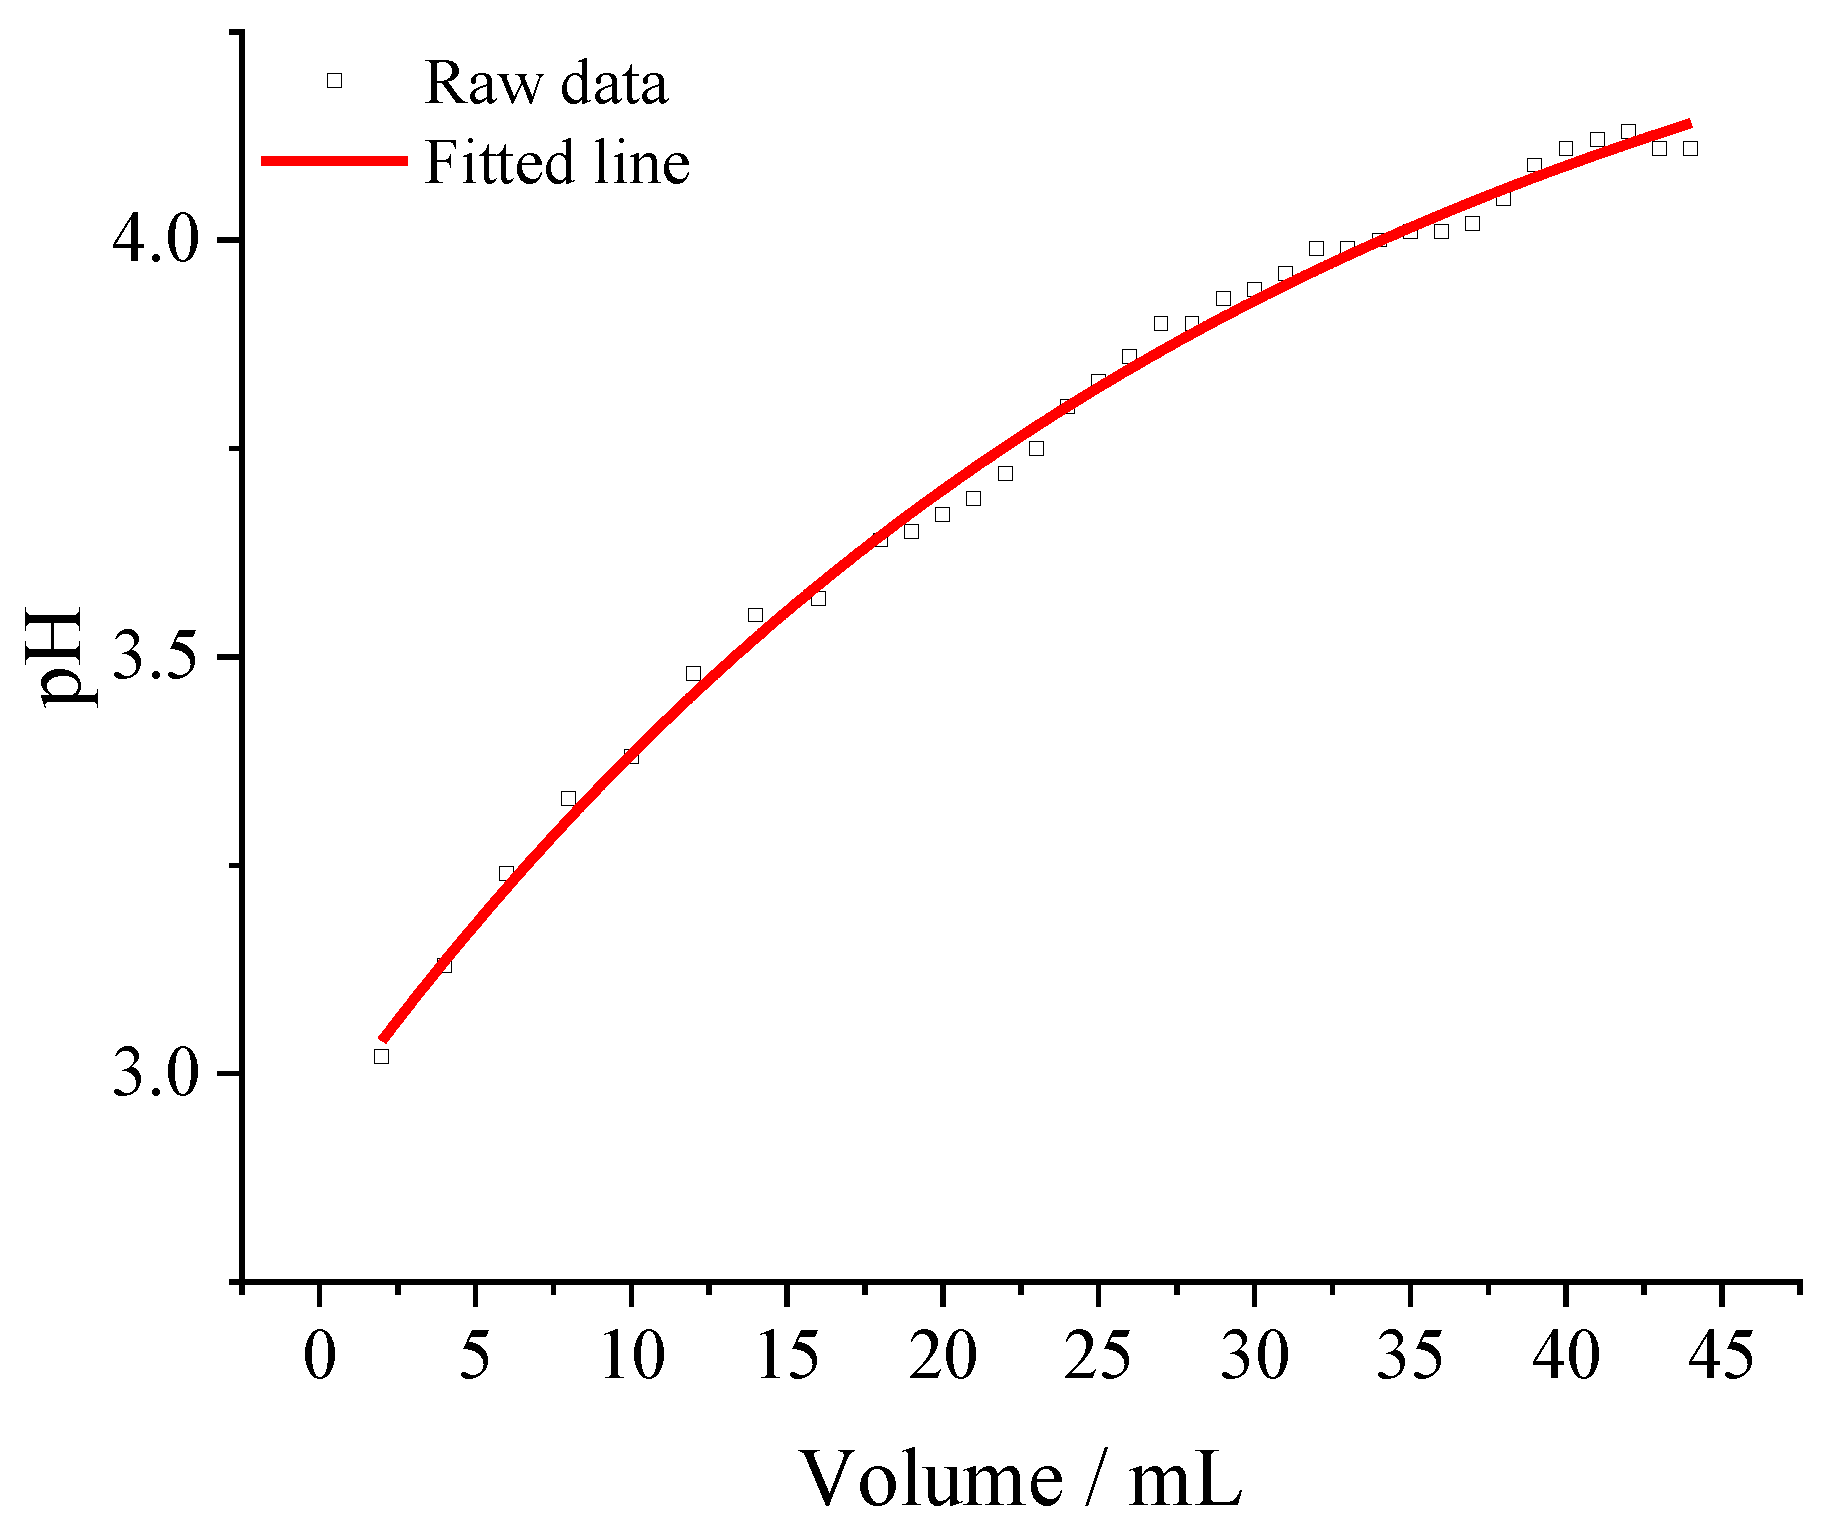
- In sulfuric acid and TCC coating solutions, the open circuit potential of the microelectrode changes linearly with the pH value of the solution. The tungsten microelectrode had a sensitivity of –60 mV/pH. The characteristics of the tungsten microelectrode was used to characterize the pH evolution of the metal–solution interface.
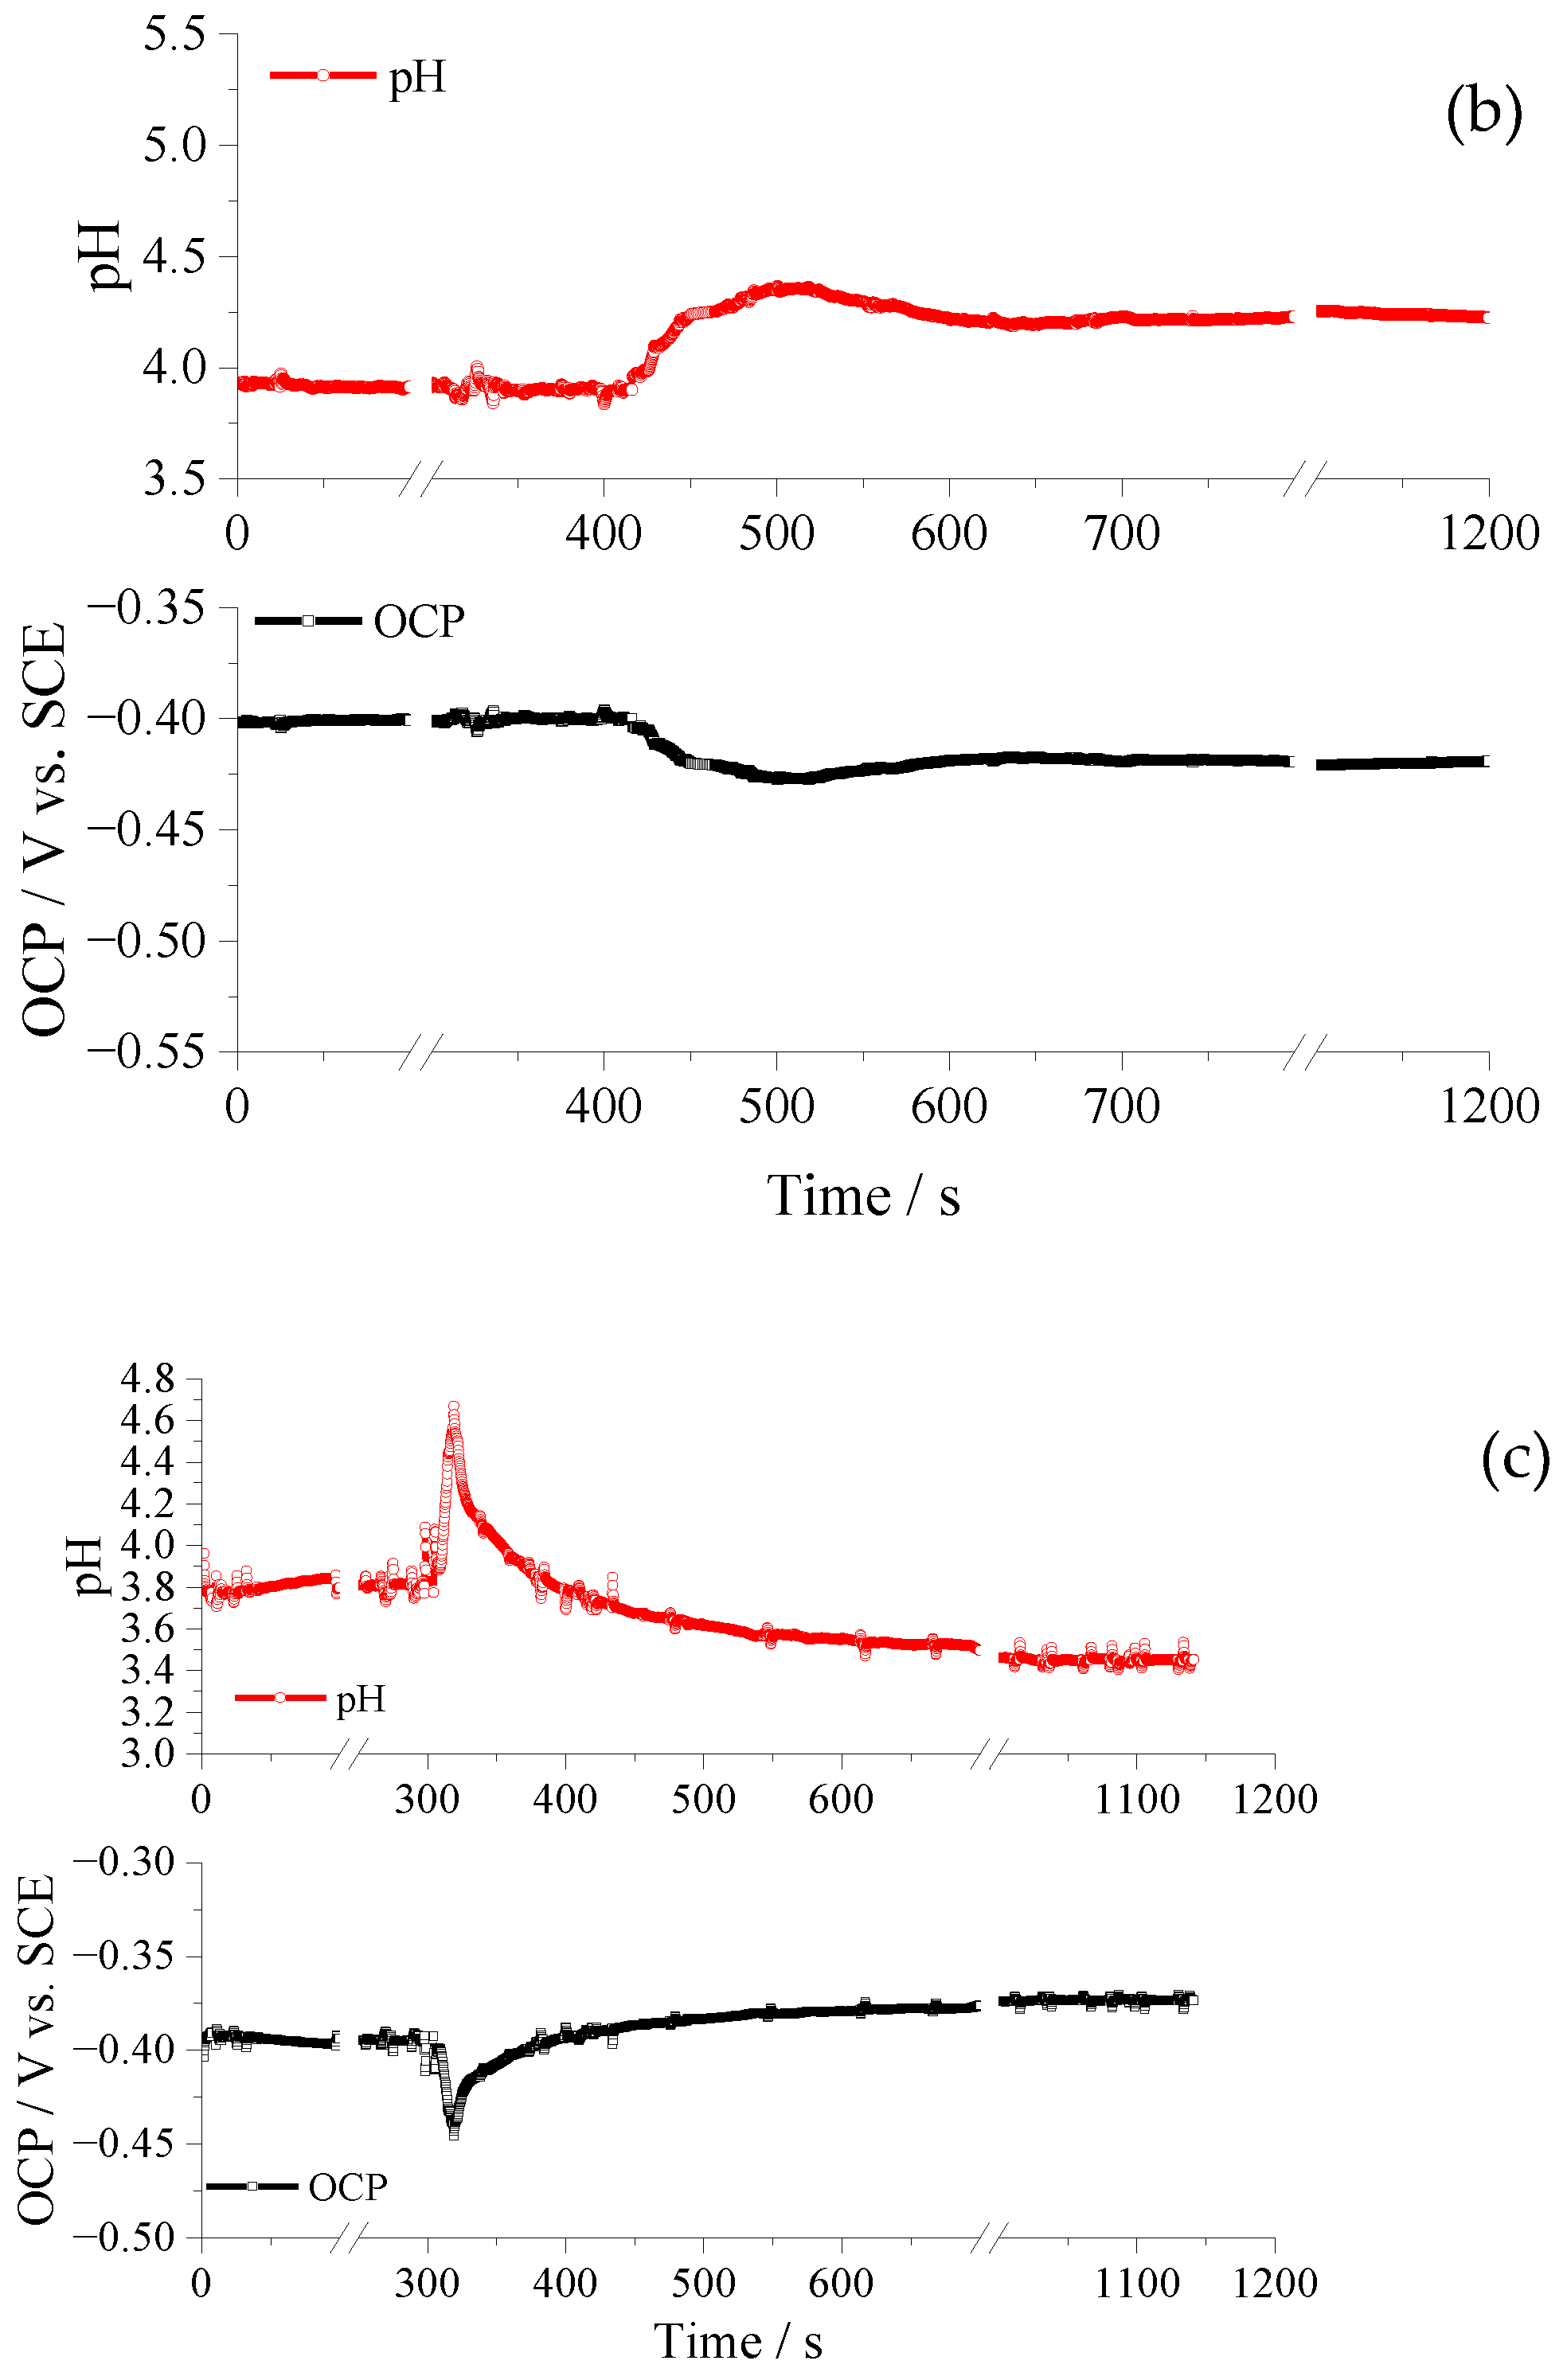
- During the forming process of TCC coatings, the pH of the metal–solution interface changes. The peak and final pH values for pre-treated Al, AA 2024 alloy and AZ91D alloy were 4.9 and 3.5, 4.3 and 4.1, 4.7 and 3.5, respectively.
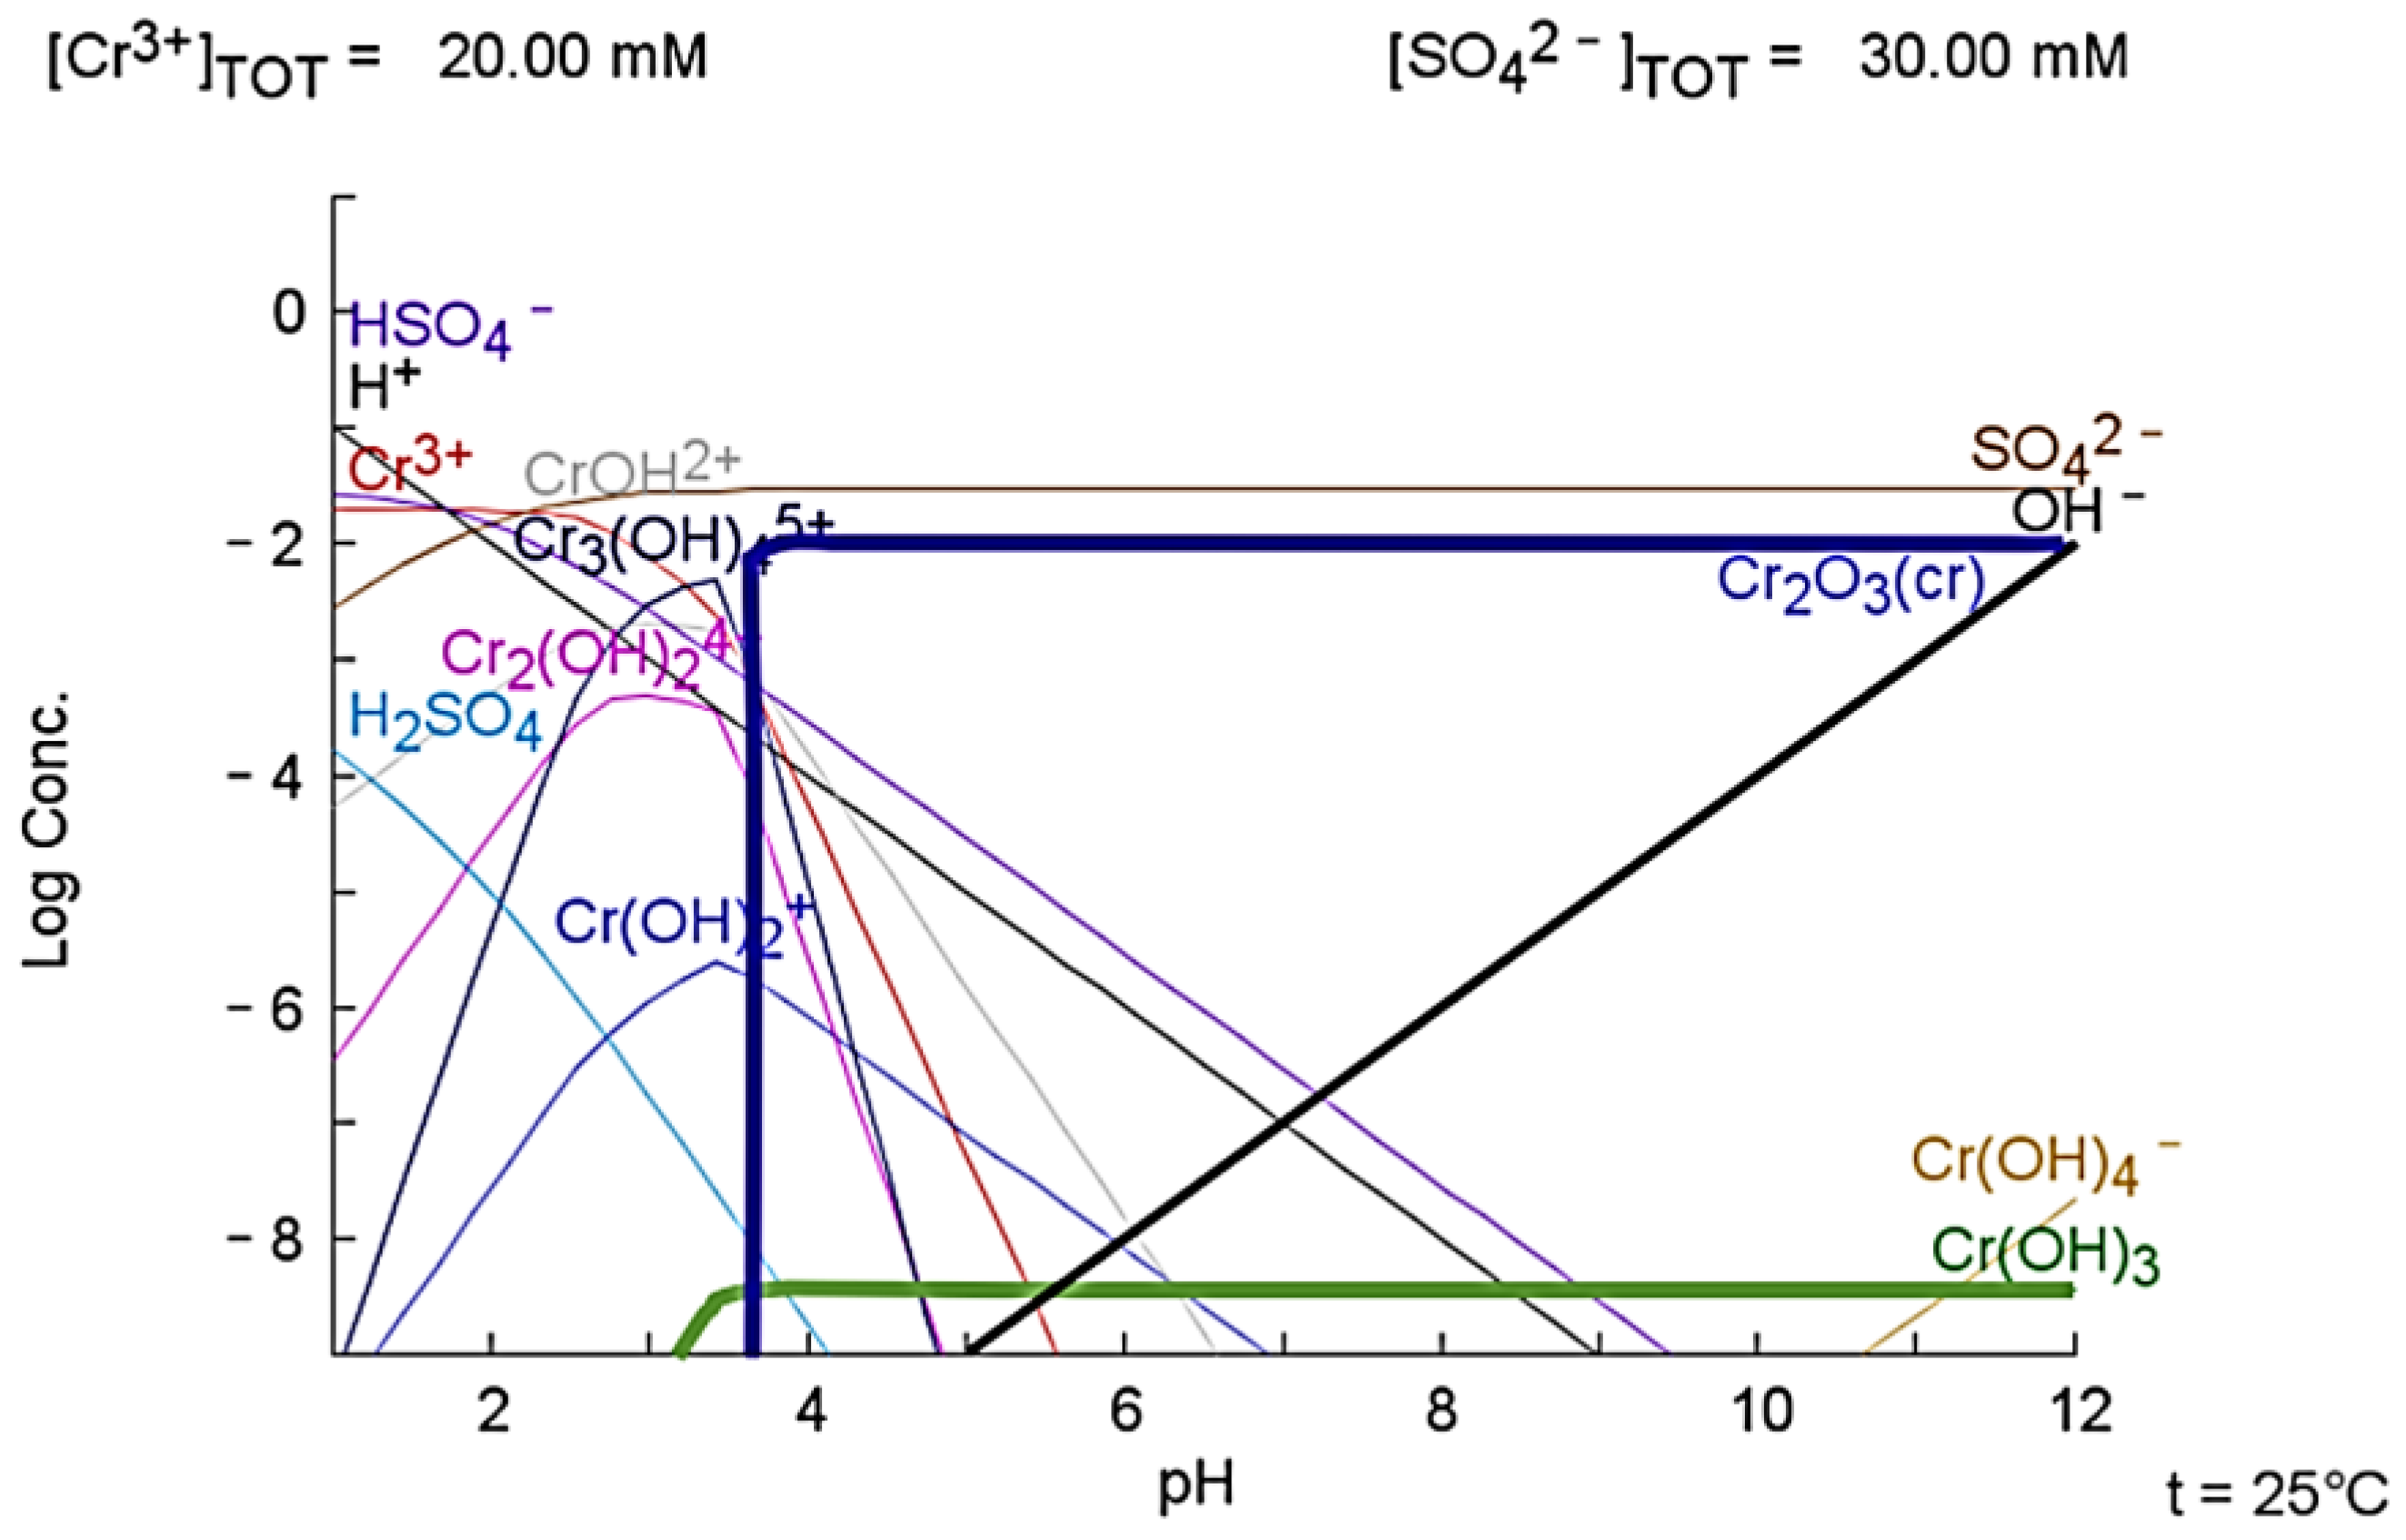
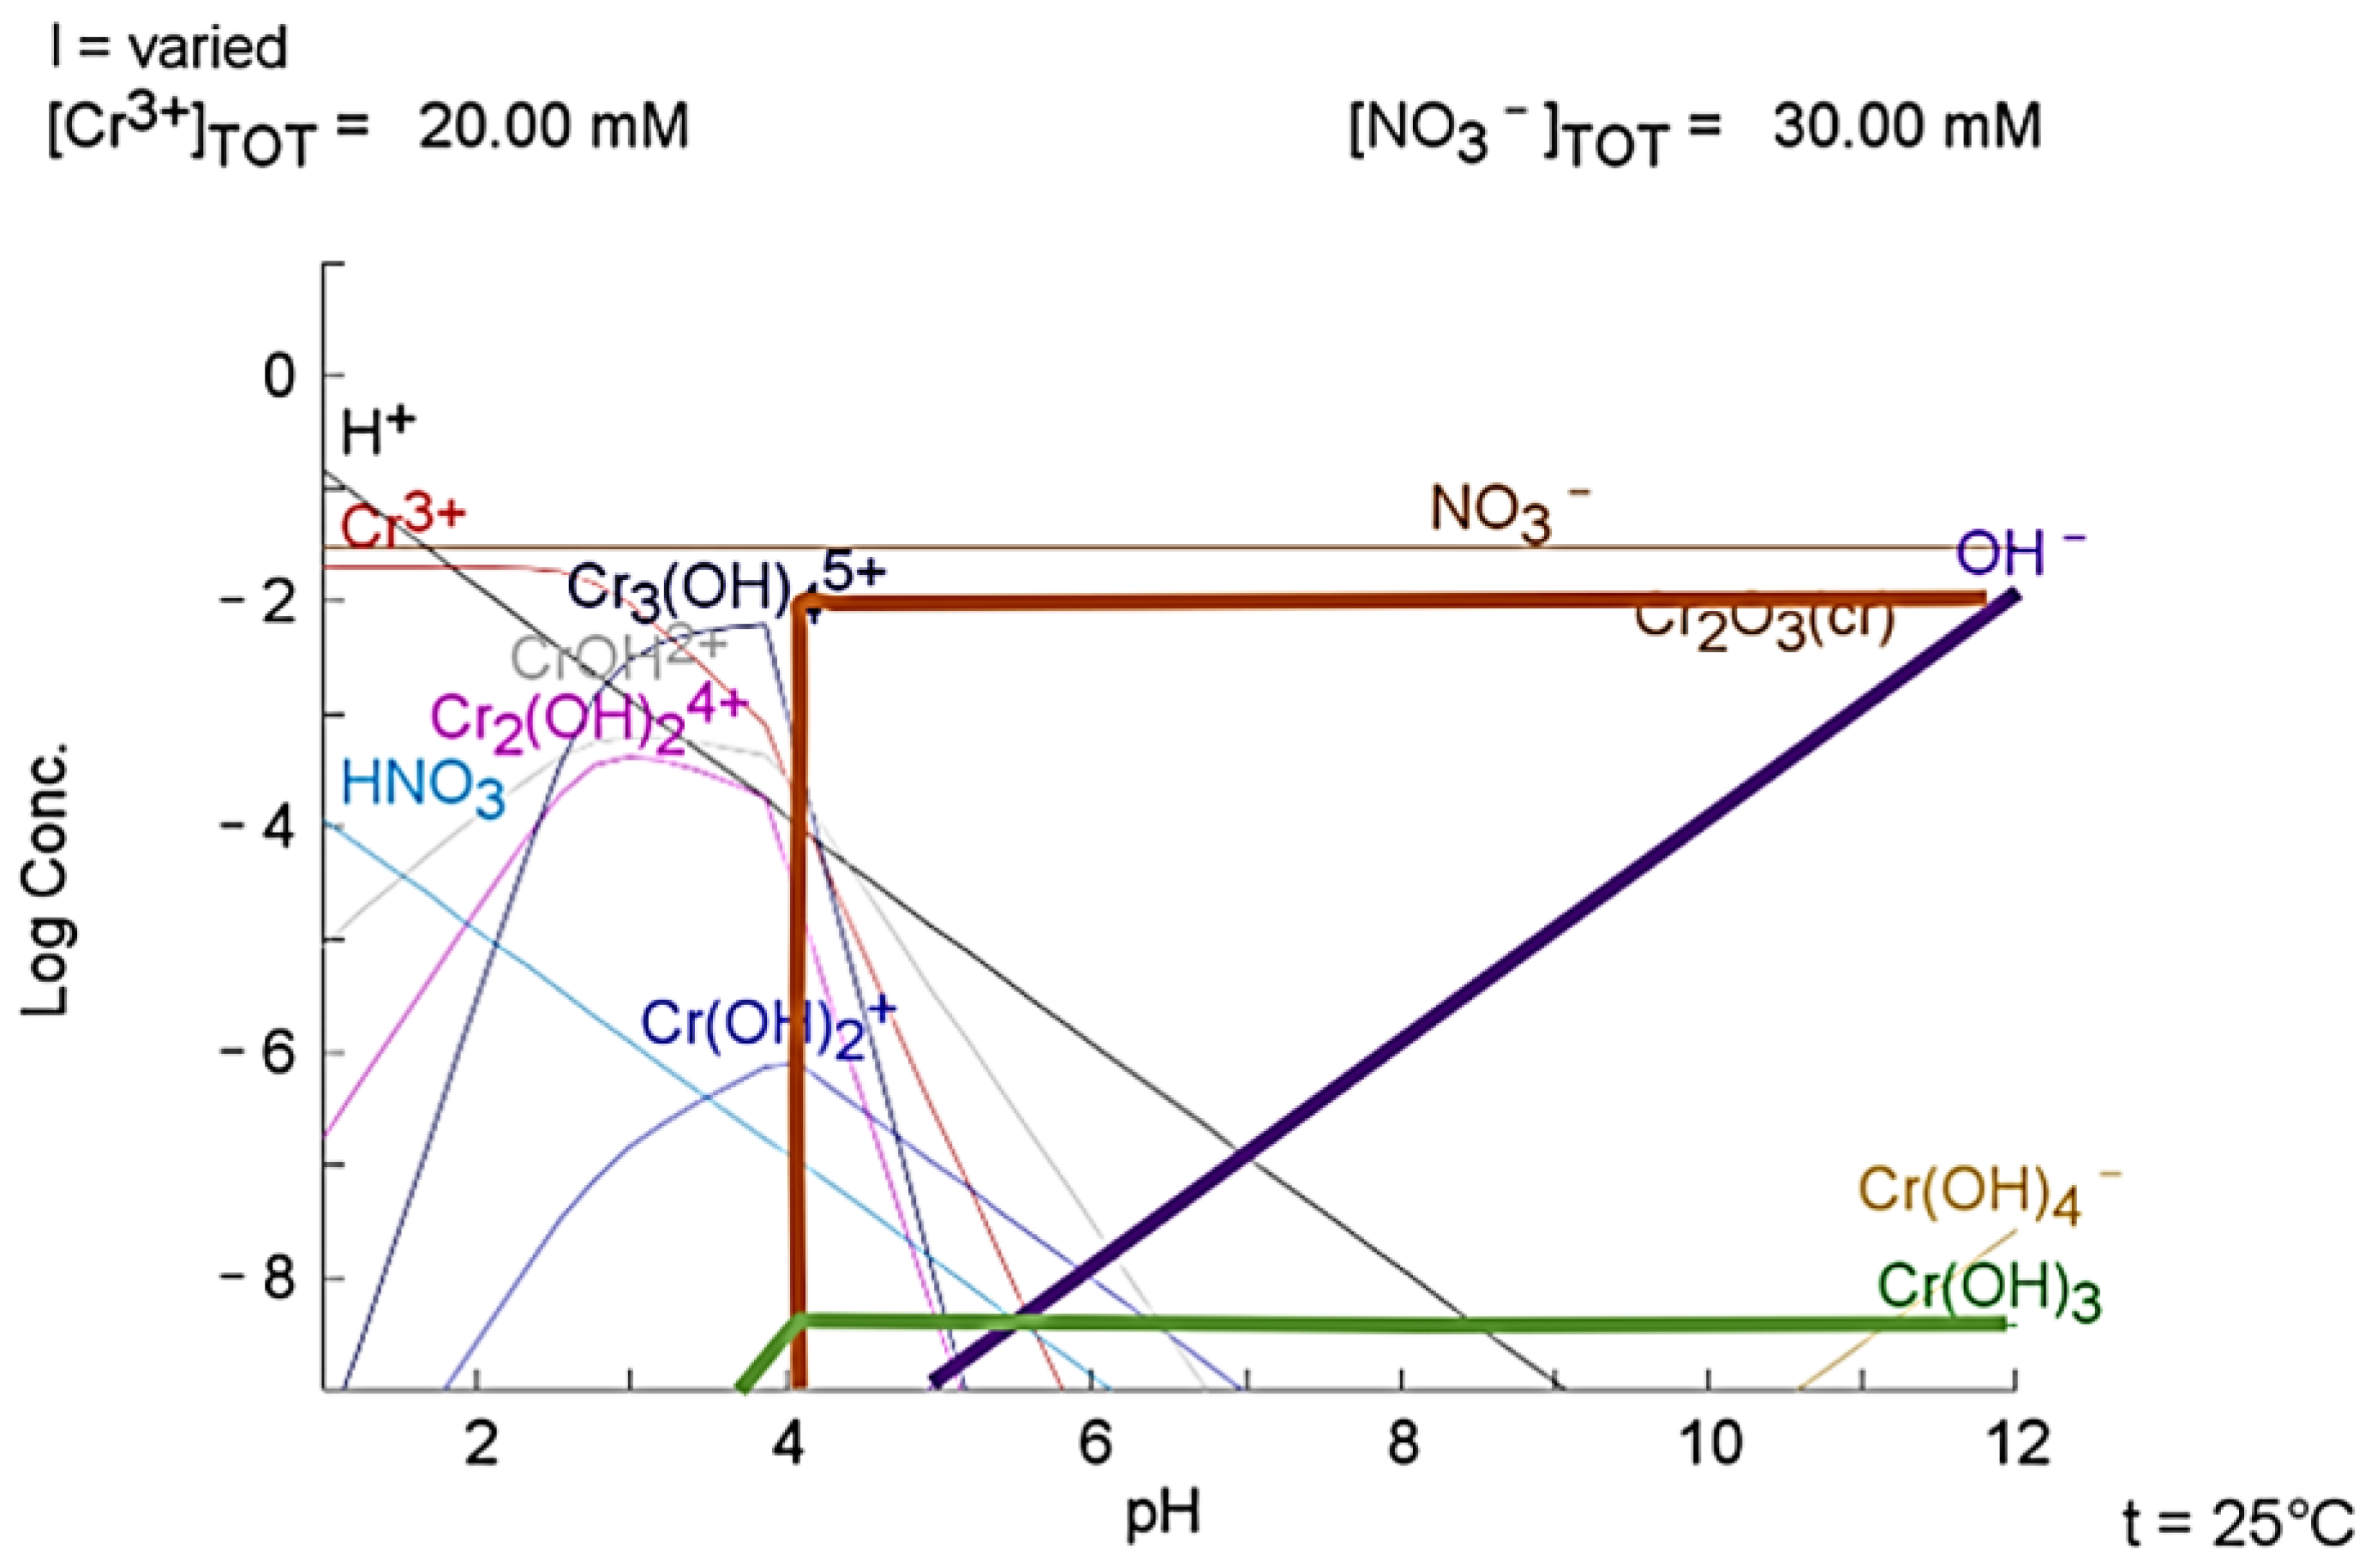
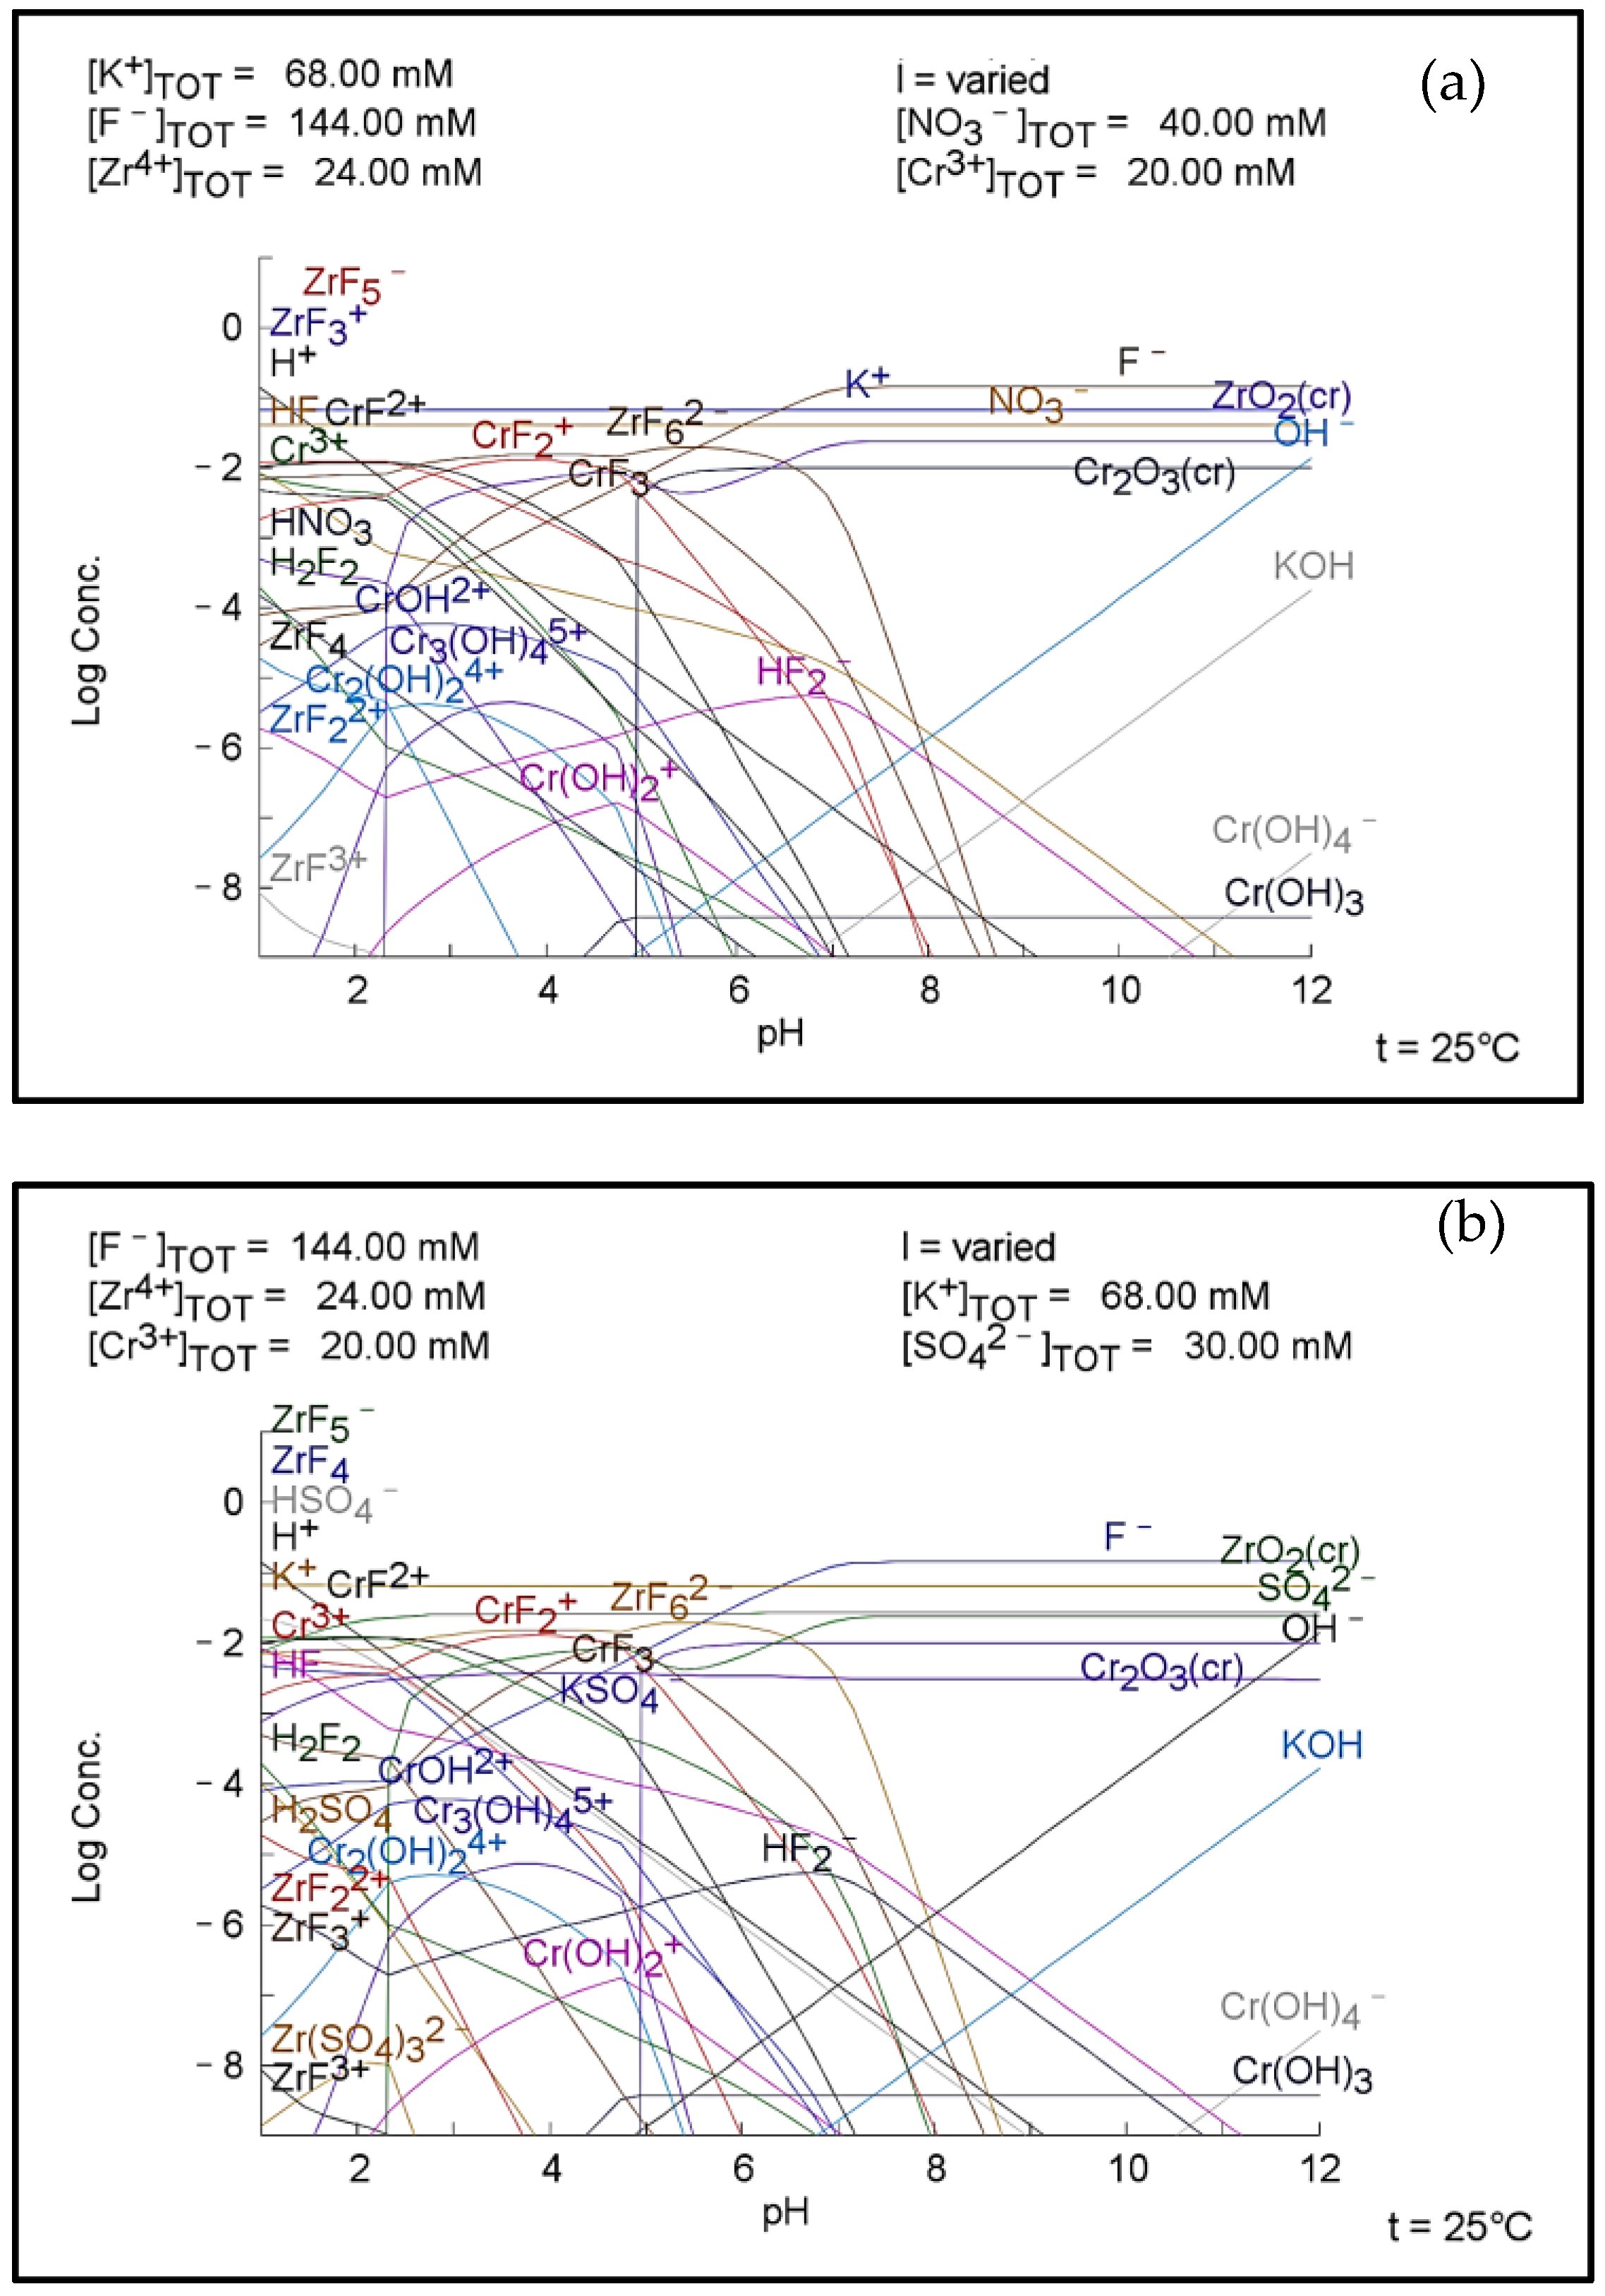
- The interfacial pH evolution is associated with a hydrolysis process of the weak acid nature of zirconium and chromium salts, being the main components of TCC-coating solutions.
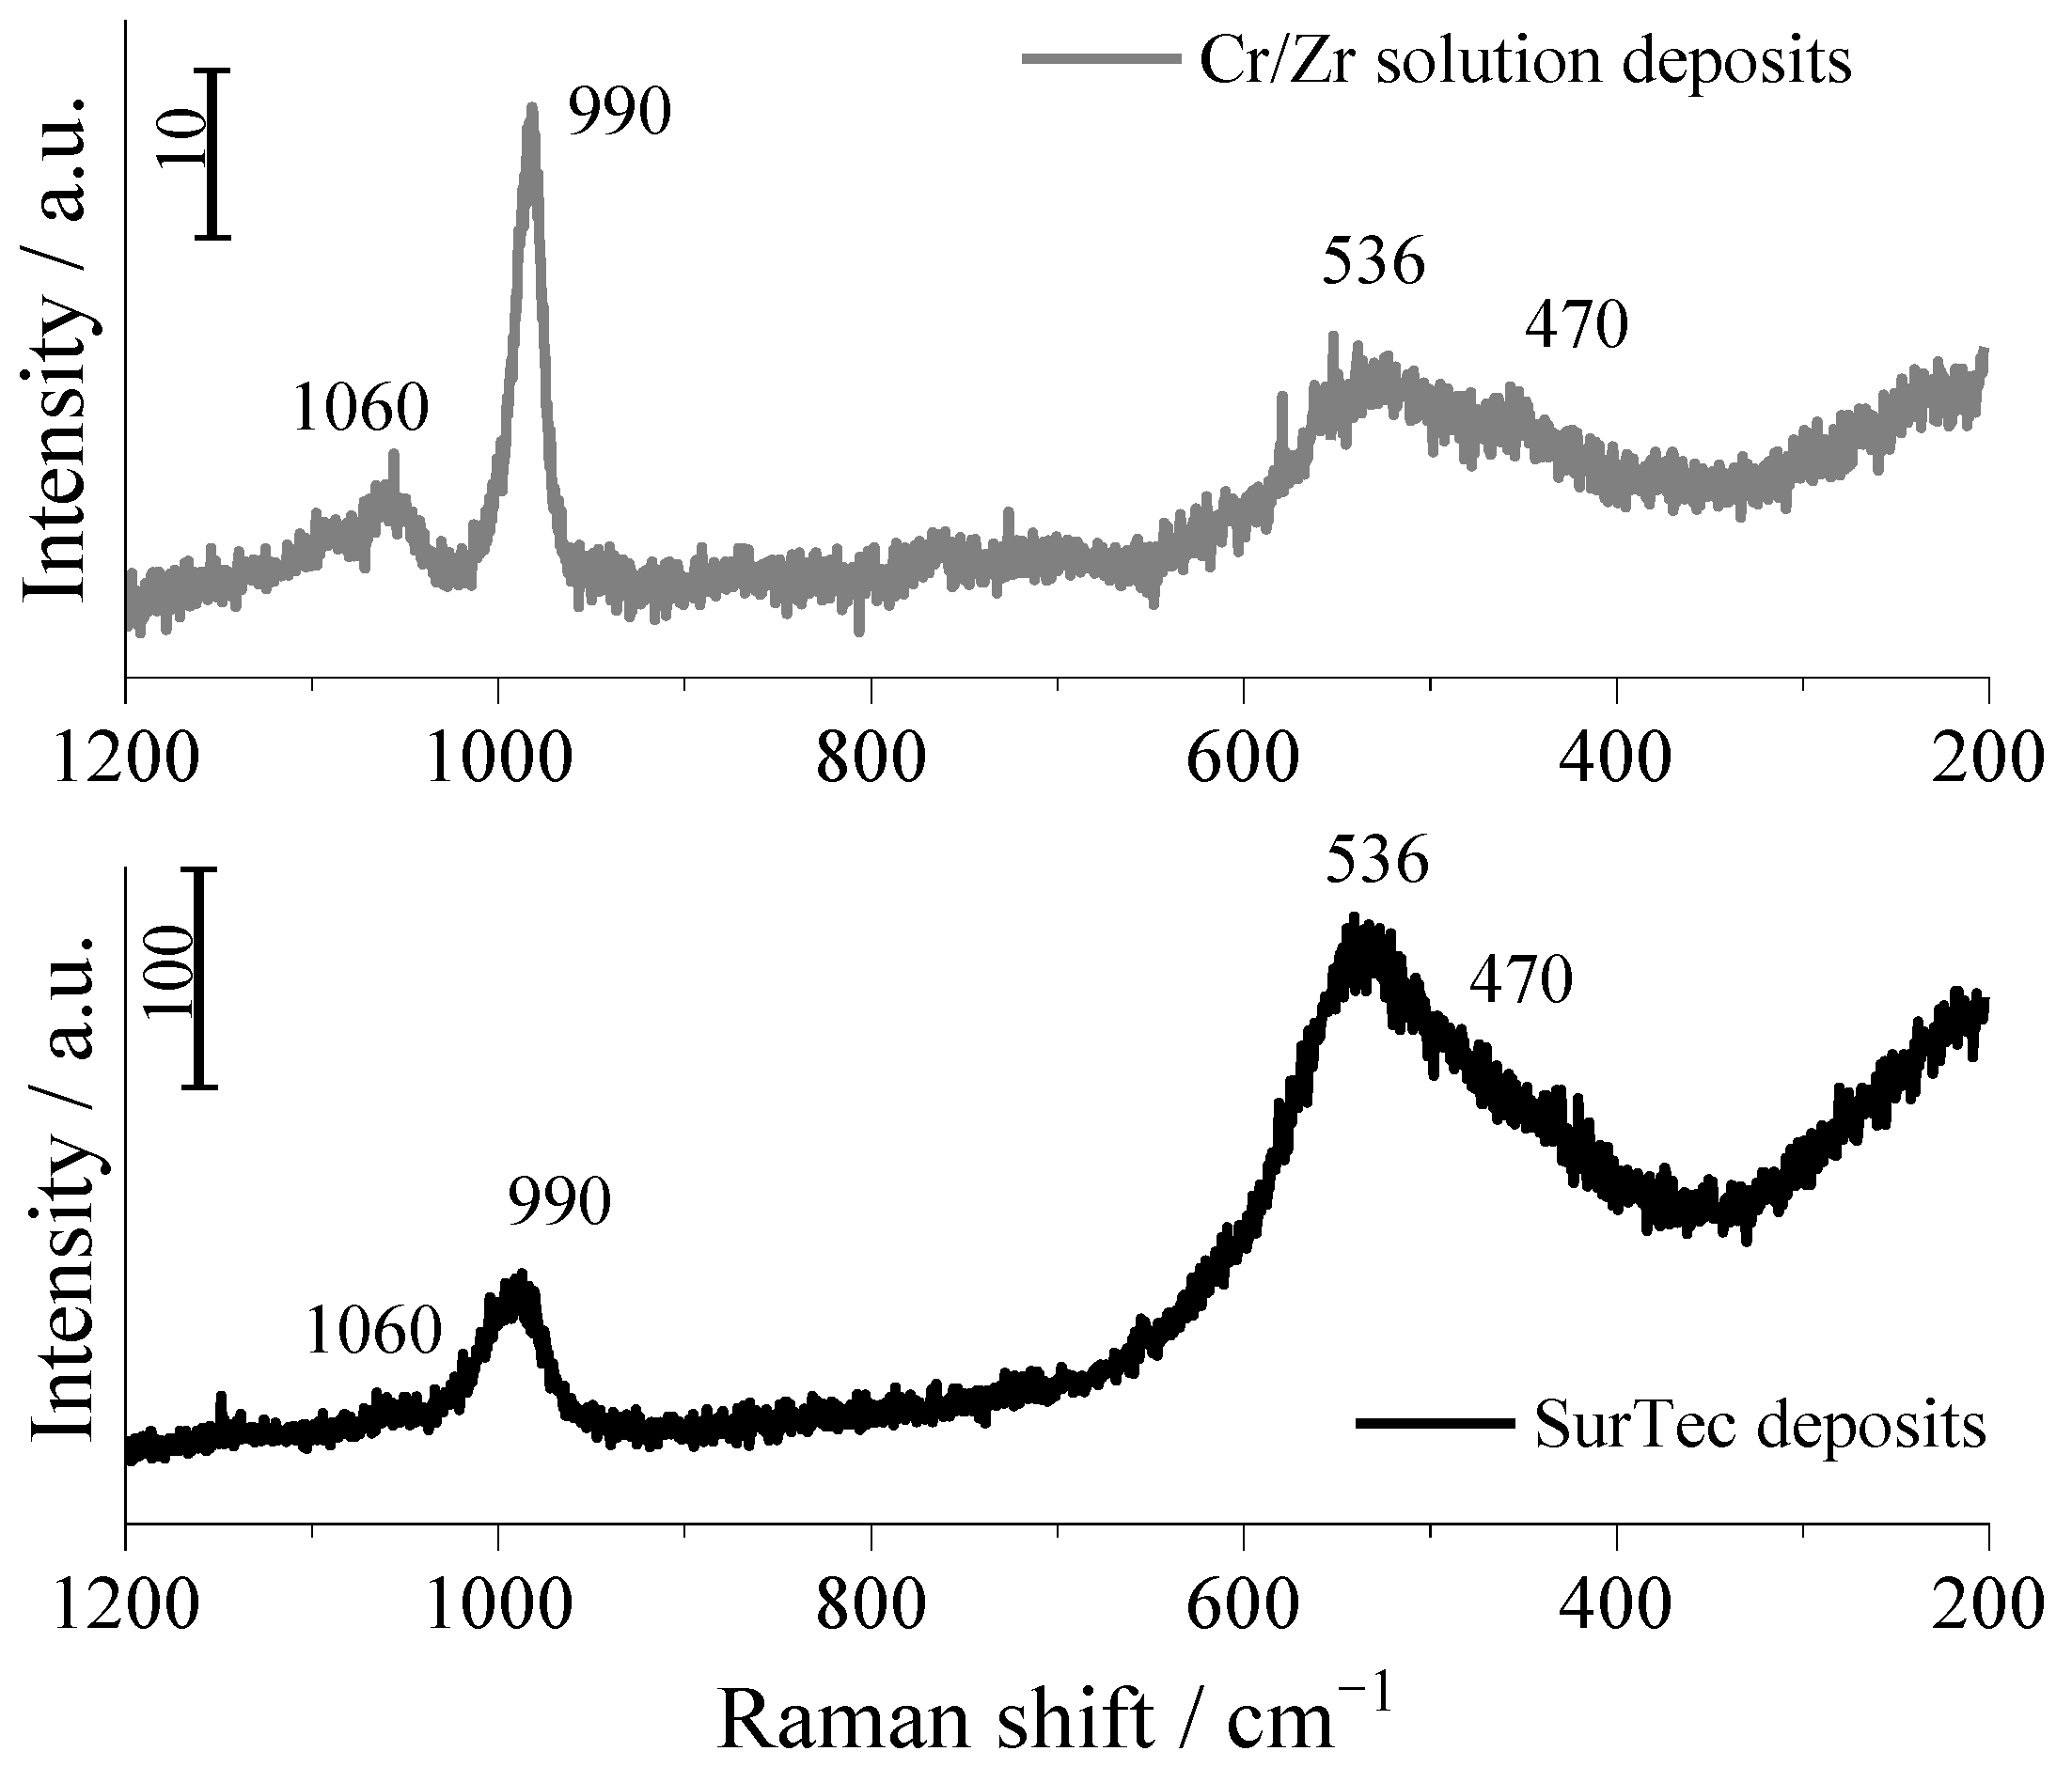
- Raman spectra revealed the presence of chromium and zirconium oxides and sulphate in the solution deposits from Cr/Zr and SurTec solutions.
Author Contributions
Funding
Institutional Review Board Statement
Informed Consent Statement
Data Availability Statement
Conflicts of Interest
References
- Hughes, A.E.; Taylor, R.J.; Hinton, B.R.W. Chromate Conversion Coatings on 2024 Al Alloy. Surf. Interface Anal. 1997, 25, 223–234. [Google Scholar] [CrossRef]
- Bouali, A.; Serdechnova, M.; Blawert, C.; Tedim, J.; Ferreira, M.; Zheludkevich, M. Layered double hydroxides (LDHs) as functional materials for the corrosion protection of aluminum alloys: A review. Appl. Mater. Today 2020, 21, 100857. [Google Scholar] [CrossRef]
- Zhou, P.; Yang, L.; Hou, Y.; Duan, G.; Yu, B.; Li, X.; Zhai, Y.; Zhang, B.; Zhang, T.; Wang, F. Grain refinement promotes the formation of phosphate conversion coating on Mg alloy AZ91D with high corrosion resistance and low electrical contact resistance. Corros. Commun. 2021, 1, 47–57. [Google Scholar] [CrossRef]
- Wang, B.; Liu, X.; Wang, Y.; Ding, J.; Wei, S.; Xia, X.; Liu, M.; Xu, B. Microstructure and anti-corrosion properties of supersonic plasma sprayed Al-coating with Nano-Ti polymer sealing on AZ91-Magnesium alloy. J. Mater. Res. Technol. 2022, 21, 2730–2742. [Google Scholar] [CrossRef]
- Dai, X.; Wu, L.; Xia, Y.; Chen, Y.; Zhang, Y.; Jiang, B.; Xie, Z.; Ci, W.; Zhang, G.; Pan, F. Intercalation of Y in Mg-Al layered double hydroxide films on anodized AZ31 and Mg-Y alloys to influence corrosion protective performance. Appl. Surf. Sci. 2021, 551, 149432. [Google Scholar] [CrossRef]
- Egorkin, V.S.; Medvedev, I.M.; Sinebryukhov, S.L.; Vyaliy, I.E.; Gnedenkov, A.S.; Nadaraia, K.V.; Izotov, N.; Mashtalyar, D.V.; Gnedenkov, S.V. Atmospheric and Marine Corrosion of PEO and Composite Coatings Obtained on Al-Cu-Mg Aluminum Alloy. Materials 2020, 13, 2739. [Google Scholar] [CrossRef]
- Rahmati, M.; Raeissi, K.; Toroghinejad, M.R.; Hakimizad, A.; Santamaria, M. Effect of Pulse Current Mode on Microstructure, Composition and Corrosion Performance of the Coatings Produced by Plasma Electrolytic Oxidation on AZ31 Mg Alloy. Coatings 2019, 9, 688. [Google Scholar] [CrossRef] [Green Version]
- Egorkin, V.S.; Mashtalyar, D.V.; Gnedenkov, A.S.; Filonina, V.S.; Vyaliy, I.E.; Nadaraia, K.V.; Imshinetskiy, I.M.; Belov, E.A.; Izotov, N.V.; Sinebryukhov, S.L.; et al. Icephobic Performance of Combined Fluorine-Containing Composite Layers on Al-Mg-Mn–Si Alloy Surface. Polymers 2021, 13, 3827. [Google Scholar] [CrossRef]
- Kendig, M.W.; Buchheit, R.G. Corrosion Inhibition of Aluminum and Aluminum Alloys by Soluble Chromates, Chromate Coatings, and Chromate-Free Coatings. Corrosion 2003, 59, 379–400. [Google Scholar] [CrossRef]
- Gharbi, O.; Thomas, S.; Smith, C.; Birbilis, N. Chromate replacement: What does the future hold? npj Mater. Degrad. 2018, 2, 12. [Google Scholar] [CrossRef]
- Mohammadi, I.; Shahrabi, T.; Mahdavian, M.; Izadi, M. Chemical modification of LDH conversion coating with diethyldithiocarbamate as a novel anti-corrosive film for AA2024-T3. J. Ind. Eng. Chem. 2021, 95, 134–147. [Google Scholar] [CrossRef]
- Peltier, F.; Thierry, D. Review of Cr-Free Coatings for the Corrosion Protection of Aluminum Aerospace Alloys. Coatings 2022, 12, 518. [Google Scholar] [CrossRef]
- Wei, H.; Tang, J.; Chen, X.; Tang, Y.; Zhao, X.; Zuo, Y. Influence of organic and inorganic cerium salts on the protective performance of epoxy coating. Prog. Org. Coat. 2022, 166, 106763. [Google Scholar] [CrossRef]
- Pearlstein, F.; Agarwala, V.S. Trivalent Chromium Solutions for Applying Chemical Conversion Coatings to Aluminium Alloys or for Sealing Anodied Aluminium. Plat. Surf. Finish 1994, 81, 50–55. [Google Scholar]
- Mitton, D.B.; Carangelo, A.; Acquesta, A.; Monetta, T.; Curioni, M.; Bellucci, F. Selected Cr(VI) replacement options for aluminum alloys: A literature survey. Corros. Rev. 2017, 35, 365–381. [Google Scholar] [CrossRef]
- Qi, J.T.; Hashimoto, T.; Walton, J.; Zhou, X.; Skeldon, P.; Thompson, G. Trivalent chromium conversion coating formation on aluminium. Surf. Coat. Technol. 2015, 280, 317–329. [Google Scholar] [CrossRef]
- Qi, J.; Thompson, G.E. Comparative studies of thin film growth on aluminium by AFM, TEM and GDOES characterization. Appl. Surf. Sci. 2016, 377, 109–120. [Google Scholar] [CrossRef]
- Morose, G.; Pinsky, D.; Humphrey, C.; DeFranco, K. Evaluation of Conversion Coatings Without Hexavalent Chromium for Aerospace and Defense Applications. J. Aerosp. Technol. Manag. 2022, 14, e0522. [Google Scholar] [CrossRef]
- Shahini, M.H.; Mohammadloo, H.E.; Ramezanzadeh, B. Recent advances in steel surface treatment via novel/green conversion coatings for anti-corrosion applications: A review study. J. Coatings Technol. Res. 2022, 19, 159–199. [Google Scholar] [CrossRef]
- Samaei, A.; Chaudhuri, S. Role of zirconium conversion coating in corrosion performance of aluminum alloys: An integrated first-principles and multiphysics modeling approach. Electrochim. Acta 2022, 433, 14. [Google Scholar] [CrossRef]
- Guo, Y.; Frankel, G. Characterization of trivalent chromium process coating on AA2024-T3. Surf. Coatings Technol. 2012, 206, 3895–3902. [Google Scholar] [CrossRef]
- Qi, J.; Hashimoto, T.; Walton, J.; Zhou, X.; Skeldon, P.; Thompson, G.E. Formation of a Trivalent Chromium Conversion Coating on AA2024-T351 Alloy. J. Electrochem. Soc. 2016, 163, C25–C35. [Google Scholar] [CrossRef]
- Li, L. Corrosion Protection Provided by Trivalent Chromium Process Conversion Coatings on Aluminium Alloys. Ph.D. Thesis, Michigan State University, East Lansing, MI, USA, 2013. [Google Scholar]
- Qi, J.; Gao, L.; Li, Y.; Wang, Z.; Thompson, G.E.; Skeldon, P. An Optimized Trivalent Chromium Conversion Coating Process for AA2024-T351 Alloy. J. Electrochem. Soc. 2017, 164, C390–C395. [Google Scholar] [CrossRef]
- Lee, Y.; Chu, Y.; Chen, F.; Lin, C. Mechanism of the formation of stannate and cerium conversion coatings on AZ91D magnesium alloys. Appl. Surf. Sci. 2013, 276, 578–585. [Google Scholar] [CrossRef]
- Munson, C.A.; Swain, G.M. Structure and chemical composition of different variants of a commercial trivalent chromium process (TCP) coating on aluminum alloy 7075-T6. Surf. Coat. Technol. 2017, 315, 150–162. [Google Scholar] [CrossRef] [Green Version]
- Stoica, A.-I.; Światowska, J.; Romaine, A.; Di Franco, F.; Qi, J.; Mercier, D.; Seyeux, A.; Zanna, S.; Marcus, P. Influence of post-treatment time of trivalent chromium protection coating on aluminium alloy 2024-T3 on improved corrosion resistance. Surf. Coat. Technol. 2019, 369, 186–197. [Google Scholar] [CrossRef] [Green Version]
- Shruthi, T.K.; Walton, J.; McFall-Boegeman, S.; Westre, S.; Swain, G.M. Investigation of the Trivalent Chromium Process Conversion Coating as a Sealant for Anodized AA2024-T3. J. Electrochem. Soc. 2020, 167, 111504. [Google Scholar] [CrossRef]
- Zhang, X.; Zhou, X.; Hashimoto, T.; Liu, B. Localized corrosion in AA2024-T351 aluminium alloy: Transition from intergranular corrosion to crystallographic pitting. Mater. Charact. 2017, 130, 230–236. [Google Scholar] [CrossRef]
- Park, J.O.; Paik, C.; Alkire, R.C. Scanning Microsensors for Measurement of Local pH Distributions at the Microscale. J. Electrochem. Soc. 1996, 143, L174–L176. [Google Scholar] [CrossRef]
- Li, L.; Desouza, A.L.; Swain, G.M. In situ pH measurement during the formation of conversion coatings on an aluminum alloy (AA2024). Analyst 2013, 138, 4398–4402. [Google Scholar] [CrossRef]
- Saillard, R.; Zanna, S.; Seyeux, A.; Fori, B.; Światowska, J.; Blanc, C.; Marcus, P. Influence of ageing on the corrosion behaviour of 2024 aluminium alloy coated with a trivalent chromium conversion layer. Corros. Sci. 2021, 182, 109192. [Google Scholar] [CrossRef]
- Ju, B.-F.; Chen, Y.-L.; Ge, Y. The art of electrochemical etching for preparing tungsten probes with controllable tip profile and characteristic parameters. Rev. Sci. Instrum. 2011, 82, 013707. [Google Scholar] [CrossRef] [PubMed]
- Rahman, Z.; Das, A.K.; Chattopadhyaya, S. Fabrication of high aspect-ratio tungsten microtools through controlled electrochemical etching. Mater. Manuf. Process. 2021, 36, 1236–1247. [Google Scholar] [CrossRef]
- Zhang, C.; Liao, S.; Yu, B.; Lu, X.; Chen, X.-B.; Zhang, T.; Wang, F. Ratio of total acidity to pH value of coating bath: A new strategy towards phosphate conversion coatings with optimized corrosion resistance for magnesium alloys. Corros. Sci. 2019, 150, 279–295. [Google Scholar] [CrossRef]
- Chen, X.B.; Birbilis, N.; Abbott, T.B. Review of Corrosion-Resistant Conversion Coatings for Magnesium and Its Alloys. Corrosion 2011, 67, 035005-1. [Google Scholar] [CrossRef]
- Dong, X.; Wang, P.; Argekar, S.; Schaefer, D.W. Structure and Composition of Trivalent Chromium Process (TCP) Films on Al Alloy. Langmuir 2010, 26, 10833–10841. [Google Scholar] [CrossRef]
- Qi, J.; Gao, L.; Liu, Y.; Liu, B.; Hashimoto, T.; Wang, Z.; Thompson, G.E. Chromate Formed in a Trivalent Chromium Conversion Coating on Aluminum. J. Electrochem. Soc. 2017, 164, C442–C449. [Google Scholar] [CrossRef]
- Verdalet-Guardiola, X.; Fori, B.; Bonino, J.-P.; Duluard, S.; Blanc, C. Nucleation and growth mechanisms of trivalent chromium conversion coatings on 2024-T3 aluminium alloy. Corros. Sci. 2019, 155, 109–120. [Google Scholar] [CrossRef] [Green Version]
- Ning, G. Formation and Corrosion Resistance of Trivalent Chromium Conversion Coating on AZ91D Magnesium Alloys. Master’s Thesis, China University of Petroleum (East China), Qingdao, China, 2020. Available online: https://kns.cnki.net/KCMS/detail/detail.aspx?dbname=CMFDTEMP&filename=1022634764.nh (accessed on 1 November 2022).
- Wen, N.-T.; Lin, C.-S.; Bai, C.-Y.; Ger, M.-D. Structures and characteristics of Cr(III)-based conversion coatings on electrogalvanized steels. Surf. Coat. Technol. 2008, 203, 317–323. [Google Scholar] [CrossRef]
- Wen, N.T.; Chen, F.J.; Ger, M.D.; Pan, Y.N.; Lin, C.S. Microstructure of Trivalent Chromium Conversion Coating on Electrogalvanized Steel Plate. Electrochem. Solid-State Lett. 2008, 11, C47–C50. [Google Scholar] [CrossRef]


Disclaimer/Publisher’s Note: The statements, opinions and data contained in all publications are solely those of the individual author(s) and contributor(s) and not of MDPI and/or the editor(s). MDPI and/or the editor(s) disclaim responsibility for any injury to people or property resulting from any ideas, methods, instructions or products referred to in the content. |
© 2023 by the authors. Licensee MDPI, Basel, Switzerland. This article is an open access article distributed under the terms and conditions of the Creative Commons Attribution (CC BY) license (https://creativecommons.org/licenses/by/4.0/).
Share and Cite
Sun, W.; Bian, G.; Jia, L.; Pai, J.; Ye, Z.; Wang, N.; Qi, J.; Li, T. Study of Trivalent Chromium Conversion Coating Formation at Solution—Metal Interface. Metals 2023, 13, 93. https://doi.org/10.3390/met13010093
Sun W, Bian G, Jia L, Pai J, Ye Z, Wang N, Qi J, Li T. Study of Trivalent Chromium Conversion Coating Formation at Solution—Metal Interface. Metals. 2023; 13(1):93. https://doi.org/10.3390/met13010093
Chicago/Turabian StyleSun, Wentao, Guixue Bian, Luanluan Jia, Junjun Pai, Zonghao Ye, Ning Wang, Jiantao Qi, and Tengjiao Li. 2023. "Study of Trivalent Chromium Conversion Coating Formation at Solution—Metal Interface" Metals 13, no. 1: 93. https://doi.org/10.3390/met13010093