Communication

On the Generation of Excess Solid Fraction in the RheoMetal Process

by
Anders E. W. Jarfors
Materials and Manufacturing, School of Engineering, Jönköping University, 55111 Jönköping, Sweden
Metals 2023, 13(10), 1644; https://doi.org/10.3390/met13101644
Submission received: 21 August 2023 / Revised: 18 September 2023 / Accepted: 24 September 2023 / Published: 25 September 2023
(This article belongs to the Section Metal Casting, Forming and Heat Treatment)

Abstract

:
Aluminium can be essential in reducing climate impacts as weight reduction is critical. Rheocasting is getting more and more attention from the electronics and automotive industries. The solid fraction in Rheocasting determines the processing outcome. The RheoMetal process is one of the leading processes with the most significant deviation from equilibrium, making presetting the slurry-making parameters difficult. A deeper analysis of the physics of the solid fraction deviation from equilibrium is made based on literature data using a simplistic mathematical model. The developed model confirms that the process is far from equilibrium and that the growth conditions of the freeze-on layer on the cooling agent used in the process determine the slurry temperature and cause the formation of excess solid fraction.

1. Introduction

Aluminium can be essential in reducing climate impacts as weight reduction is critical in the early transition to electrification as much electricity is still fossil fuel-based [1]. There are several Rheocasting processes with a significant market penetration [2,3]. Common to all processes is that the amount of solid fraction affects the viscosity of the melt [4]. In addition to the viscous effect, there are viscoelastic effects [5] and slurry-yielding effects [6,7]. The importance of these effects depends largely on the amount of solid fraction, particle shape and deformation during flow [4,5,6,7]. All this stresses the importance of accurately controlling the fraction solid generated in the slurry-making process. The actual amounts vary between the dominant processes such as the Gas-Induced Superheated Slurry process (GISS), RheoMetal and the Swirling Enthalpy Equilibration Device (SEED). The generation of the solid phase differs between the different processes and gives different characteristics. The GISS process relies on gas bubbling generating the solid phase in a short-duration treatment, forming a low-fraction solid. The SEED process uses an external cooling container and a swirling flow to generate a high-solid-fraction slurry taking up to 180 s. The RheoMetal process relies on a consumable rotation body or Enthalpy Exchange Material (EEM) that is inserted into the melt and cools the melt as it is heated up and partially melts and disintegrates [8]. These processes are market dominant because they offer an improved internal part quality with reduced rejection rates and better cost efficiency primarily due to a significantly extended die-life in which the solid fraction and rheological properties play a central role, and the solid fraction is one critical element [8].
The RheoMetal process deviates significantly from equilibrium, as shown by Santos et al. [9]. This deviation is more significant for the RheoMetal process than for the SEED and GISS processes [8]. Santos et al. [9] found that for the RheoMetal process at the slurry forming temperature, the solid fraction in a conventional A356 alloy was 0.31 ± 0.04, whilst the equilibrium value was 0.23, calculated using ThermoCalcTM. This 0.08 fraction solid deviation was typical in a 0.06 m radius ladle. In the RheoMetal process, a freeze-on layer on the EEM was investigate by Payandeh et al. [10] for the Stenal Rheo1 alloy and AA6082. The maximum volume ratio for the EEM with a freeze-on layer to the original EEM was approximately 1.7 for a superheat of 5 K for both alloys. This ratio was 1.5 for the AA6082 alloy for a superheat of 20 K, and it was 1.26 for the Stenal Rheo1 and a superheat of 30 K. The growth and remelting of the freeze-on layer were later modelled by Payandeh et al. [11] for an EN-AC46000 alloy for a superheat of 25 K, resulting in a radius increase from 0.02 to 0.0225, corresponding to a volume ratio of 1.27. The solid-phase composition of the primary phase is always intimately connected to the slurry temperature [12]. It has not been possible to distinguish between the particles from the EEM, freeze-on layer or other origins without tagging particles with Ti [13]. One noticeable effect and consequence from this is seen in Payandeh et al.’s work [12]: the solid equilibrated at the slurry temperature. Due to the formation of an excess solid phase, the liquid phase deviated from the liquidus line. Further precipitation does not happen until the melt temperature reaches its new liquidus temperature.
A deeper analysis of the physics of the formation of the freeze-on layer and its relationship to other process parameters is not well understood. The current paper aims to shed some light on the factors influencing the formation of the excess amounts of solid fraction generated through an analysis of the conditions regarding the EEM, crucible and stirring conditions.

2. Methodology

The data from the existing literature, from Santos et al. [9] and Payandeh et al. [10,11,12], will be re-examined.
The model is based on the RheoMetal process set-up where a cold Enthalpy Exchange Material (EEM) is submerged and then a freeze-on layer is formed and subsequently disintegrates to form the slurry (described in reference [10]).
To better understand the flow and thermal condition for this EEM and the freeze-on layer, simplistic modelling of the conditions around the rotating EEM will be used as the foundation (Figure 1).

3. Model Development and Discussion

Under the assumption that the rotation dominates the flow direction, the EEM and ladle geometry could be seen as a Couette flow type, being the flow of a viscous fluid in the space between two surfaces, one of which is moving tangentially relative to the other (Figure 1). The steady flow in the circumferential direction, v φ (m/s), can be described as [14]
v φ = ω R 2 R 1 2 1 R 2 2 r r
The maximum speed is seen at a radius coordinate r = R 1
v φ m a x = ω R 1
The boundary layer, δ H (m), around the cylinder is defined by the gradient at r = R 1 , resulting in
v φ r r = R 1 = ω 1 + 2 R 2 R 1 2 1
The hydrodynamic boundary layer, δ H , at r = R 1 , is then defined by
v φ m a x + v φ r r = R 1 δ H = 0 δ H = R 1 R 2 2 R 1 2 R 2 2 + R 1 2
The thermal boundary layer, δ T , is then possible to estimate through
δ T = δ H P r = R 1 R 2 2 R 1 2 R 2 2 + R 1 2 μ C P λ
Here, μ (Pa s) is the viscosity, C P is the specific heat (J/kg K) and λ (W/m K) is the thermal conductivity. The effects of the ladle diameter are shown in Figure 2a, and the effect of the EEM diameter is shown in Figure 2b. Critical to note here is that as the ladle radius increases, the thermal boundary layer is monotonically increasing. However, as the EEM radius increases, there will be a maximum where the temperature gradient is steeper for both smaller and larger radii, representing a minimum in heat flux as the thermal gradient and the associated heat flux increases with a decreasing boundary layer.
To express the thermal gradient, a simplistic description of the temperature fields, T r (K), around the rotating cylinder can thus be made as
T r = A + B ln r
With the boundary conditions at the EEM or freeze-on layer surface T S L (K)
T R 1 = T S L < T L
where T L (K) is the alloy liquidus temperature and at the outer boundary of the boundary layer R 1 + δ T where the temperature is defined by the melt superheat Δ T (K).
T R 1 + δ T = T L + Δ T
The solution is then
T r = T S L + T L + Δ T T S L ln 1 + δ T R 1 ln r R 1
or
T r = T S L + T L + Δ T T S L ln 1 + R 2 2 R 1 2 R 2 2 + R 1 2 μ C P λ ln r R 1
The location of the liquidus temperature gives the maximum distance that the freeze-on layer can grow.
T r m a x E E M = T L
This leads to
r max EEM = R 1 1 + R 2 2 R 1 2 R 2 2 + R 1 2 μ C P λ e x p T L T S L T L + Δ T T S L
There are three matters to consider here: (1) the evolution of the boundary layer with time after introduction, (2) the growth rate of dendrites, and (3) the change in the effective radius of the EEM. The viscosity of the molten aluminium is low (1–1.4 mPas) [15]. Making the boundary layer evolution rapid, a quasi-steady state can be assumed. The growth rate of the dendrites is thermally restricted, making it likely that the steady-state boundary layer’s evolution can be used to estimate the freeze-on layer’s growth. This implies that the freeze-on layer will grow if a radius increment implies that the boundary layer will increase. At the time when the boundary layer starts to shrink with an increment of the radius, the process self-regulates and comes to a halt until disintegration occurs.
δ T R 1 = R 2 4 R 1 4 4 R 1 2 R 2 2 R 2 2 + R 1 2 2 μ C P λ = 0 R 2 4 R 1 4 4 R 1 2 R 2 2 = 0
The only non-trivial real root is
R 1 = 20 4 2 R 2
This then results in a volume ratio increase with an EEM volume at the start E E M s t a r t (m3) to the maximum value E E M m a x (m3), which can be estimated as
E E M m a x E E M s t a r t = r m a x E E M 2 R 1,0 2 = 1 + 1 20 4 2 2 1 + 20 4 2 2 μ C P λ e x p T L T S L T L + Δ T T S L 2 1 + 0.894 μ C P λ e x p T L T S L T L + Δ T T S L 2
In Figure 3a, the current model is compared to the data from Payandeh et al. [10,11]. In this comparison, the difference T L T S L was used as a fitting parameter. Figure 3a shows two dashed lines for 3 and 5 K differences. The value of T L used was that of Al-7Si-0.3 Mg, a common alloy used for T S L , which matches a typical slurry temperature. In Figure 3a, the volume ratios for the experimental points, E E M m a x / E E M s t a r t , have been recalculated to a freeze-on layer thickness. Taking data for dendrite growth rate and undercooling from Cho et al. [16] for an Al-7Si alloy, the growth rates are in Figure 3a. In the work by Payandeh et al. [10], the time to the peak volume of the EEM and freeze-on layer for Stenal Rheo 1 was reached after approximately 9 s. Taking this value as an estimate, the layer thickness can be estimated as a function of dendrite tip undercooling. This is shown in Figure 3b. Compared to the thicknesses found by Payandeh et al. [10], these correspond to undercooling in the range of 4–7 K. This suggests that the dendrite tip growth undercooling is essential in forming the freeze-on layer and is suggested to be the determining factor for the final slurry temperature.
The fact that the slurry temperature is suggested to be given by the dendrite tip growth undercooling implies that the material is far from equilibrium. At the end of the layer growth, the EEM will not be in thermal equilibrium with the melt. The EEM disintegration will occur at its loss of coherence and close to the eutectic temperature. These EEM particles will enter into the melt very late in the process and be reheated. The time scale established by Payandeh [12] was that the particle equilibrates chemically in roughly 30 s. This would not have had time to occur in the quenched slurry samples made by Santos et al. [9]. Thus, it is reasonable to assume that the freeze-on layer and the primary particles can be considered inert particles and are regarded as an additional solid fraction of what is formed due to the lowering of the melt temperature. Table 1 compares estimates made by the current model for additions of 5–7% EEM and the experiments by Santos et al. [9] with a 7% EEM addition. The fit between the model under the current assumptions not only matches the slurry temperature estimate and the layer thickness of the freeze-on layer of the EEM but it also allows for the quantification of the deviation from equilibrium.

4. Conclusions

The formation of the excess solid fraction in the RheoMetal process was analysed using a Couette type of flow to model the formation of the freeze-on layer on the EEM cylinder. The following conclusions were made using the data by Payandeh et al. [10,11] and Santos et al. [9]:
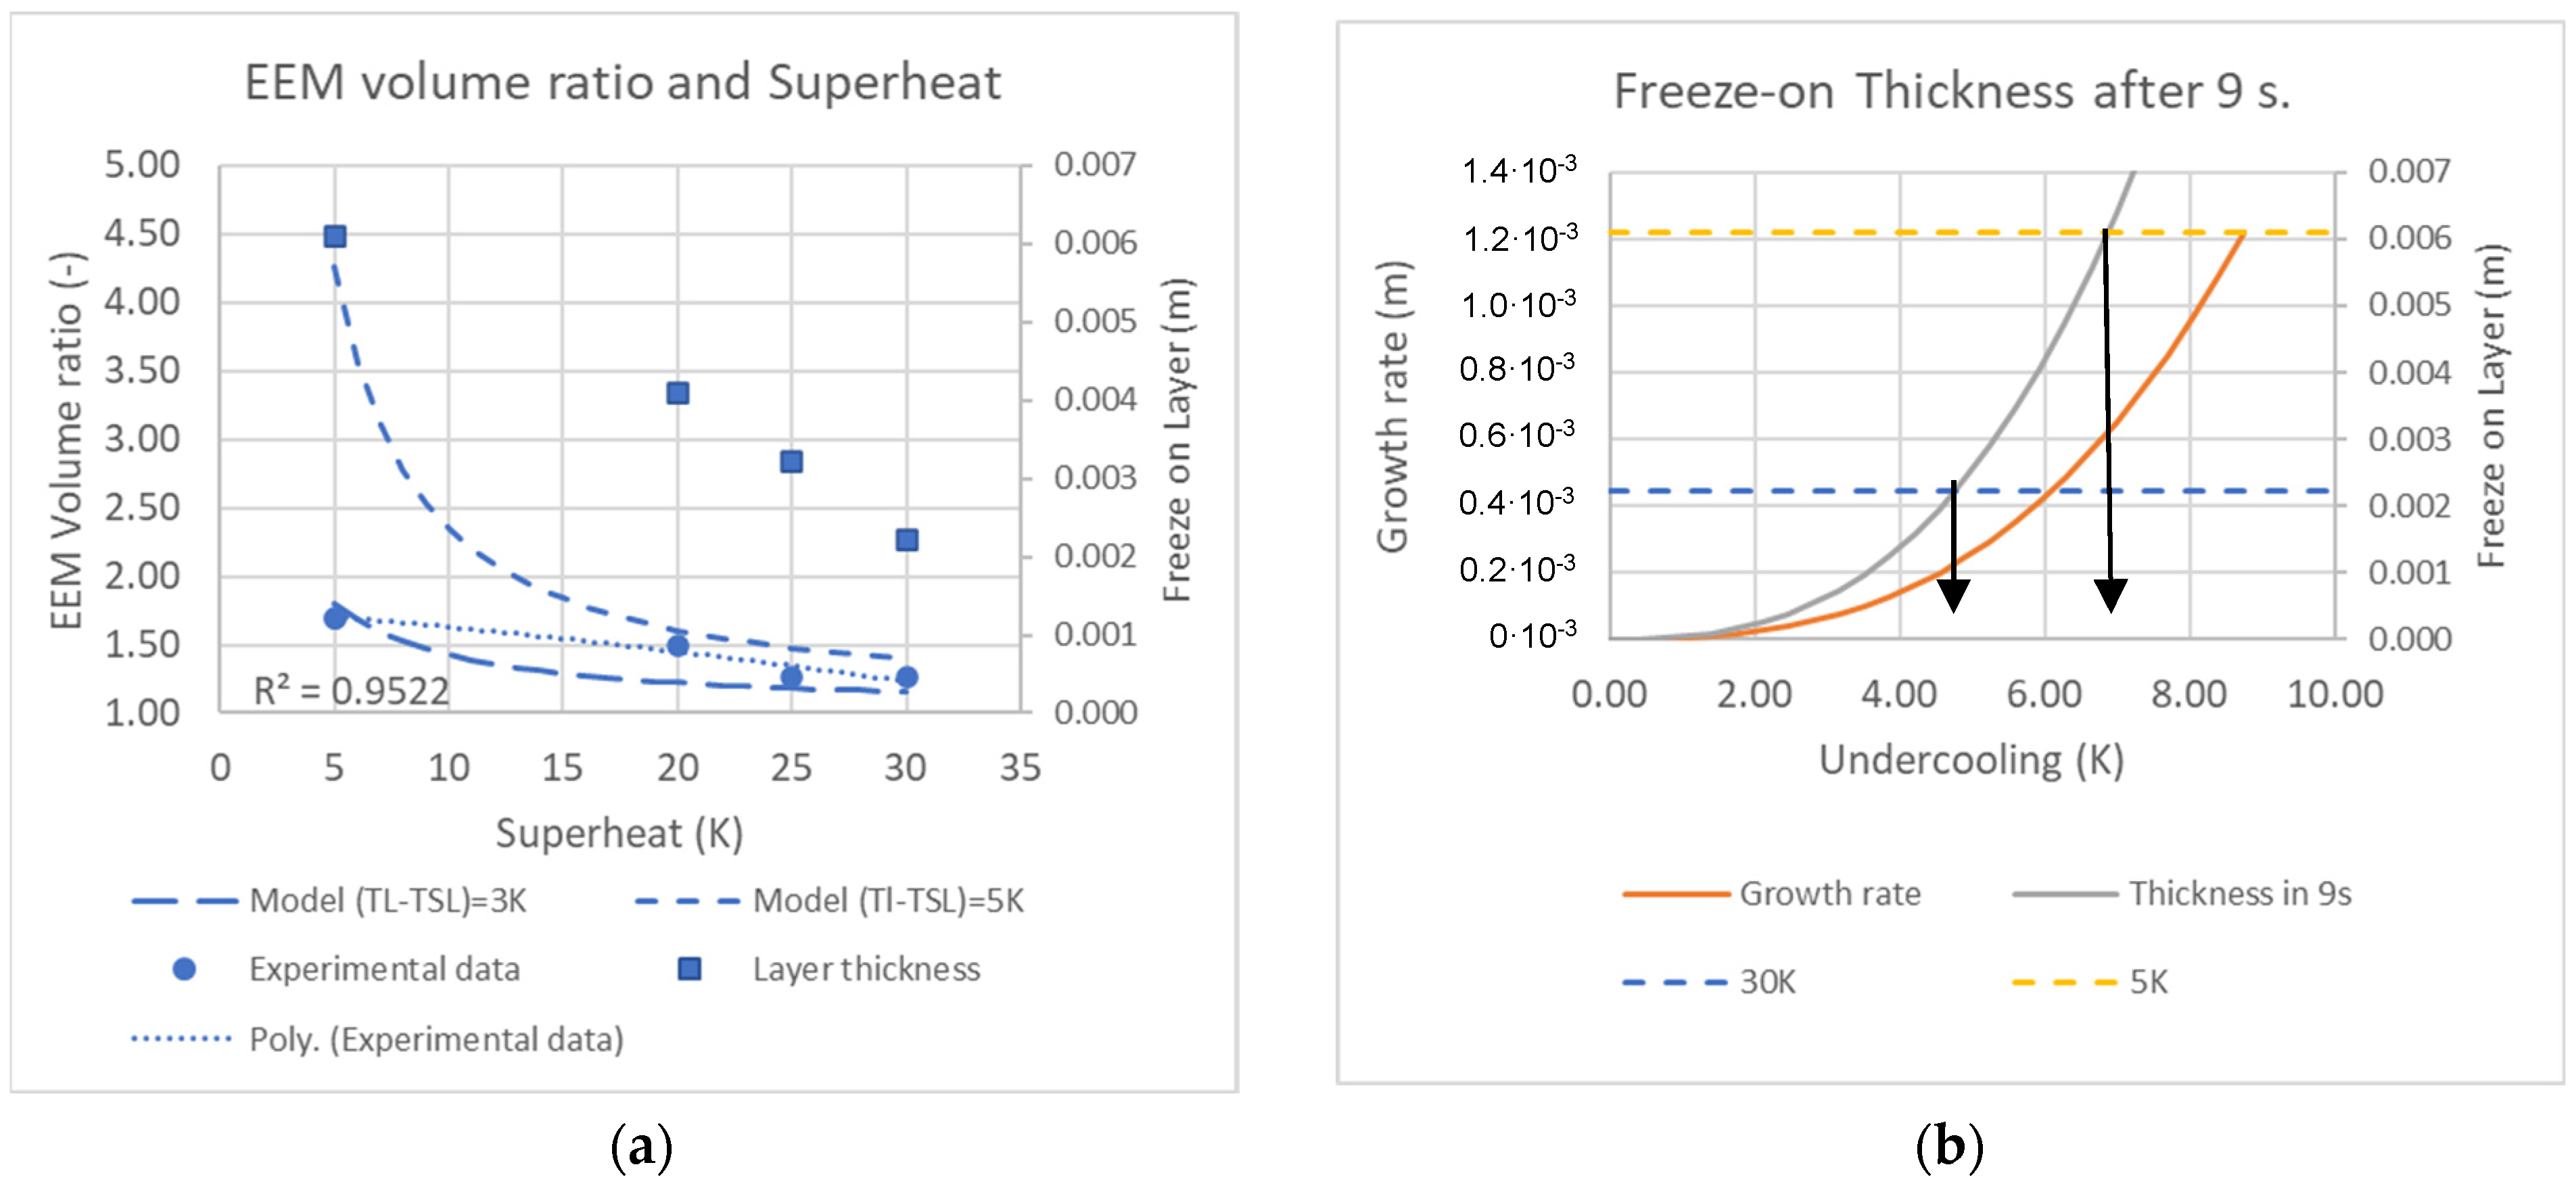
  • The model developed allows for the estimation of the maximum amounts of freeze-on layer formation as a function of the superheat.
  • The model confirms that the process is far from equilibrium and that the dendrite tip growth undercooling determines the final slurry temperature.
  • This further implies that the assumption that the slurry is in thermal equilibrium is not valid, explaining the reasons why attempts to use macroscopic thermal balances fail to predict the slurry temperature and the solid fraction.
  • The freeze-on layer formed and the contribution from the primary precipitated phase in the EEM can explain the additional solid fraction formed.

Funding

Vinnova funded the current project under the Metallic Materials program project Recka contract 2018-02831.

Data Availability Statement

All data were previously published in References [9,10,11,12,13].

Acknowledgments

The author acknowledges the authors of the papers used for the background data used in the current paper for their hard work over the years making this discovery possible.

Conflicts of Interest

The author declares no conflict of interest. The funders had no role in the design of the study; in the collection, analyses or interpretation of data; in the writing of the manuscript; or in the decision to publish the results.

References

  1. Serrenho, A.C.; Norman, J.B.; Allwood, J.M. The impact of reducing car weight on global emissions: The future fleet in Great Britain. Philos. Trans. R. Soc. A Math. Phys. Eng. Sci. 2017, 375, 20160364. [Google Scholar] [CrossRef] [PubMed]
  2. Jarfors, A.E.W.; Zheng, J.C.; Chen, L.; Yang, J. Recent Advances in Commercial Application of the Rheometal Process in China and Europe. Solid State Phenom. 2019, 285, 405–410. [Google Scholar] [CrossRef]
  3. Li, G.; Luo, M.; Qu, W.Y.; Lu, H.X.; Hu, X.G.; Zhu, Q. Progress of Semi-Solid Processing of Alloys and Composites in China. Solid State Phenom. 2022, 327, 178–188. [Google Scholar] [CrossRef]
  4. Modigell, M.; Pola, A.; Tocci, M. Rheological Characterization of Semi-Solid Metals: A Review. Metals 2018, 8, 245. [Google Scholar] [CrossRef]
  5. Tocci, M.; Pola, A.; Modigell, M. Visco-Elastic Properties of Semi-Solid Alloys. Solid State Phenom. 2022, 327, 119–126. [Google Scholar] [CrossRef]
  6. Ma, Z.; Zhang, H.; Fu, H.; Fonseca, J.; Yang, Y.; Du, M.; Zhang, H. Modelling flow-induced microstructural segregation in semi-solid metals. Mater. Des. 2022, 213, 110364. [Google Scholar] [CrossRef]
  7. Jarfors, A.E.W.; Jafari, M.; Aqeel, M.; Liljeqvist, P.; Jansson, P. In-Production Rheometry of Semi-Solid Metal Slurries. Metals 2022, 12, 1221. [Google Scholar] [CrossRef]
  8. Jarfors, A.E.W. A comparison between semisolid casting methods for aluminium alloys. Metals 2020, 10, 1368. [Google Scholar] [CrossRef]
  9. Santos, J.; Kallien, L.H.; Jarfors, A.E.W.; Dahle, A.K. Influence of Grain Refinement on Slurry Formation and Surface Segregation in Semi-solid Al-7Si-0.3Mg Castings. Metall. Mater. Trans. A Phys. Metall. Mater. Sci. 2018, 49, 4871–4883. [Google Scholar] [CrossRef]
  10. Payandeh, M.; Jarfors, A.E.W.; Wessén, M. Effect of Superheat on Melting Rate of EEM of Al Alloys during Stirring Using the RheoMetal Process. Solid State Phenom. 2012, 192–193, 392–397. [Google Scholar] [CrossRef]
  11. Payandeh, M.; Sabzevar, M.H.; Jarfors, A.E.W.; Wessén, M. Solidification and Re-melting Phenomena during Slurry Preparation Using the RheoMetalTM Process. Metall. Mater. Trans. B Process Metall. Mater. Process. Sci. 2017, 48, 2836–2848. [Google Scholar] [CrossRef]
  12. Payandeh, M.; Jarfors, A.E.W.; Wessén, M. Solidification Sequence and Evolution of Microstructure during Rheocasting of Four Al-Si-Mg-Fe Alloys with Low Si Content. Metall. Mater. Trans. A Phys. Metall. Mater. Sci. 2015, 47, 1215–1228. [Google Scholar] [CrossRef]
  13. Santos, J.; Jarfors, A.E.W.; Dahle, A.K. Tag-and-Trace Method of a -Al Crystals Applied to Study Solidification and Casting of Aluminum Alloys. Metall. Mater. Trans. A 2020, 53, 3311–3320. [Google Scholar] [CrossRef]
  14. Yih, C.-S. Fluid Mechanics; West River Press: Ann Arbor, MI, USA, 1977; ISBN 0-9602190-0-5. [Google Scholar]
  15. Dinsdale, A.T.; Quested, P.N. The viscosity of aluminium and its alloys—A review of data and models. J. Mater. Sci. 2004, 39, 7221–7228. [Google Scholar] [CrossRef]
  16. Cho, S.H.; Okane, T.; Umeda, T. The contribution of the nucleation process to grain formation in calculating solidification microstructure by CA-DFD. Sci. Technol. Adv. Mater. 2001, 2, 241–245. [Google Scholar] [CrossRef]
Figure 1. Illustration of the EEM body (yellow) with its variable diameter, R 1 (m), increasing with a freeze-on layer and mounted on a steel rod (grey). This EEM is submerged and rotated at a speed, ω (rad/s), in a ladle with a fixed radius, R 2 (m).
Metals 13 01644 g001
Figure 2. Thermal boundary relationships with (a) ladle size and (b) EEM diameter.
Metals 13 01644 g002
Figure 3. Model and experimental comparison with (a) data from Payandeh et al. [10,11] compared to the developed mode with two undercoolings of 2 and 5 K for the dendrite growth, which also becomes the slurry temperature. The layer thickness was calculated from the maximum volume ratio and (b) comparison between the dendrite growth rate from Cho et al. [16] with a layer thickness calculated after a hypothetical 9 s peak found by Payandeh et al. [10] for 5 and 30 K superheat as the dashed lines.
Metals 13 01644 g003
Table 1. Comparison between the current model and the data on excess solid fraction formation found by Santos et al. [9].
EEMFreeze-OnEEM ContributionTotalSantos et al. [13]
Exp.EquilibriumIncrement
5%2.70%3.00%5.7%---
6%3.24%3.60%6.8%---
7%3.78%4.20%8.0%31 ± 4%23%8%
Disclaimer/Publisher’s Note: The statements, opinions and data contained in all publications are solely those of the individual author(s) and contributor(s) and not of MDPI and/or the editor(s). MDPI and/or the editor(s) disclaim responsibility for any injury to people or property resulting from any ideas, methods, instructions or products referred to in the content.

