
Investigation of the Quenching Sensitivity of the Mechanical and Corrosion Properties of 7475 Aluminum Alloy

Abstract
:1. Introduction
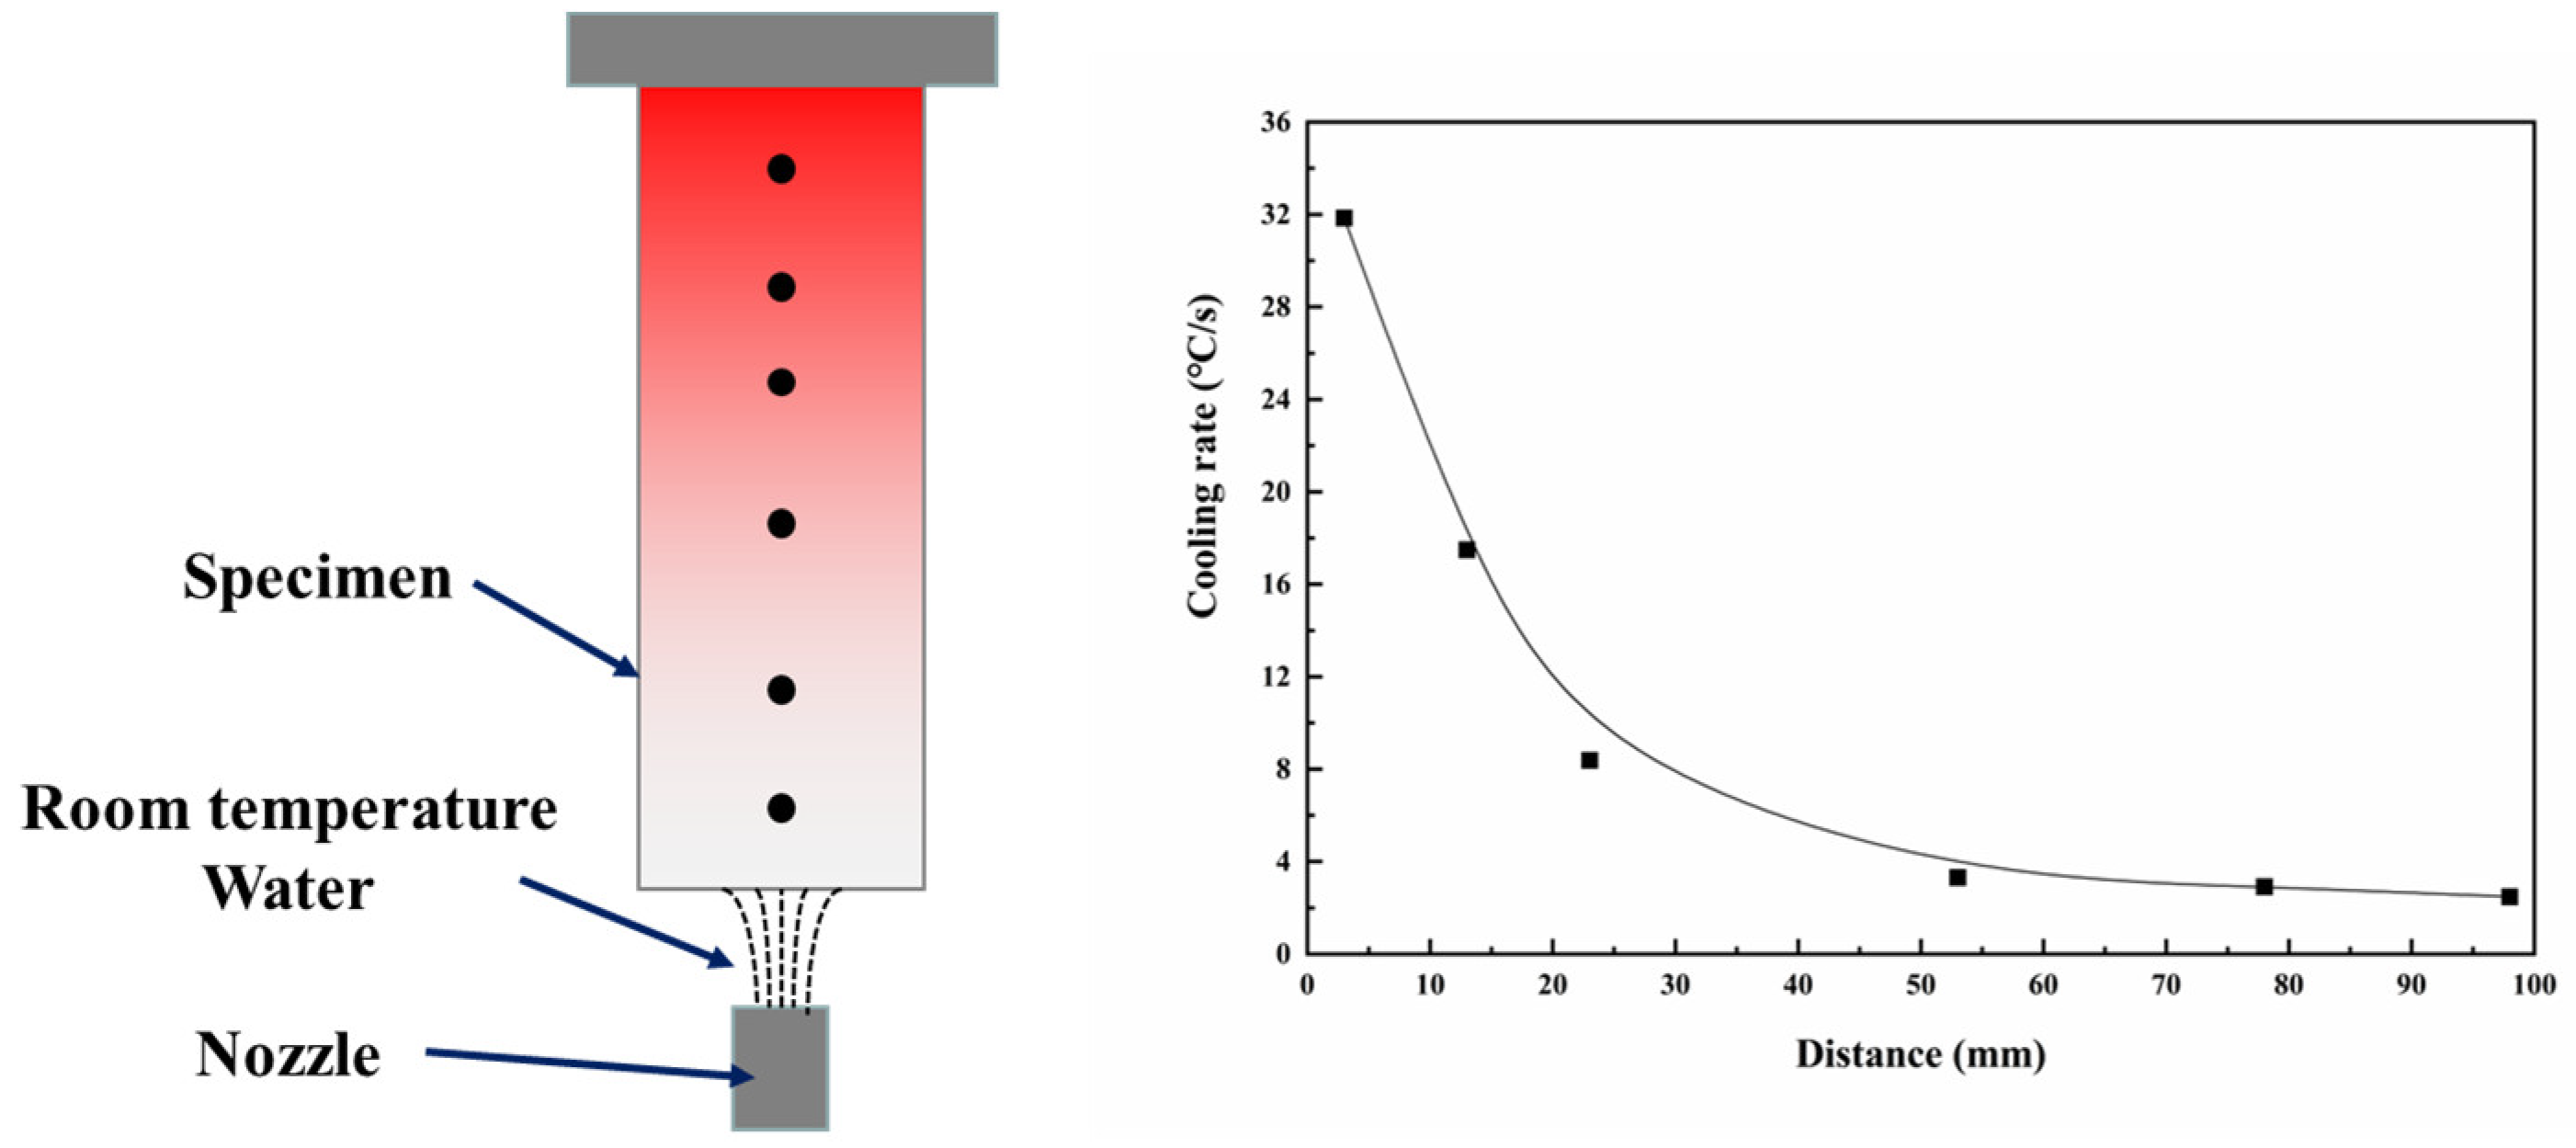
2. Experiment
3. Results
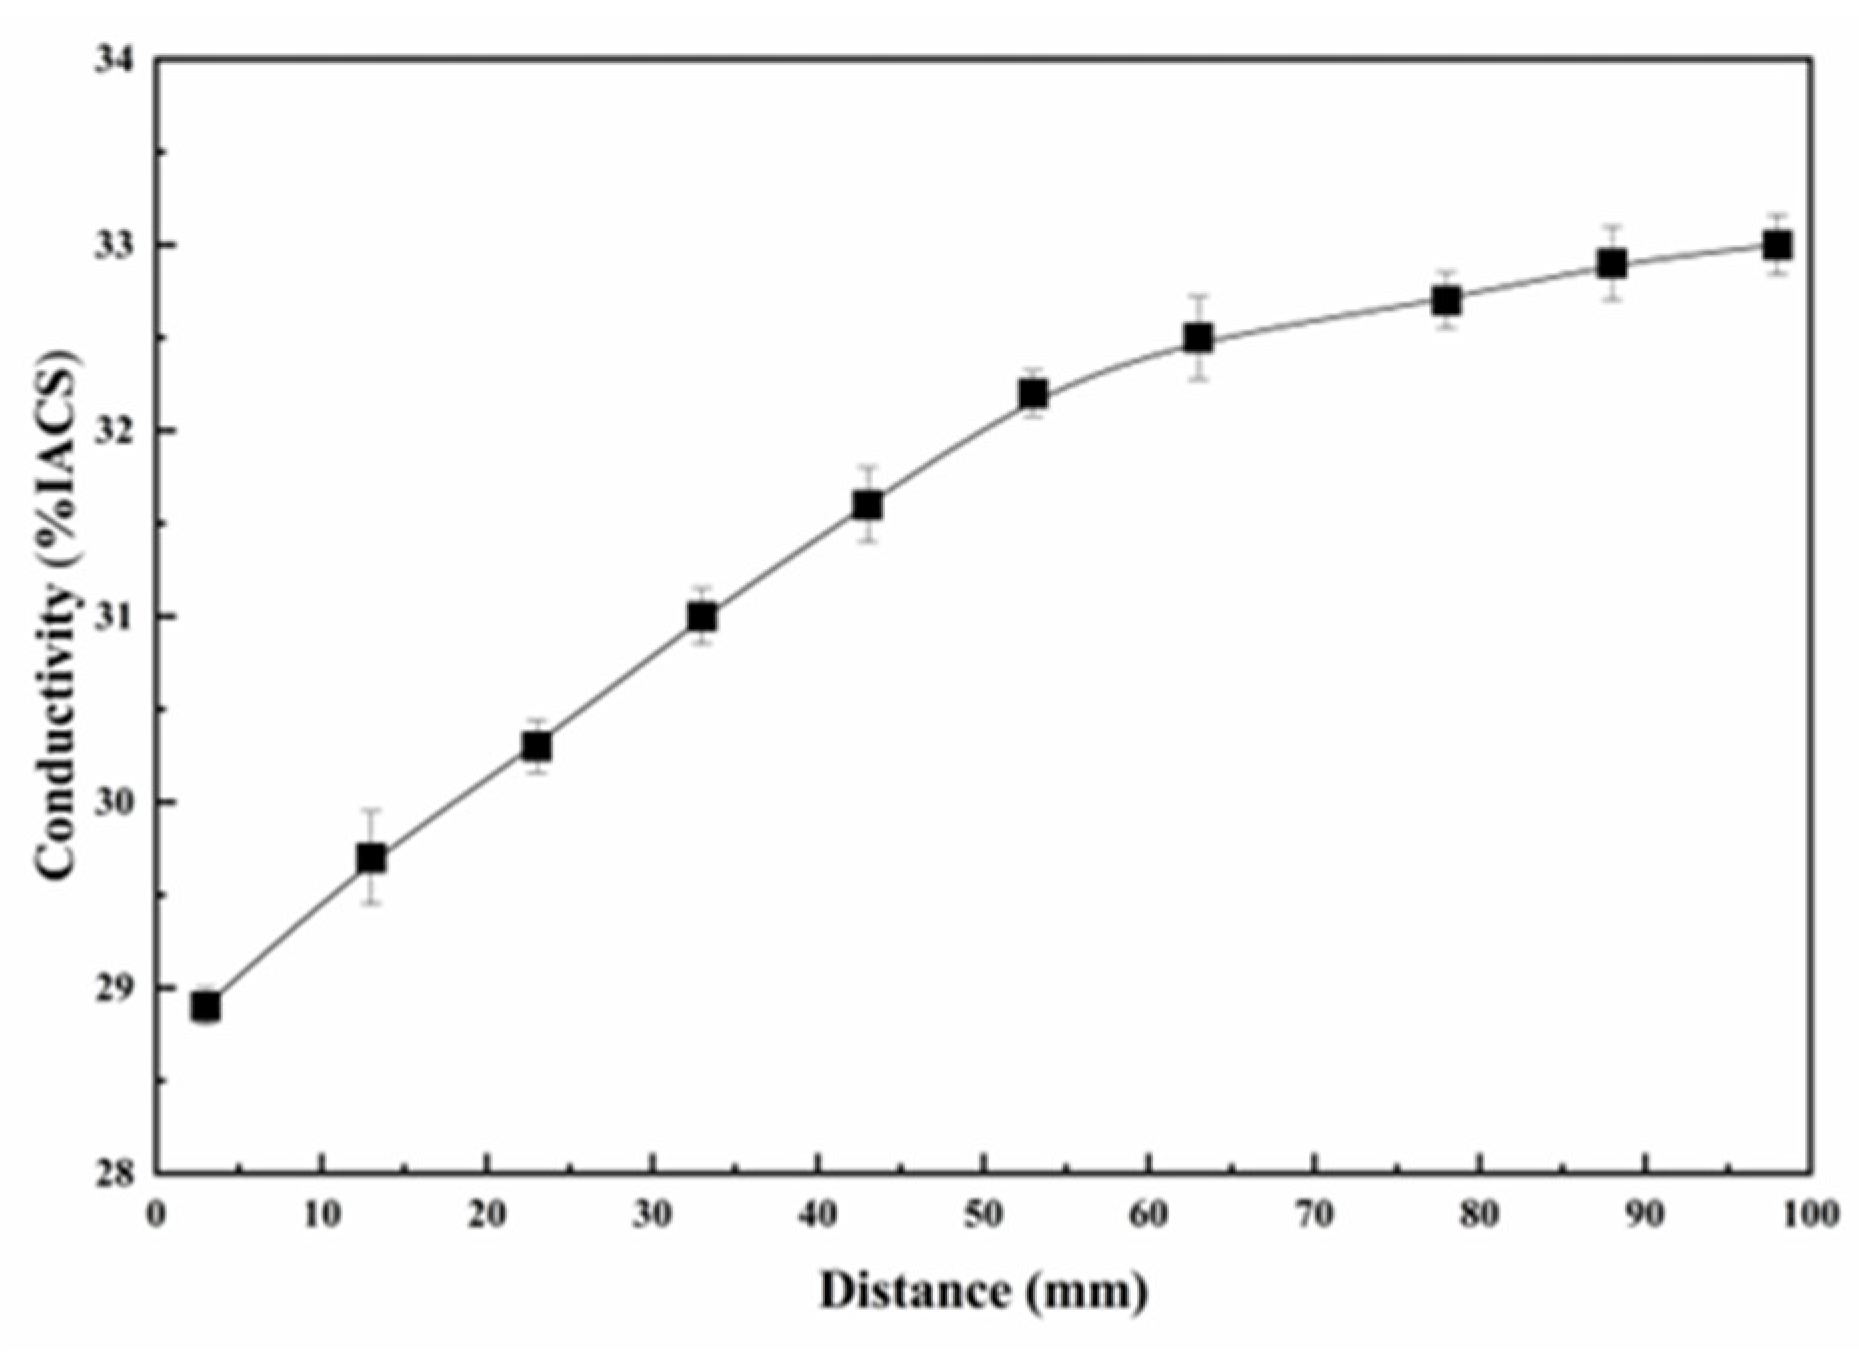
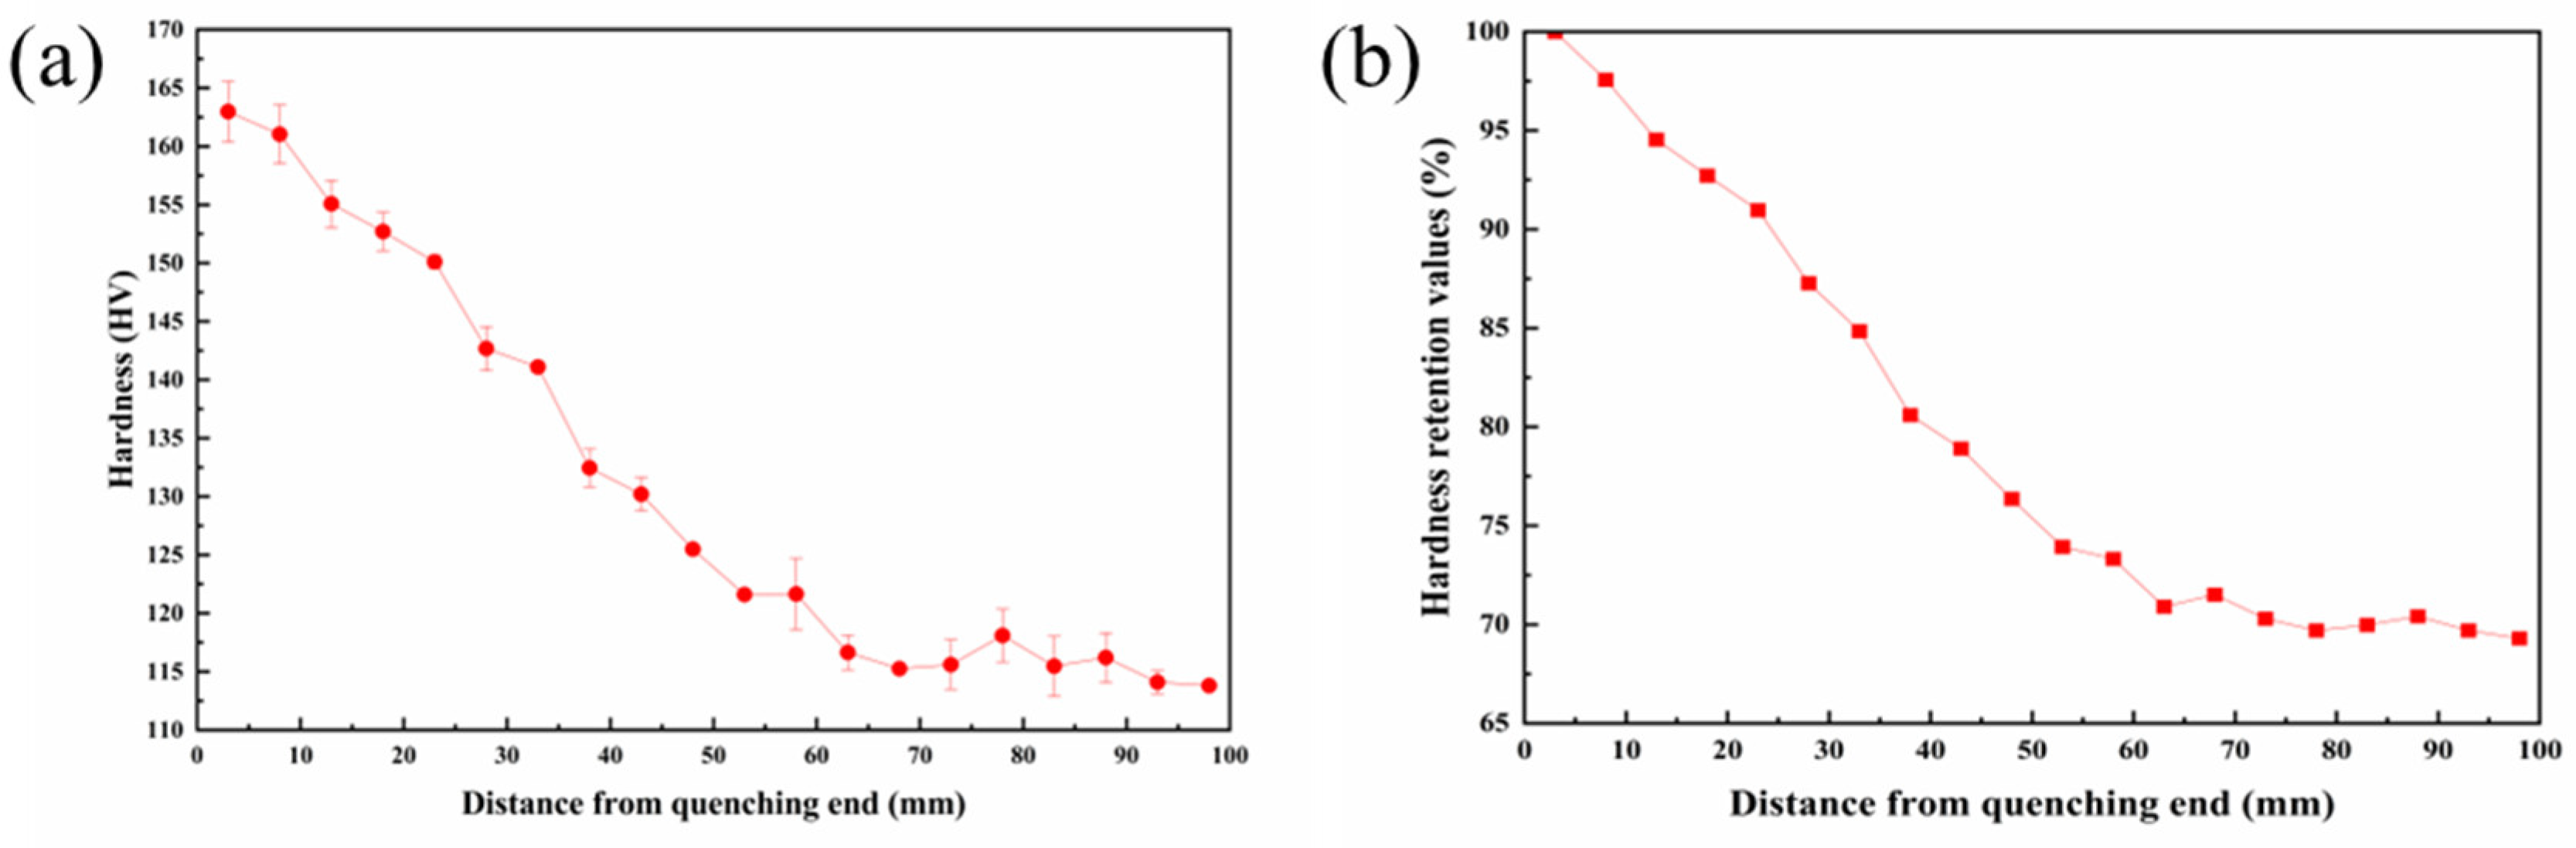
3.1. Electrical Conductivity and Hardness Tests
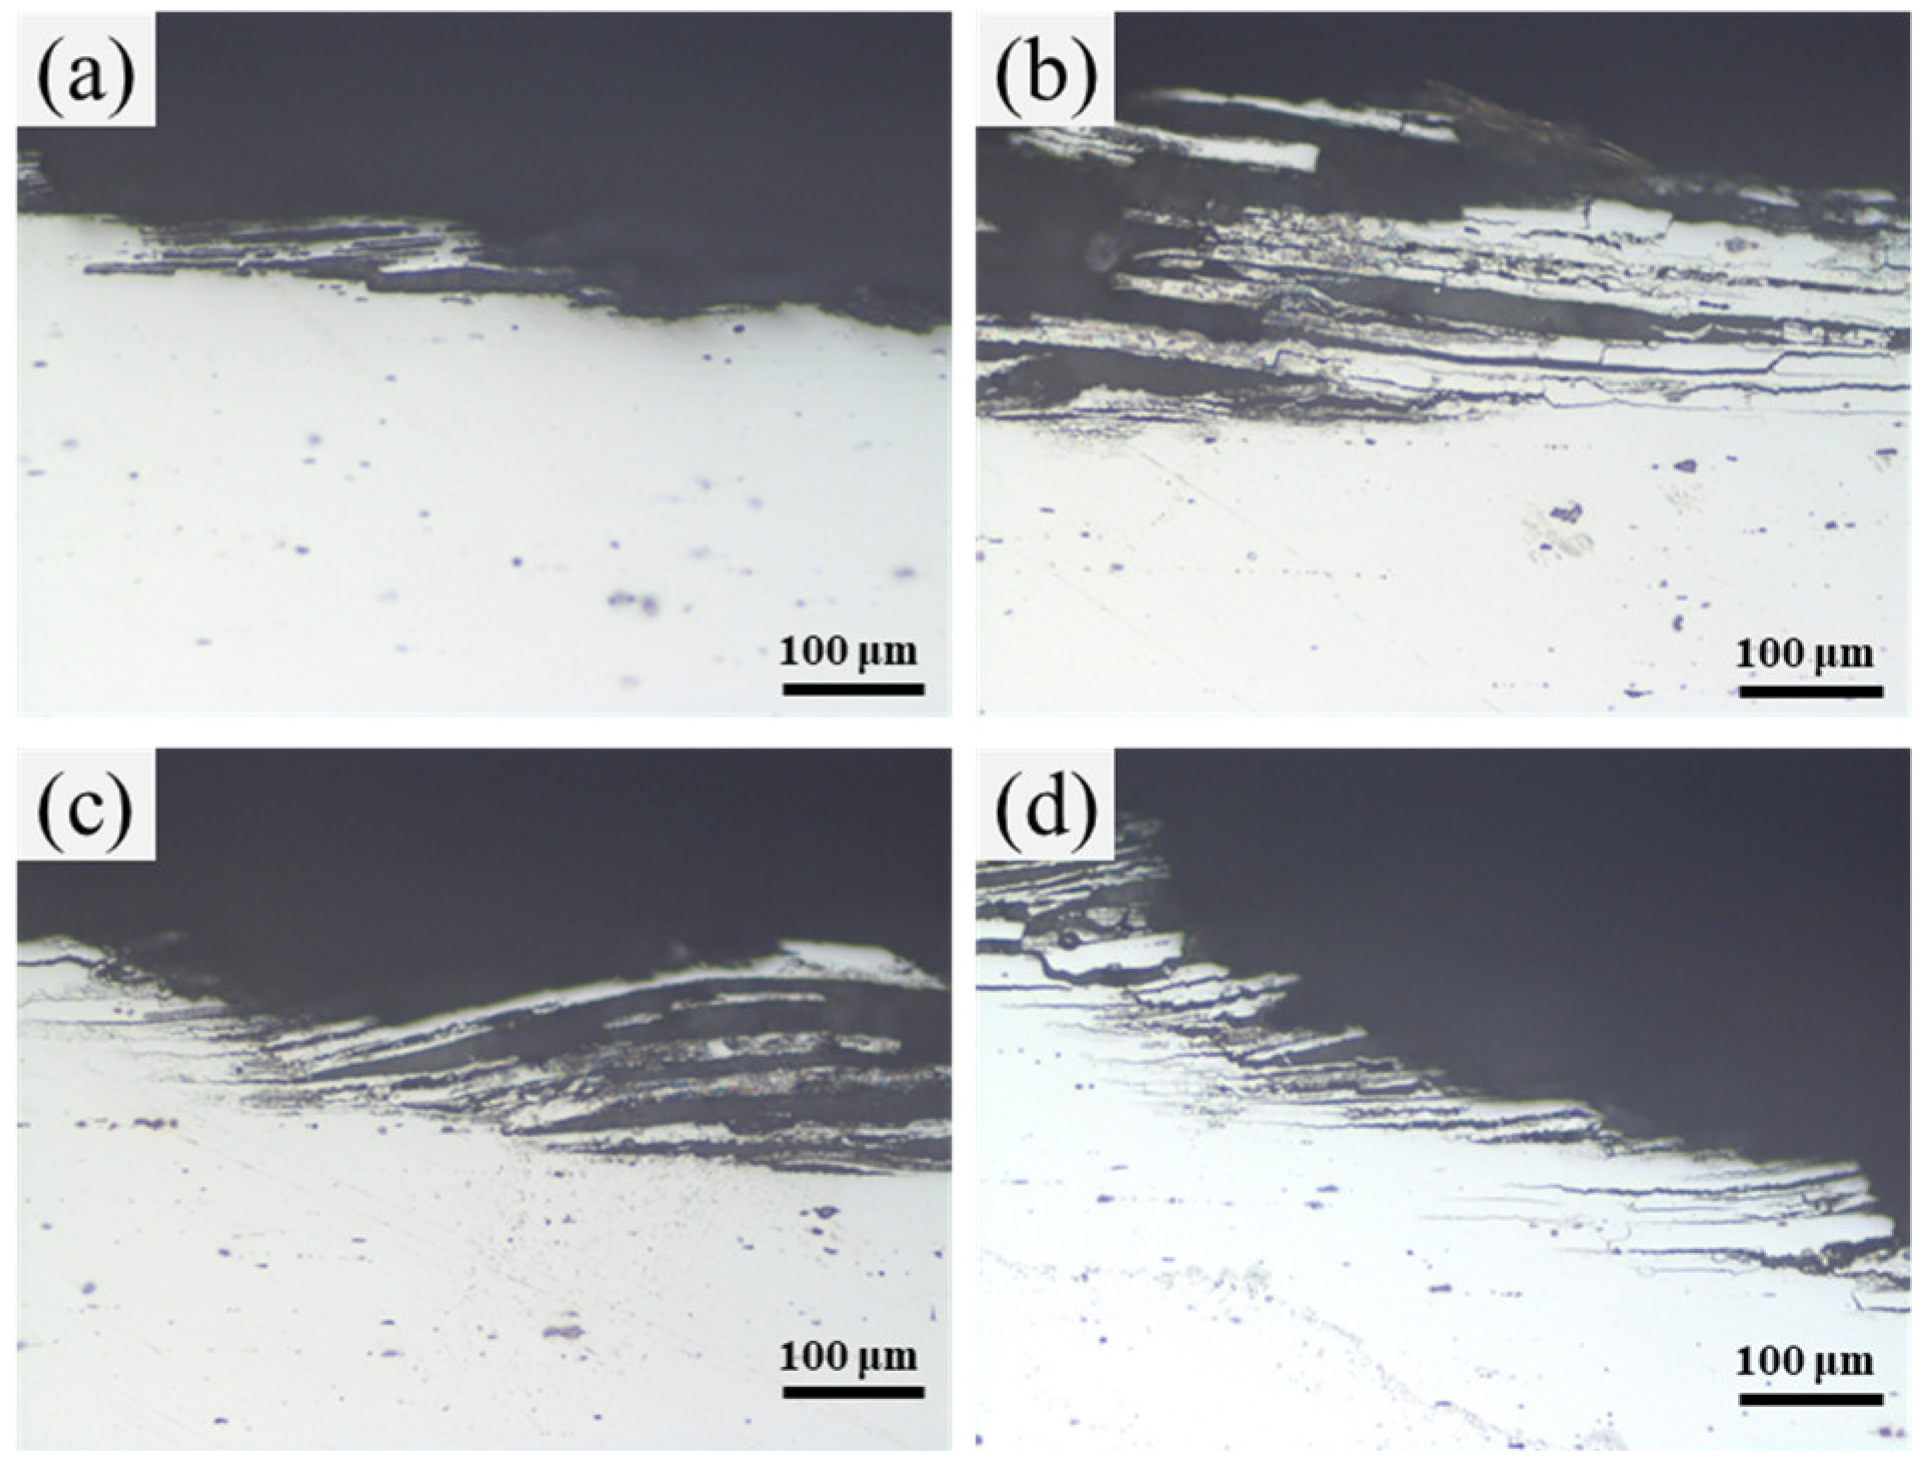
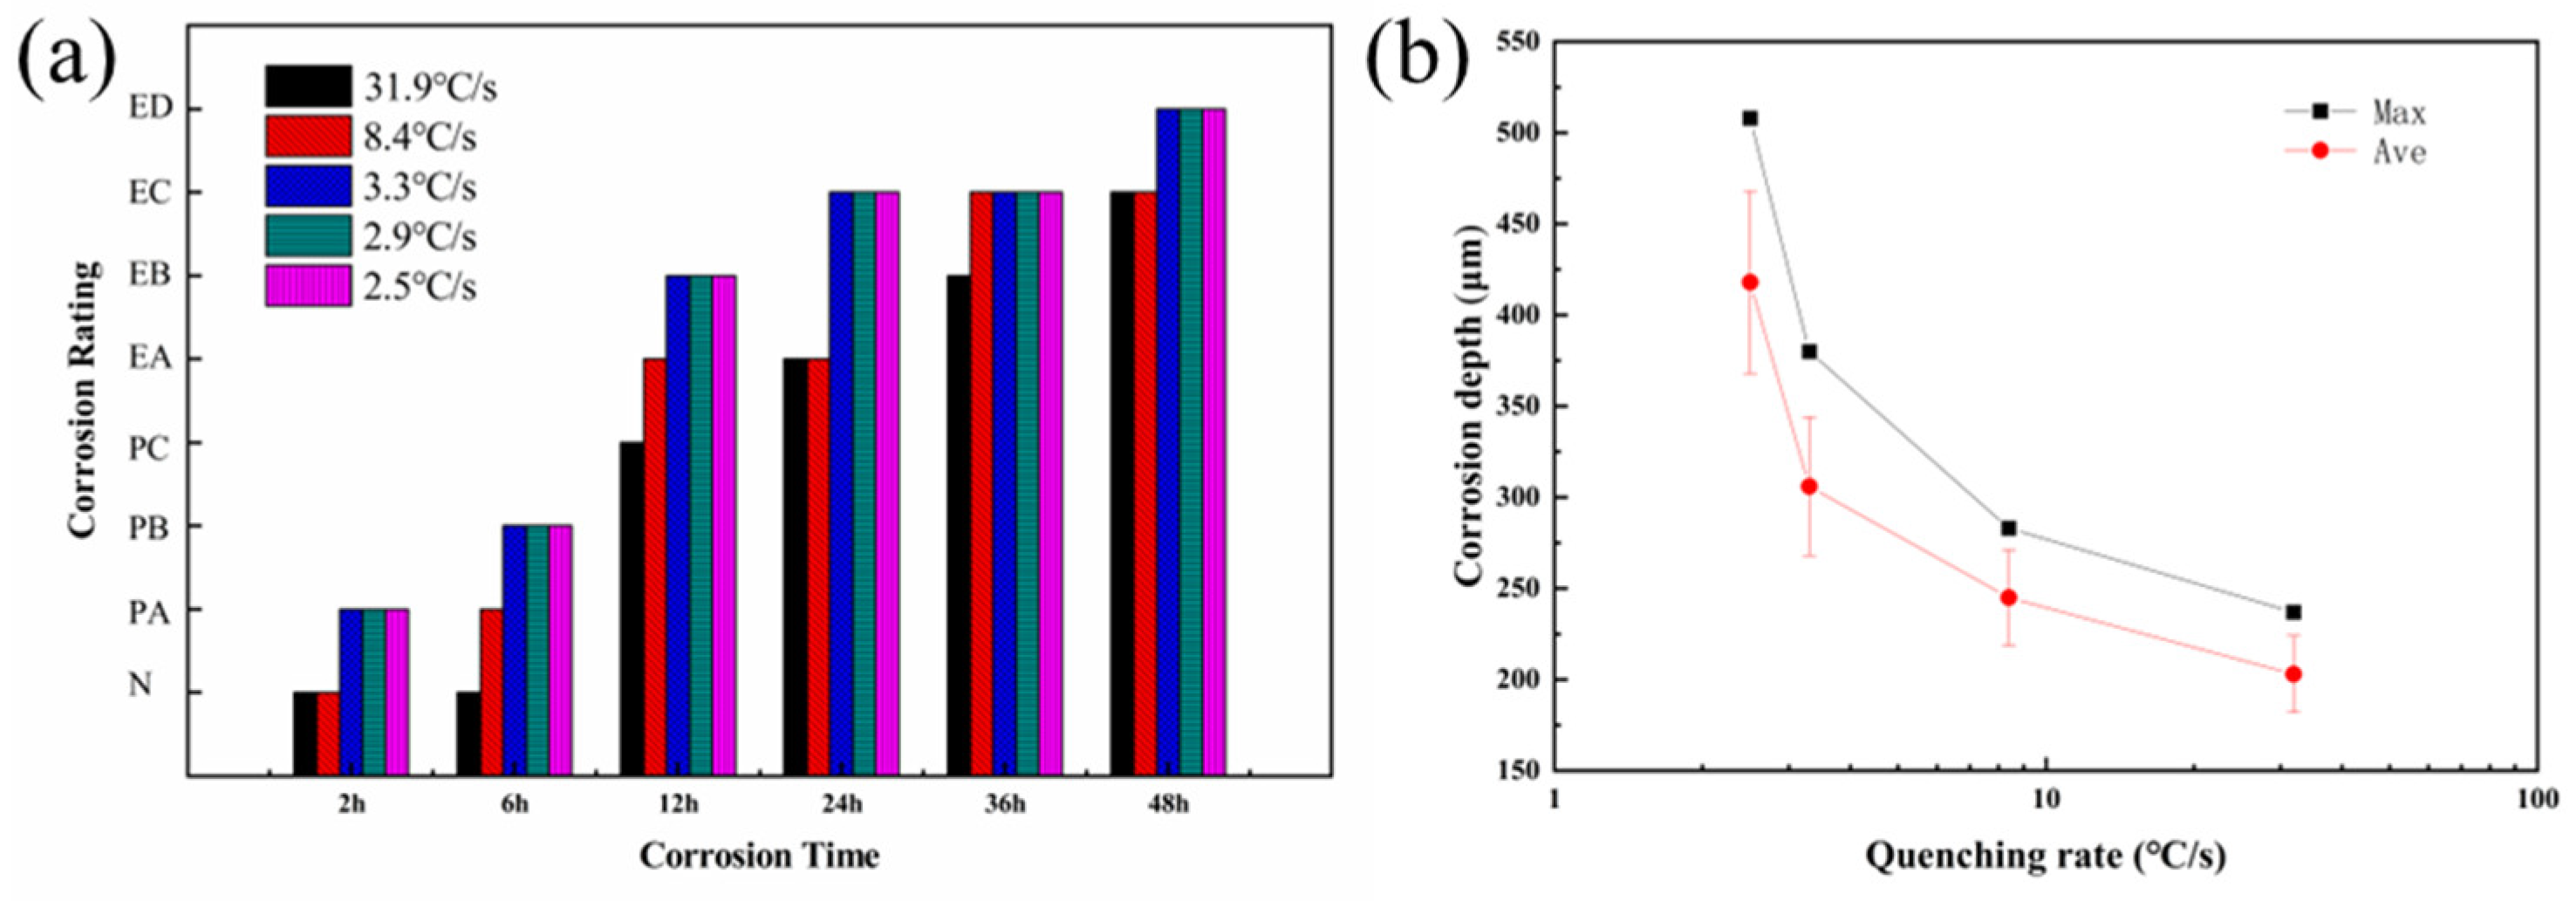
3.2. Exfoliation Corrosion
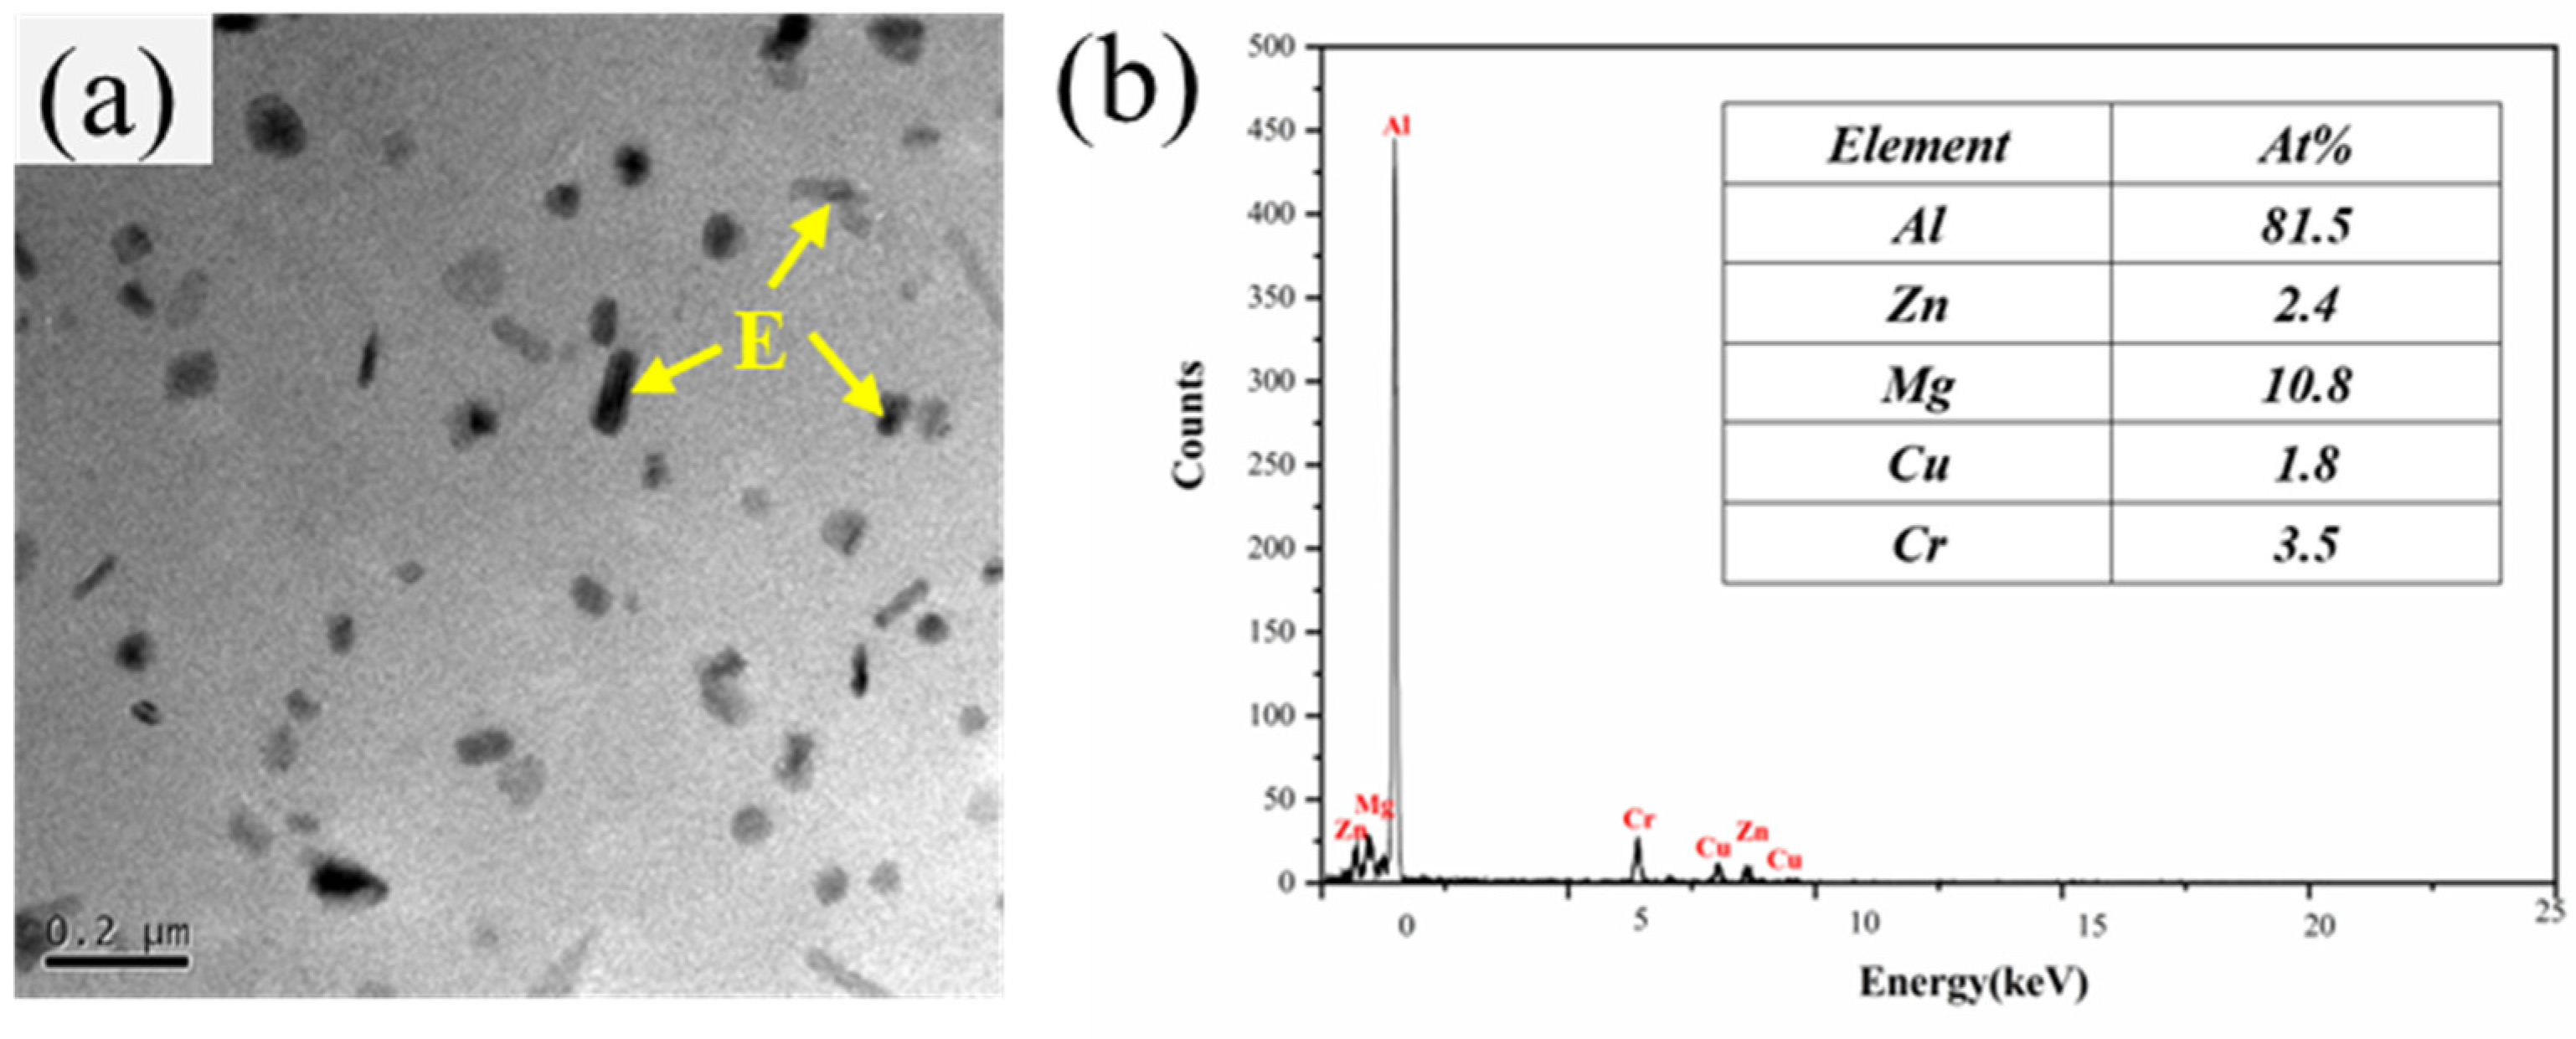
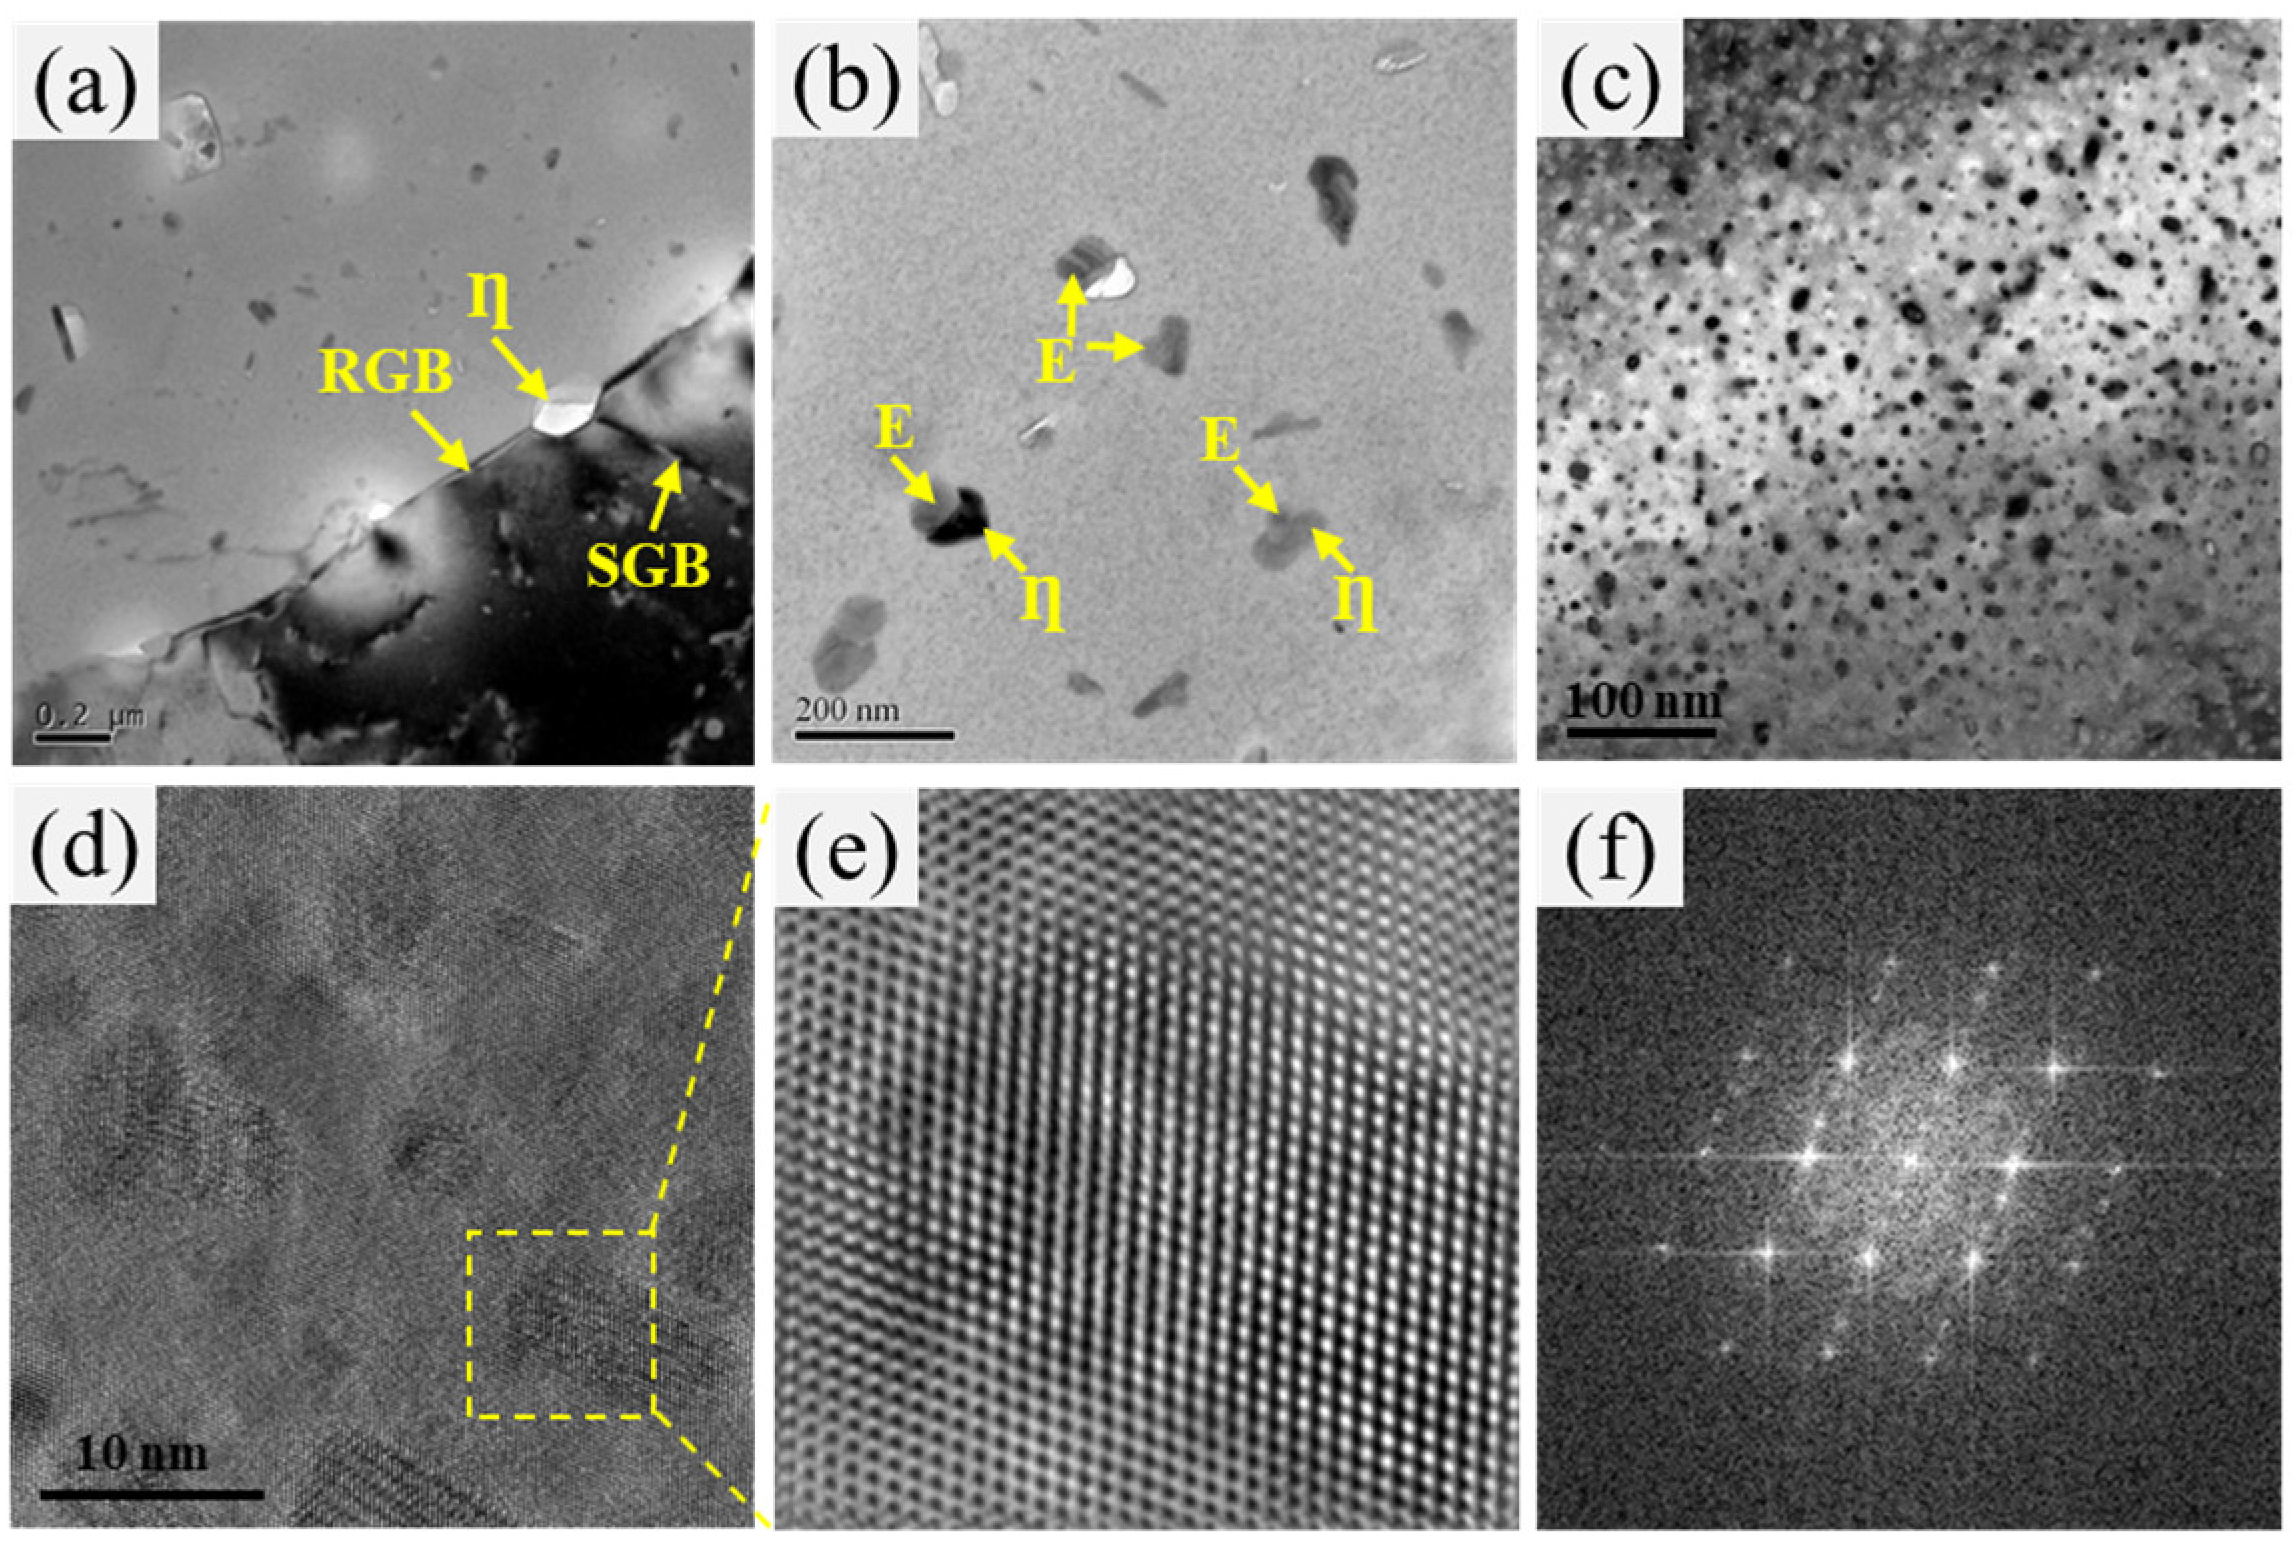
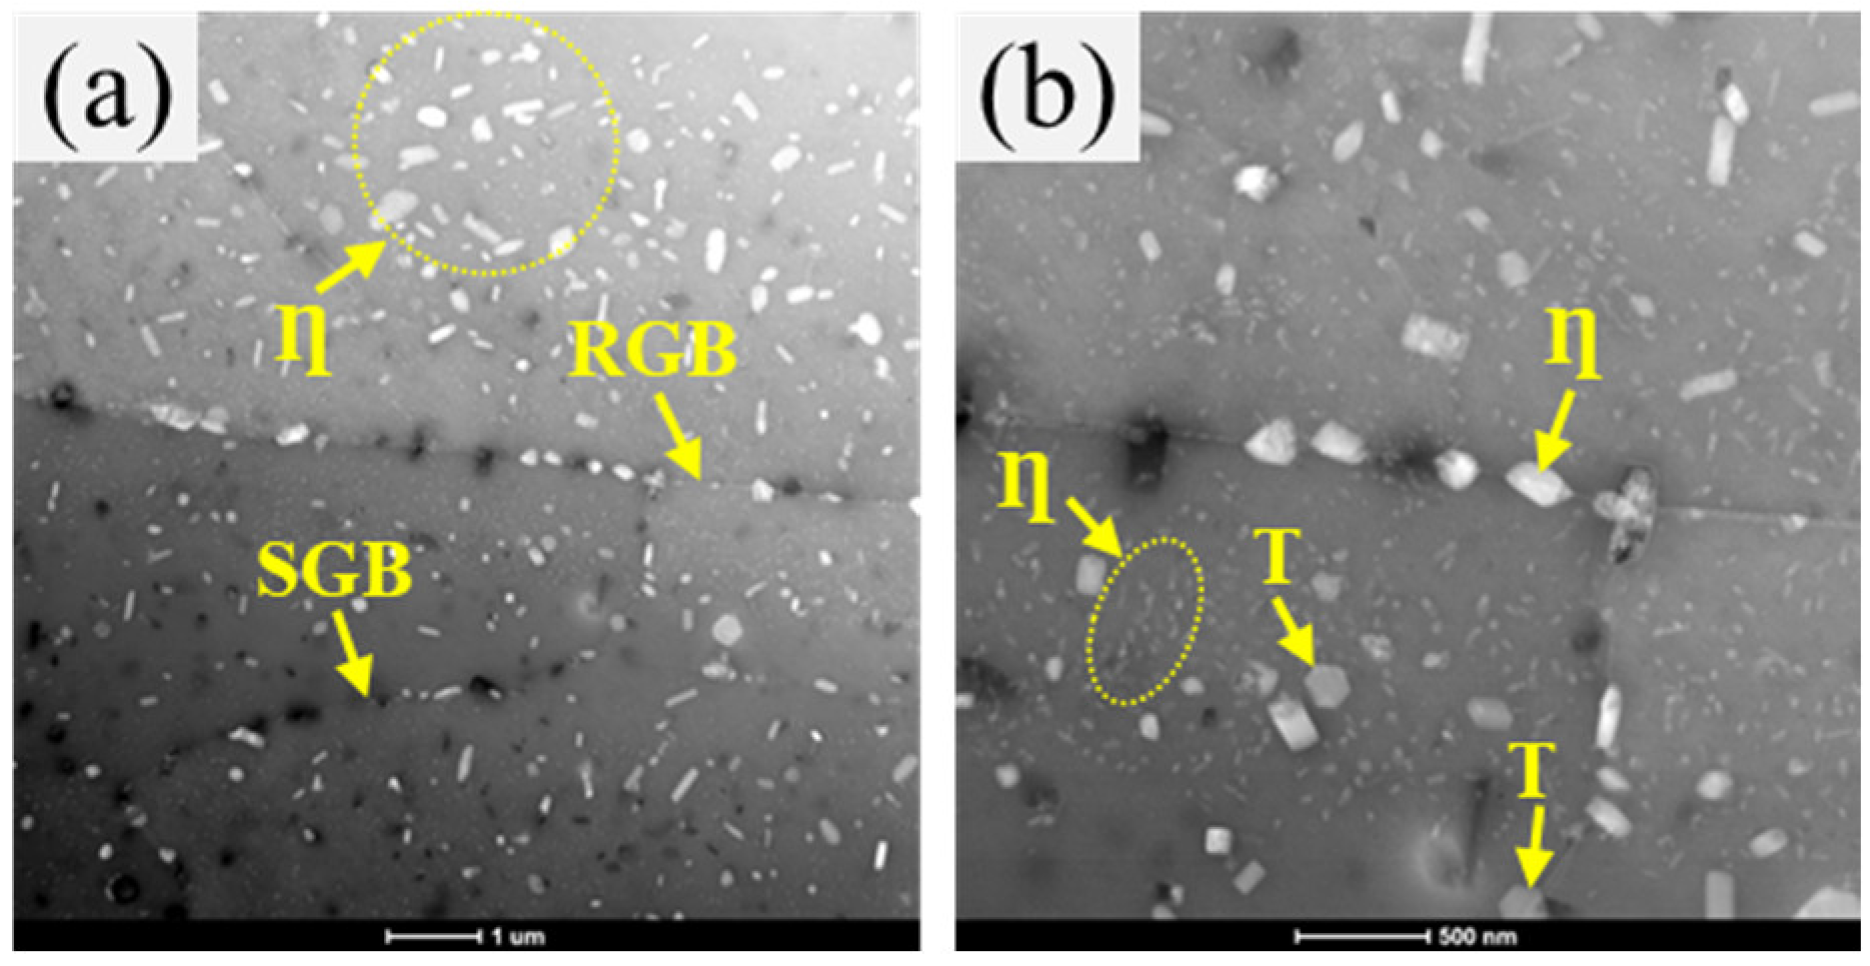
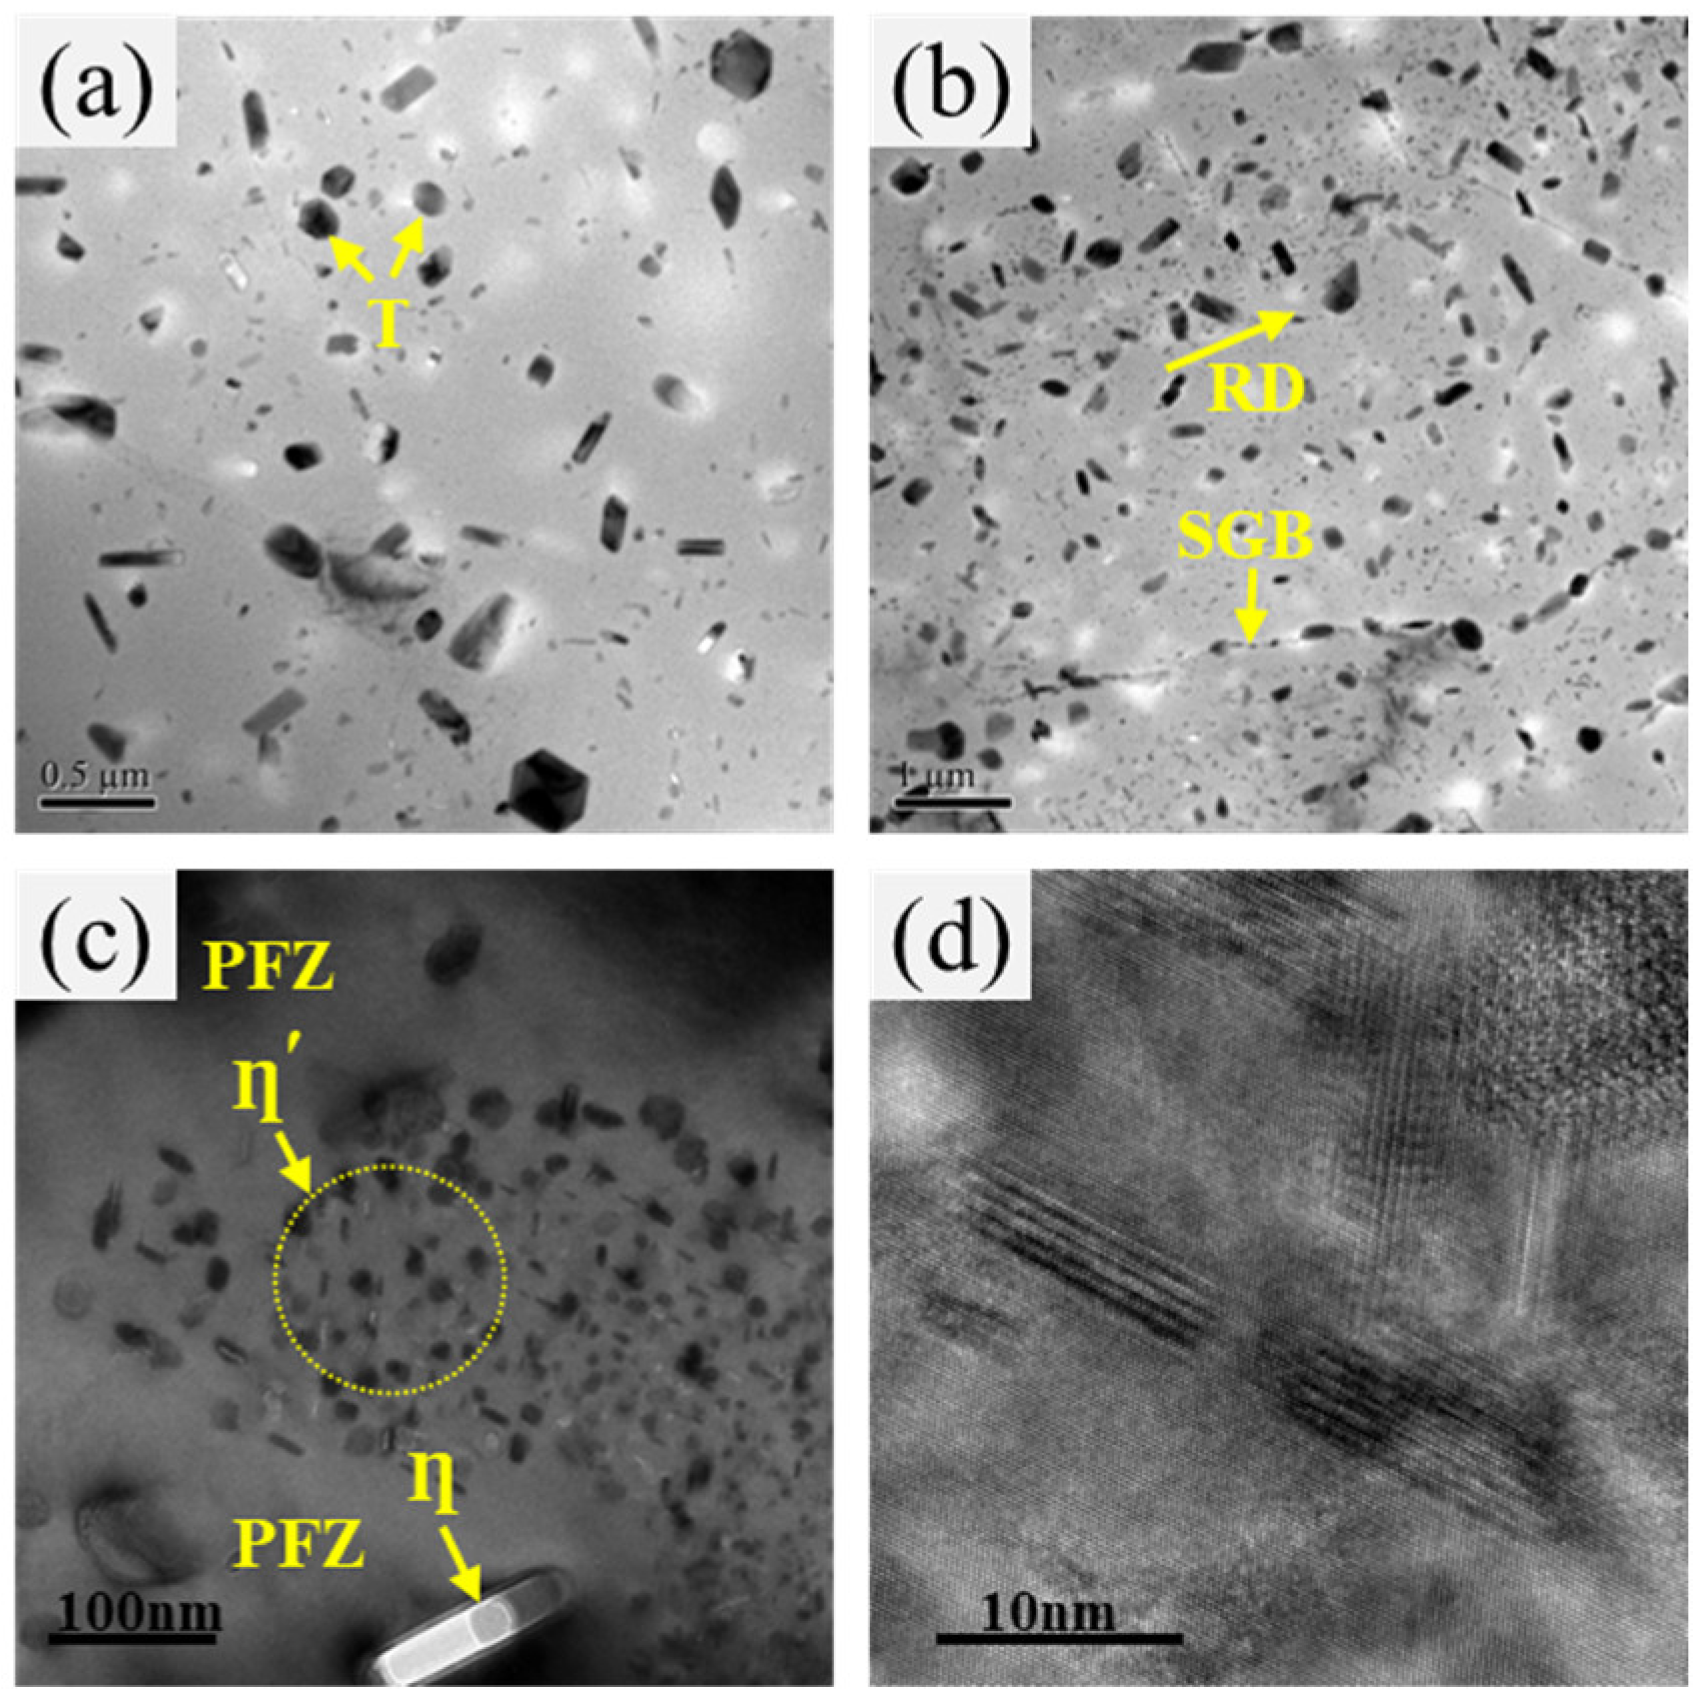
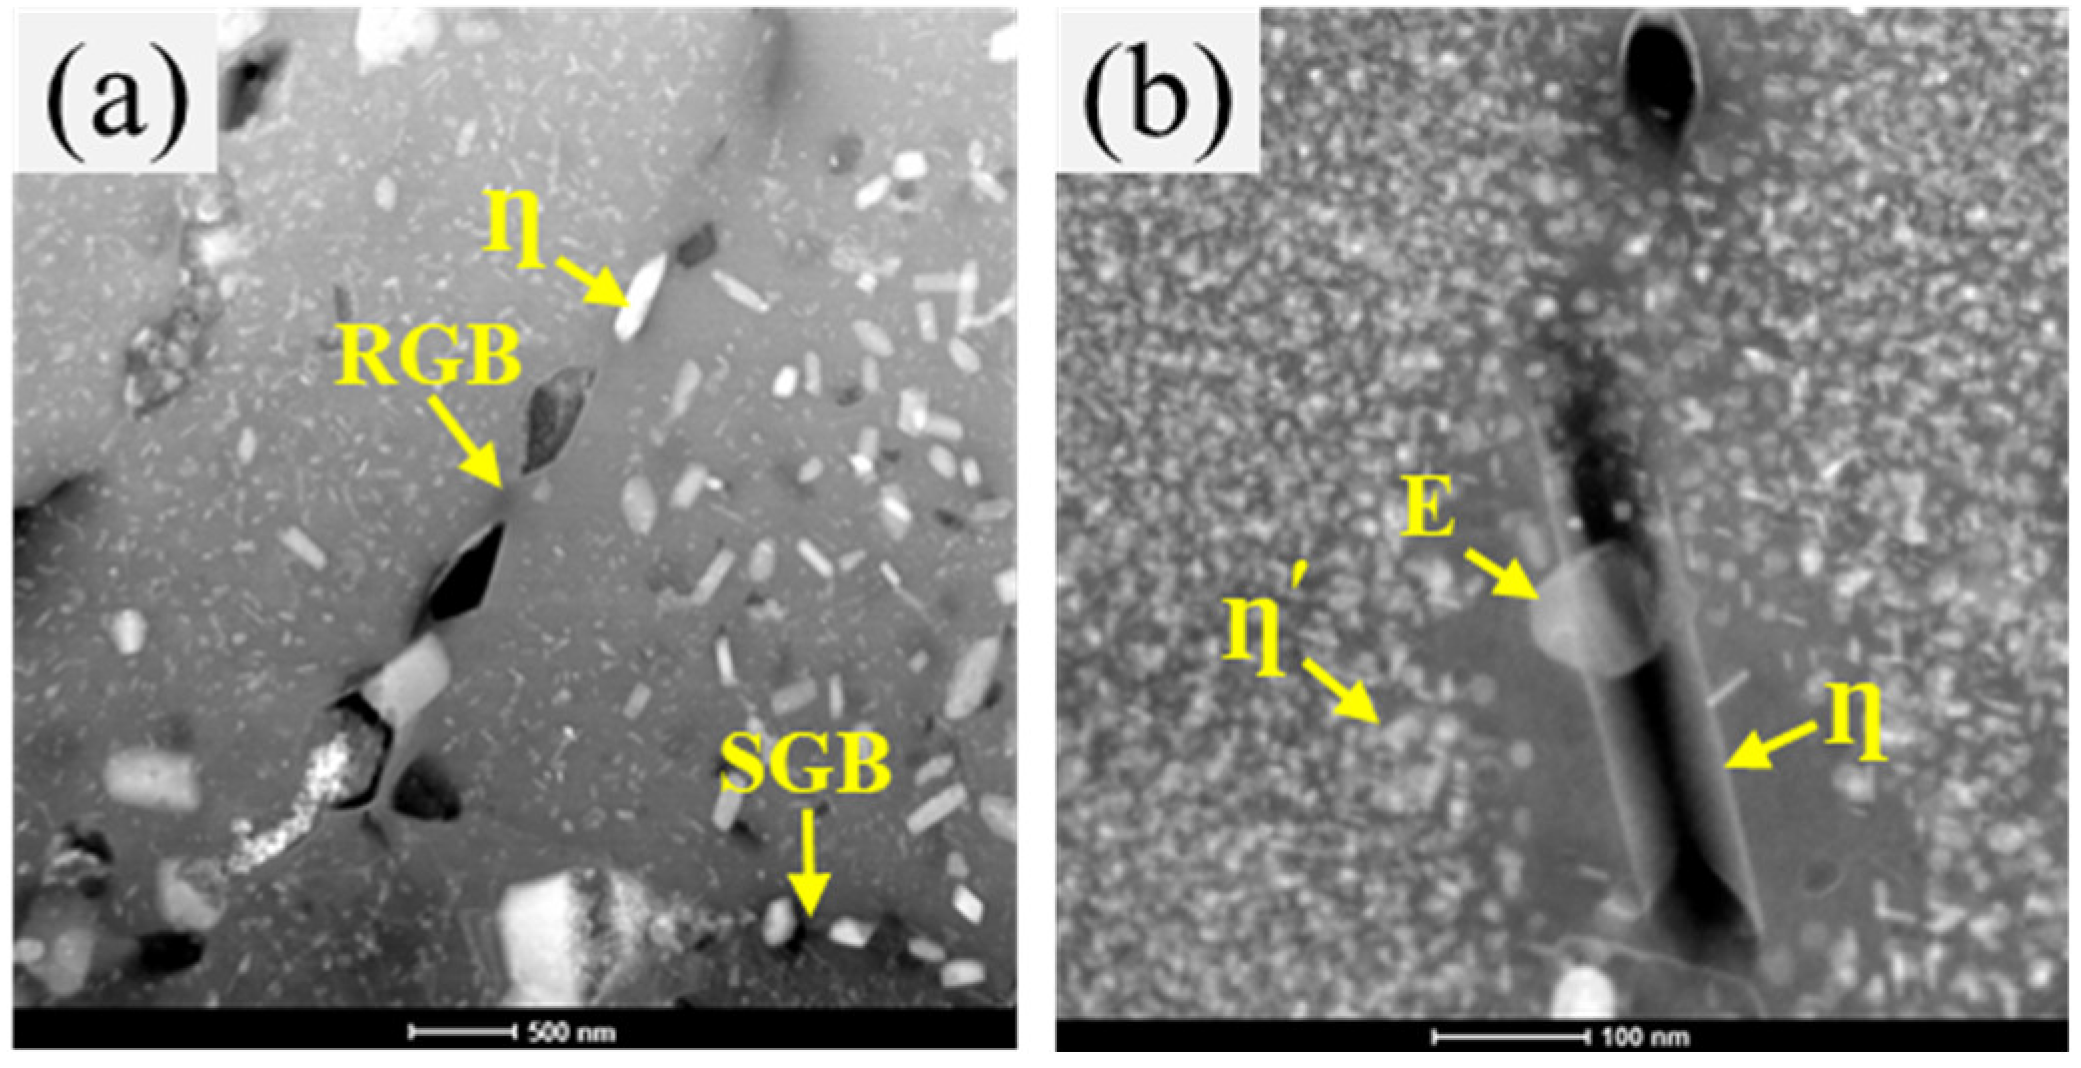
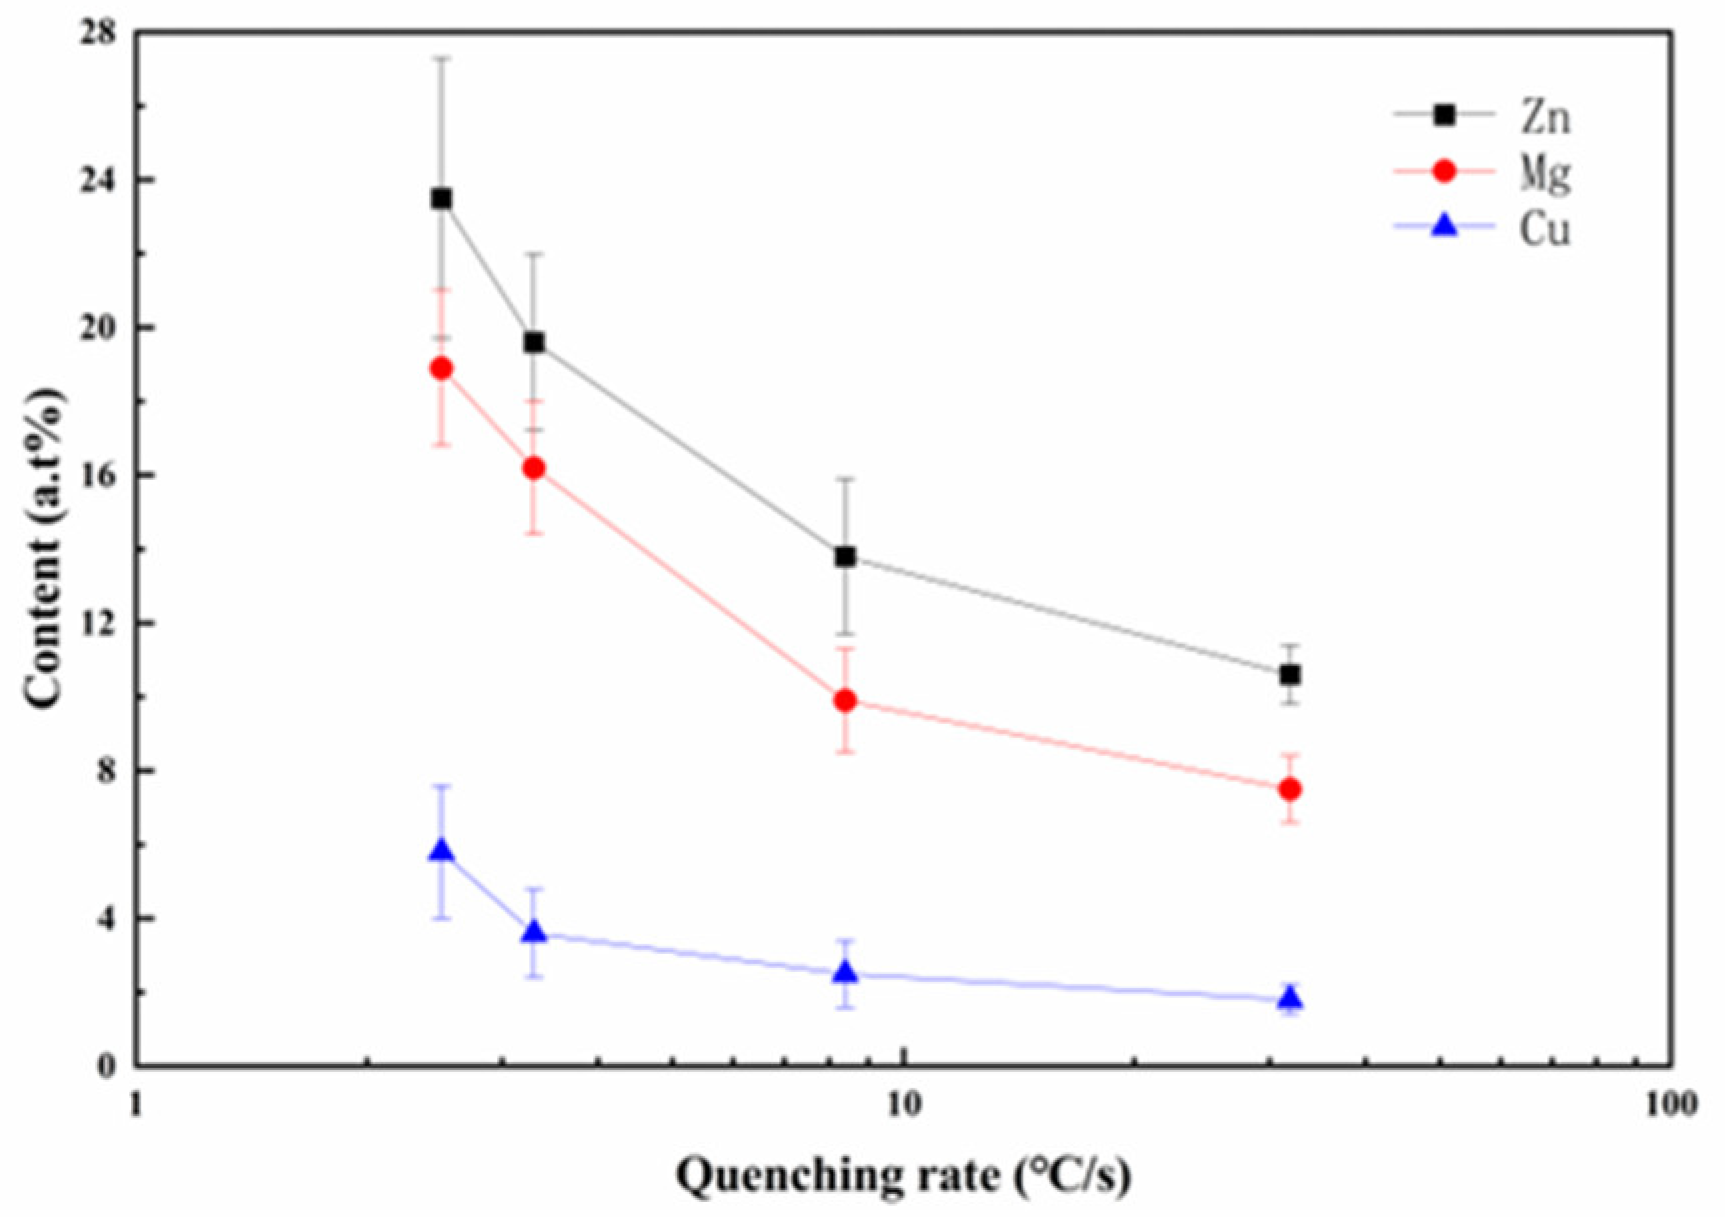
3.3. Microstructure
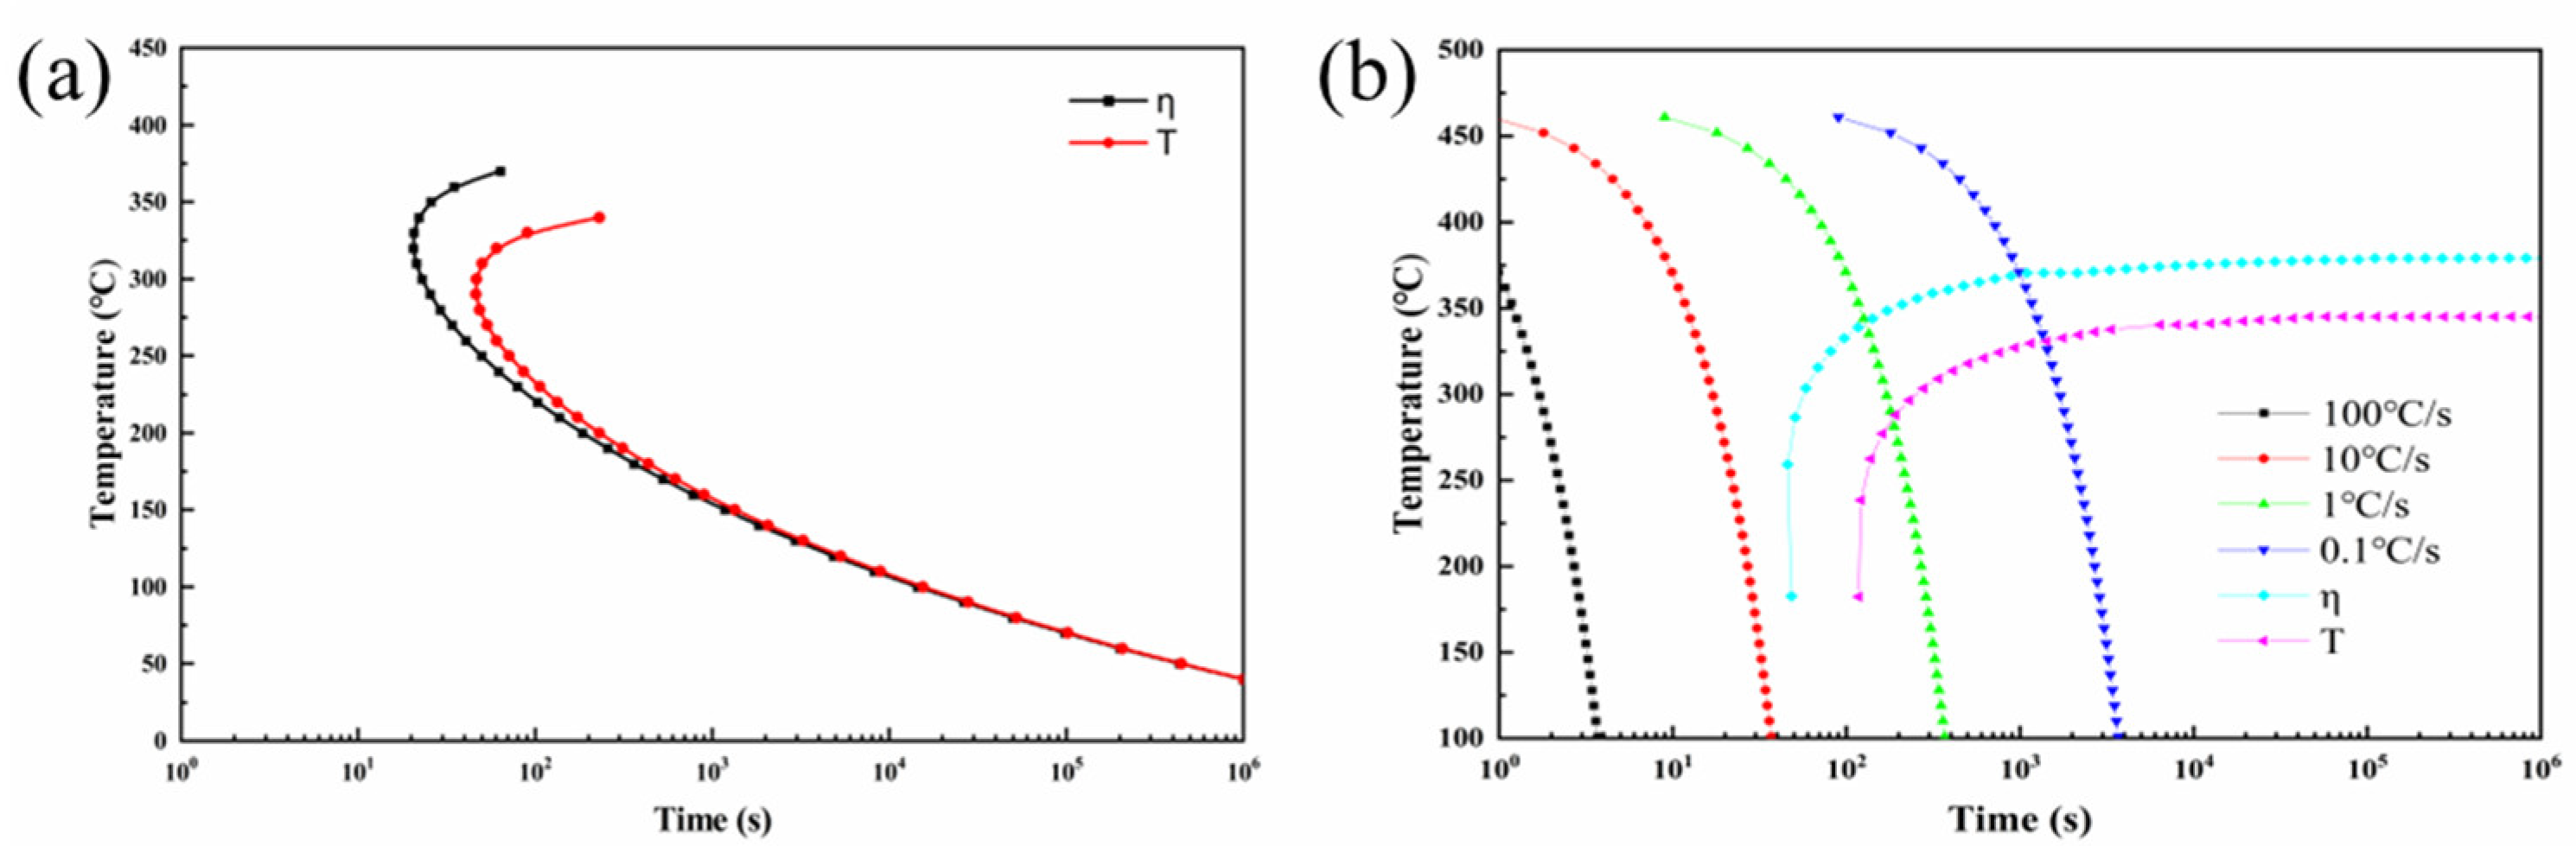
3.4. TTT and CCT Curves
4. Discussion
5. Conclusions
Author Contributions
Funding
Institutional Review Board Statement
Informed Consent Statement
Data Availability Statement
Conflicts of Interest
References
- Deng, Y.L.; Zhang, X.M. Development of aluminium and aluminium alloy. Chin. J. Nonferrous Met. 2019, 29, 2115–2141. [Google Scholar]
- Zhou, B.; Liu, B.; Zhang, S. The advancement of 7XXX series aluminum alloys for aircraft structures: A review. Metals 2021, 718, 718. [Google Scholar] [CrossRef]
- Lin, G.Y.; Zheng, X.Y.; Feng, D.; Yang, W.; Peng, D.S. Research development of quenching-induced residual stress of aluminum thick plates. Mater. Rev. 2008, 22, 70–74. [Google Scholar]
- Jiang, F.Q.; Huang, J.W.; Jiang, Y.G.; Xu, C.L. Effects of quenching rate and over-aging on microstructures, mechanical properties and corrosion resistance of an Al-Zn-Mg (7046A) alloy. J. Alloys Compd. 2021, 854, 157272. [Google Scholar] [CrossRef]
- Pan, T.A.; Tzeng, Y.C.; Bor, H.Y.; Liu, K.H.; Lee, S.L. Effects of the coherency of Al3Zr on the microstructures and quench sensitivity of Al-Zn-Mg-Cu alloys. Mater. Today Commun. 2021, 28, 102611. [Google Scholar] [CrossRef]
- Chen, J.S.; Li, X.W.; Xiong, B.Q.; Zhang, Y.A.; Li, Z.H.; Yan, H.W.; Liu, H.W.; Huang, S.H. Quench sensitivity of novel Al-Zn-Mg-Cu alloys containing different Cu contents. Rare Met. 2020, 39, 1395–1401. [Google Scholar] [CrossRef]
- Peng, Y.H.; Liu, C.Y.; Wei, L.L.; Jiang, H.J.; Ge, Z.J. Quench sensitivity and microstructures of high-Zn content Al-Zn-Mg-Cu alloys with different Cu contents and Sc addition. Trans. Nonferrous Met. Soc. China 2021, 31, 24–35. [Google Scholar] [CrossRef]
- Nie, B.H.; Liu, P.Y.; Zhou, T.T. Effect of compositions on the quenching sensitivity of 7050 and 7085 alloys. Mater. Sci. Eng. A 2016, 667, 106–114. [Google Scholar] [CrossRef]
- Liu, S.D.; Li, C.B.; Han, S.Q.; Deng, Y.L.; Zhang, X.M. Effect of natural aging on quench-induced inhomogeneity of microstructure and hardness in high strength 7055 aluminum alloy. J. Alloys Compd. 2015, 625, 34–43. [Google Scholar] [CrossRef]
- Li, P.Y.; Xiong, B.Q.; Zhang, Y.A.; Li, Z.H.; Zhu, B.H.; Wang, F.; Liu, H.W. Effect of quench behavior of 7050 Al alloy. Chin. J. Nonferrous Met. 2011, 21, 961–967. [Google Scholar]
- Liu, S.D.; Li, Q.; Lin, H.Q.; Sun, L.; Long, T.; Ye, L.Y.; Deng, Y.L. Effect of quench-induced precipitation on microstructure and mechanical properties of 7085 aluminum alloy. Mater. Des. 2017, 132, 119–128. [Google Scholar] [CrossRef]
- Zheng, P.C.; Ma, Z.M.; Liu, H.L.; Liu, S.D.; Xiao, Y.; Wei, W.C. Effect of quenching rate on microstructure and mechanical properties of 7136 aluminum alloy. Chin. J. Nonferrous Met. 2021, 31, 2348–2356. [Google Scholar]
- Ma, Z.M.; Jia, L.; Yang, Z.S.; Liu, S.D.; Zhang, Y. Effect of cooling rate and grain structure on the exfoliation corrosion susceptibility of AA7136 alloy. Mater. Charact. 2020, 168, 110533. [Google Scholar] [CrossRef]
- Marlaud, T.; Malki, B.; Henon, C.; Deschamps, A.; Baroux, B. Relationship between alloy composition, microstructure and exfoliation corrosion in Al-Zn-Mg-Cu alloys. Corros. Sci. 2011, 53, 3139–3149. [Google Scholar] [CrossRef]
- Song, F.X.; Zhang, X.M.; Liu, S.D.; Tan, Q.; Li, D.F. The effect of quench rate and over-ageing temper on the corrosion behaviour of AA7050. Corros. Sci. 2014, 78, 276–286. [Google Scholar] [CrossRef]
- Li, D.F.; Zhang, X.M.; Liu, S.D.; Yin, B.W.; Lei, Y. Effect of quenching rate on exfoliation corrosion of Al-5Zn-3Mg-1Cu aluminum alloy thick plate. Hunan Univ. J. Nat. Sci. 2015, 42, 47–52. [Google Scholar]
- Liu, S.D.; Chen, B.; Li, C.B.; Dai, Y.; Deng, Y.L.; Zhang, X.M. Mechanism of low exfoliation corrosion resistance due to slow quenching in high strength aluminium alloy. Corros. Sci. 2015, 91, 203–212. [Google Scholar] [CrossRef]
- Zhang, X.M.; Deng, Y.L.; You, J.H.; Zhang, Y.; Liu, X.H.; He, J.T.; Zhou, Z.P. Measurement Device and Method of Quenched Depth for Aluminum Alloy. CN101013124, 8 August 2007. [Google Scholar]
- GB/T 22639-2008; Flake Corrosion Test Method for Aluminum Alloy Processed Products. General Administration of Quality Supervision, In-spection and Quarantine of the People’s Republic of China and the Standardization Administration of the People’s Republic of China. Standardization Administration of the People’s: Beijing, China, 2008.
- Liu, S.D.; Zhong, Q.M.; Zhang, Y.; Liu, W.J.; Zhang, X.M.; Deng, Y.L. Investigation of quench sensitivity of high strength Al-Zn-Mg-Cu alloys by time-temperature-properties diagrams. Mater. Des. 2010, 31, 3116–3120. [Google Scholar] [CrossRef]
- Du, Y.; Chang, Y.A.; Huang, B.Y.; Gong, W.P.; Jin, Z.P.; Xu, H.H.; Yuan, Z.H.; Liu, Y.; He, Y.H.; Xie, F.Y. Diffusion coefficients of some solutes in fcc and liquid Al: Critical evaluation and correlation. Mater. Sci. Eng. A 2003, 363, 140–151. [Google Scholar] [CrossRef]
- Beerwald, A. Diffusion of various metals in aluminum. Z. Elektrochem. Angew. Phys. Chem. 1939, 45, 789–795. [Google Scholar]
- Zhang, X.M.; Liu, W.J.; Liu, S.D. Effect of processing parameters on quench sensitivity of an AA7050 sheet. Mater. Sci. Eng. A 2011, 528, 795–802. [Google Scholar] [CrossRef]
- Liu, S.D.; Liu, W.J.; Zhang, Y. Effect of microstructure on the quench sensitivity of Al-Zn-Mg-Cu alloys. J. Alloys Compd. 2010, 507, 53–61. [Google Scholar] [CrossRef]
- Song, F.X. Investigation on Susceptibility to the Localized Corrosion of Aluminium 7050 Thick Plate; Central South University: Changsha, China, 2014. [Google Scholar]
- Chen, M.Y.; Xu, Z.; He, K.Z.; Liu, S.D.; Yong, Z. Local corrosion mechanism of an Al-Zn-Mg-Cu alloy in oxygenated chloride solution: Cathode activity of quenching-induced η precipitates. Corros. Sci. 2021, 191, 109743. [Google Scholar] [CrossRef]
- Song, F.X.; Zhang, X.M. The effect of quench transfer time on microstructure and localized corrosion behavior of 7050-T6 Al alloy. Mater. Corros. 2014, 65, 1007–1016. [Google Scholar] [CrossRef]
- Peng, X.; Chen, S.Y.; Chen, K.H.; Jiao, H.B.; Huang, L.P.; Zhang, Z.; Yang, Z. Enhancing the stress corrosion cracking resistance of a low-Cu containing Al-Zn-Mg-Cu aluminum alloy by step-quench and aging heat treatment. Corros. Sci. 2019, 161, 108184. [Google Scholar]


| Zn | Mg | Cu | Cr | Fe | Si | Al |
|---|---|---|---|---|---|---|
| 5.6 | 2.5 | 1.6 | 0.25 | 0.10 | 0.05 | Bal |
| Quenching Rate (°C/s) | RGBs | E Particle | SGBs |
|---|---|---|---|
| 960 | — | — | — |
| 31.9 | η | η | — |
| 8.4 | η | η, T | η |
| 3.3 | η | η, T | η |
| 2.5 | η | η, T | η |
| Quenching Rate (°C/s) | RGBs | E Particle | SGBs |
|---|---|---|---|
| 960 | — | — | — |
| 31.9 | 151.1 ± 55.9 | 128.8 ± 48.7 | — |
| 8.4 | 235.7 ± 88.2 | 185.6 ± 78.1 | 119.4 ± 57.3 |
| 3.3 | 345.2 ± 102.6 | 240.7 ± 90.5 | 167.7 ± 69.4 |
| 2.5 | 526.1 ± 192.5 | 369.8 ± 138.6 | 251.4 ± 102.5 |
Disclaimer/Publisher’s Note: The statements, opinions and data contained in all publications are solely those of the individual author(s) and contributor(s) and not of MDPI and/or the editor(s). MDPI and/or the editor(s) disclaim responsibility for any injury to people or property resulting from any ideas, methods, instructions or products referred to in the content. |
© 2023 by the authors. Licensee MDPI, Basel, Switzerland. This article is an open access article distributed under the terms and conditions of the Creative Commons Attribution (CC BY) license (https://creativecommons.org/licenses/by/4.0/).
Share and Cite
Cao, P.; Xie, G.; Li, C.; Zhu, D.; Feng, D.; Xiao, B.; Zhao, C. Investigation of the Quenching Sensitivity of the Mechanical and Corrosion Properties of 7475 Aluminum Alloy. Metals 2023, 13, 1656. https://doi.org/10.3390/met13101656
Cao P, Xie G, Li C, Zhu D, Feng D, Xiao B, Zhao C. Investigation of the Quenching Sensitivity of the Mechanical and Corrosion Properties of 7475 Aluminum Alloy. Metals. 2023; 13(10):1656. https://doi.org/10.3390/met13101656
Chicago/Turabian StyleCao, Puli, Guilan Xie, Chengbo Li, Daibo Zhu, Di Feng, Bo Xiao, and Cai Zhao. 2023. "Investigation of the Quenching Sensitivity of the Mechanical and Corrosion Properties of 7475 Aluminum Alloy" Metals 13, no. 10: 1656. https://doi.org/10.3390/met13101656