Article

The Effect of Plasma–Electrolytic Nitrocarburizing of a Medium Carbon Steel Surface on Friction and Wear in Pair with Tin–Lead Bronze

1
Department of High-Efficiency Machining Technologies, Moscow State University of Technology “STANKIN”, 127994 Moscow, Russia
2
Moscow Aviation Institute, National Research University, 109383 Moscow, Russia
3
Department of Mathematical and Natural Sciences, Kostroma State University, 156005 Kostroma, Russia
*
Authors to whom correspondence should be addressed.
Metals 2023, 13(10), 1731; https://doi.org/10.3390/met13101731
Submission received: 2 August 2023 / Revised: 22 September 2023 / Accepted: 10 October 2023 / Published: 12 October 2023

Abstract

:
The possibility of increasing the durability of steel pins working against bronze bushings through plasma–electrolytic nitrocarburizing of the surface of medium carbon steel is shown. The phase composition, microhardness, morphology, and surface roughness were studied. Tribological tests were carried out under dry friction conditions according to the shaft-pad scheme. It has been established that plasma–electrolytic nitrocarburizing of the surface of medium carbon steel at a temperature of 700 °C for 5 min leads to a decrease in the friction coefficient by 2.3 times, the weight wear of steel by 24.9 times, and the wear of the bronze counterbody by 5.9 times. At the same time, the contact stiffness increases by 2.6 times. Type of wear: wear with dry friction and plastic contact. The changes in tribological characteristics are associated with the high hardness of the hardened steel surface combined with the effect of dispersed nitrides and iron carbonitrides.

1. Introduction

Reliability and durability are considered to be the key indicators of machine quality. Enhancing these properties is often solved by using advanced materials. However, this method may break the balance properties and negatively affect, for example, wear resistance. Hardened steel paired with another hardened steel counterpart is rather widespread and demands a friction couple. The main failure causes of such mechanisms are connected with scoring followed by a seizure. The problem may be addressed by replacing steel with bronze, which reduces the wear resistance of the entire friction couple while increasing reliability. However, in many cases, it is vital to prevent intensive wear of a rubbing part as replacement, fixing, renovation, and other types of repairs may be time-consuming, and the part itself very expensive.
To improve the wear resistance of materials, different technologies are used [1].
Technologies for plasma–electrolytic treatment have found applications in applying protective ceramic coatings onto the surfaces of metals of the valve group, polishing metal surfaces, and forming hardened diffusion layers on steel and titanium alloys [2,3,4,5,6,7,8,9].
This research aims to increase the endurance of pins made of steel 45 working against bronze journal bearings. For this purpose, the steel surface was hardened through plasma–electrolytic treatment to increase the wear resistance of the friction couple.
High-speed plasma–electrolytic nitrocarburizing (PENC) is a promising technology for enhancing the life cycle of metal parts. The whole process takes a few minutes and requires no preliminary surface preparation. The part is connected to the positive terminal of a power source and acts as an anode. Within the process, an aqueous electrolyte locally boils at the surface of the part during heating up to 400–1000 °C, forming a continuous and stable vapor–gas envelope. The emission of electrolyte components into the vapor–gas envelope makes diffusion saturation of the part surface possible. Meanwhile, the high heating rate, up to hundreds of degrees per second, contributes to an austenite grain size reduction, increasing diffusion capacity [10,11]. Moreover, simultaneous diffusion saturation with nitrogen and carbon provides an increase in the hardness, wear resistance, fatigue strength, ductility, and impact strength of steel products [12,13].
Overall, applying PENC to increase the durability of carbon steel pins working against bronze journal bearings is reasonable. This work aims to study the friction and wear of steel 45 after PENC coupled with tin–lead bronze.

2. Materials and Methods

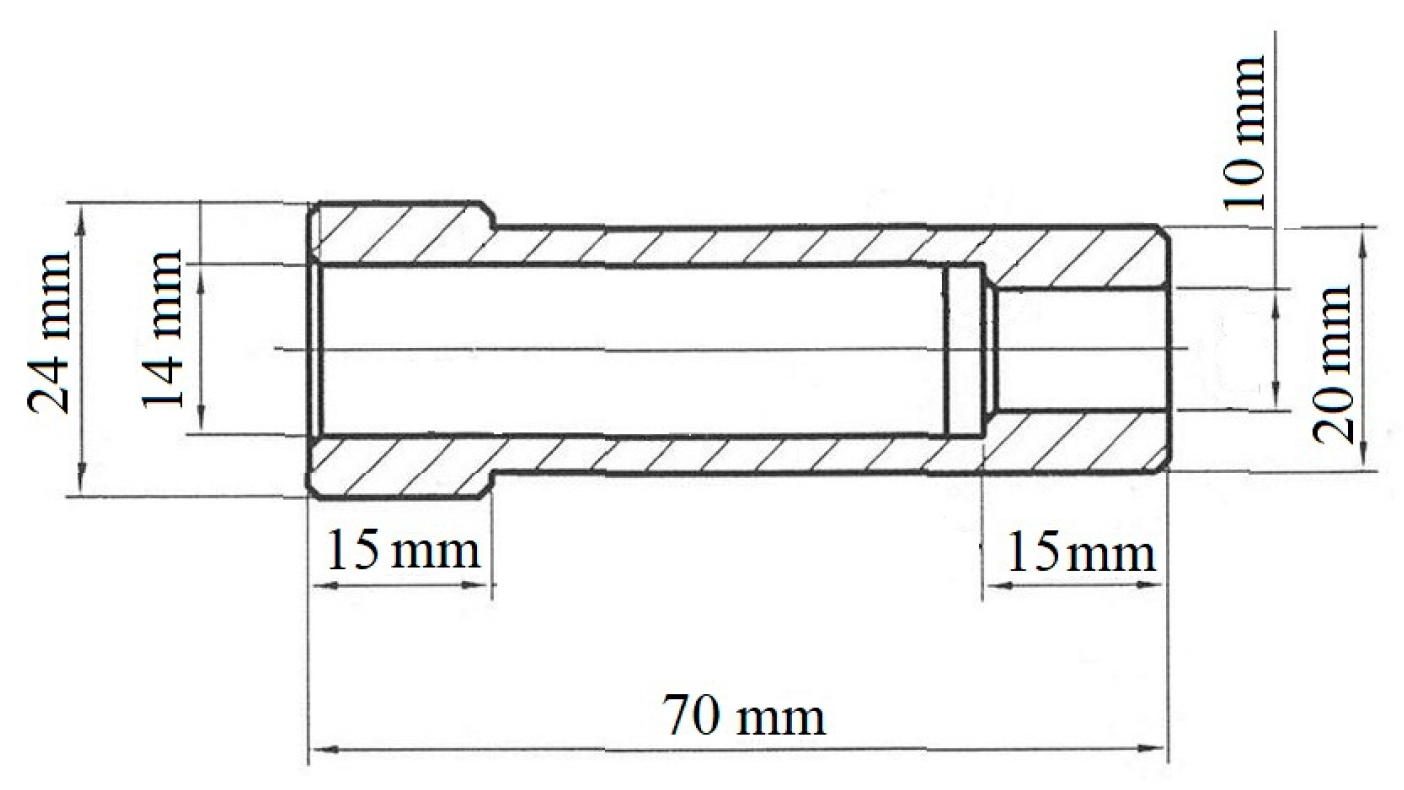
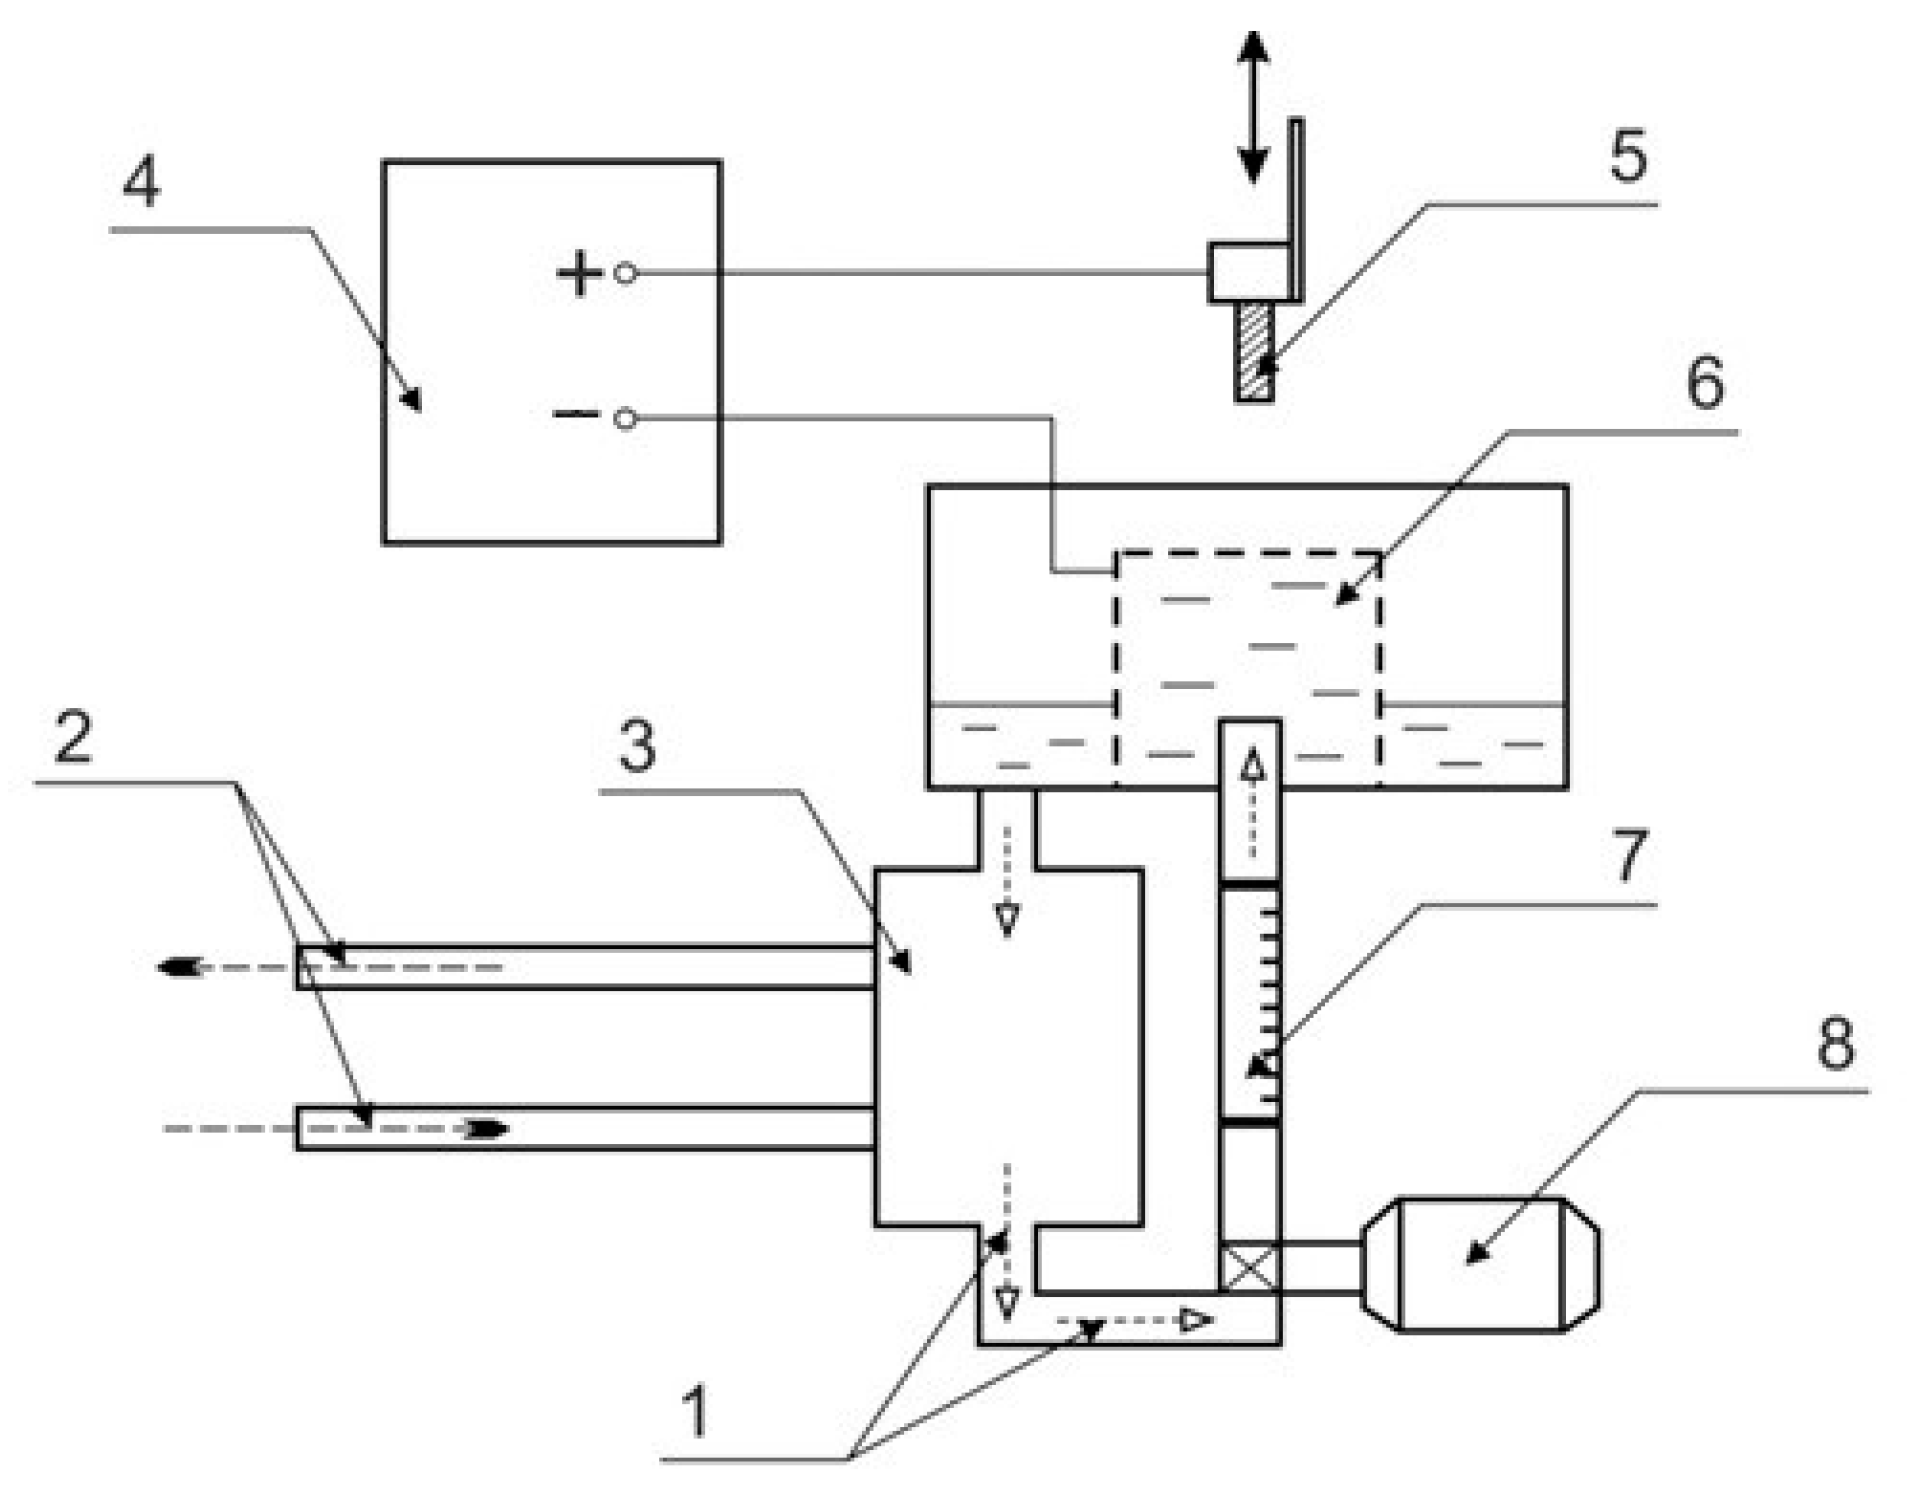
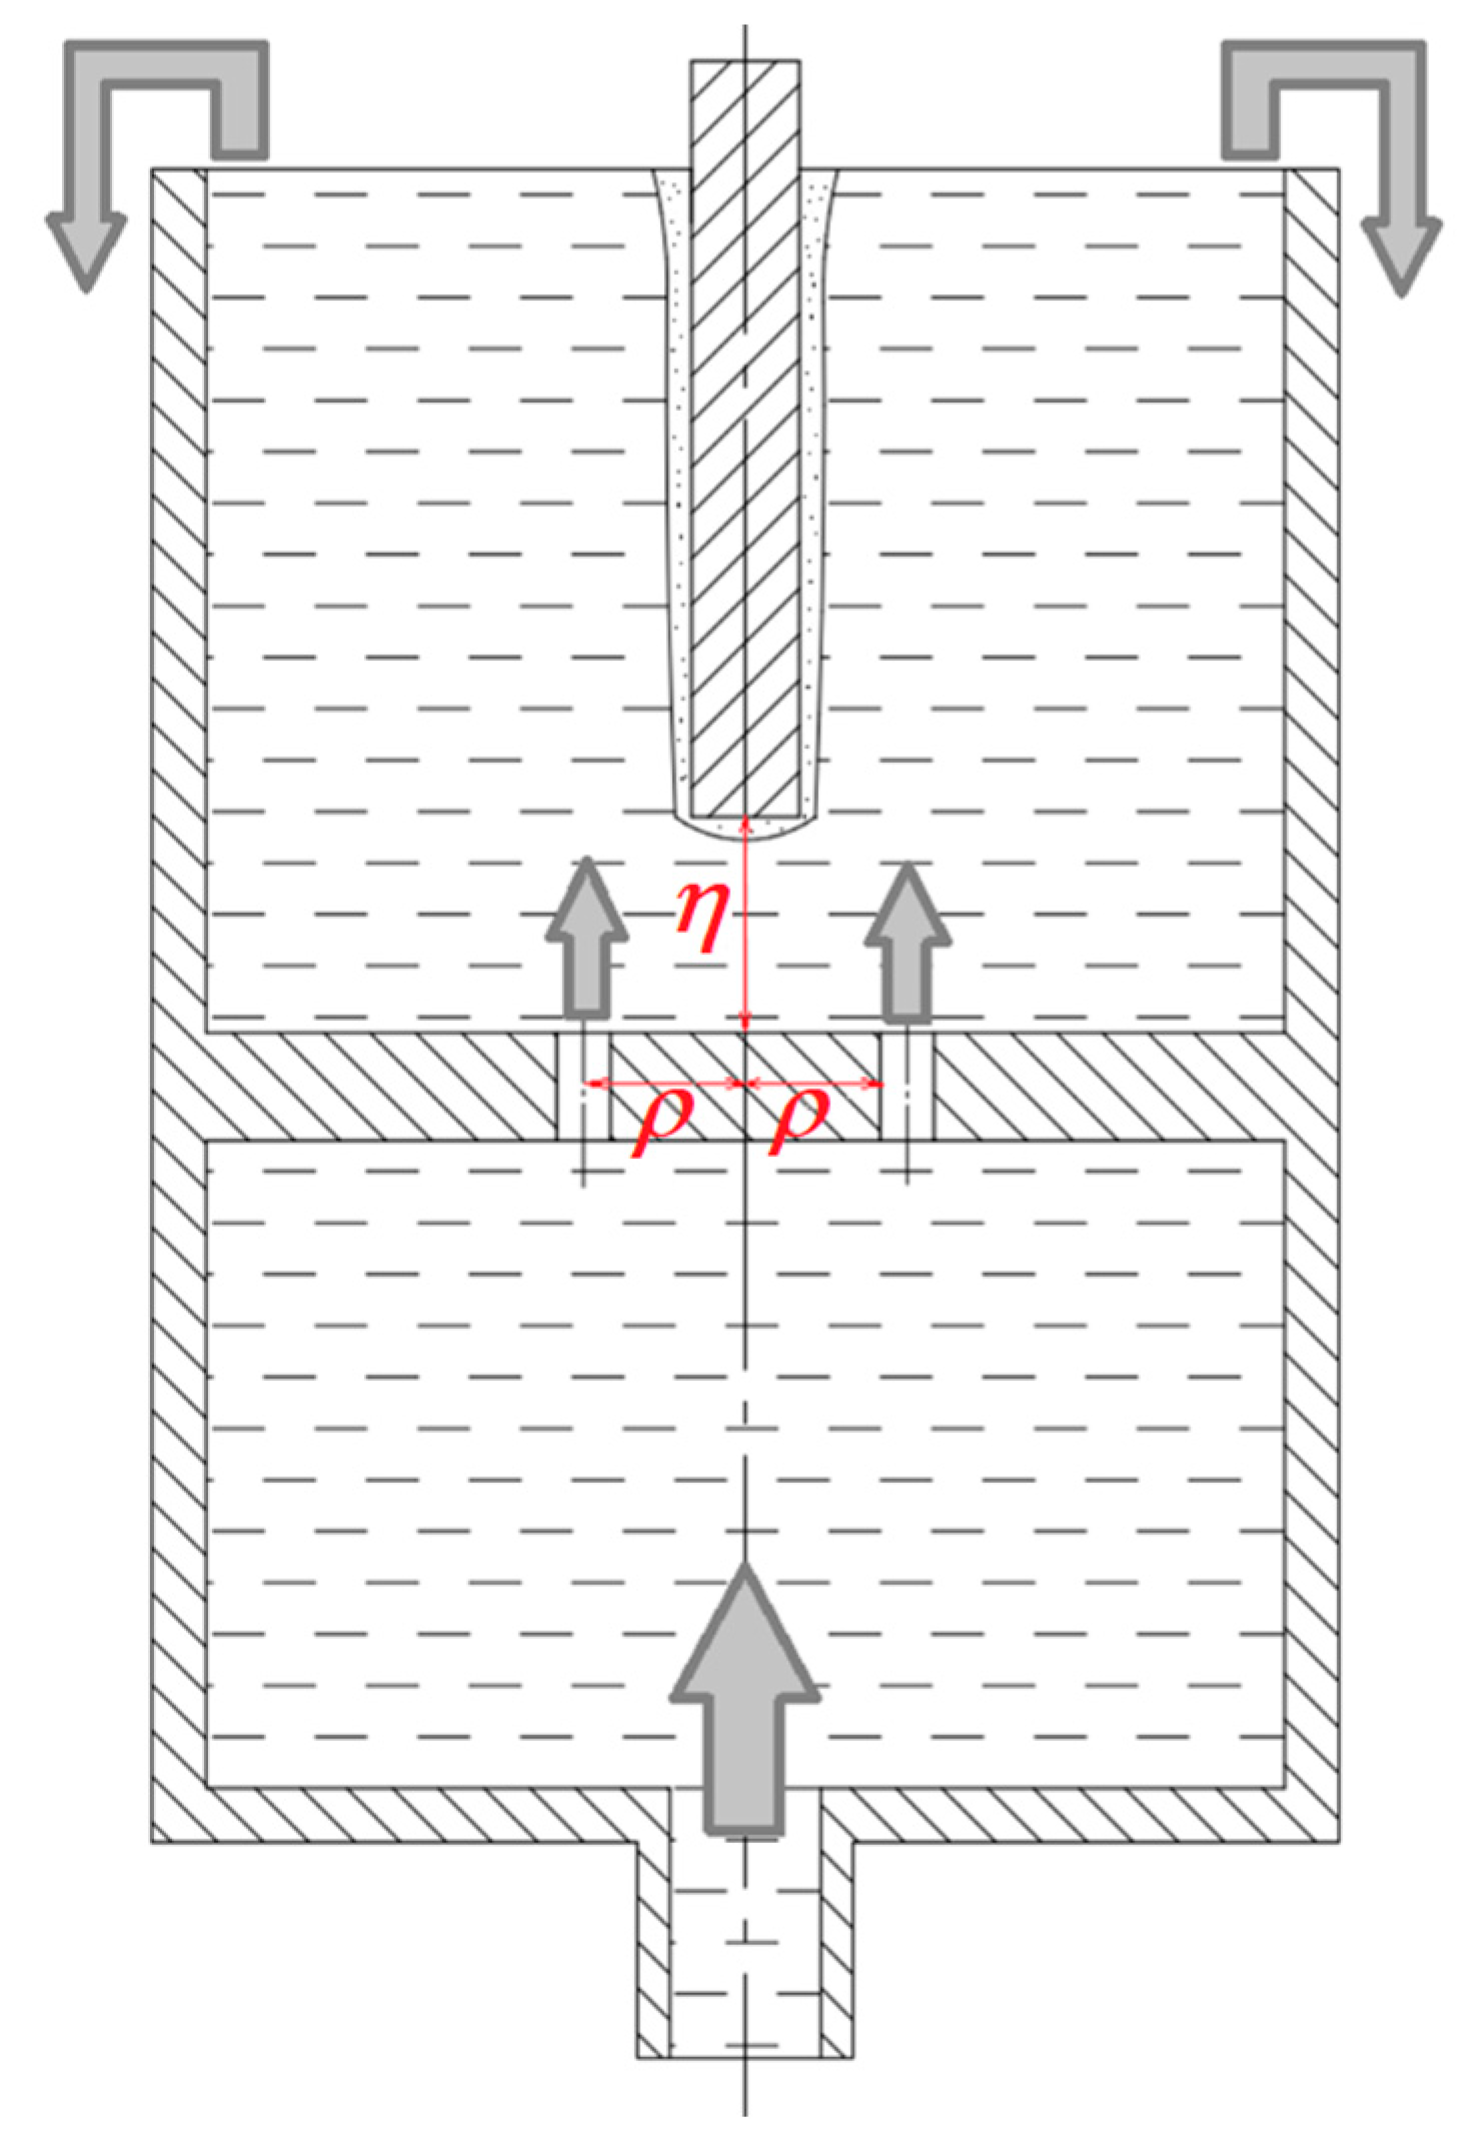
2.1. Samples Processing

For the process optimization, PENC of carbon steel specimens (0.42–0.5 C, 0.17–0.37 Si, 0.5–0.8 Mn, ≤0.25 Ni, ≤0.04 S, ≤0.035 P, ≤0.25 Cr, ≤0.25 Cu, ≤0.08 As, and balance Fe) was carried out under varying working parameters. The lowest friction coefficient and wear of both the steel sample and the bronze counterbody were used as the optimization criteria. An aqueous solution containing ammonium chloride NH4Cl (10%) and carbamide (NH2)2CO (20%) was used as an electrolyte. The carbamide-based solution is a low-cost and environmentally friendly versatile electrolyte that provides both carbon and nitrogen. The processing temperature varied from 550 °C to 850 °C with a 50 °C increment, while PENC time was constantly 5 min.
The testing of PENC regimes, as well as friction tests, were carried out on small cylindrical samples, 10 mm in diameter and height, to select the PENC regime that provides the minimum values of the friction coefficient and weight wear of both the steel sample itself and the bronze counterbody (4–6% Pb, 4–6% Zn, 4–6% Sn, ≤0.4 Fe, ≤0.05 Si, ≤0.1 P, ≤0.05 Al, ≤0.5 Sb, and balance Cu).
The selected PENC regime was used when processing steel pins (Figure 1) with a working surface length of 55 mm and a diameter of 10 mm. The pins work in a friction couple with bronze bushings (4–6% Pb, 4–6% Zn, 4–6% Sn, ≤0.4 Fe, ≤0.05 Si, ≤0.1 P, ≤0.05 Al, ≤0.5 Sb, and balance Cu) (Figure 2).
Processing was carried out on a plasma–electrolytic treatment set-up with two types of working chambers (Figure 3). The samples were connected to the positive terminal of the power source, while the electrolyzer was attached to the negative output. After the voltage was on, the samples were immersed in the electrolyte to a depth equal to their height. During plasma–electrolyte treatment, the operating voltage and current varied from 110 V and 16 A (corresponding to the heating temperature of 550 °C) to 200 V and 10 A (heating temperature of 850 °C). The electrolyte was fed into the working chamber with a pump, and the flow rate was controlled by a float rotameter with an accuracy of ±2.5%. The electrolyte temperature at the outlet of the heat exchanger was recorded with an MS-6501 multimeter using a chromel-alumel thermocouple (accuracy ±3%) and maintained at 20 ± 1 °C. The sample temperature was measured with an MS8221 multimeter using an M89-K1 thermocouple with an accuracy of 2% in the temperature range from 400 to 1000 °C. The thermocouple was placed in the axial hole and was in direct contact with the sample at a point 2 mm away from its end. The quenching of the samples was carried out by switching off the voltage, which led to the collapse of the vapor–gas envelope and the restoration of contact between the sample and the cooled electrolyte.
PENC of the test samples was carried out in an axisymmetric cylindrical electrolyzer with a cooled electrolyte solution injected from below through a central axial hole. In the upper part of the electrolyzer, the heated electrolyte overflowed and fell into a special tray, from where it then entered the heat exchanger (Figure 4).
Within PENC, the vapor–gas envelope separating the part from direct contact with the electrolyte solution expands in the bottom-up direction due to the removal of vapor into the atmosphere. Due to the expansion of the gas–vapor envelope, the heating of the pin can be non-uniform and provoke a vertical temperature gradient. This, in turn, leads to an uneven distribution of hardness and other properties over the working surface of the pin.
For processing pins with a 55 mm long working surface at the chosen optimal saturation parameters, the design of the chamber (cathode) was upgraded (Figure 5). Compared to the previous version, the new modification features a polymer screen with holes inside the cylindrical cathode chamber. The presence of the polymer screen makes it possible to switch from the concentrated solution flow around the pin to a distributed one using several jets. This design significantly changes the distribution of velocities of the liquid at the vapor–gas envelope and solution interface: the highest velocity is now achieved not at the bottom of the anode, but around its upper half. Furthermore, it changes the heat exchange conditions in the system. Particularly, the temperature at the bottom decreases, while it increases at the upper half reaching, a local maximum. The temperature distribution along the axis is determined by the parameters η and ρ, which depend on the workpiece dimensions.
The flow rate of the solution through the holes in the polymer screen also plays an important role. In the case of an axisymmetric anode, the holes are located at equal distances from each other, and their centers lie on a circle of radius r. The larger the anode diameter, the more holes are required to maintain uniform flow around the entire surface of the anode.
Thus, this design of the working chamber made it possible to greatly reduce the vertical temperature gradient and increase the uniformity of heat treatment, which benefits hardness distribution and diffusion layer thickness distribution over the pin’s surface.

2.2. Study of Phase Composition

X-ray diffraction (XRD) analysis was used to determine the phase composition of the samples. The XRD patterns were obtained using a PANalytical Empyrean X-ray diffractometer (Malvern Panalytical, Malvern, UK) with CoKα radiation through a simple scanning mechanism in the theta-2theta-mode with a step of 0.026° and a scanning rate of 4.5°/min. Phase composition analysis was performed using the PANalytical High Score Plus software HighScore Plus PDF2 [14] and the ICCD PDF-2 and COD databases [15].

2.3. The Microhardness Tests

The microhardness of the cross-sections of the treatment sample was measured using a Vickers microhardness tester (Falcon 503, Innovatest Europe BV, Maastricht, The Netherlands) under a 0.5 N load. An average value of microhardness was calculated based on 5 measurements.

2.4. Surface Characterization and Microstructure Analysis

The Phenom g2 pro scanning electron microscope (Phenom-World B.V., Eindhoven, The Netherlands) with digital image visualization served to study the surface morphology and microstructure of the cross-section of the steel samples.
The surface roughness and microgeometry of the friction grooves were analyzed with a Hommel tester t8000 profilometer (Jenoptik, Jena, Germany).

2.5. Tribological Tests

The tribological tests were performed according to the “shaft-block” scheme (Figure 6) [11,13].
The sample was mounted on a shaft driven by an electric motor. The counterbody was mounted on a platform sliding along cylindrical guides. The platform was moved using a pneumatic cylinder. The cylinder, the guides, and the platform were able to rotate with the pendulum. The pendulum shaft was located coaxially with the sample. Such a scheme makes it possible to preserve the common rotation axis for the sample and the counterbody as they exhaust and to avoid the influence of misalignment on the results of measurements of the frictional moment.
The testing conditions were as follows: sliding speed 1.555 m/s, sliding distance 5000 m, load 10 N, dry friction. The friction coefficient and temperature were recorded every 0.3 s. After 1, 3, and 5 km of friction, the steel sample and the bronze counterbody were weighed on an analytical balance to estimate the weight loss during the friction tests.
Wear loss was measured on a CitizonCY224C electronic analytical balance (ACZET (Citizen Scale), Mumbai, India) with an accuracy of ±0.0001 g. Before the weighing procedure, the samples were cleaned in distilled water and dried to remove all residuals and salt traces.

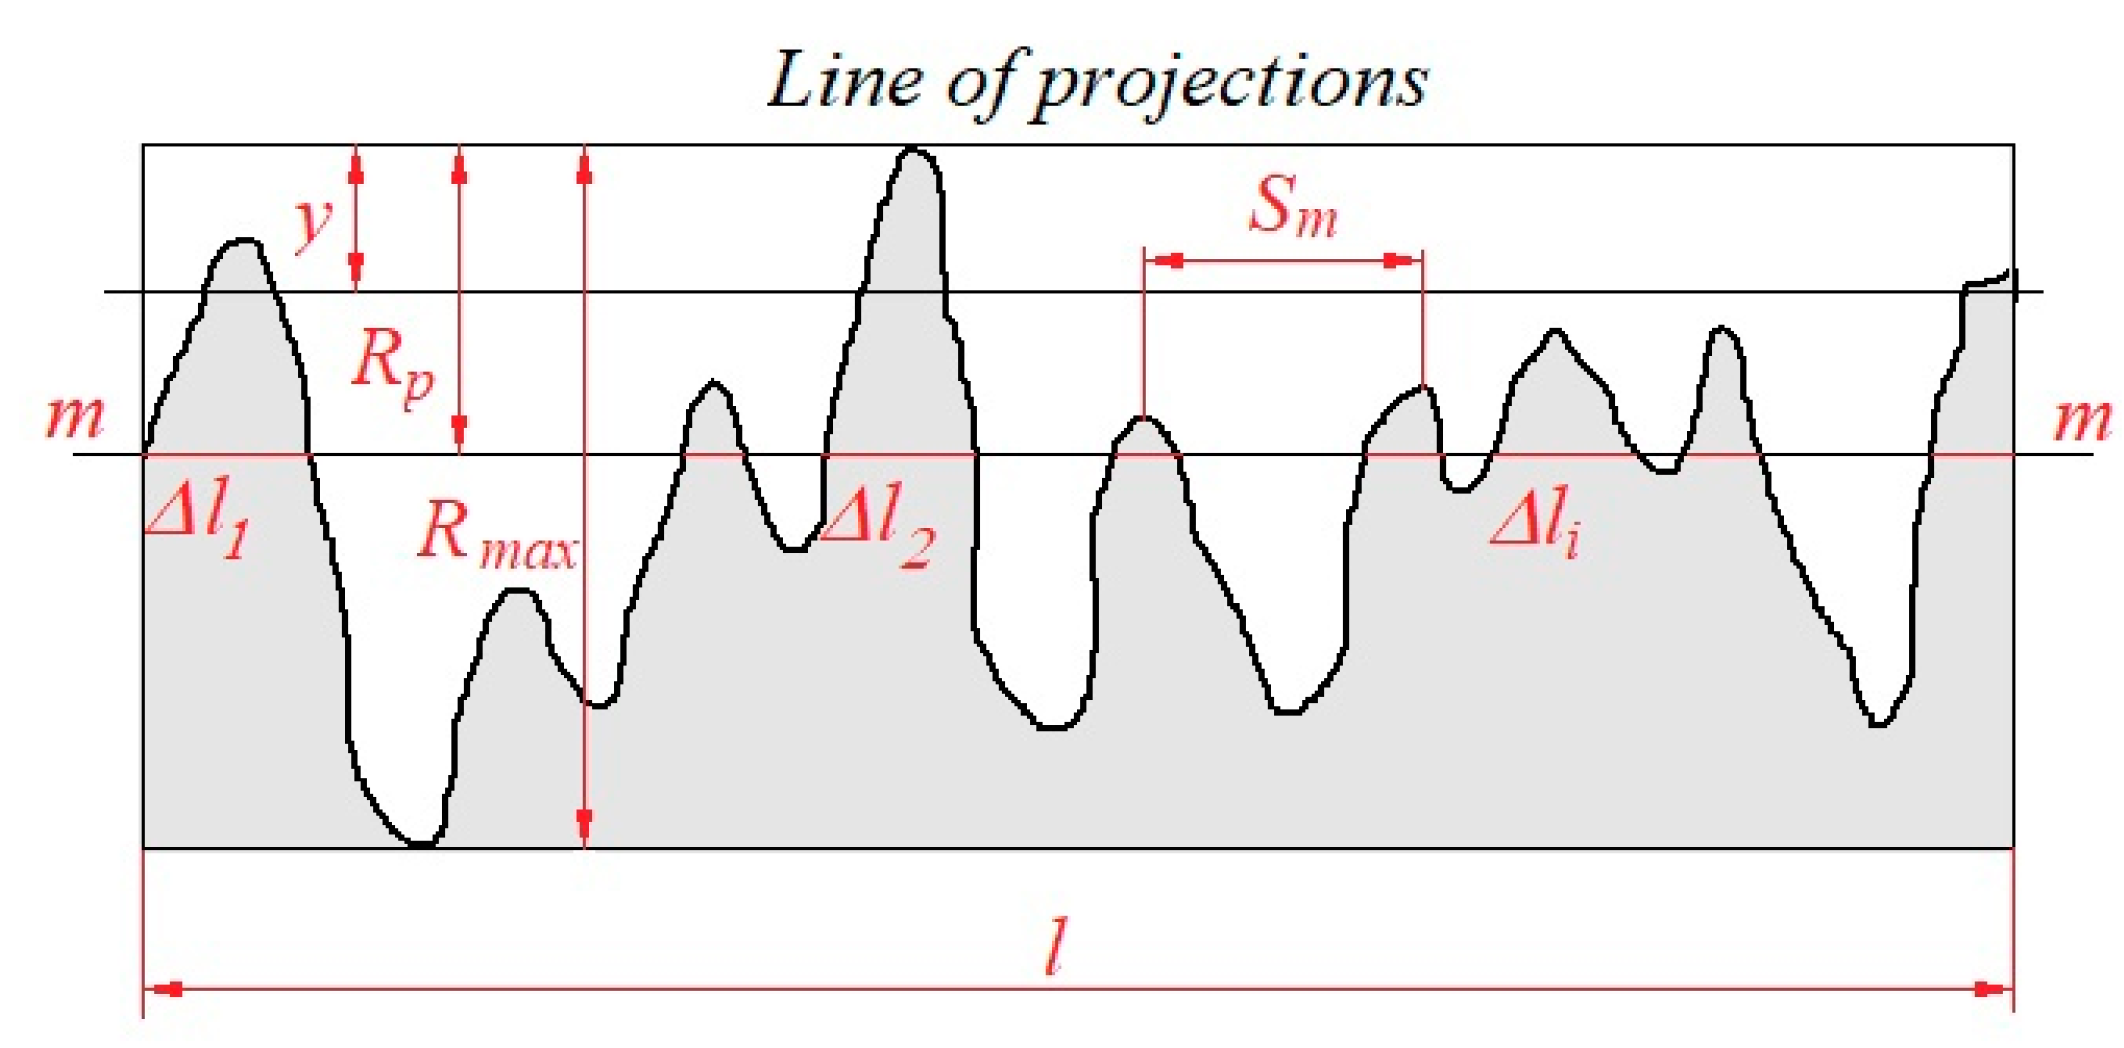
2.6. Contact Stiffness Calculation

The most important indicators characterizing the quality of parts (accuracy, reliability, and durability) largely depend on the operational properties of the mating surfaces of the parts and, in particular, on the contact stiffness.
Contact stiffness describes the ability of the surface layers of parts in contact to resist the action of forces tending to deform them. Contact stiffness, as well as other operational properties, is characterized by the state of the surface of the part, determined by the PENC technology.
To evaluate the contact stiffness j before and after PENC, both the specific load per nominal (geometric) area of contact between the sample and the counterbody in tribological tests Λ and the absolute approach h of the surfaces of the sample and the counterbody were calculated:
j = Λ h
Λ = N A a ,
where N is the value of the normal load during friction tests, and Aa is the nominal (geometric) area of contact between the sample and the counterbody.
The calculation is performed in relation to the contact of a rough surface (Figure 7) with a smooth solid one [16].
The absolute approach of surfaces h affects greatly the stress–strain state of the contact, the interaction nature, and the deformation of the roughness ridges. Since the asperities are of different heights, experimental curves of a calibration surface were approximated by power functions to find the distribution of the material over the height [17]:
η = l m y R p v = b y R max v = b ε max v ,
where y is the level of the profile section, measured from the line of asperities; Rmax is the maximum height of asperities; ε = y/Rmax is the relative profile height.
For better fitting of the model curve of the reference surface, the parameters ν and b were determined experimentally based on the friction track profile report. For each friction track of each specimen, 30 surface profilograms were built to derive ν and b following Equations (4) and (5):
v = 2 l m R p R a 1 ,
b = l m R max R p v ,
where Ra is the arithmetic mean profile deviation; Rp is the smoothing height or the distance from the ledge line to the center line within the base length; and lm is the relative reference length of the profile at the level of the center line:
l m = 1 n Δ l i l
where l is the reference length, and Δli are the lengths of the segments cut off by the middle line (Figure 7) of the profile.
Due to the discrete nature of the contact, the contact of the asperities of roughness occurs only on local areas, which, in total, form the actual contact area. The reference length of the profile characterizes the actual contact area. Therefore, the change in the actual contact area is traced using the curve of the supporting surface [18].
η = A r A c = P c P r ,
where Ar is the actual contact area; Ac is the contour area of the contact; Pr is the average actual pressure on the friction contact; and Pc is the contour pressure. The contour area is determined by the waviness of the surface.
To calculate the actual pressure Pr at the tops of asperities, the type of contact is determined: elastic or plastic [19]. The most widely used is the Williamson–Greenwood criterion, or the plasticity criterion (8):
K p = Θ H B R p r ,
where HB is the Brinell hardness, and Θ is the reduced modulus of elasticity:
Θ = 1 μ 1 2 E 1 + 1 μ 2 2 E 2 ,
where μi and Ei are Poisson’s ratio and the elastic modulus of interacting bodies, and r is the micro-roughness radius determined by modeling asperities using bodies of double curvature:
r = 9 R a 2 S m 2 128 5.5 R a R p 3 ,
where Sm is the average step of asperities (Figure 7).
If the values of the criterion Kp are >1, then plastic contact is realized between the body and the counterbody, regardless of the load [20,21,22,23,24,25]. In our case, the values of the Williamson–Greenwood criterion (8) for all samples after PENC and the raw reference are >1 (Table 1). Thus, the contact is considered plastic and the stress on the contact is taken equal to the hardness, i.e., Pr ≈ HB. The surfaces of the samples and the counterbody had no waviness, and the contour pressure was determined by the applied load N.
Equating the equation approximating the reference curve in the form (3) to the ratio of the contour and actual pressures (7) at the level y = h, the following expression for the absolute convergence of the contacting surfaces is obtained:
h = R max N b H B 1 v .
Substituting the expressions for the absolute approach (11) and the specific load (2) into (1) allows one to obtain an estimate of the contact stiffness in the form (12):
j = N A a R max b H B N 1 v .
The values of topographic characteristics, obtained experimentally after processing the surface profilograms, make it possible to determine another important parameter characterizing the type of stress state of a tribological contact. Expressions (10) and (11) allow one to calculate the relative penetration of the roughness of the compressed surfaces:
h r = 128 R max 5.5 R a R p 3 9 R a 2 S m 2 N b H B 1 v .
Relative penetration makes it possible to determine the mechanism of destruction of friction surfaces or the type of violation of the frictional connection [21,26,27]. If h/r < 0.01, the friction surfaces are destroyed as a result of elastic displacement. The fracture has a fatigued character with a large number of cycles before failure. At h/r < 0.1, plastic displacement of the material occurs in tribological contact with residual deformation of the surface. h/r > 0.1 is typical for micro cutting and microchip formation.
For a comprehensive assessment of the quality of the sample surface after PENC, the Kragelsky–Kombalov parameter is used [16]:
Δ = R max r b 1 v .
Of all the surface roughness characteristics, the average value of the Ra profile is the most common. However, the step characteristics of profiles can differ significantly for the same average value of the Ra. The radii of curvature of the tops of the asperities may appear sharp or blunt. The smoothing height and the maximum height of the roughness profile can differ significantly for the same Ra values of the profile. Profiles with the same average roughness but different height and other characteristics will affect the friction and wear of the surfaces differently. Therefore, it is important to give a complex parameter of roughness, the physical essence of which is explained from the standpoint of the bearing capacity. The smaller the value of Δ, the higher the bearing capacity of the rough surface in tribological contact.

3. Results

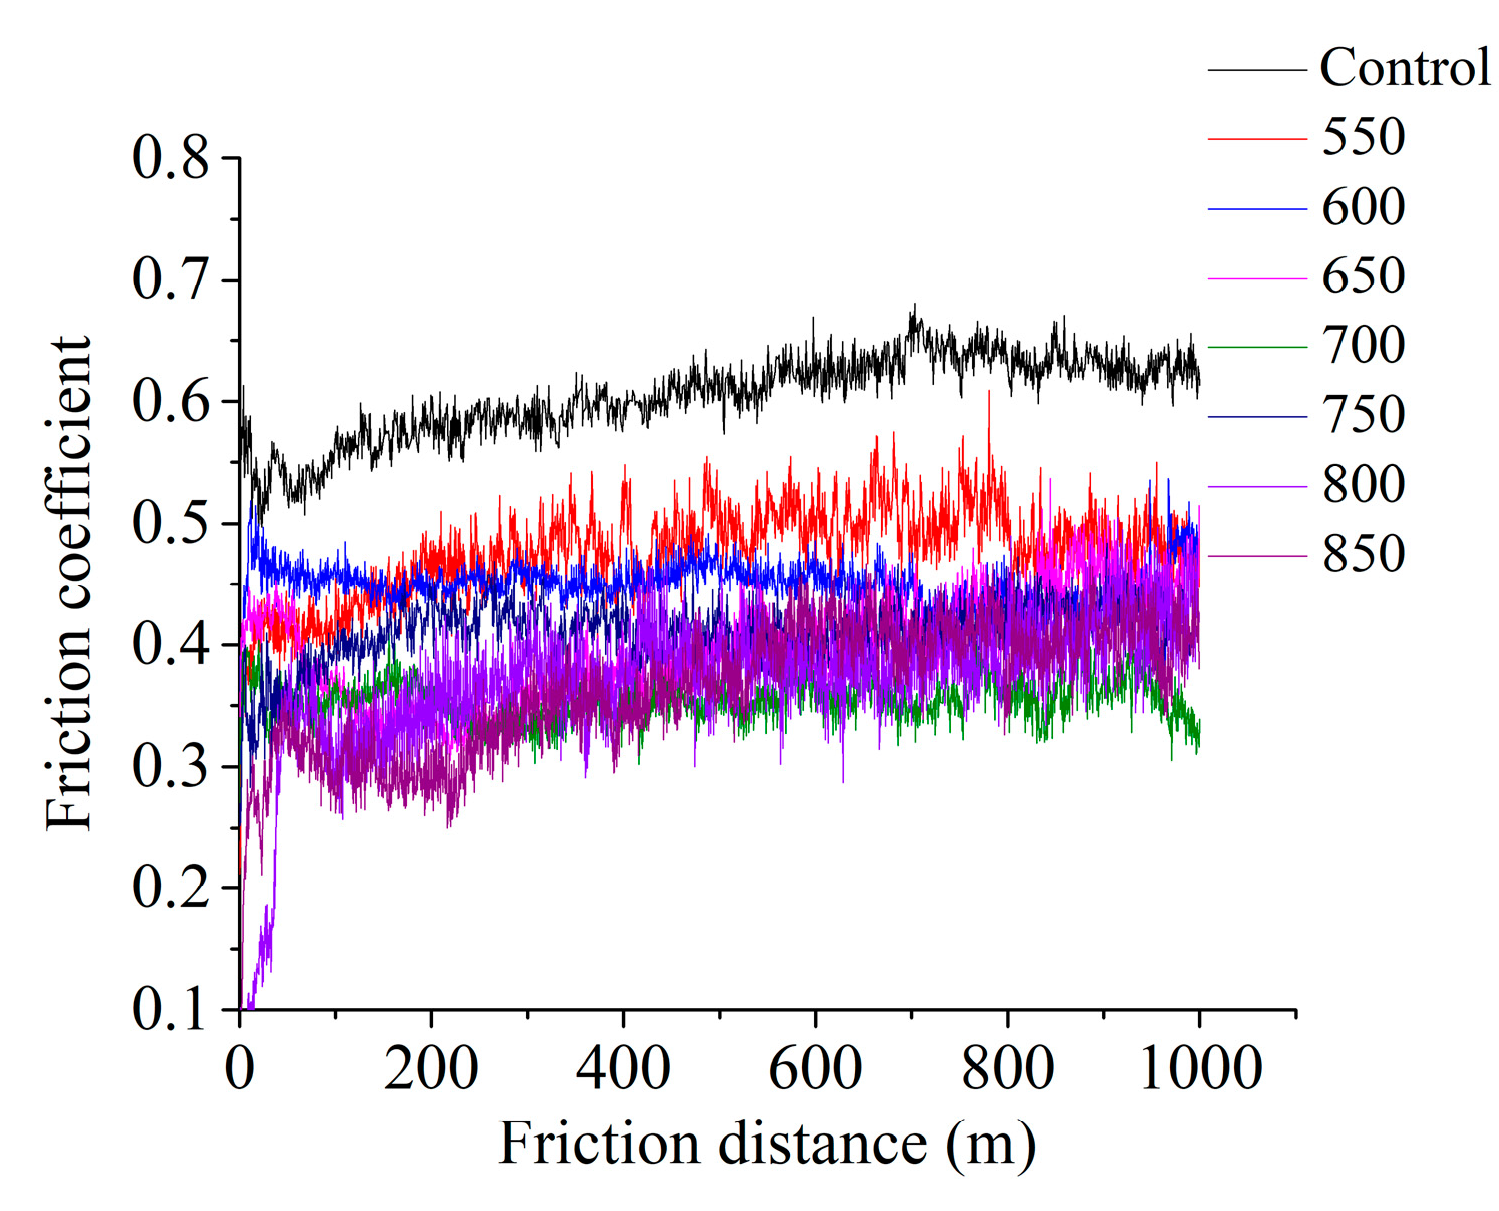
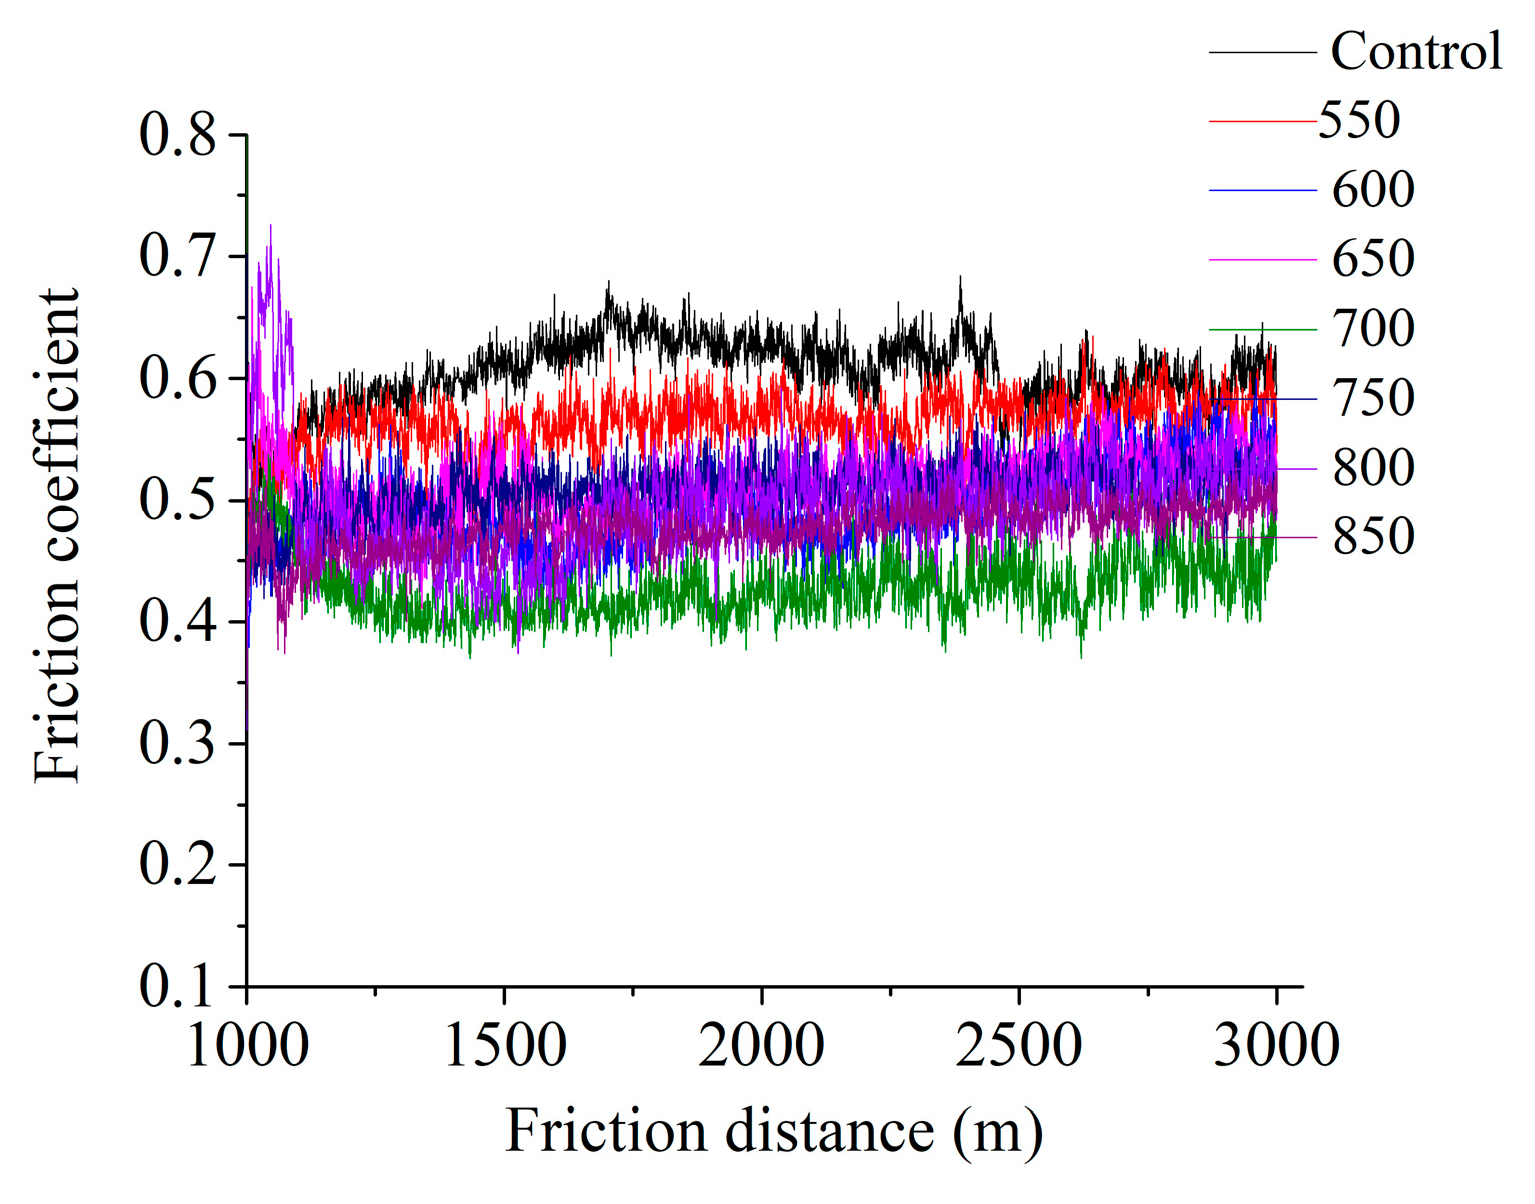
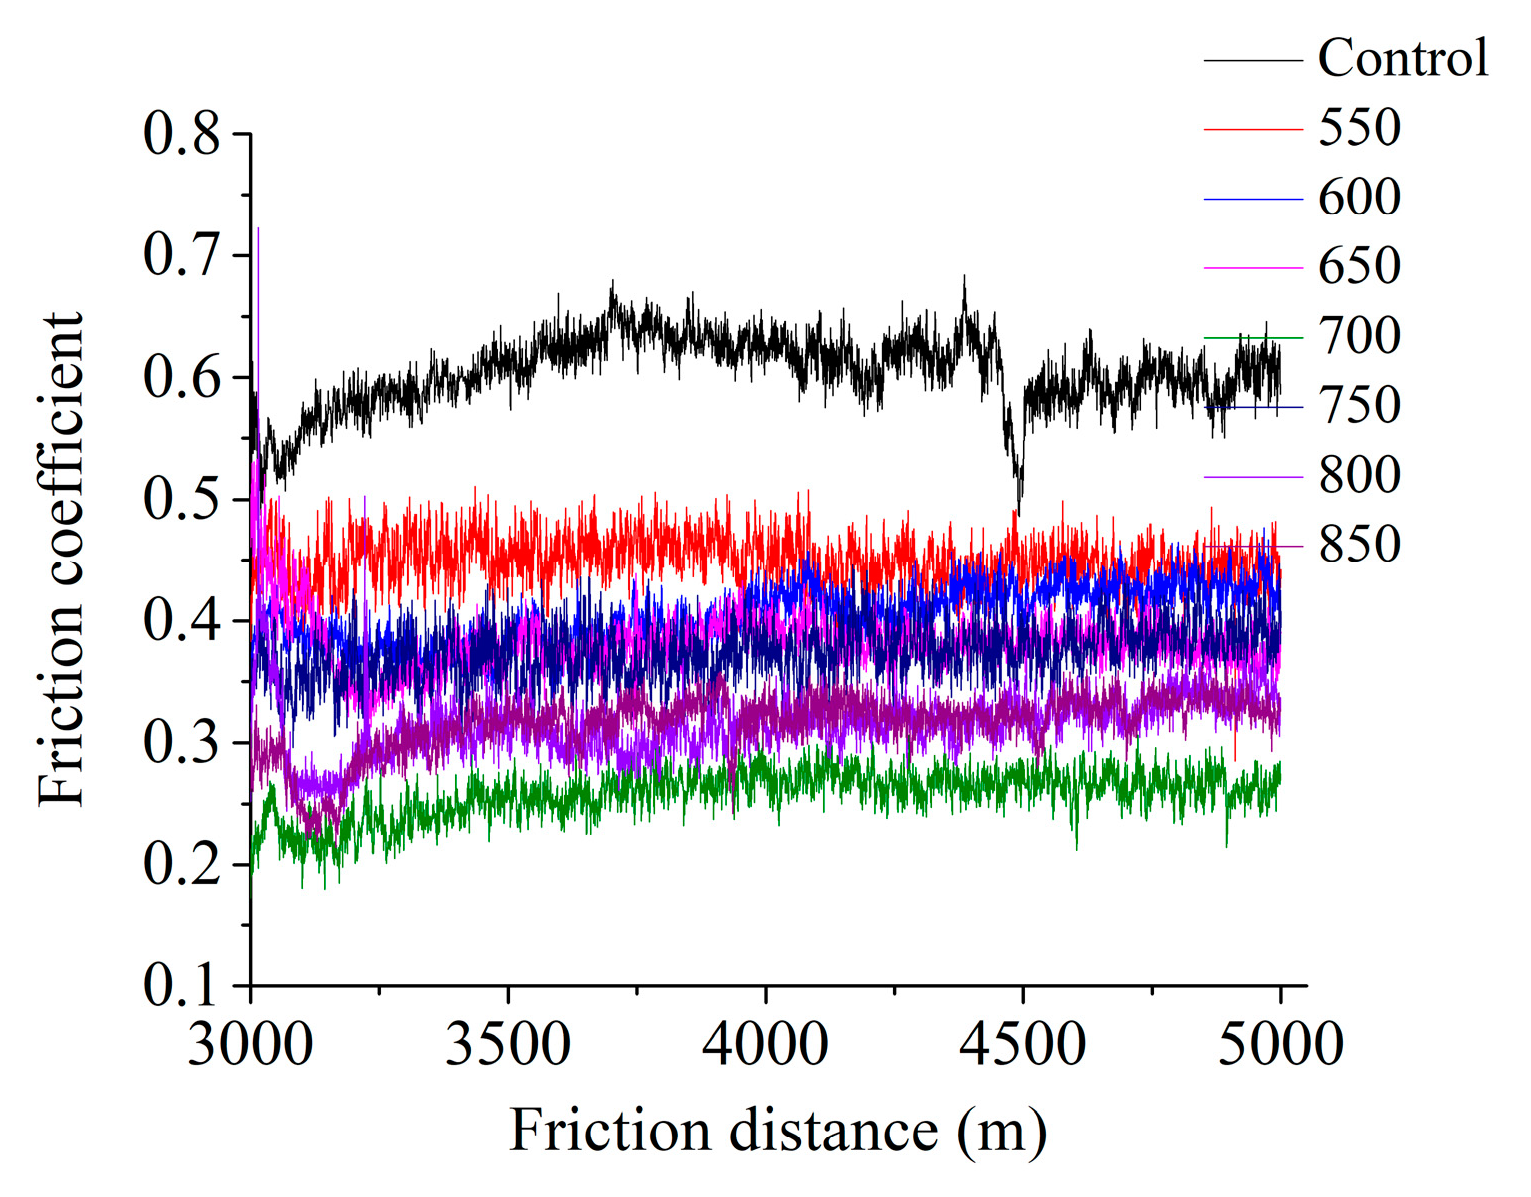
3.1. Friction Coefficient

Figure 8 shows the dependence of the friction coefficient on the friction distance during the first kilometer of testing for samples after PENC at temperatures from 550 to 850 °C. It can be seen that the friction coefficient of an untreated (reference) sample of steel working against bronze is higher than that of samples after PENC at any temperature. The further constant increase in the friction coefficient on the second and third kilometer of testing is observed in Figure 9. The PENC 550 °C curve closely fits and locally overlaps with a similar curve of the reference sample. At the fourth and the fifth friction kilometers, the friction coefficient of the samples after PENC decreased at all processing temperatures (Figure 10). It should be noted that the values of the friction coefficients at the fourth and fifth kilometers are the lowest for the entire time of testing (Figure 8, Figure 9 and Figure 10).
Figure 11 shows the average friction coefficients for the last 100 m of distance after 1, 3, and 5 km of friction for various PENC temperatures. For the first kilometer, an increase in the temperature of the PENC from 550 to 700 °C leads to a decrease in the friction coefficient from 0.48 to 0.36, while the friction coefficient of the reference sample was 0.61. At that stage, the 700 °C PENC sample demonstrated the lowest friction coefficient, 0.36, which is 1.7 times less than that of the reference sample. Increasing the PENC temperature to 750 °C leads to an increase in the friction coefficient to 0.42. A further increase in the PENC temperature to 850 °C reduces the friction coefficient to a value of 0.40. After completion of the first kilometer, the lowest friction coefficient was documented for the 700 °C PENC sample. It should be noted that PENC samples processed at temperatures from 750 to 850 °C showed a lower friction coefficient than that obtained at temperatures from 550 to 650 °C.
At the end of the third kilometer of the test (Figure 11), the average values of the friction coefficient increase in comparison with the first kilometer of the friction distance, but they are still lower than that of the reference sample. The correlation between friction coefficient and PENC temperature remains. The minimum value of the friction coefficient of 0.44 is recorded for the 700 °C PENC sample. Compared to the first kilometer, this value is 1.4 less. Higher values of the friction coefficient from 0.52 to 0.49 correspond to temperatures from 750 to 850 °C. Thus, as the temperature of PENC processing raises, the friction coefficient decreases. As for the first kilometer of friction, PENC samples processed at temperatures from 550 to 650 °C demonstrated the highest coefficient of friction, ranging from 0.58 to 0.54. Compared to the reference sample, these values are lower by 5% and 10%, respectively.
The lowest values of the friction coefficient are observed at the end of the fifth kilometer of the friction distance (Figure 10 and Figure 11). As for the first and the third kilometer, the lowest friction coefficient was registered for the 700 °C PENC sample, which is 2.3 times less than that of reference sample. On the contrary, the highest friction coefficients, from 0.44 to 0.38, correspond to the lowest PENC temperatures, from 550 to 650 °C. With an increase in the PENC temperature from 750 to 850 °C, the friction coefficient decreases from 0.38 to 0.33.
The correlation between the PENC temperature and the friction coefficient did not change after 5 km of sliding distance. Generally, the friction coefficient tends to decrease as the PENC temperature rises. The maximum value of the friction coefficient is observed at the lowest temperature of 550 °C. At the temperature of 650 °C, the friction coefficient decreases and reaches its lowest point within the whole sliding distance for the PENC sample processed at 700 °C. A further increase in temperature to 750 °C causes the friction coefficient to raise; however, it remained lower than for the samples obtained at 550–650 °C. Over 5 km of testing, the friction coefficients of the nitrocarburized samples at any temperature were lower than that of the reference sample.

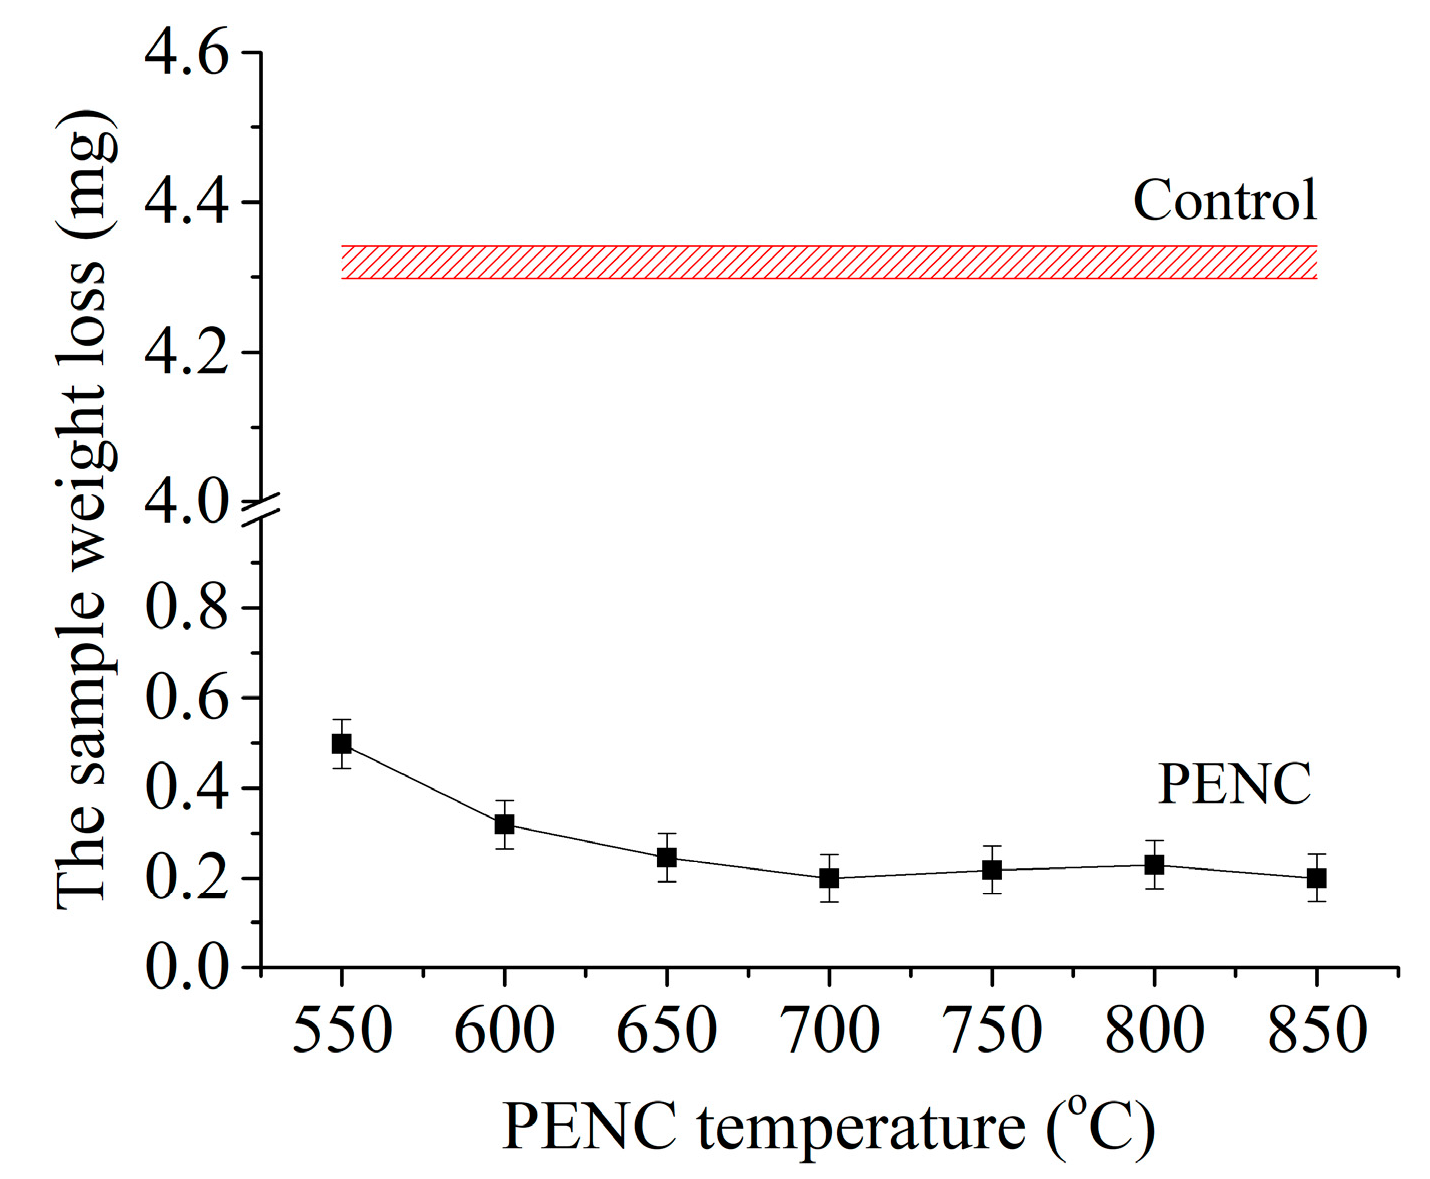
3.2. Wear Resistance

The coefficient of friction correlates closely with the weight loss results (Figure 12, Figure 13, Figure 14, Figure 15, Figure 16 and Figure 17).
After the first kilometer of testing (Figure 12 and Figure 13), the wear loss of the sample decreased with the increasing temperature of the PENC. The highest wear loss was registered for the 550 °C PENC sample, which was 8.7 less than that of the control sample. An increase in temperature to 700 °C reduces weight loss to 0.20 mg per 1 km, or 21.7 times compared to the reference sample. The 850 °C PENC samples demonstrated a slightly higher, but within the error, distinguishable mass loss from the minimum at 700 °C.
The wear loss of the bronze counterbody operated against the PENC samples was noticeably lower compared to reference sample (Figure 13). On the first kilometer of testing, the weight loss of the counterbody in a pair with the samples after PENC at temperatures in the range of 550–650 °C decreases by 3.0–3.2 times. Samples after treatment at higher temperatures from 700 to 850 °C lead to even lower weight loss of the counterbody when working in frictional contact. In comparison with the work of a control untreated sample paired with a bronze counterbody, the PENC of the sample in the temperature range of 700–850 °C reduces the weight loss of the counterbody by 3.9–4.3 times in the first kilometer of testing.
The weight loss on the second and third kilometers of the test, compared to the first stage, increases, which correlates with the maximum values of the friction coefficient in this section (Figure 14). The highest weight loss for both the sample and the counterbody was observed for PENC samples processed at temperatures from 550 to 650 °C. Wear intensity reached 1.03 mg per 2 km for the 550 °C PENC sample and 0.92 mg for the 650 °C PENC sample, which is 9-10 times less than that of the reference sample. The weight of the bronze counterbody decreases with the increasing temperature of PENC samples from 0.43 mg per 2 km at 550 °C to 0.37 mg at 650 °C, which is 3.5 and 4.0 times less, respectively, than that of friction against the untreated sample. For the second and third kilometers of the sliding distance, the lowest weight loss was registered for the friction pair with the 700 °C PENC sample and bronze counterbody. The weight loss of the sample at this temperature is 19.6 times less than that of the untreated sample, while the counterbody showed a 5.2 times improvement in wear resistance. Comparing Figure 9 and Figure 11, it may be concluded that the 700 °C PENC sample demonstrates both the lowest friction coefficient and wear loss during friction. Higher PENC temperatures from 750 to 850 °C correspond to a greater wear loss, which is still less than that of 550–650 °C. As the PENC temperature increases from 750 to 850 °C, the sample loses 13.2–14.5 times less weight per 2 km of the friction distance compared to the reference sample, while the bronze counterbody loses 4.9–5.1 times less weight. The lower wear of the 750–850 °C PENC samples in comparison with the 550–650 °C PENC samples is consistent with the friction coefficient values, which are lower at higher temperatures (Figure 9 and Figure 11).
In addition to the lowest values of coefficient of friction (Figure 10 and Figure 11), the fourth and the fifth kilometers of sliding distance demonstrate the lowest wear of the samples and the bronze counterbody (Figure 14 and Figure 15). The minimum wear of both parts was observed for the 700 °C PENC friction pair. Compared to the reference sample, wear of the 700 °C PENC sample was reduced by 24.9 times while wear of the counterbody decreased by 5.9 times (Figure 14 and Figure 15). The correlation between wear and PENC temperature was maintained throughout the entire test. The greatest wear was observed at low PENC temperatures, from 550 to 650 °C. Minimum wear was detected for the 700 °C PENC sample. Samples processed at higher temperatures showed higher wear, but it was still less than that of 550–650 °C samples. Particularly, wear was 19.6–22.1 less compared to the reference sample. The wear behavior of the counterbody follows the performance of the PENC samples it was coupled with. Thus, the highest wear of the counterbody was observed in friction with 550–650 °C PENC samples and was measured to be 4.8–5.2 less compared to the reference. The lowest wear was observed for the 700 °C PENC sample, which increased slightly for the 750–850 °C PENC samples, showing 5.4–5.6 times less wear compared to the reference pair.

3.3. Friction Track Analysis

Figure 18, Figure 19, Figure 20, Figure 21, Figure 22 and Figure 23 show the friction tracks of the PENC samples processed at 500, 700, and 850 °C. According to the calculations of the relative approach of friction surfaces (13) and the Williamson–Greenwood criterion (8), plastic deformations occurred in the friction contact zone during testing. Areas of plastic deformation in the form of grooves in the sliding direction without sharp boundaries are observed on the SEM images of the friction tracks. Therefore, wear during plastic contact in dry friction conditions took place. Wear is characterized by the successive formation and breaking off of microscopic sections of the material of the sample and the counterbody. Thus, the wear in the tests carried out should be defined as dry friction fatigue wear and plastic contact.
On the friction tracks of the 550 and 700 °C PENC samples, dark gray fragments of oxide films are visible. Elemental analysis reveals the presence of bronze adhering to the surface. It can be seen from Figure 17, Figure 19, and Figure 20 that, up to 700 °C processing temperature, there is no bronze transferred from the counterbody to the sample surface. For the 850 °C PENC sample, bronze occupies 39% of the observed SEM image area.

3.4. Surface Microgeometry Parameters

The results of calculating the parameters of the surface microgeometry and the contact stiffness of steel samples on bronze counterbodies are shown in Table 1.
At PENC temperatures from 700 to 850 °C, the radii of rounding of the tops of roughness asperities are smaller than at lower temperatures in the range of 550–650 °C. An increase in the radii of the tops of the asperities contributes to their shallower penetration into the volume of the deformable counterbody.
A higher bearing capacity, according to the calculations of the Kragelsky–Kombalov criterion, is also possessed by samples after PENC in a higher temperature range, from 700 to 850 °C.
PENC at all temperatures leads to an increase in contact stiffness by a factor of 1.6–2.6 compared to a reference friction pair.

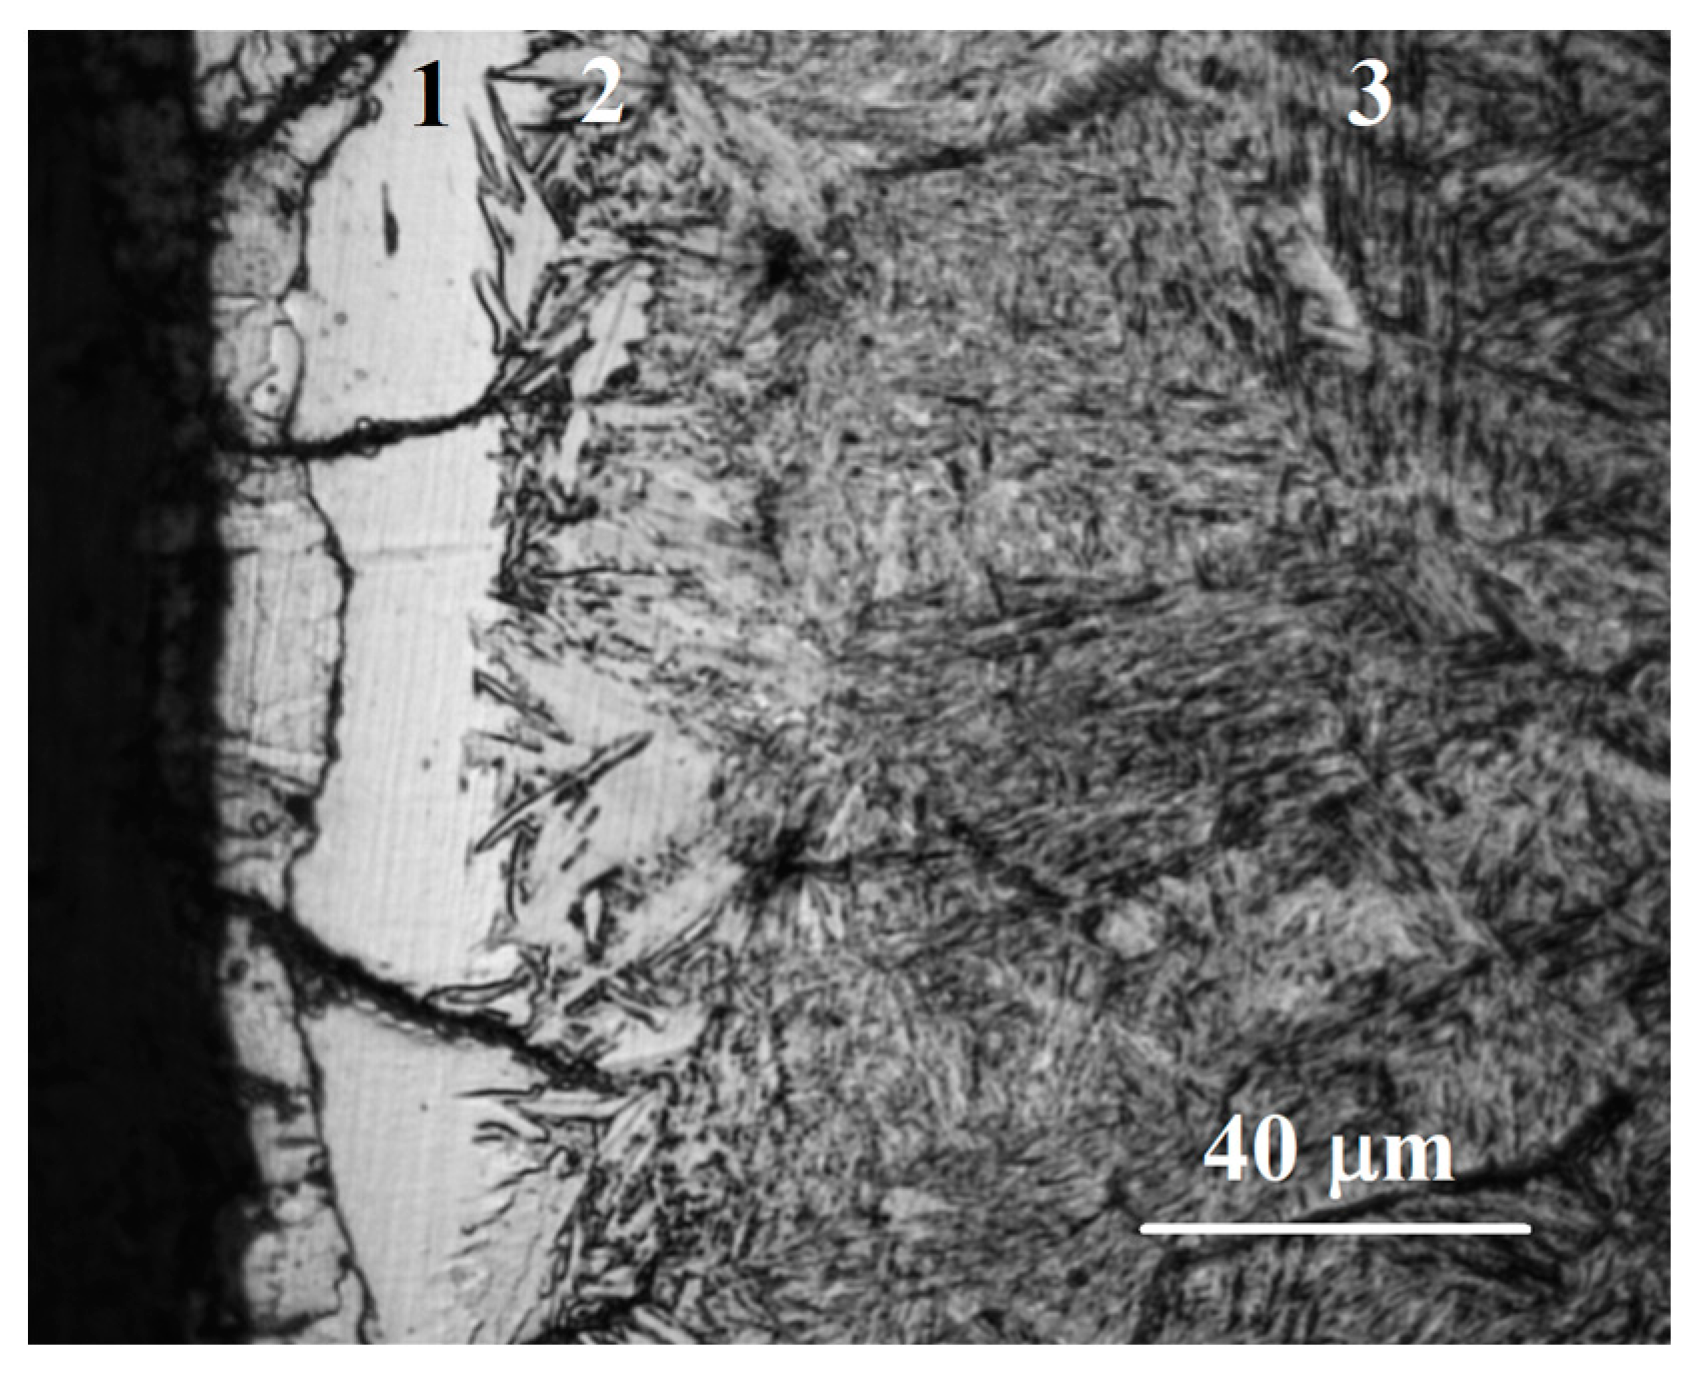
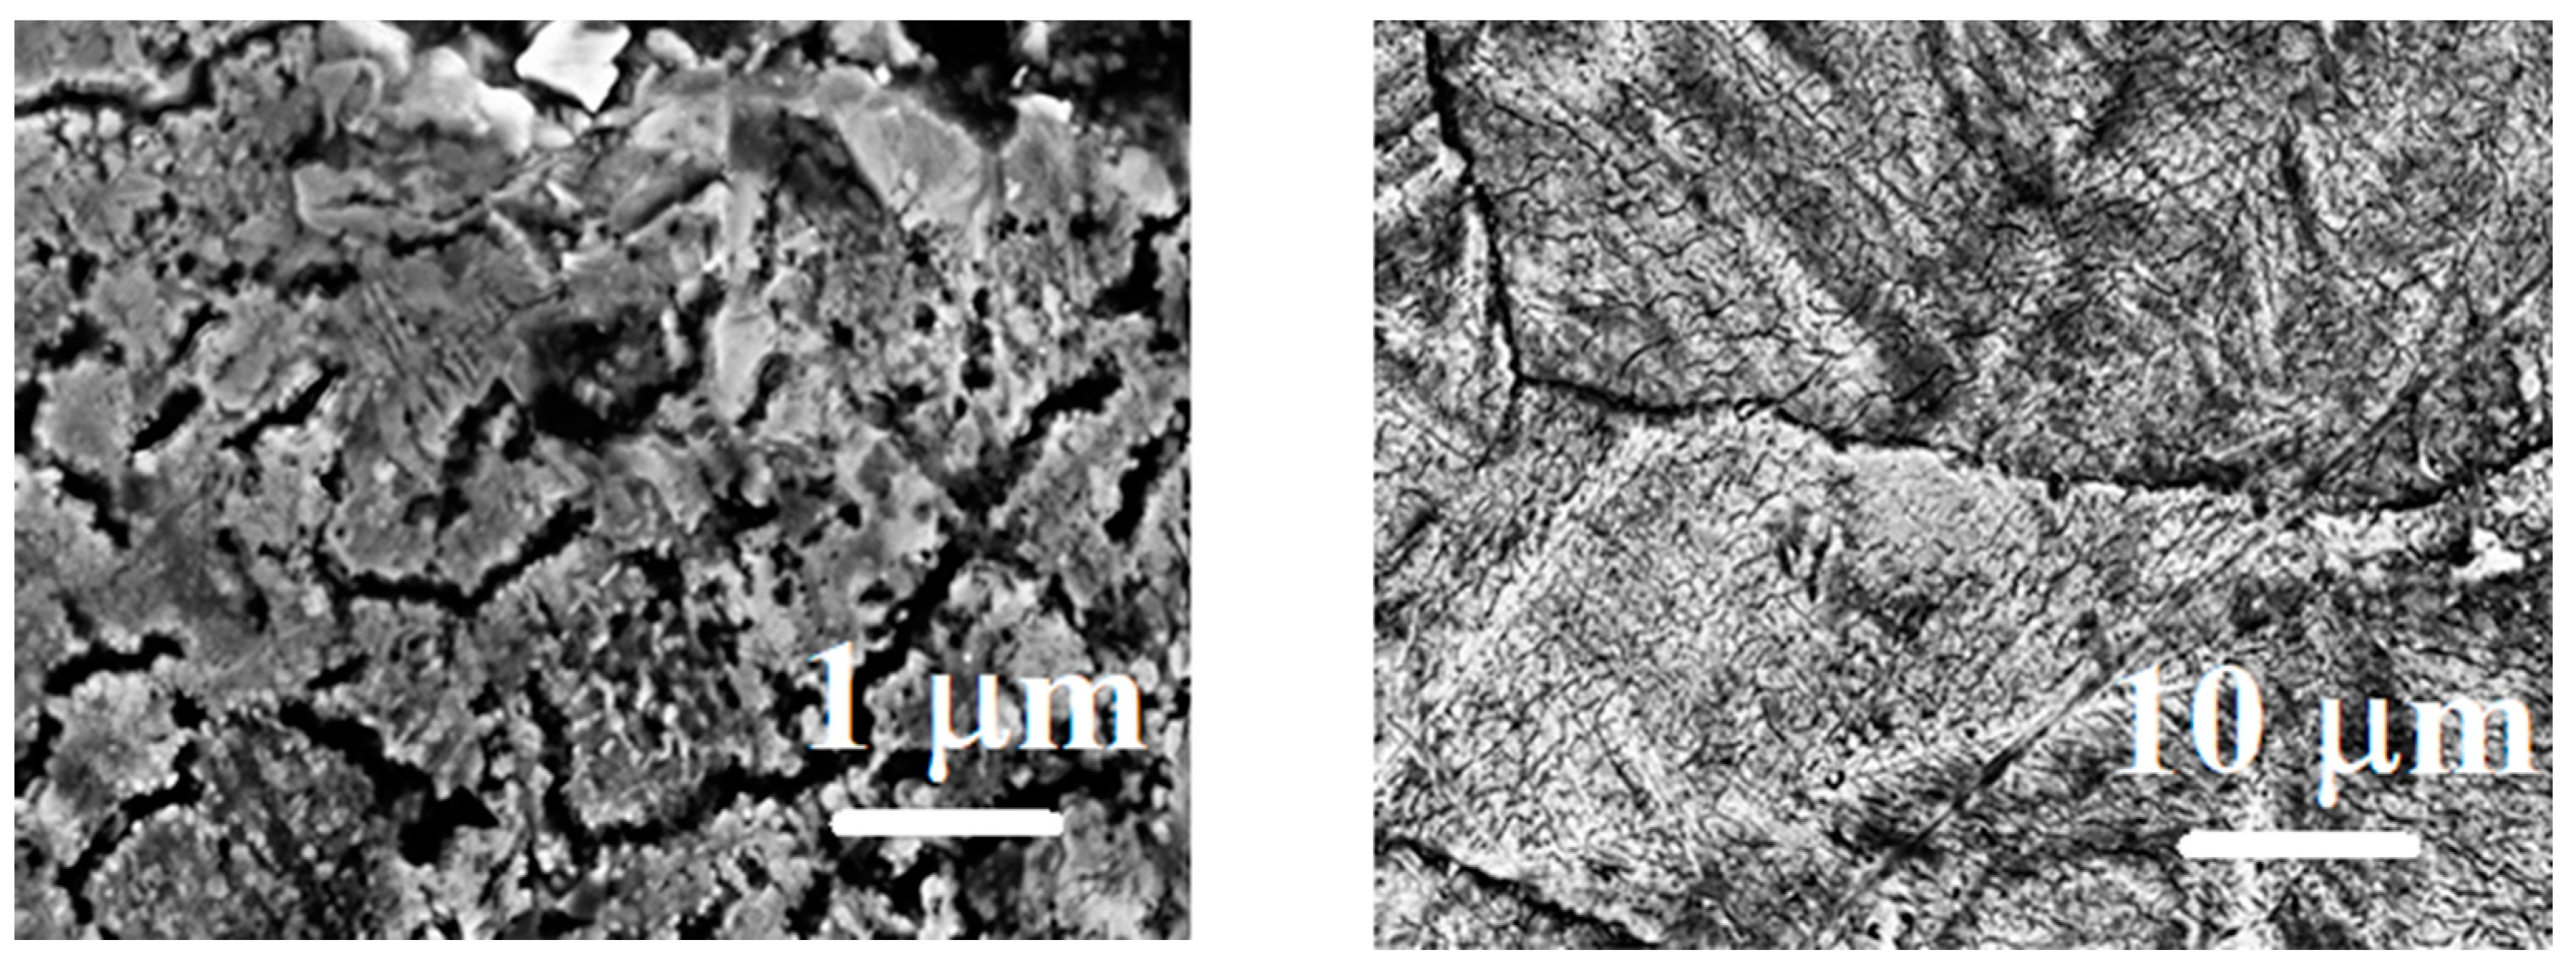
3.5. Structure and Microhardness of the Nitrocarburized Layer

The results of tribological tests correlate closely with microhardness measurements. The highest microhardness results were also measured for the 700–850 °C PENC samples (Figure 22). The maximum value of microhardness increases with an increase in the PENC temperature from 1380 HV at 700 °C to 1419 HV at 850 °C and was found 30–40 µm from the edge.
Low temperatures of PENC provide microhardness at the sample edge from 652 HV at 550 °C to 790 HV at 650 °C. The PENC temperature of 550 °C gives the maximum microhardness at the very edge of the sample with a smooth decrease to 551 HV at a distance of 300 µm from the surface. After PENC at temperatures of 600 °C and 650 °C, the maximum microhardness is shifted deep into the sample by 10 µm and 20 µm, respectively, demonstrating 826 HV and 903 HV hardness, which is 36% and 42% less than the maximum microhardness after PENC at 850 °C.
The distribution pattern of microhardness over the depth of the diffusion zone is explained by the structure of the surface layer of the PENC samples.
Figure 23, Figure 24 and Figure 25 show the cross sections of samples after PENC at temperatures of 550, 700, and 850 °C. The outer layer enriched with iron oxides may not be preserved when polishing samples for metallographic analysis (Figure 26). The oxide layer is formed as a result of the high-temperature oxidation of a steel sample in water vapor in a vapor–gas envelope. In the images, it appears as a thin black stripe at the very edge of the sample. The oxide layer is noticeable after PENC at temperatures of 550 °C and 850 °C and is almost invisible for the sample after treatment at 700 °C.
Figure 25 and Figure 26 reveal a thin light layer (layer 1) that is enriched with retained austenite. The 850 °C PENC sample additionally contains iron nitrides, while the 700 °C PENC sample contains iron nitrides and carbonitrides. Under this layer, there is a hardened zone containing finely acicular nitrogenous martensite with dispersed iron nitrides (layer 2 in Figure 23 and Figure 24). Further, solid solutions of carbon and nitrogen with a concentration higher than the initial one follow. On the cross-section of the sample after PENC at 550 °C, only the ferrite–pearlite structure is visible under the oxide layer.
In the surface regions (Figure 23 and Figure 24), the retained austenite has a predominant effect on the hardness of the structure. Since martensite is responsible for the hardness, its highest values are measured at 30–40 microns from the surface (Figure 22). It is important to note that nitrogen diffusion greatly lowers the iron austenitization temperature. A nitrogen content of 0.07% reduces the eutectoid temperature to 700 °C, and at 0.1% nitrogen, it drops to 590 °C [22]. For the 550 °C PENC sample, acicular martensite was not observed (Figure 25), explaining its relatively low hardness (Figure 22). The absence of retained austenite on the surface and the homogeneous structure provides a smooth decrease in hardness towards the core (Figure 22 and Figure 25).

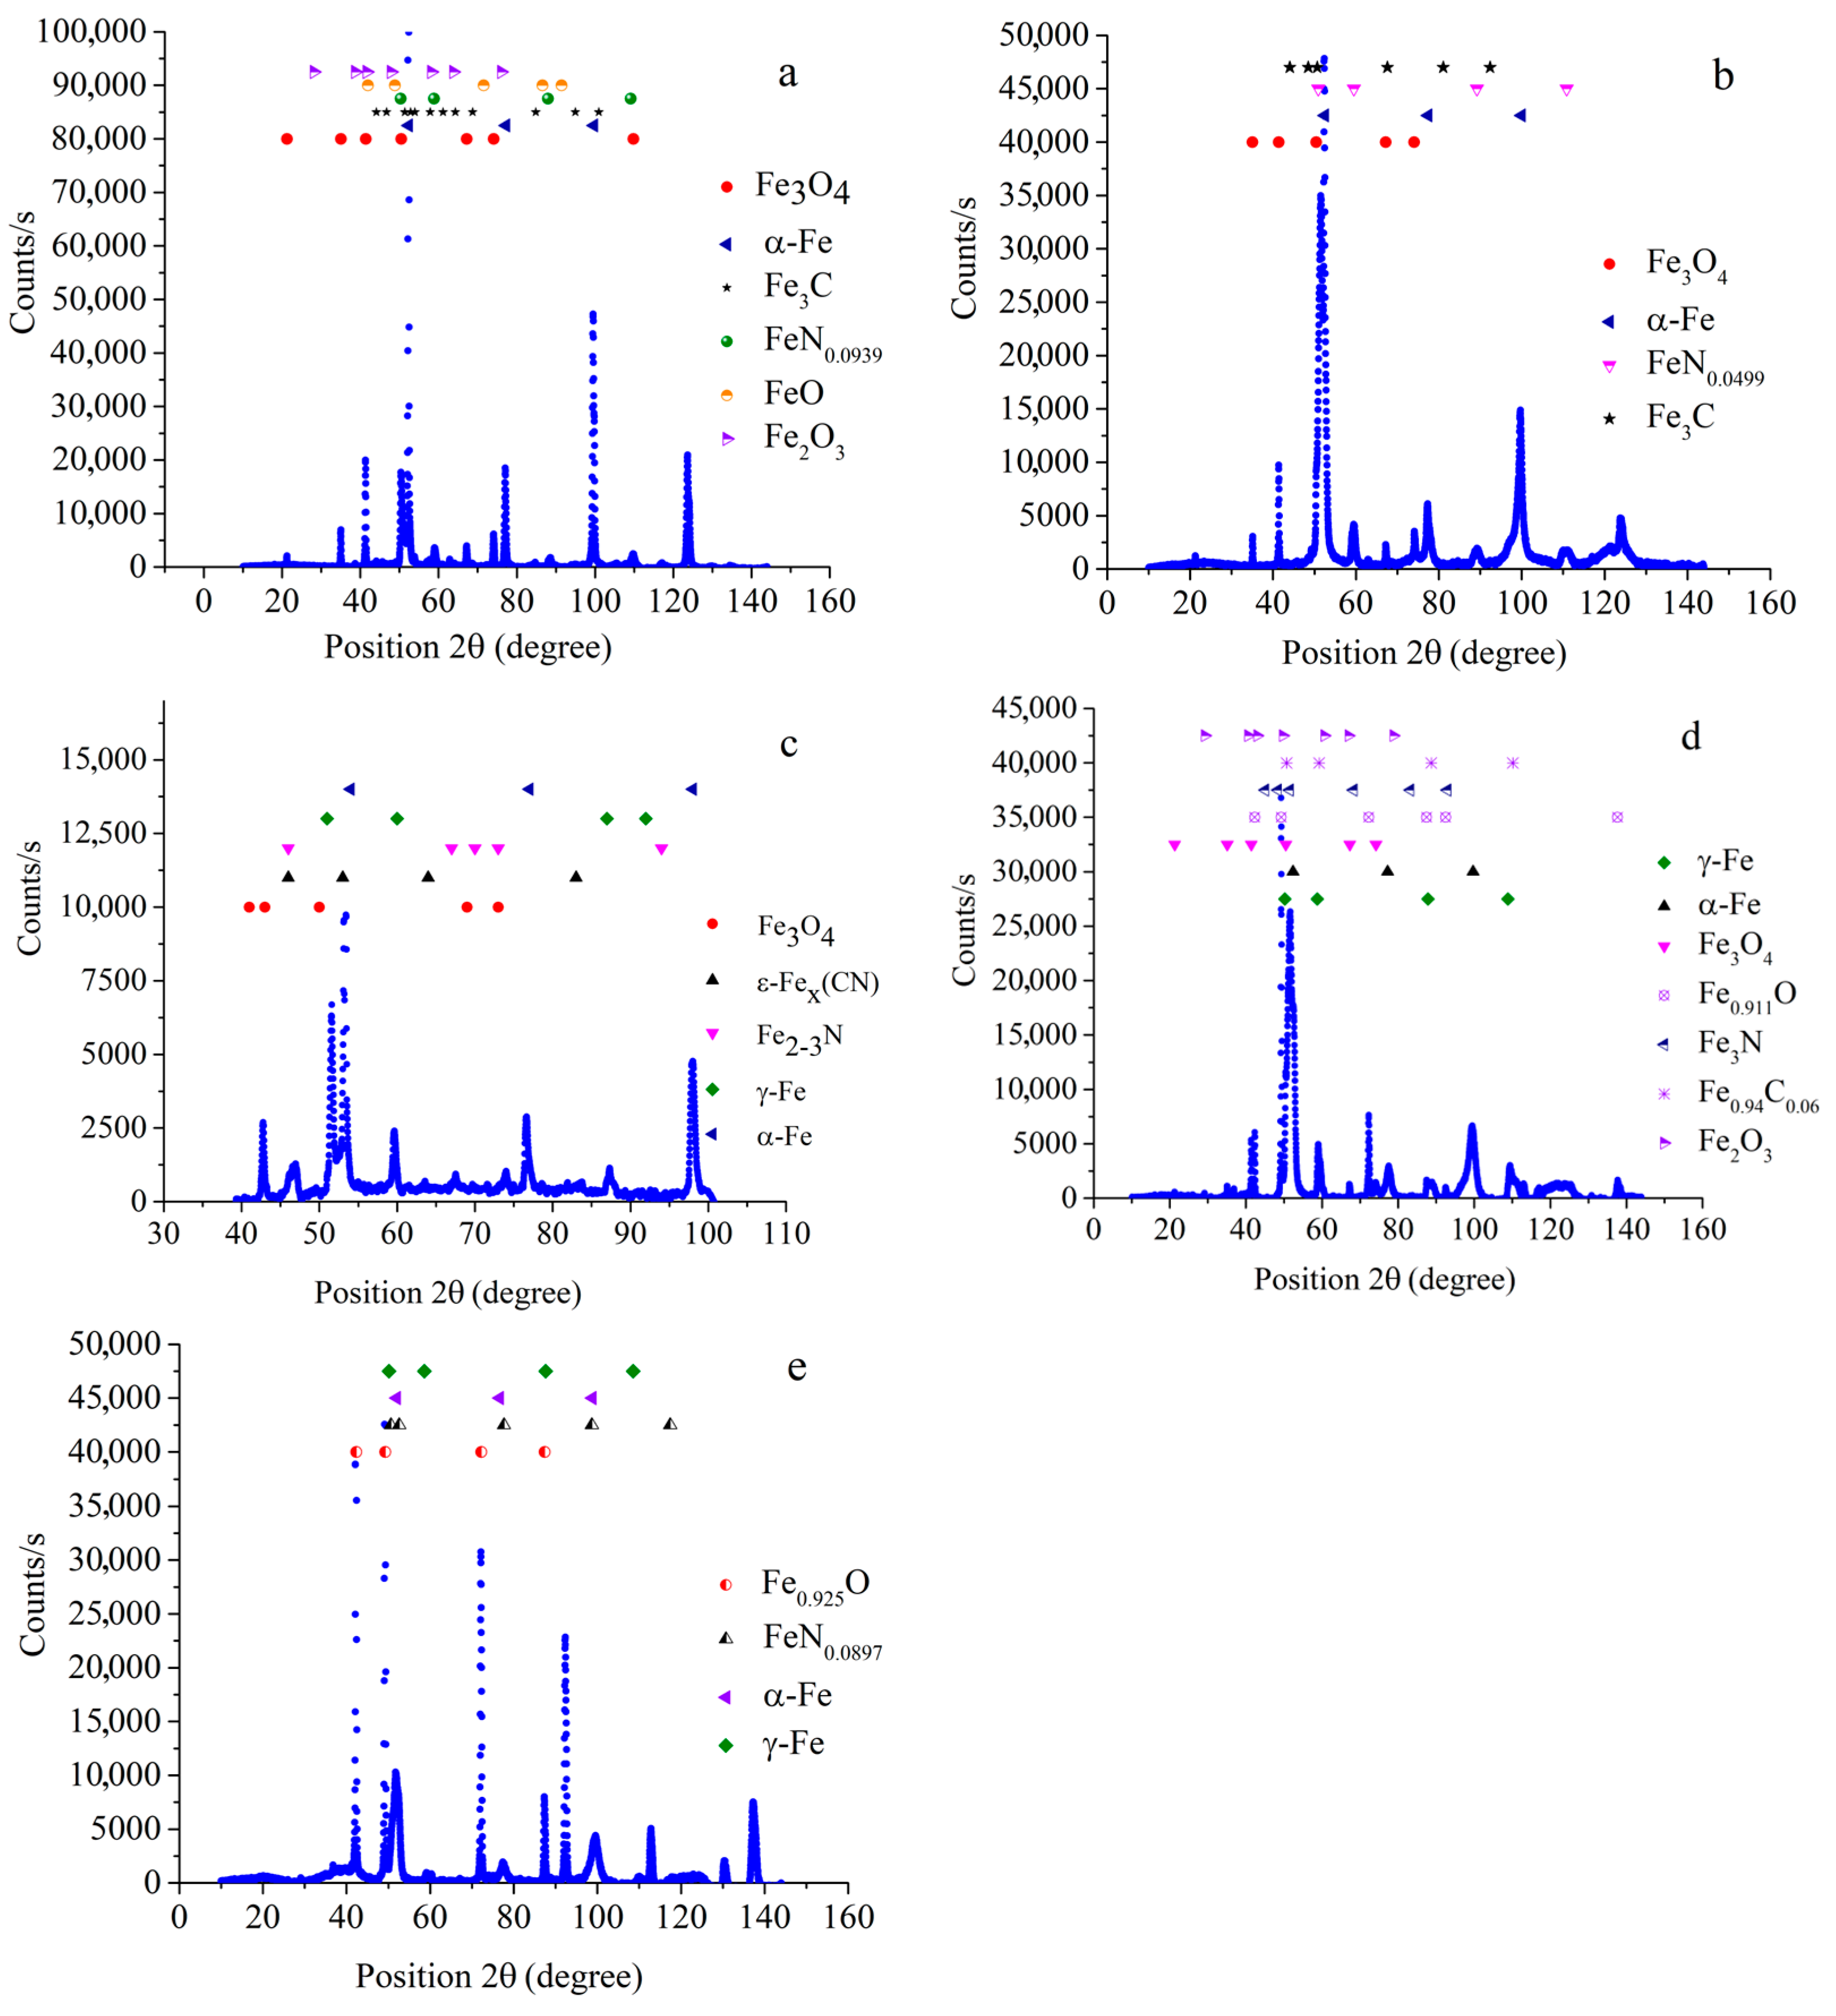
3.6. Phase Composition of the Nitrocarburized Surface

Based on the XRD analysis, the surface layer of samples after PENC contains mainly iron oxides Fe3O4, Fe2O3, and FeO (Figure 27a–e), which is typical for this kind of processing [3,7,10,11]. It has been shown that, with an increase in the PENC temperature, the relative amount of oxide Fe3O4 decreases, while FeO increases. Iron nitrides were common for all the samples. After PENC at 700 °C, a significant amount of iron carbonitrides of the ε–Fex[NC] type is observed in the structure of the samples.

4. Discussion

The structure and phase composition after PENC explain the changes in wear resistance and friction coefficient with an increase in the friction distance traveled. On the first kilometer of the tribological tests, friction is carried out on the outer layer of oxides. Oxides on the surface during friction act as a lubricant, so the friction coefficient and wear for the PENC samples are reduced. At the second and third kilometers of testing, friction occurs along a layer enriched with residual austenite, which negatively affects the wear resistance of the nitrocarburized layer. Therefore, on the second and the third kilometer of sliding distance, the friction coefficient grows along with the wear compared to the first kilometer. The best results were achieved by the end of the fifth kilometer of testing. In the last section of the test, friction occurs along a hardened zone containing finely acicular nitrogenous martensite with dispersed iron nitrides. The hardened zone for samples after PENC at temperatures from 700 to 850 °C is characterized by the maximum values of microhardness achieved in the experiment. Combined with dispersed iron nitrides and carbonitrides, it provides the lowest friction coefficient and wear for both the PENC sample and the counterbody.
Within the tribological tests, the best results were demonstrated by the 700 °C PENC sample, which is explained by the presence of carbonitrides in addition to iron nitrides. It contributes to the antifriction properties of the modified layer. Moreover, PENC at 700 °C makes it possible to obtain a high microhardness of the surface for effective abrasion resistance. On the other hand, the microhardness is lower than that of the samples after PENC at temperatures in the range of 750–850 °C, and it does not lead to smearing of copper from the counterbody onto the surface of the sample, as, for example, in Figure 23. Thus, high microhardness and iron nitrides and carbonitrides distributed over the modified layer without copper transfer in the friction contact positively affect the tribological properties of the 700 °C PENC sample–bronze friction pair.

5. Conclusions

(a)
It is shown that PENC of medium carbon steel in a carbamide-based electrolyte solution at temperatures from 550 to 850 °C reduces the friction coefficient and wear of the rubbing parts while working with bronze. PENC of the steel surface increases the contact stiffness and wear resistance of the steel–bronze friction pair.
(b)
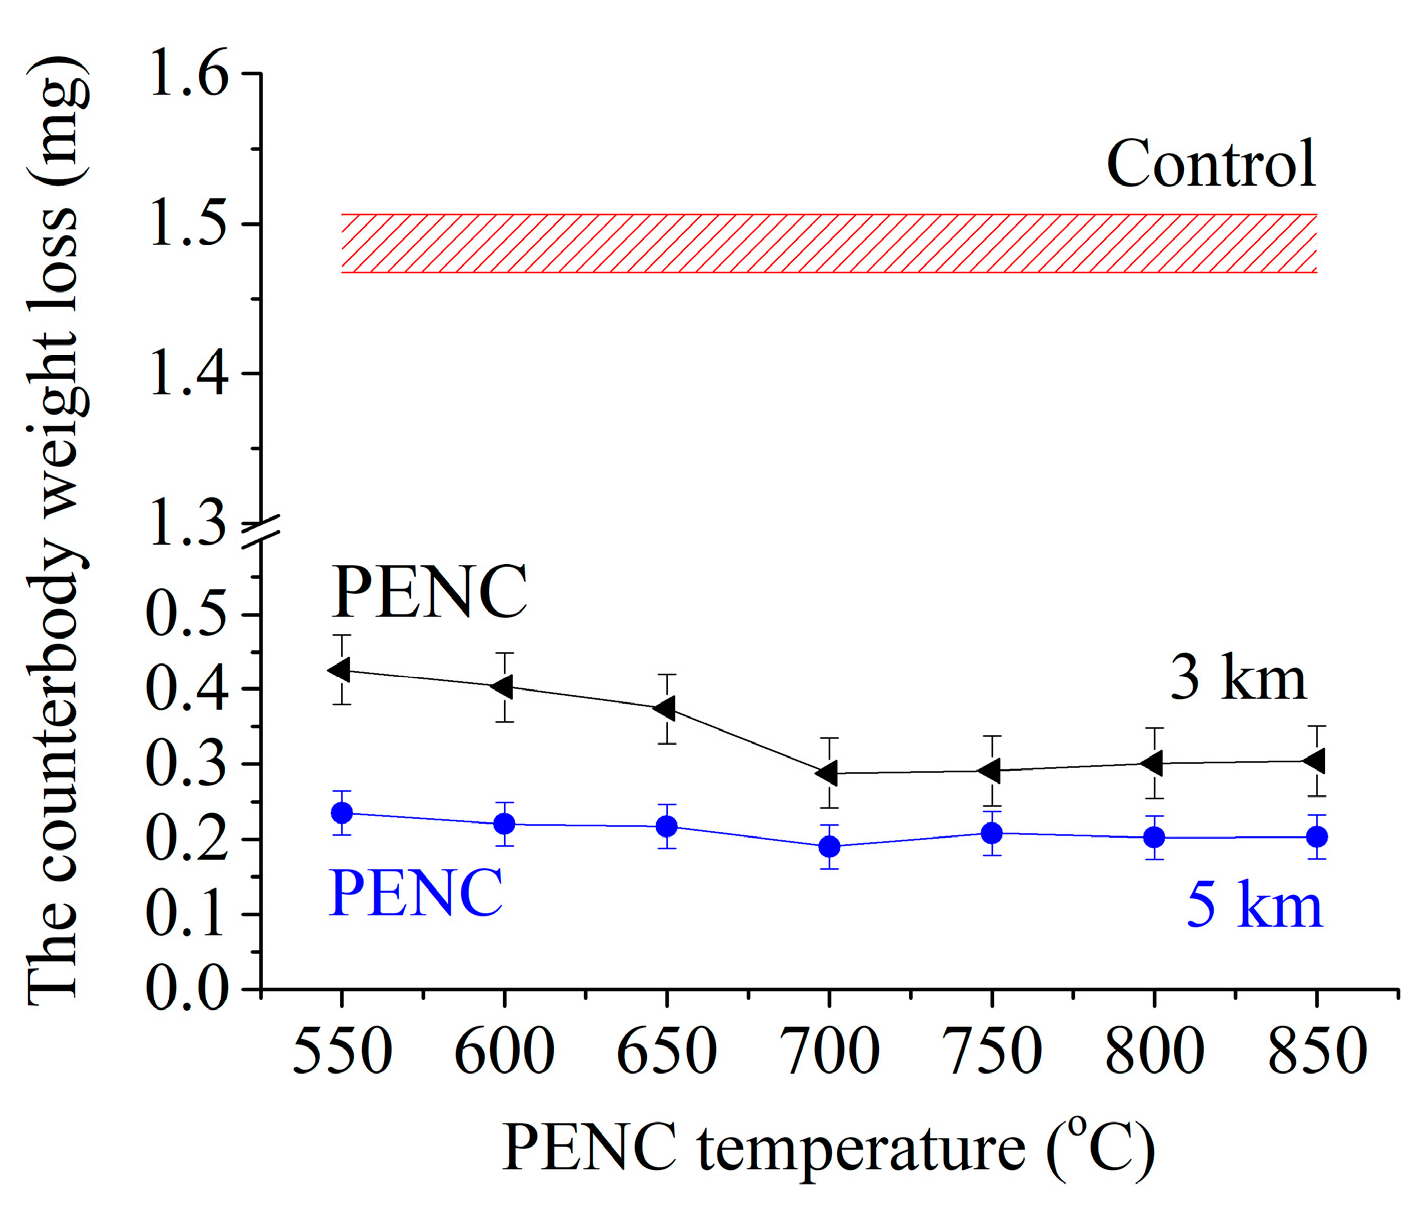
The coefficient of friction and wear of the sample and the counterbody decrease as the sliding distance increases. The minimum values of the coefficient of friction and wear were registered at the end of the fifth kilometer of friction distance.
(c)
The change in the tribological characteristics of the friction pair with increasing sliding distance is explained by the structure and phase composition of gradually abraded layers. The high hardness of the hardened zone, combined with the influence of dispersed iron nitrides and carbonitrides distributed in it, ensures a minimum coefficient of friction and wear of both of the rubbing parts at the fourth and fifth kilometers of the test.
(d)
Within the tribological tests, the type of wear was found to be fatigue in dry friction conditions with plastic contact.
(e)
The optimal PENC mode providing the lowest values of both the coefficient of friction and weight loss of the rubbing parts was established. The 700 °C PENC sample demonstrated a final coefficient of friction of 0.261, which is 2.3 less than that of an untreated reference sample, while wear was 24.9 times less. Over the last 2 km of the test, the counterbody lost 5.9 times less weight in comparison with the reference pair. The contact stiffness after PENC at 700 °C was 2.6 times greater than in a friction pair with an untreated sample. The high tribological properties of the 700 °C PENC sample are explained by the high microhardness of the surface without copper transfer in the friction contact zone and by the iron nitrides and carbonitrides distributed over the modified layer.
(f)
The optimum value has been established, which provides the minimum values of both the friction coefficient and weight loss of the sample and the counterbody at any test kilometer.

Author Contributions

Conceptualization, A.B. and T.M.; methodology, T.M., S.K., I.S. and Y.M.; validation, A.B., I.S., P.P. and S.G.; formal analysis, S.G.; investigation, T.M. and Y.M.; resources, S.G.; writing—original draft, T.M. and S.K.; writing—review and editing, A.B., I.S. and P.P.; visualization, T.M.; supervision, A.B.; project administration, I.S. and P.P.; funding acquisition, S.G. All authors have read and agreed to the published version of the manuscript.

Funding

This work was funded by the state assignment of the Ministry of Science and Higher Education of the Russian Federation, Project No. FSFS-2023-0003. This study was carried out on the equipment of the Center of Collective Use of MSUT “STANKIN”, supported by the Ministry of Higher Education of the Russian Federation.

Institutional Review Board Statement

Not applicable.

Informed Consent Statement

Not applicable.

Data Availability Statement

Not applicable.

Conflicts of Interest

The authors declare no conflict of interest.

References

  1. Shugurov, A.R.; Kuzminov, E.D. Mechanical and tribological properties of Ti-Al-Ta-N/TiAl and Ti-Al-Ta-N/Ta multilayer coatings deposited by DC magnetron sputtering. Surf. Coat. Technol. 2022, 441, 128582. [Google Scholar] [CrossRef]
  2. Mora-Sanchez, H.; Pixner, F.; Buzolin, R.; Mohedano, M.; Arrabal, R.; Warchomicka, F.; Matykina, E. Combination of Electron Beam Surface Structuring and Plasma Electrolytic Oxidation for Advanced Surface Modification of Ti6Al4V Alloy. Coatings 2022, 12, 1573. [Google Scholar] [CrossRef]
  3. Aliofkhazraei, M.; Macdonald, D.D.; Matykina, E.; Parfenov, E.V.; Egorkin, V.S.; Curran, J.A.; Troughton, S.C.; Sinebryukhov, S.L.; Gnedenkov, S.V.; Lampke, T.; et al. Review of plasma electrolytic oxidation of titanium substrates: Mechanism, properties, applications and limitations. Appl. Surf. Sci. Adv. 2021, 5, 100121. [Google Scholar] [CrossRef]
  4. Aubakirova, V.R.; Astanin, V.V.; Butorin, A.V.; Parfenov, E.V. Modelling the Electromagnetic Field of an Electrolyzer during Plasma Electrolytic Oxidation. In Proceedings of the 2021 International Conference on Electrotechnical Complexes and Systems, Ufa, Russian Federation, 16–18 November 2021. [Google Scholar] [CrossRef]
  5. Usmaniya, N.; Radhakrishna Pillai, S.; Palanivel, M.; Lingamaneni, R.K.; Nagumothu, R. Effect of polycaprolactone coating on the corrosion and biological characteristics of plasma electrolytic oxidised ZM21 magnesium alloy. Surf. Coat. Technol. August 2023, 471, 129915. [Google Scholar] [CrossRef]
  6. Aubakirova, V.; Gunderov, D.; Farrakhov, R.; Khalilov, L.; Parfenov, E. Influence of PEO Electrolyzer Geometry on Current Density Distribution and Resultant Coating Properties on Zr-1Nb Alloy. Materials 2023, 16, 3377. [Google Scholar] [CrossRef] [PubMed]
  7. Aubakirova, V.; Farrakhov, R.; Astanin, V.; Sharipov, A.; Gorbatkov, M.; Parfenov, E. Plasma Electrolytic Oxidation of Zr-1%Nb Alloy: Effect of Sodium Silicate and Boric Acid Addition to Calcium Acetate-Based Electrolyte. Materials 2022, 15, 2003. [Google Scholar] [CrossRef] [PubMed]
  8. Parfenova, L.V.; Galimshina, Z.R.; Gil’fanova, G.U.; Parfenov, E.V.; Valiev, R.Z. Modeling of Biological Activity of PEO-Coated Titanium Implants with Conjugates of Cyclic RGD Peptide with Amino Acid Bisphosphonates. Materials 2022, 15, 8120. [Google Scholar] [CrossRef] [PubMed]
  9. Mukaeva, V.R.; Farrakhov, R.G.; Sharipov, A.E.; Mescheryakova, E.S.; Parfenov, E.V. Comparison of PEO-coatings of zirconium alloy in calcium acetate-based electrolytes. AIP Conf. Proc. 2021, 2402, 020059. [Google Scholar] [CrossRef]
  10. Kusmanov, S.A.; Tambovskii, I.V.; Korableva, S.S.; Mukhacheva, T.L.; D’yakonova, A.D.; Nikiforov, R.V.; Naumov, A.R. Wear resistance increase in Ti6Al4V titanium alloy using a cathodic plasma electrolytic nitriding. Surf. Eng. Appl. Electrochem. 2022, 58, 451–455. [Google Scholar] [CrossRef]
  11. Benkovsky, I.; Tsyntsaru, N.; Silkin, S.; Petrenko, V.; Cesiulis, H.; Dikusar, A. Synthesis Wear and Corrosion of Novel Electrospark and Electrospark–Electrochemical Hybrid Coatings Based on Carbon Steels. Lubricants 2023, 11, 205. [Google Scholar] [CrossRef]
  12. Likrizon, E.V.; Silkin, S.A.; Dikusar, A.I. Effect of Passive Oxide Film Structure and Surface Temperature on the Rate of Anodic Dissolution of Chromium-Nickel and Titanium Alloys in Electrolytes for Electrochemical Machining: Part 2. Anodic Dissolution of Titanium Alloys in Nitrate and Chloride Solutions. Surf. Eng. Appl. Electrochem. 2023, 59, 255–263. [Google Scholar] [CrossRef]
  13. Shelekhov, E.V.; Sviridova, T.A. Programs for X-ray analysis of polycrystals. Metal Sci. Heat Treat. 2000, 42, 309–313. [Google Scholar] [CrossRef]
  14. Grazulis, S.; Chateigner, D.; Downs, R.T.; Yokochi, A.T.; Le Bail, A. Crystallography open database—An open-access collection of crystal structures. J. Appl. Cryst. 2009, 42, 726–729. [Google Scholar] [CrossRef] [PubMed]
  15. Kragelsky, I.V.; Dobychin, M.N.; Kombalov, V.S. Friction and Wear Calculation Methods; Pergamon Press Ltd.: Oxford, UK, 1982; Available online: https://books.google.ru/books?id=QLcgBQAAQBAJ&hl=ru (accessed on 24 May 2023).
  16. Demkin, N.B.; Izmailov, V.V. Surface topography and properties frictional contacts. Trib. Int. 1991, 24, 21–24. [Google Scholar] [CrossRef]
  17. National Standard of the Russian Federation. Geometrical Product Specifications (GPS). Moscow, Standartinform. 2015. Available online: http://docs.cntd.ru/document/1200116337 (accessed on 1 January 2022).
  18. Mukhacheva, T.L.; Belkin, P.N.; Dyakov, I.G.; Kusmanov, S.A. Wear mechanism of medium carbon steel after its plasma electrolytic nitrocarburising. Wear 2020, 462–463, 203516. [Google Scholar] [CrossRef]
  19. Matlin, M.M.; Kazankina, E.M.; Kazankin, V.A. Calculation of the actual contact area between a single microasperity and the smooth surface of a part when the hardnesses of their materials are similar. J. Frict. Wear 2011, 32, 140. [Google Scholar] [CrossRef]
  20. Kragelsky, I.V.; Mihin, N.M. Friction Units of Machines: Reference; Engineering Manufacture: Moscow, Russia, 1984. [Google Scholar]
  21. Van Voorthuysen, E.D.M.; Boerma, D.O.; Chechenin, N.C. Low-temperature extension of the Lehrer diagram and the iron-nitrogen phase diagram. Metall. Mater. Trans. A 2002, 33, 2593–2598. [Google Scholar] [CrossRef]
  22. Izmailov, V.V.; Novoselova, M.V. On the Temperature Dependence of the Frictional Characteristics of a Metal Contact. J. Frict. Wear 2022, 43, 174–179. [Google Scholar] [CrossRef]
  23. Izmailov, V.V.; Barchukov, D.A.; Novoselova, M.V.; Afanasieva, L.E. Surface Microgeometry and Microstructure of the Gas Laser Cut of a Two-Layer Steel Material. J. Frict. Wear 2021, 42, 290–295. [Google Scholar] [CrossRef]
  24. Rachishkin, A.A.; Sutyagin, O.V.; Izmailov, V.V. Study of the Electric Resistance of Contact of Frictional Technical Surfaces by Computer-Aided Simulation. J. Frict. Wear 2021, 42, 193–198. [Google Scholar] [CrossRef]
  25. Afanasieva, L.E.; Izmailov, V.V.; Novoselova, M.V. Microscopic Images and Microstructure of High-Speed Steel Surface after Gas-Laser Cutting. J. Surf. Investig. 2021, 15, 471–477. [Google Scholar] [CrossRef]
  26. Drozdova, E.; Chernogorova, O.; Izmailov, V. Electrotribological properties of metal composite materials reinforced with nanostructural carbon particles. Int. J. Nanotechnol. 2021, 18, 803–811. [Google Scholar] [CrossRef]
  27. Fang, Z.; He, L.; Wang, J.; Betsofen, S.; Tashlykova-Bushkevich, I.I. Effect of I-Phase on Microstructure and Corrosion Resistance of Mg-8.5Li-6.5Zn-1.2Y Alloy. Materials 2023, 16, 3007. [Google Scholar] [CrossRef] [PubMed]
Figure 1. Image of a medium carbon steel finger.
Metals 13 01731 g001
Figure 2. Image of a bronze bushing.
Metals 13 01731 g002
Figure 3. Schematic diagram of the plasma–electrolytic treatment setup: 1—electrolyte; 2—cold water; 3—heat exchanger; 4—power supply; 5—treated sample; 6—electrolytic cell; 7—flowmeter; 8—pump.
Metals 13 01731 g003
Figure 4. Schematic diagram of the electrolytic cell: 1—anode sample, 2—thermocouple, 3—cathode, 4—conductor with fastening system, 5—vapor–gas envelope.
Metals 13 01731 g004
Figure 5. Schematic diagram of the modified electrolytic cell.
Metals 13 01731 g005
Figure 6. Friction scheme. 1—sample; 2—counterbody; 3—pendulum; 4—strain gauge. M—frictional moment; N—force acting on the counterbody and the pendulum from the side of the sample; F—force acting on the pendulum from the strain gauge; L—distance from the axis of rotation to the axis of symmetry of the strain gauge, R—radius of the sample.
Metals 13 01731 g006
Figure 7. Rough surface scheme.
Metals 13 01731 g007
Figure 8. Dependence of the friction coefficient on the friction distance for the first kilometer of testing for samples after PENC at various temperatures and an untreated control.
Metals 13 01731 g008
Figure 9. Dependence of the friction coefficient on the friction distance for the second and third kilometers of testing for samples after PENC at various temperatures and the untreated control.
Metals 13 01731 g009
Figure 10. Dependence of the friction coefficient on the friction distance for the fourth and fifth kilometers of the test for samples after PENC at various temperatures and the untreated control.
Metals 13 01731 g010
Figure 11. The average friction coefficient over the last 100 m of the friction distance after 1, 3, and 5 km of tests for samples after PENC at various temperatures and the control untreated.
Metals 13 01731 g011
Figure 12. The weight loss during the first kilometer of friction tests of samples after PENC at various temperatures and a control untreated sample.
Metals 13 01731 g012
Figure 13. The weight loss of a bronze counterbody operating in tandem with a steel sample after PENC at different temperatures and a control sample during the first kilometer of friction tests.
Metals 13 01731 g013
Figure 14. The weight loss during the second and third kilometers of friction tests of samples after PENC at various temperatures and a control untreated sample.
Metals 13 01731 g014
Figure 15. The weight loss of a bronze counterbody operating in tandem with steel samples after PENC at different temperatures and a control sample during the second and third kilometers of friction tests.
Metals 13 01731 g015
Figure 16. SEM image of the friction track of the sample after PENC at 550 °C.
Metals 13 01731 g016
Figure 17. SEM image of the friction track of the sample after PENC at 550 °C with the results of elemental analysis for the content of traces of copper.
Metals 13 01731 g017
Figure 18. SEM image of the friction track of the sample after PENC at 700 °C.
Metals 13 01731 g018
Figure 19. SEM image of the friction track of the sample after PENC at 700 °C with the results of elemental analysis for the content of traces of copper.
Metals 13 01731 g019
Figure 20. SEM image of the friction track of the sample after PENC at 850 °C.
Metals 13 01731 g020
Figure 21. SEM image of the friction track of the sample after PENC at 850 °C with the results of elemental analysis for the content of traces of copper.
Metals 13 01731 g021
Figure 22. Microhardness distribution in the surface layer of steel sample after PENC at different treatment temperatures.
Metals 13 01731 g022
Figure 23. Microstructure of the steel sample after PENC at 850 °C. 1—nitride zone with residual austenite and iron nitrides, 2—nitride–martensite zone, 3—martensite.
Metals 13 01731 g023
Figure 24. Microstructure of the steel sample after PENC at 700 °C. 1—nitride zone with residual austenite and iron nitrides, 2—nitride–martensite zone, 3—martensite.
Metals 13 01731 g024
Figure 25. Microstructure of the steel sample after PENC at 550 °C (ferrite–pearlite structure).
Metals 13 01731 g025
Figure 26. Morphology of the oxide layer surface.
Metals 13 01731 g026
Figure 27. X-ray diffraction pattern of the steel sample after PENC at 600 (a), 650 (b), 700 (c), 800 (d), and 850 (e) °C.
Metals 13 01731 g027
Table 1. Characteristics of tribological contact of nitrocarburized steel with bronze.
ParameterUntreated (Control)PENC Temperature (°C)
550600650700750800850
r (μm)67 ± 239 ± 143 ± 158 ± 1155 ± 4153 ± 4127 ± 3147 ± 4
h (μm)6.4 ± 0.23.6 ± 0.13.8 ± 0.13.9 ± 0.12.5 ± 0.12.8 ± 0.12.9 ± 0.12.6 ± 0.1
Δ0.88 ± 0.050.29 ± 0.020.28 ± 0.020.30 ± 0.020.10 ± 0.010.11 ± 0.010.10 ± 0.010.11 ± 0.01
Kp16.8 ± 5.75.2 ± 0.24.1 ± 0.22.8 ± 0.11.4 ± 0.13.1 ± 0.12.1 ± 0.11.9 ± 0.1
j (MPa/μm)0.045 ± 0.0010.080 ± 0.0020.076 ± 0.0020.074 ± 0.0020.116 ± 0.0030.103 ± 0.0030.100 ± 0.0030.111 ± 0.003
Disclaimer/Publisher’s Note: The statements, opinions and data contained in all publications are solely those of the individual author(s) and contributor(s) and not of MDPI and/or the editor(s). MDPI and/or the editor(s) disclaim responsibility for any injury to people or property resulting from any ideas, methods, instructions or products referred to in the content.

