Article

Identification of Expanded Austenite in Nitrogen-Implanted Ferritic Steel through In Situ Synchrotron X-ray Diffraction Analyses

by
Bruna C. E. Schibicheski Kurelo
1,*,
Carlos M. Lepienski
1,
Willian R. de Oliveira
2,
Gelson B. de Souza
2,
Francisco C. Serbena
2,
Rodrigo P. Cardoso
3,
Julio C. K. das Neves
1 and
Paulo C. Borges
1
1
Postgraduate Program in Mechanical and Materials Engineering, Federal Technological University of Paraná, Campus Ecoville, Curitiba 81280-340, Brazil
2
Laboratory of Mechanical Properties and Surfaces, Department of Physics, State University of Ponta Grossa, Campus Uvaranas, Ponta Grossa 84030-900, Brazil
3
LabMat, Department of Mechanical Engineering, Federal University of Santa Catarina, Campus Trindade, Florianópolis 88040-900, Brazil
*
Author to whom correspondence should be addressed.
Metals 2023, 13(10), 1744; https://doi.org/10.3390/met13101744
Submission received: 30 June 2023 / Revised: 30 September 2023 / Accepted: 10 October 2023 / Published: 14 October 2023

Abstract

:
The existence and formation of expanded austenite in ferritic stainless steels remains a subject of debate. This research article aims to provide comprehensive insights into the formation and decomposition of expanded austenite through in situ structure analyses during thermal treatments of ferritic steels. To achieve this objective, we employed the Plasma Immersion Ion Implantation (PIII) technique for nitriding in conjunction with in situ synchrotron X-ray diffraction (ISS-XRD) for microstructural analyses during the thermal treatment of the samples. The PIII was carried out at a low temperature (300–400 °C) to promote the formation of metastable phases. The ISS-XRD analyses were carried out at 450 °C, which is in the working temperature range of the ferritic steel UNS S44400, which has applications, for instance, in the coating of petroleum distillation towers. Nitrogen-expanded ferrite (αN) and nitrogen-expanded austenite (γN) metastable phases were formed by nitriding in the modified layers. The production of the αN or γN phase in a ferritic matrix during nitriding has a direct relationship with the nitrogen concentration attained on the treated surfaces, which depends on the ion fluence imposed during the PIII treatment. During the thermal evolution of crystallographic phase analyses by ISS-XRD, after nitriding, structure evolution occurs mainly by nitrogen diffusion. In the nitrided samples prepared under the highest ion fluences—longer treatment times and frequencies (PIII 300 °C 6 h and PIII 400 °C 3 h) containing a significant amount of γN—a transition from the γN phase to the α and CrN phases and the formation of oxides occurred.

Graphical Abstract

1. Introduction

The formation of the nitrogen-expanded ferrite (αN) phase, a metastable nitrogen-rich in the solid solution phase, predominates in ferritic stainless steel surfaces modified at low temperatures by conventional plasma nitriding (PN), while at high temperatures (above 400 °C), iron (ε – Fe2−XN (0 ≤ x ≤ 1) and γ′–Fe4N) and chromium nitrides (CrN and Cr2N) are the predominant phases [1,2,3,4,5,6]. The products of PN are highly influenced by the treatment temperature and chemical composition of the steel [7]. Plasma Immersion Ion Implantation (PIII) is a process in which ions accelerated by high voltages in the plasma sheath are physically inserted in the sample surface. Hence, in PIII, the mean ion energy in the process sums with other important factors from PN (temperature and ion availability on the surfaces) to attain higher levels of nitrogen in the lattice in a solid solution. It enables the necessary thermodynamic conditions to produce new phases [8]. High ion doses can be attained by controlling the PIII parameters, such as voltage, duty cycle, and plasma ionization fractions. Most of the literature reports the formation of ε and γ′ nitrides and the αN phase in the modified layers of low-temperature PIII-nitrided ferritic steels at temperatures ranging from 300 °C to 400 °C [8,9,10,11,12].
A less common phase produced in ferritic stainless steels is the nitrogen-expanded austenite, γN, which is typically produced in austenitic stainless steels [7,13,14]. In those materials, studies using X-ray diffraction (XRD) and electron diffraction by Transmission Electron Microscopy (TEM) reported the γN phase as a cubic structure with a high density of dislocations and stacking faults, where nitrogen preferentially occupies the octahedral sites and tends to the γ′-Fe4N (BCC) ordering [14,15,16,17,18].
The γN phase, which has a nitrogen content much larger than that in the αN phase, is often identified on the ferrite grains of the duplex stainless steels after PIII and PN processes, indicating that an αN to γN phase transition occurs [19,20,21]. In only ferritic alloys, Jiraskova et al. [22] identified the γN phase in a PIII nitrided X10CrAl18 ferritic stainless steel without Ni in its composition. In addition, Piekoszewski et al. identified the formation of expanded austenite in pure iron after a high-intensity nitrogen pulsed-plasma treatment [23]. In addition, the nitriding at high temperature can also cause an α to y transition in the surface microstructure depending on the incorporation of nitrogen in the process [24]. The colossal interstitial nitrogen supersaturation in the ferrite (α) phase, similar to that observed for the γN phase, was also predicted by theoretical works and identified in nitriding works in duplex steels that indicate that both phases are formed by means of a spinodal-like decomposition of ferrite into Cr-rich and Fe-rich ferrite phases [7,25,26]. However, in those experimental works that feature this mechanism, the matrix remains with its BCC crystal structure, and nitrides are formed. In the present study, conversely, the XRD patterns show a clear tendency towards an FCC crystal structure.
The analyses presented in this work indicate that necessary conditions to produce γN depend on the nitrogen concentration increase in the modified layers. In addition, the nitrogen concentration in the γN phase is related to the widening of the peaks observed in the X-ray diffractograms [27,28]. Therefore, the γN phase formation was investigated by XRD by varying ion fluences in PIII treatments of the ferritic UNS S44400 stainless steel alloy. The thermal evolution of crystalline phases using ISS-XRD allowed the clear separation of αN and γN from the nitrided phases and also allowed the obtainment of concrete evidence of the formation of a nitrogen-expanded austenite (γN) phase in the ferritic stainless steel. A similar protocol was successfully employed by [29] to analyze the γN thermal decomposition in austenitic stainless steel.
PIII at a low temperature, which produces predominantly expanded phases in modified surface layers, can be used in stainless steels in order to increase the duration of parts and equipment for application in the most diverse areas of the industry, improving the wear resistance and improving or not changing the corrosion resistance [6,7,11,12,30]. In certain applications, such as petroleum refining, in furnaces and gas turbines of the chemical and food industries and automotive exhaust systems, these parts will be subjected to high temperatures. Thus, to apply these materials in these environments, studies on the stability and thermal evolution of the expanded phases are necessary, emphasizing the importance of this work.

2. Materials and Methods

The UNS S44400 (AISI 444) ferritic stainless steel (nominal composition in wt%: 19.5 Cr, 0.2 Ni, 2.5 Mo, 0.14 Ti, 0.17 Nb, 0.5 Mn, 0.5 Si, 0.04 P, 0.02, C, 0.03 N, and Fe—balance) samples were shaped as discs with 12 mm diameter and 2 mm thickness and were metallographically prepared to obtain a mirror-polished finishing and were cleaned in ultrasonic baths. Prior to nitriding, the samples surfaces were sputter-cleaned by a 50%Ar–50%H2 (vol.) gas mixture for 20 min at 300 °C. After the end of the process, the voltage was turned off. The samples were then nitrided by PIII at 9 kV voltage, 30 μs pulse width, and different frequencies (Table 1) to obtain temperatures of 300 and 400 °C and different ion doses on the surface [27]. The heating time to reach the treatment temperature was approximately 30 min for all the conditions. The treatments were carried out for 3 and 6 h, at 3 Pa in the chamber, with a 60% N2–40% H2 (vol.) gas mixture. The sample names begin with the name of the nitriding technique, PIII, followed by the treatment temperature and time. The heat-treated samples were named with the suffix HT.
The ISS-XRD analyses (Figure 1a) were carried out in a furnace with a Kapton window enabling X-ray diffraction with synchrotron radiation in the XRD2 beamline of the Brazilian Synchrotron Light Laboratory (LNLS). The Kapton window is not suitable for vacuum pressure operations; for this reason, the process was conducted under He flow, which reduced but did not eliminate the oxidation of the surfaces. In these analyses, the X-ray beam energy was adjusted to 7 keV (λ = 1.773 Å) to prevent Fe fluorescence, and a Mythen linear detector was employed. The size of the X-ray beam under the sample was 3 mm × 0.5 mm. The heat treatment consisted of the following steps: (i) heating period from room temperature to 450 °C; (ii) isothermal period at 450 °C; and (iii) cooling period. After step (ii), the furnace was turned off and the sample was naturally cooled until reaching room temperature. These periods can be seen on the heating ramp (Figure 1b).
The thermal cycle was chosen after several tests using other types of stainless steels: austenitic, ferritic, and duplex. In the literature, the threshold temperature for the decomposition of the αN phase is 300 °C [14]. The tests indicated the temperature of 350 °C as the beginning of variation in the lattice parameter in expanded phases, while the 450 °C temperature indicated an ideal parameter to evaluate the evolution of the phases. In addition, this temperature is approximately the maximum temperature for the application of UNS S44400 steel in petroleum distillation towers. A period of 5 h was adequate for the entire heating, isothermal, and cooling cycles. Higher temperatures led to very abrupt variations in the expanded phases, leading to their decomposition as well as the formation of a thicker oxide film, while temperatures below 450 °C did not provide a measurable variation in the phases in the period available for each sample to be tested.
In the heating period, a 10 °C/min heating rate was applied, and XRD spectra were acquired at 350 °C and 400 °C; in both cases, the acquisition started after 1 min of temperature stabilization. The isothermal period, performed at 450 °C, was 124 min long, and XRD data were collected in intervals of 18 min. In this time interval, the scans were performed for the 2θ range from 35° to 90°, and the acquisition time was 2.5 s for each step scan of 0.2°, totaling 11.5 min in each scan. During the heat treatments, the grazing incidence angle of the X-ray beam was fixed at θ = 10°, which allowed a penetration depth up to about 4 µm on the surface of the samples. ISS-XRD tests were also performed at room temperature before the heating period and after the cooling period; XRD patterns were collected with grazing angles of θ = 10° and θ = 2° observed, with the latter reducing penetration to ~0.8 μm for near-surface analyses. During all XRD tests, the position of the samples remained unchanged inside the furnace.
The intensity of the XRD counts was normalized by the value of the average electron beam current in the synchrotron ring during the test. The lattice parameters and interplanar distances at each temperature were calculated by considering thermal expansion coefficients of the phases [31,32,33,34,35] and crystallographic PDF cards: 33–397 (γ-austenite); 6–696 (α-ferrite); 86–231 (γ′-Fe4N); 49–1664 and 72–2126 (ε-Fe2–3N); 11–65 (CrN); 33–664 (Fe2O3); and 38–1479 (Cr2O3). These PDF cards were selected according to the literature about the structures present in stainless steels after plasma nitriding. The Fityk open-source software [36] was used for nonlinear curve fitting of the XRD patterns. The variation in the lattice parameters of the expanded phases was calculated using the method described in Oliveira et. al. [37] from a weighted mean using the integrated peak area as weight and the peak center positions.

3. Results and Discussions

The cross-section FEG-SEM and OM images for the nitrogen-implanted super ferritic steel before and after thermal treatment (HT), etched with Murakami’s reagent, are presented in Figure 2. With the increase in treatment time from 3 h to 6 h, the 300 °C nitrided samples, as expected, presented a small increase in the modified layer thickness. When the nitriding temperature increased to 400 °C, the increase in the modified layer thickness was much more significant. After heat treatments, the thicknesses grew due to the nitrogen diffusion into the substrate.
The averaged layer thicknesses of the nitrogen-implanted ferritic steel before and after thermal treatment (HT) measured in cross sections of the samples are presented in Table 2.
Nitrogen contents in all modified layers before and after heat treatment were measured by the Wavelength Dispersive X-ray Spectrometry (WDS/WDX) technique; the results are shown in Figure 3. The WDS spot under the analysis conditions is approximately 700 nm in diameter, so there is difficulty in measuring the nitrogen content in thin layers such as those obtained in the 300 °C treatments. The behavior of the nitrogen profiles agrees with the layer thicknesses measured in the cross sections of the samples and is presented in Table 2.
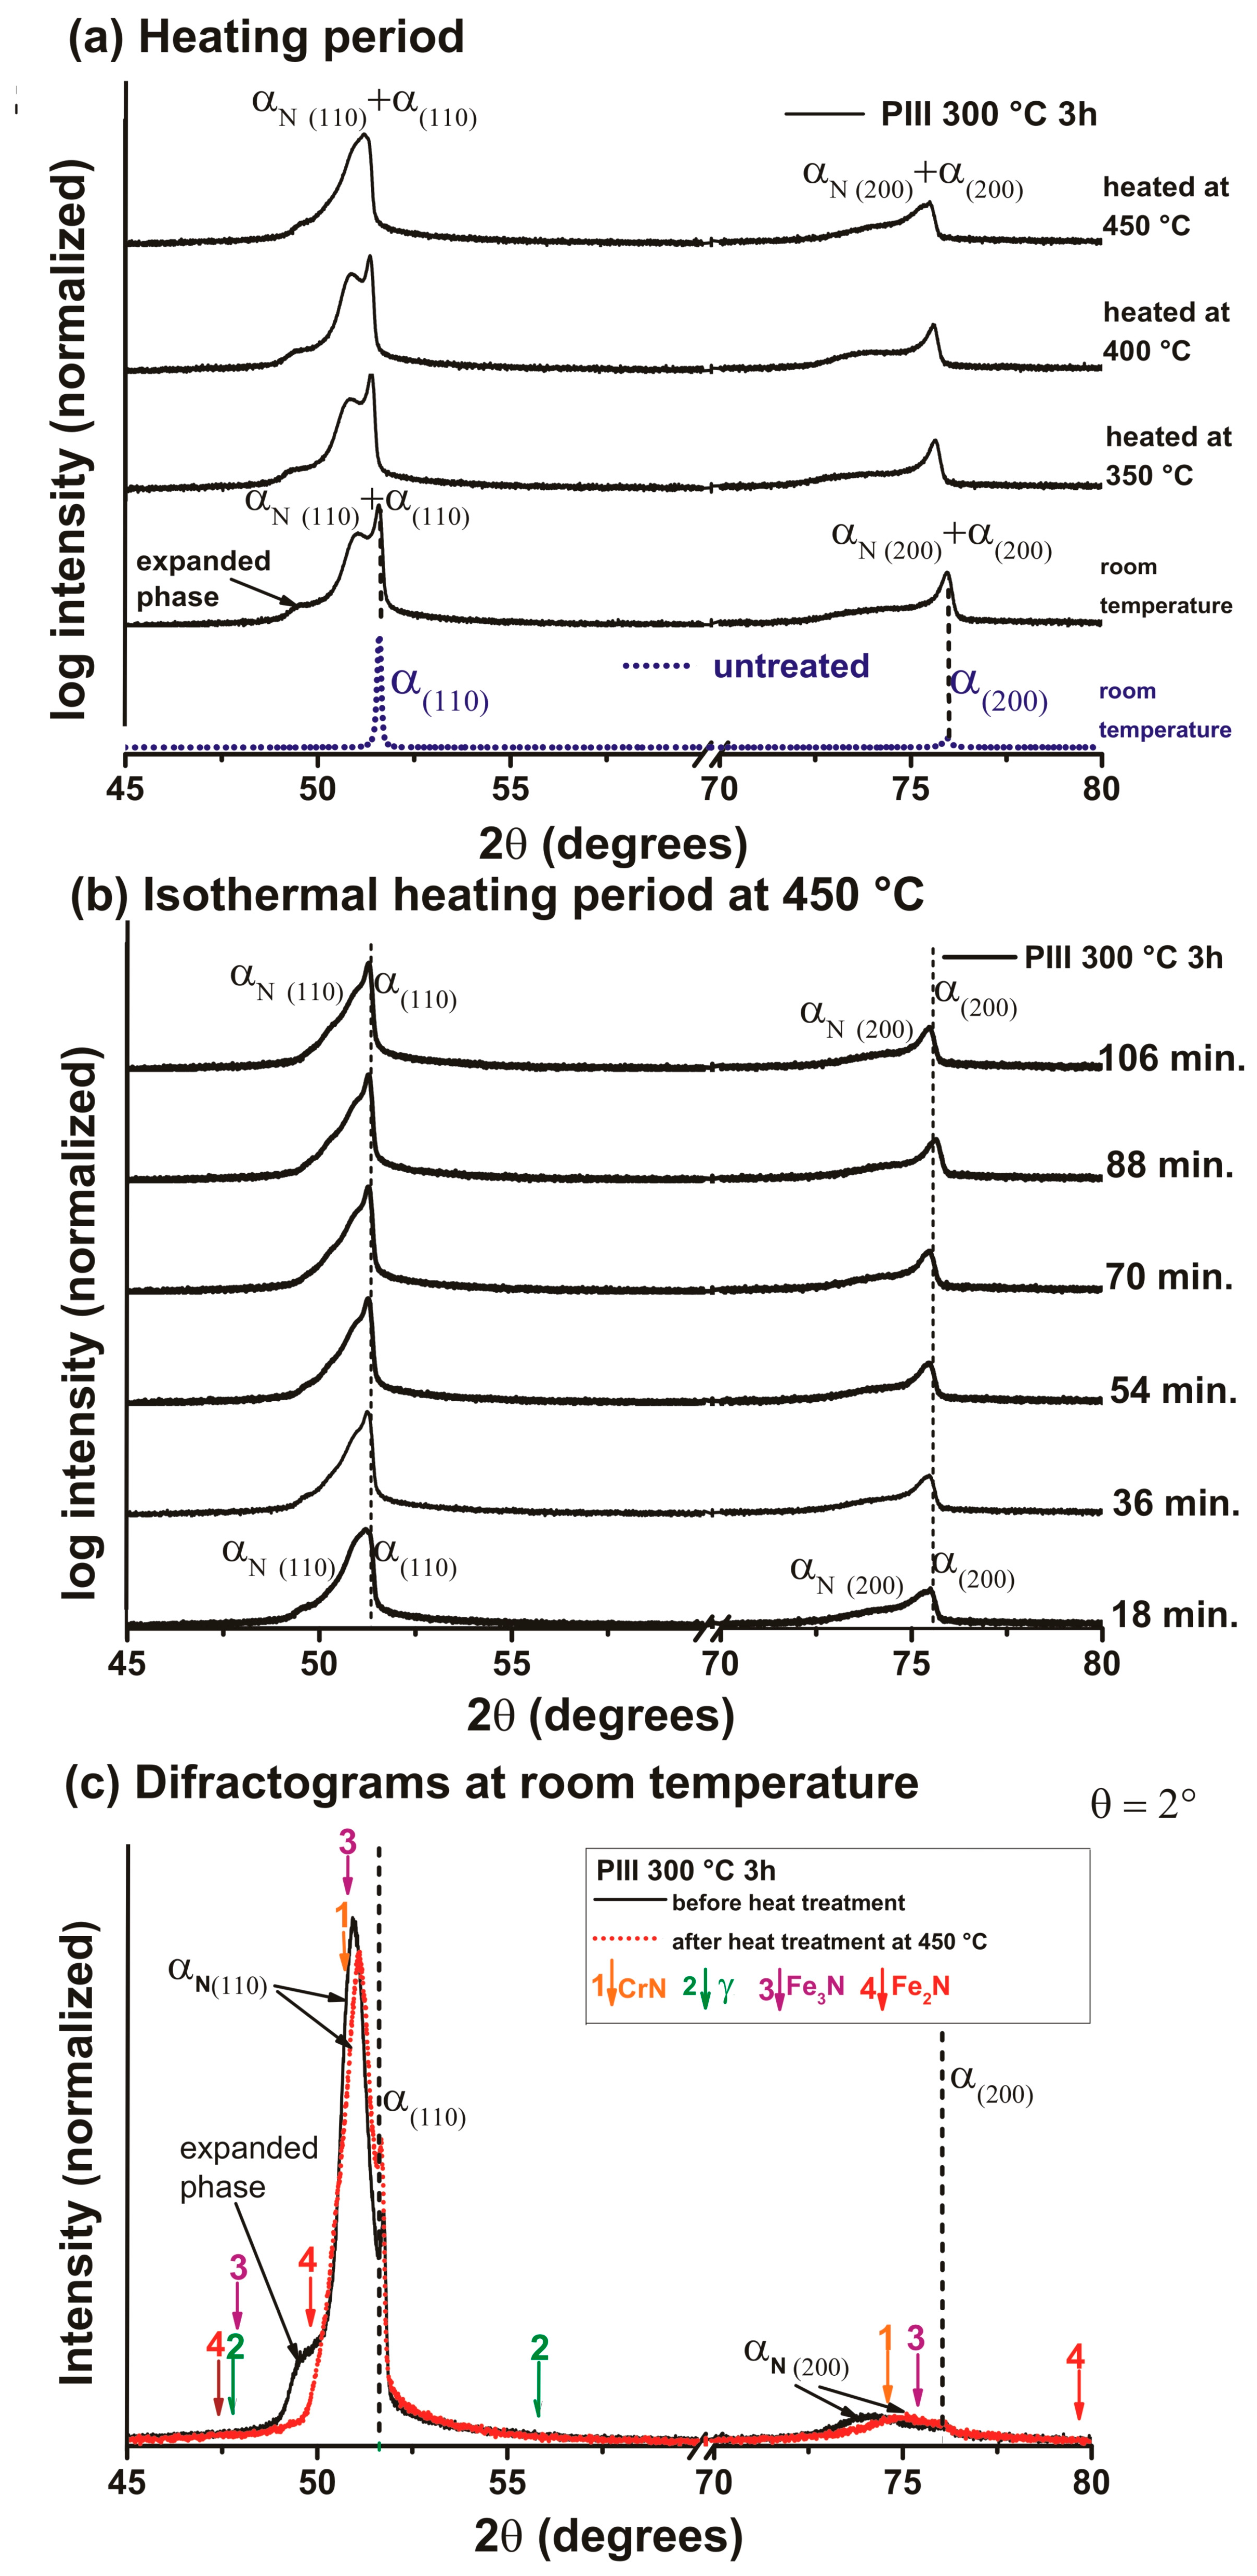
The XRD of untreated (non-nitrided) UNS S44400 (AISI 444) steel samples showed only the expected peaks of the ferrite phase at room temperature, as shown in the lowermost XRD pattern in Figure 4a. The predominant phase produced by nitriding in the condition of 300 °C for 3 h was the αN phase, which is identified by the presence of broad peaks in the XRD displaced to lower angles (greater interplanar distances) concerning the position of the corresponding α phase peaks [3,7,11]. This shift of the XRD peaks (interplanar distances) is due primarily to the presence of nitrogen in the solid solution, because the nitrogen concentration gradient in the nitrided surface layer causes an increase in the lattice parameter that is dependent on the nitrogen concentration in the crystal lattice [27,28,38]. The αN phase peaks are broad due to the continuous decrease in the nitrogen concentration with depth, which results in the overlapping of several substoichiometries of the nitrogen in the αN phase. Table 3 presents the calculated values for the average lattice parameters from the XRD patterns obtained at room temperature before and after the heat treatment (HT). The lattice parameters of the α phase, calculated from the peak positions at 51.6° (α (110)) and 75.9° (α (200)), were 2.88 Å. In the αN phase, the lattice parameters calculated at 51.1° (αN (110)) and 74.6° (αN (200)) were 2.91 Å and 2.92 Å, respectively. After the heat treatment, the peak positions of the αN phase peaks were displaced to 51.3° (αN (110)) and 75.1° (αN (200)), and the calculated lattice parameters changed to 2.90 Å and 2.91 Å. The average lattice parameters values, calculated from the interplanar distances determined from the peaks of the αN phase, are shown in Table 3, and the deviation in the values was small, indicating that the values obtained by the XRD analysis were then consistent with each other. Figure 4a also presents diffractograms of the 300 °C 3 h nitrided sample obtained in situ during the heating period of the heat treatment. During the heating period, α phase peaks from the substrate were displaced to lower angles (higher interplanar distances) due to thermal expansion, as expected. In contrast, peaks related to the αN phase shifted to lower interplanar distances, indicating that a reduction in nitrogen in the solid solution occurred, probably related to the inward diffusion of N atoms. These diffractograms presented little or no nitride contribution. Although iron nitrides were not identified, their position is indicated only to facilitate a comparison.
The broad peak at 49° lost intensity, was displaced to smaller interplanar distances in the heating period, and disappeared after the isothermal period, indicating that it is related to an expanded phase containing nitrogen in the solid solution. This peak may be related to the αN phase containing the highest N content, or it may be related to the beginning of an αN to γN phase transition on the sample surface. Accordingly, the position of this peak can be related to the highest-intensity peak of the γN phase.
During the isothermal period, shown in Figure 4b, interplanar distances of the αN phase were further reduced, accompanied by a slight decrease in the intensities of the peaks, indicating the partial diffusion of nitrogen in the solid solution due to nitrogen diffusion under a constant temperature.
Figure 4c compares the diffractograms of the PIII 300 °C 3 h nitrided sample before and after the heat treatment, both obtained at room temperature. Neither Cr nitrides nor oxides could be identified in any of the cases. At the temperature and time of analysis used, the iron nitrides were stable, as identified by Brink (2014) in a nitrided austenitic stainless steel [31]. Despite an increase in the nitrides or their appearance after the heat treatment, the intensities decreased in regions of the diffractograms related to them and also to the αN phase. This confirms the fact that iron nitrides in the 300 °C 3 h sample were absent or that only a few were present before and after the heating period. Thus, for the 300 °C 3 h nitrided sample, the thermal evolution of the modified layer resulted predominantly from nitrogen diffusion. Neither the formation of Cr nitrides nor oxides was observed. This corroborates the secure application of such modified surface in conditions with temperatures below 450 °C.
In agreement with the XRD results, the nitrogen content analyses in Figure 2 show a reduction in the nitrogen concentration measured at the top in the PIII 300 °C 3 h sample when compared to the PIII 300 °C 3 h sample after heat treatment (PIII 300 °C 3 h HT) that predominantly presents the αN phase, indicating nitrogen diffusion from the surface to the bulk. It is also observed that the XRD beam with θ = 10° (Figure 4a,b) permeates the modified layer due to the beam penetration being ~4 um, while the thickness of the modified layer is smaller (Table 2). In this condition, the α phase was identified in the substrate. In the θ = 2° analyses condition (Figure 4c), the beam penetration was ~0.8 um, and the α phase was identified at a depth smaller than the thickness of the modified layer after thermal evolution. Thus, the expanded phases were partially converted into the α phase after the heat treatment in the modified layer.
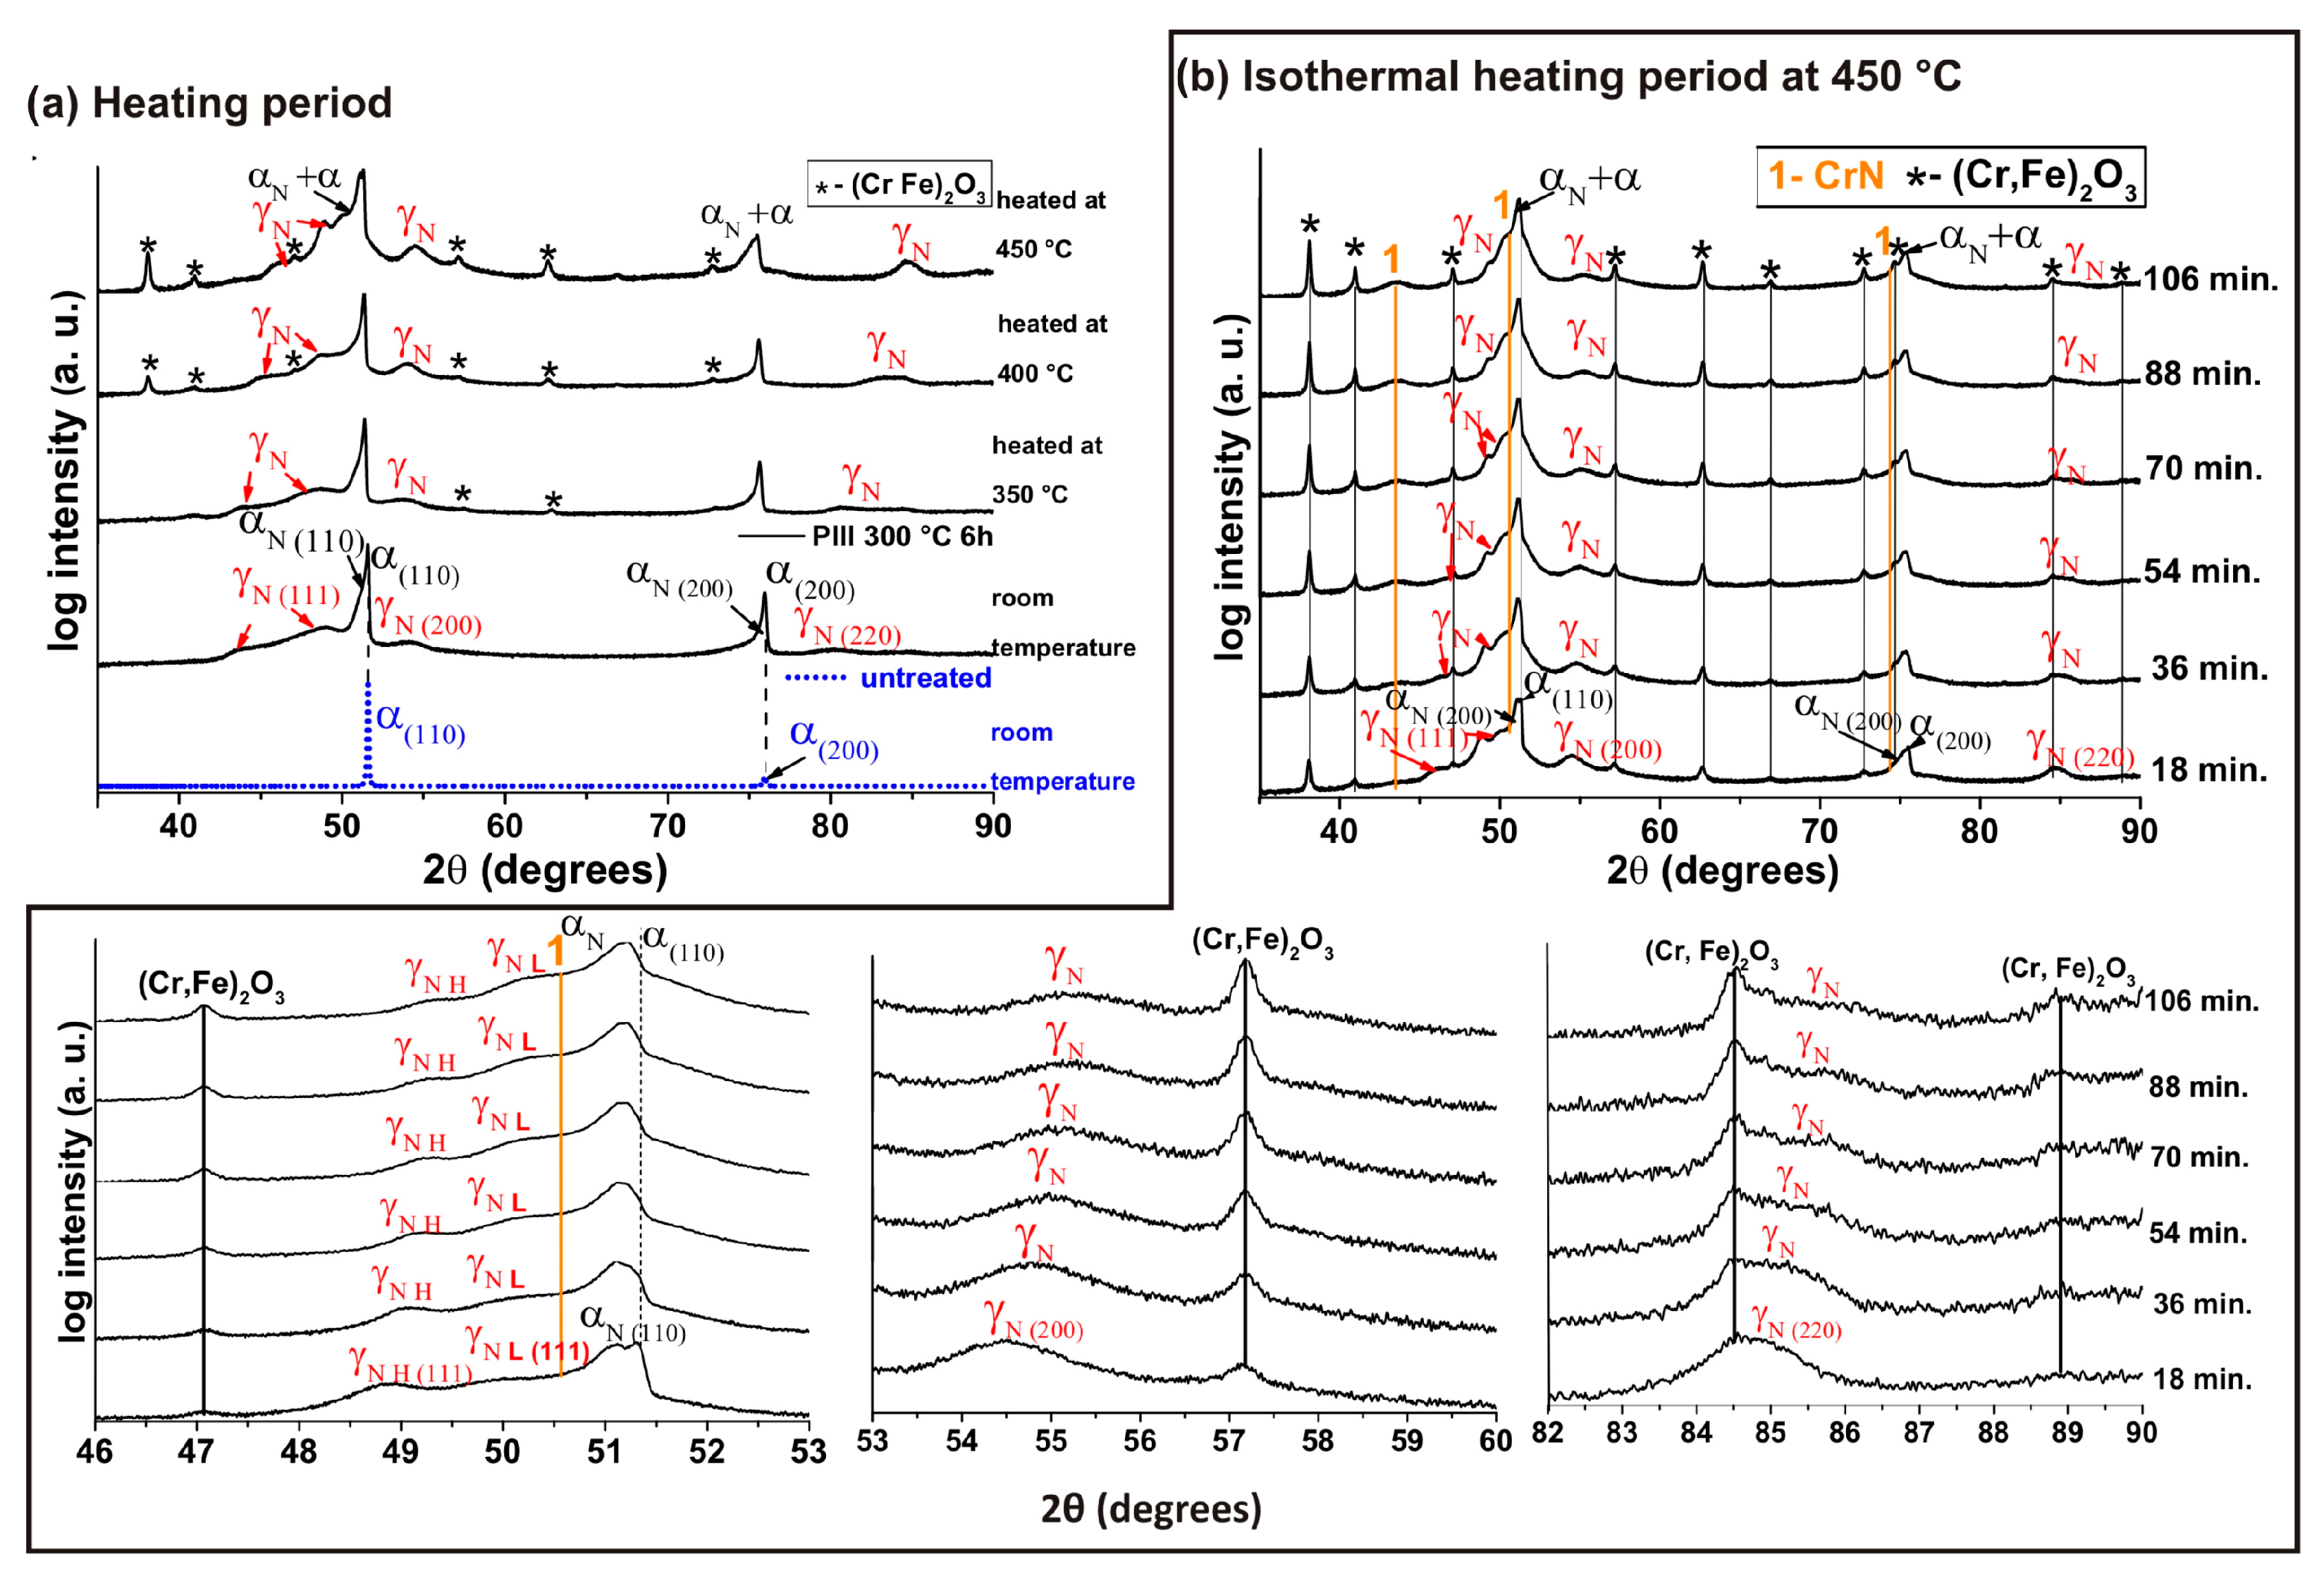
The X-ray diffractogram of the UNS S44400 steel sample nitrided by PIII at 300 °C for 6 h is shown in Figure 5a. In addition to αN, this sample presented the γN phase in the modified layer. Firstly, the treatment time in this condition was twice as high as the previous one, 300 °C for 3 h, leading to a significant increase in ion fluence (Table 1). Secondly, the large amount of Cr in the alloy (about 19.5% wt.) may have facilitated the N entrapment in Cr sites [7], similarly to the trapping–detrapping model developed for austenitic steels [14], promoting an enrichment of the αN phase with N and, eventually, its transition to the γN phase [22,27,31,39], since nitrogen is an austenite stabilizer element. In the nitrogen trapping model by the Cr sites, first proposed by Parascandola [12], a weak bond in the order of −0.193 eV between Cr and N occurs in the γN phase [13]. After the nitrogen trapping or Cr–N weak bond, the expanded phase remains with a nitrogen limit up to 38% at., without forming any precipitates [2,17]. Higher contents of elements such as Cr, Mo, Ti, and Nb in the alloy also favor the formation of the γN phase by increasing the nitrogen solubility [13]. Thus, the formation of the γN phase is strongly influenced by the Cr content in the alloy. In addition, the γN phase has a mixture of lattice parameters, as this phase is formed with different stoichiometries. The grains might contain crystalline structures with different lattice parameters, as the nitriding process is dependent on the crystalline orientation [40,41]. The broadening of the XRD peaks is caused by the strains induced in the crystal lattice due to the introduction of nitrogen in the solid solution, while the peaks overlapping correspond to the various non-stoichiometric Fe-N concentrations in the austenite CFC structure [14,27,42]. In agreement with the XRD results, the nitrogen content analyses in Figure 2 show an increase in the nitrogen concentration measured at the top in the PIII 300 °C 6 h sample rich in the γN phase when compared to the PIII 300 °C 3 h sample that presents only the αN phase. After the heat treatment, the nitrogen content measured at the top of the PIII 300 °C HT sample was approximately zero due to the oxide film formed on the surface of this sample, preventing the correct detection of nitrogen on the surface.
It is straightforward to consider the overlapping of γ′-Fe4N and ε-Fe2 + xN nitride peaks (with x between 0 and 1) with αN and γN peaks in the diffractogram of the 300 °C 6 h sample. Nitrides are generally formed after the supersaturation of nitrogen in solid solutions [43,44]. However, the results of the in situ XRD in the heating period until 450 °C, shown in Figure 5a, indicate that the overlapped peaks laying at lower angles (greater interplanar distances) from the αN phase peak at 50.6° were predominantly composed of the γN phase peaks. During the heating period, peaks related to the γN phase shifted to smaller interplanar distances due to that the partial diffusion of nitrogen in the solid solution was seen, in the same fashion as observed for the αN phase in the 300 °C 3 h sample (Figure 1a). No other peaks were left in the 47.64°–50.8° range after the decay of the expanded phases, which would be expected for iron nitrides, since they are thermodynamically stable in these conditions, as previously mentioned [31].
In the isothermal period at 450 °C, shown in Figure 5b, peaks related to the γN phase were resolved into two contributions, the low-expansion (γN L) and the high-expansion γN phase (γN H), similar behavior to that observed in austenitic steels [27]. The metastable phases γN and αN were displaced even more to lower interplanar distances due to interstitial solid solution reduction as a consequence of the nitrogen diffusion in the lattice. At the end of the isothermal period, the integrated areas of the γN peaks were observed to decrease by ~53%, whereas the CrN peaks increased in intensity. These findings corroborate a possible phase transition from γN to α + CrN, as evidenced in the literature on other heat-treated stainless steels [22,27,29,31,39]. If the temperature in the isothermal period was increased, the γN to α + CrN transition would occur in a more pronounced way, as observed by Tschiptschin et. al. [29].
During the heat treatment, (Cr, Fe)2O3 oxide peaks appeared in the diffractogram, which became more evident with the treatment time. Oxides form a film that grows externally to the modified layer, and the peaks related to these phases are not broad nor displaced. Their presence serves as a reference point to state peaks related to the change in the expanded phases regarding width and position as the treatment time increased. A hypothesis explaining the tendency of oxide formation in nitrided stainless steels considers the immobilization of chromium in the presence of nitrogen due to their chemical affinity: N is trapped in Cr sites, producing a short-range ordering between Cr and N in the γN phase, as proposed by Cao and Norell [45]. As a result, the Cr activity reduces, making it difficult to form protective chromium oxides in the presence of oxygen (residual, in this case) and at high temperatures.
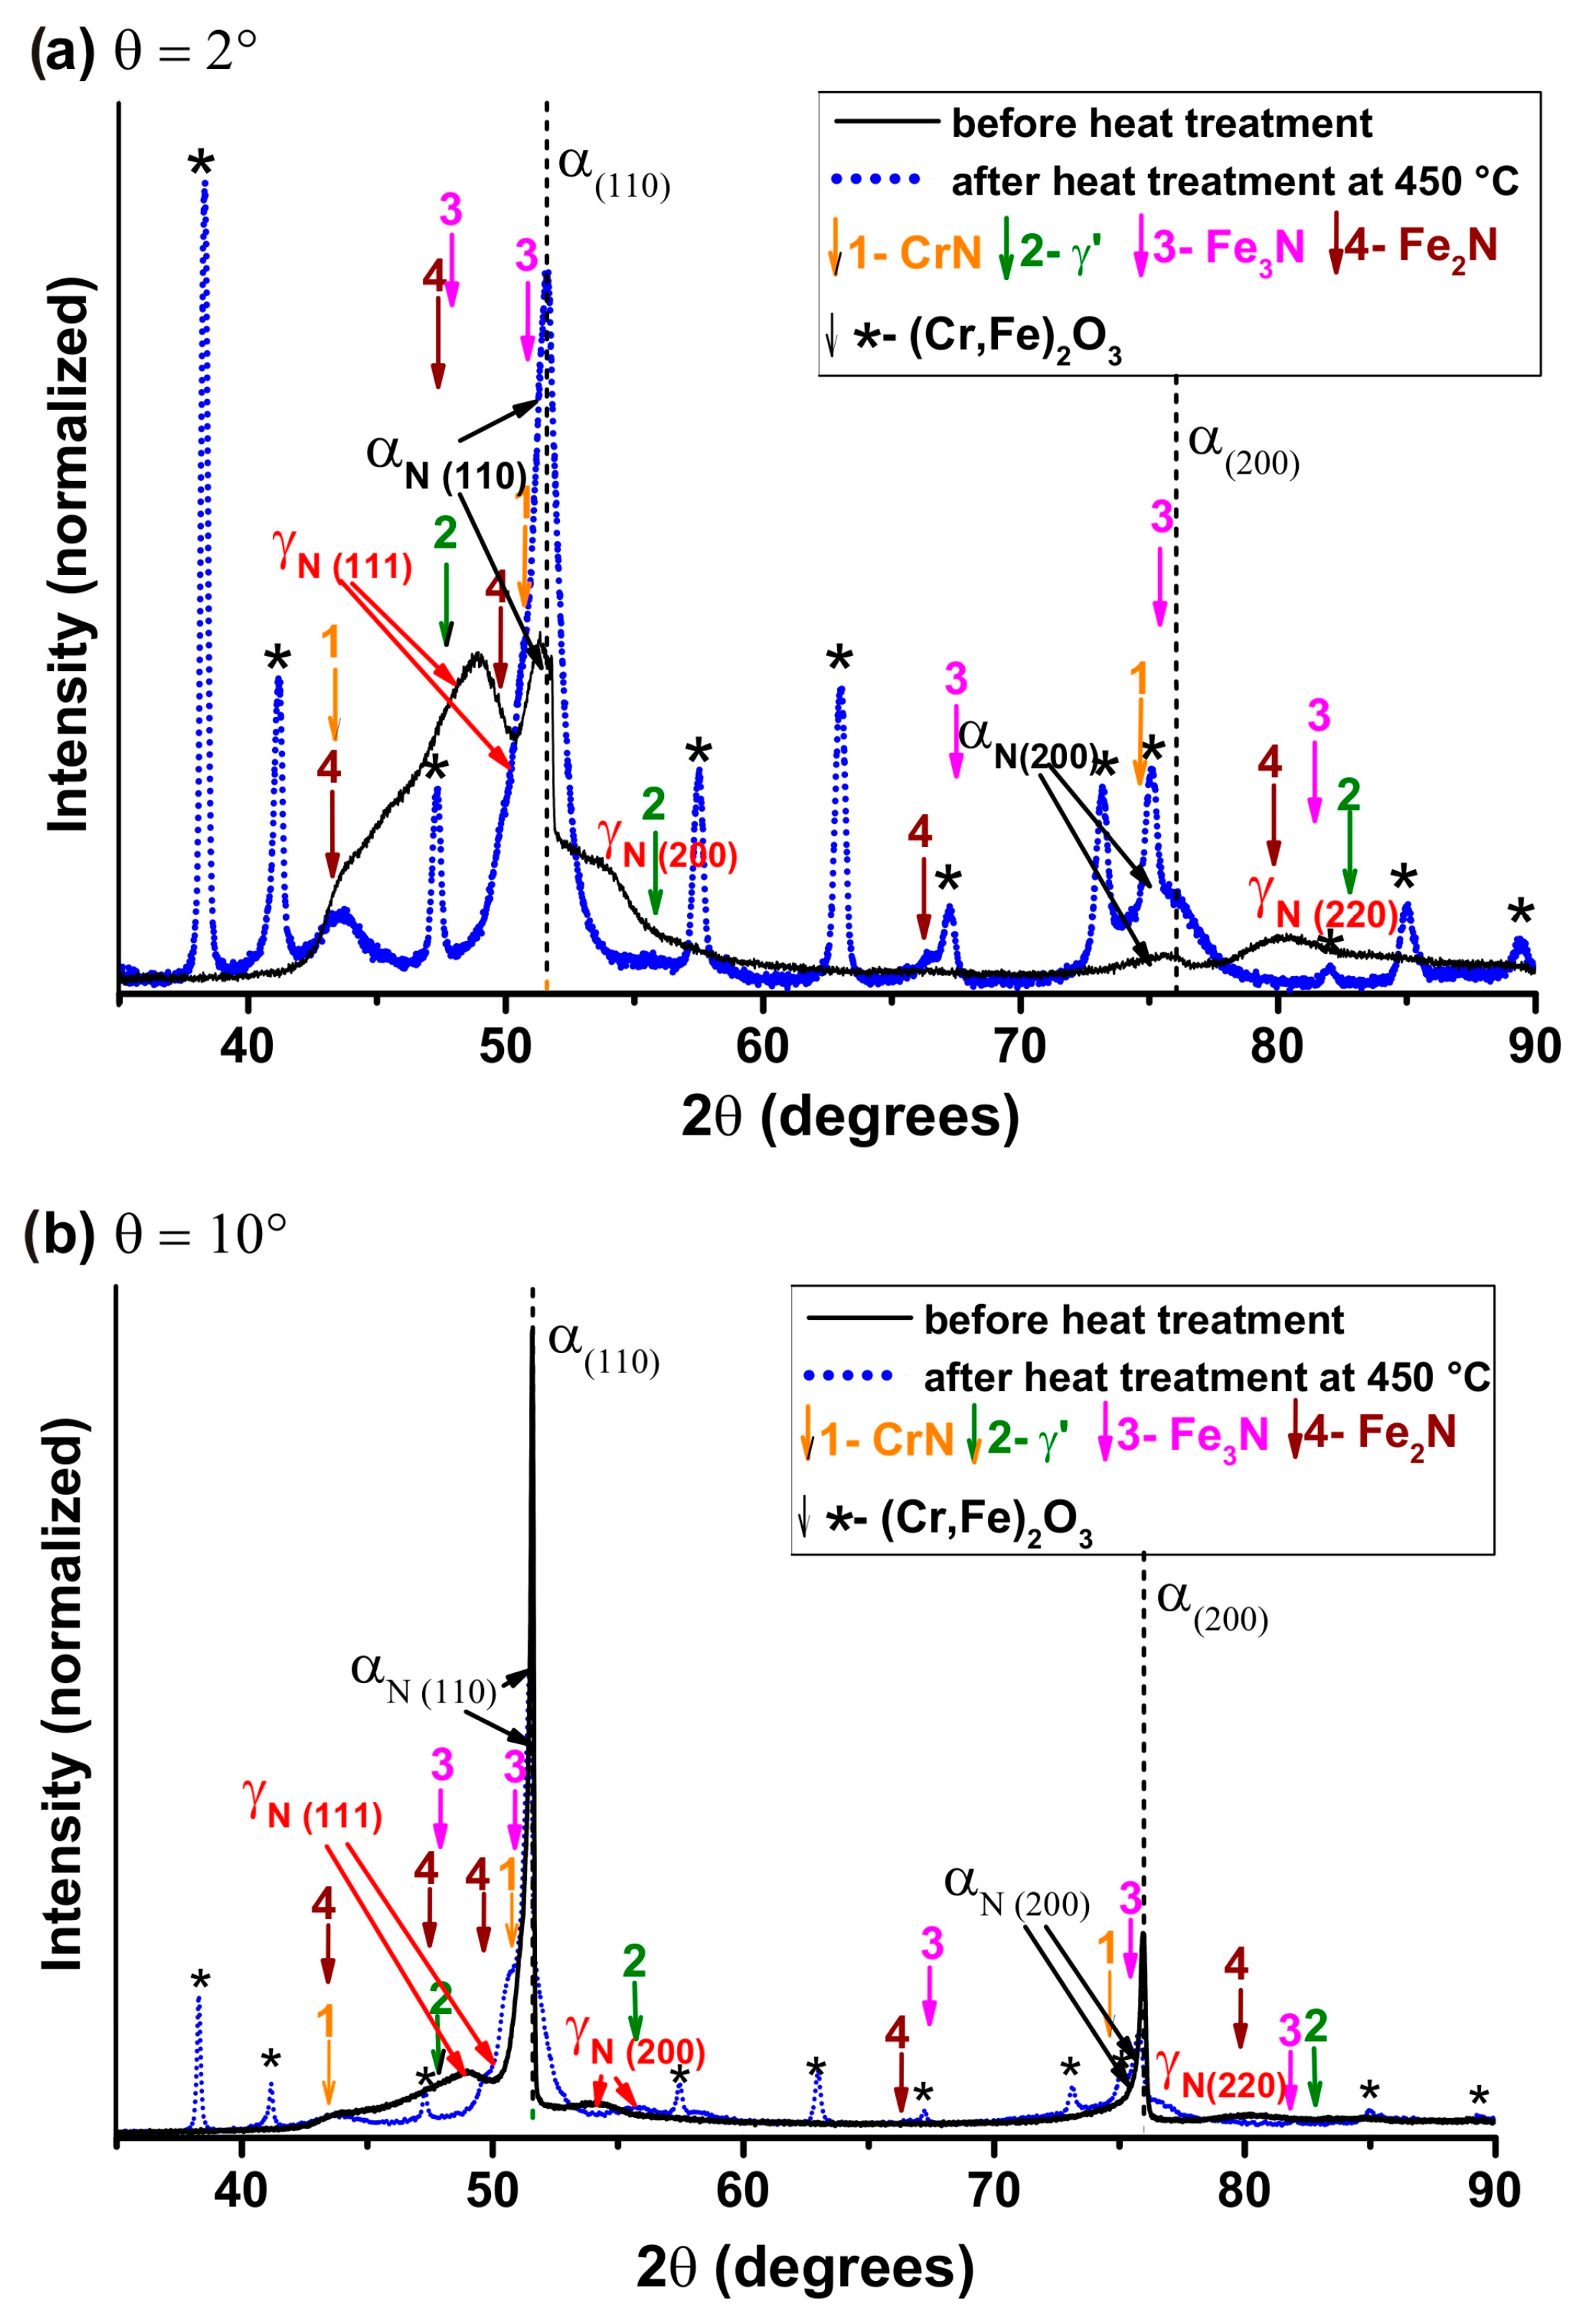
Figure 6a presents the diffractograms, obtained at room temperature with θ = 2°, of the samples nitrided at 300 °C for 6 h before and after the heat treatment. After the heating period, despite the formation of oxides on the sample surface that reduced the beam penetration into the surface, the intensity of the peaks related to the α and CrN phases increased when compared to the diffractogram obtained before the heat treatment. This observation corroborates the hypothesis of the γN phase undergoing transformation into α + CrN. In the UNS S44400 steel, the γN phase cannot become γ due to the absence of Ni and other austenitizing elements in its chemical composition. The peak positions of iron nitrides are indicated in Figure 6a, and one could infer the possible contribution of these peaks, with very low intensity. However, their contributions to the diffractograms are unlikely since peak intensities in the iron nitride region decreased after the heat treatment. The most probable situation before the heat treatment was the modified layer being composed predominantly of γN and αN phases. The approximate lattice parameters of the γN phase, calculated from the peak positions of the γN phase at 47.4° (γN (111)), 54.5° (γN (200)), and 81.3° (γN (220)), were 3.82 Å, 3.87 Å, and 3.85 Å, respectively. After the heat treatment, the γN phase peak positions were displaced to 49.3° (γN (111)), 55.75° (γN (200)), and 85.8° (γN (220)), and the calculated lattice parameters changed to 3.68 Å, 3.79 Å, and 3.68 Å. In the average lattice parameter value (shown in Table 3), calculated from the interplanar distances determined from the γN phase peaks, there was a small deviation in the values, indicating that the values obtained by the XRD analyses were then consistent with each other, corroborating the presence of this phase.
By comparing diffractograms obtained at room temperature with θ = 2° (Figure 6a) and with θ = 10° (Figure 6b), the γN phase was identified as to be concentrated closer to the surface in the modified layer (due to the relative peak intensities), which are those more enriched with nitrogen by the N implantation process. Additionally, the heat treatment gave rise to broad peaks in the 2θ diffraction angles of approximately 51.6° and 75.9°, located close to the α phase peaks. These peaks are related to the transition from γN to α + CrN predicted in the literature [22,27,31,39], resulting from the formation of micro-regions containing nanocrystalline α phase grains that can generate tensile stresses at the grain interfaces with regions rich in γN and αN phases. After the transition, a nitrogen redistribution is possible, as is the formation of randomly oriented crystals of the αN phase.
Similarly observed for the PIII 300 °C 3 h sample, the XRD analyses with θ = 10° (Figure 6 and Figure 7b) carried out on the PIII 300 °C 6 h sample before and after the heat treatment were influenced by the bulk (see Table 2). Thus, the α phase was identified in these diffractograms. In the XRD analyses carried out with θ = 2° (Figure 7a), the α phase was also identified in the diffractograms after the heat treatment due to the transition of γN to α + CrN, discussed previously.
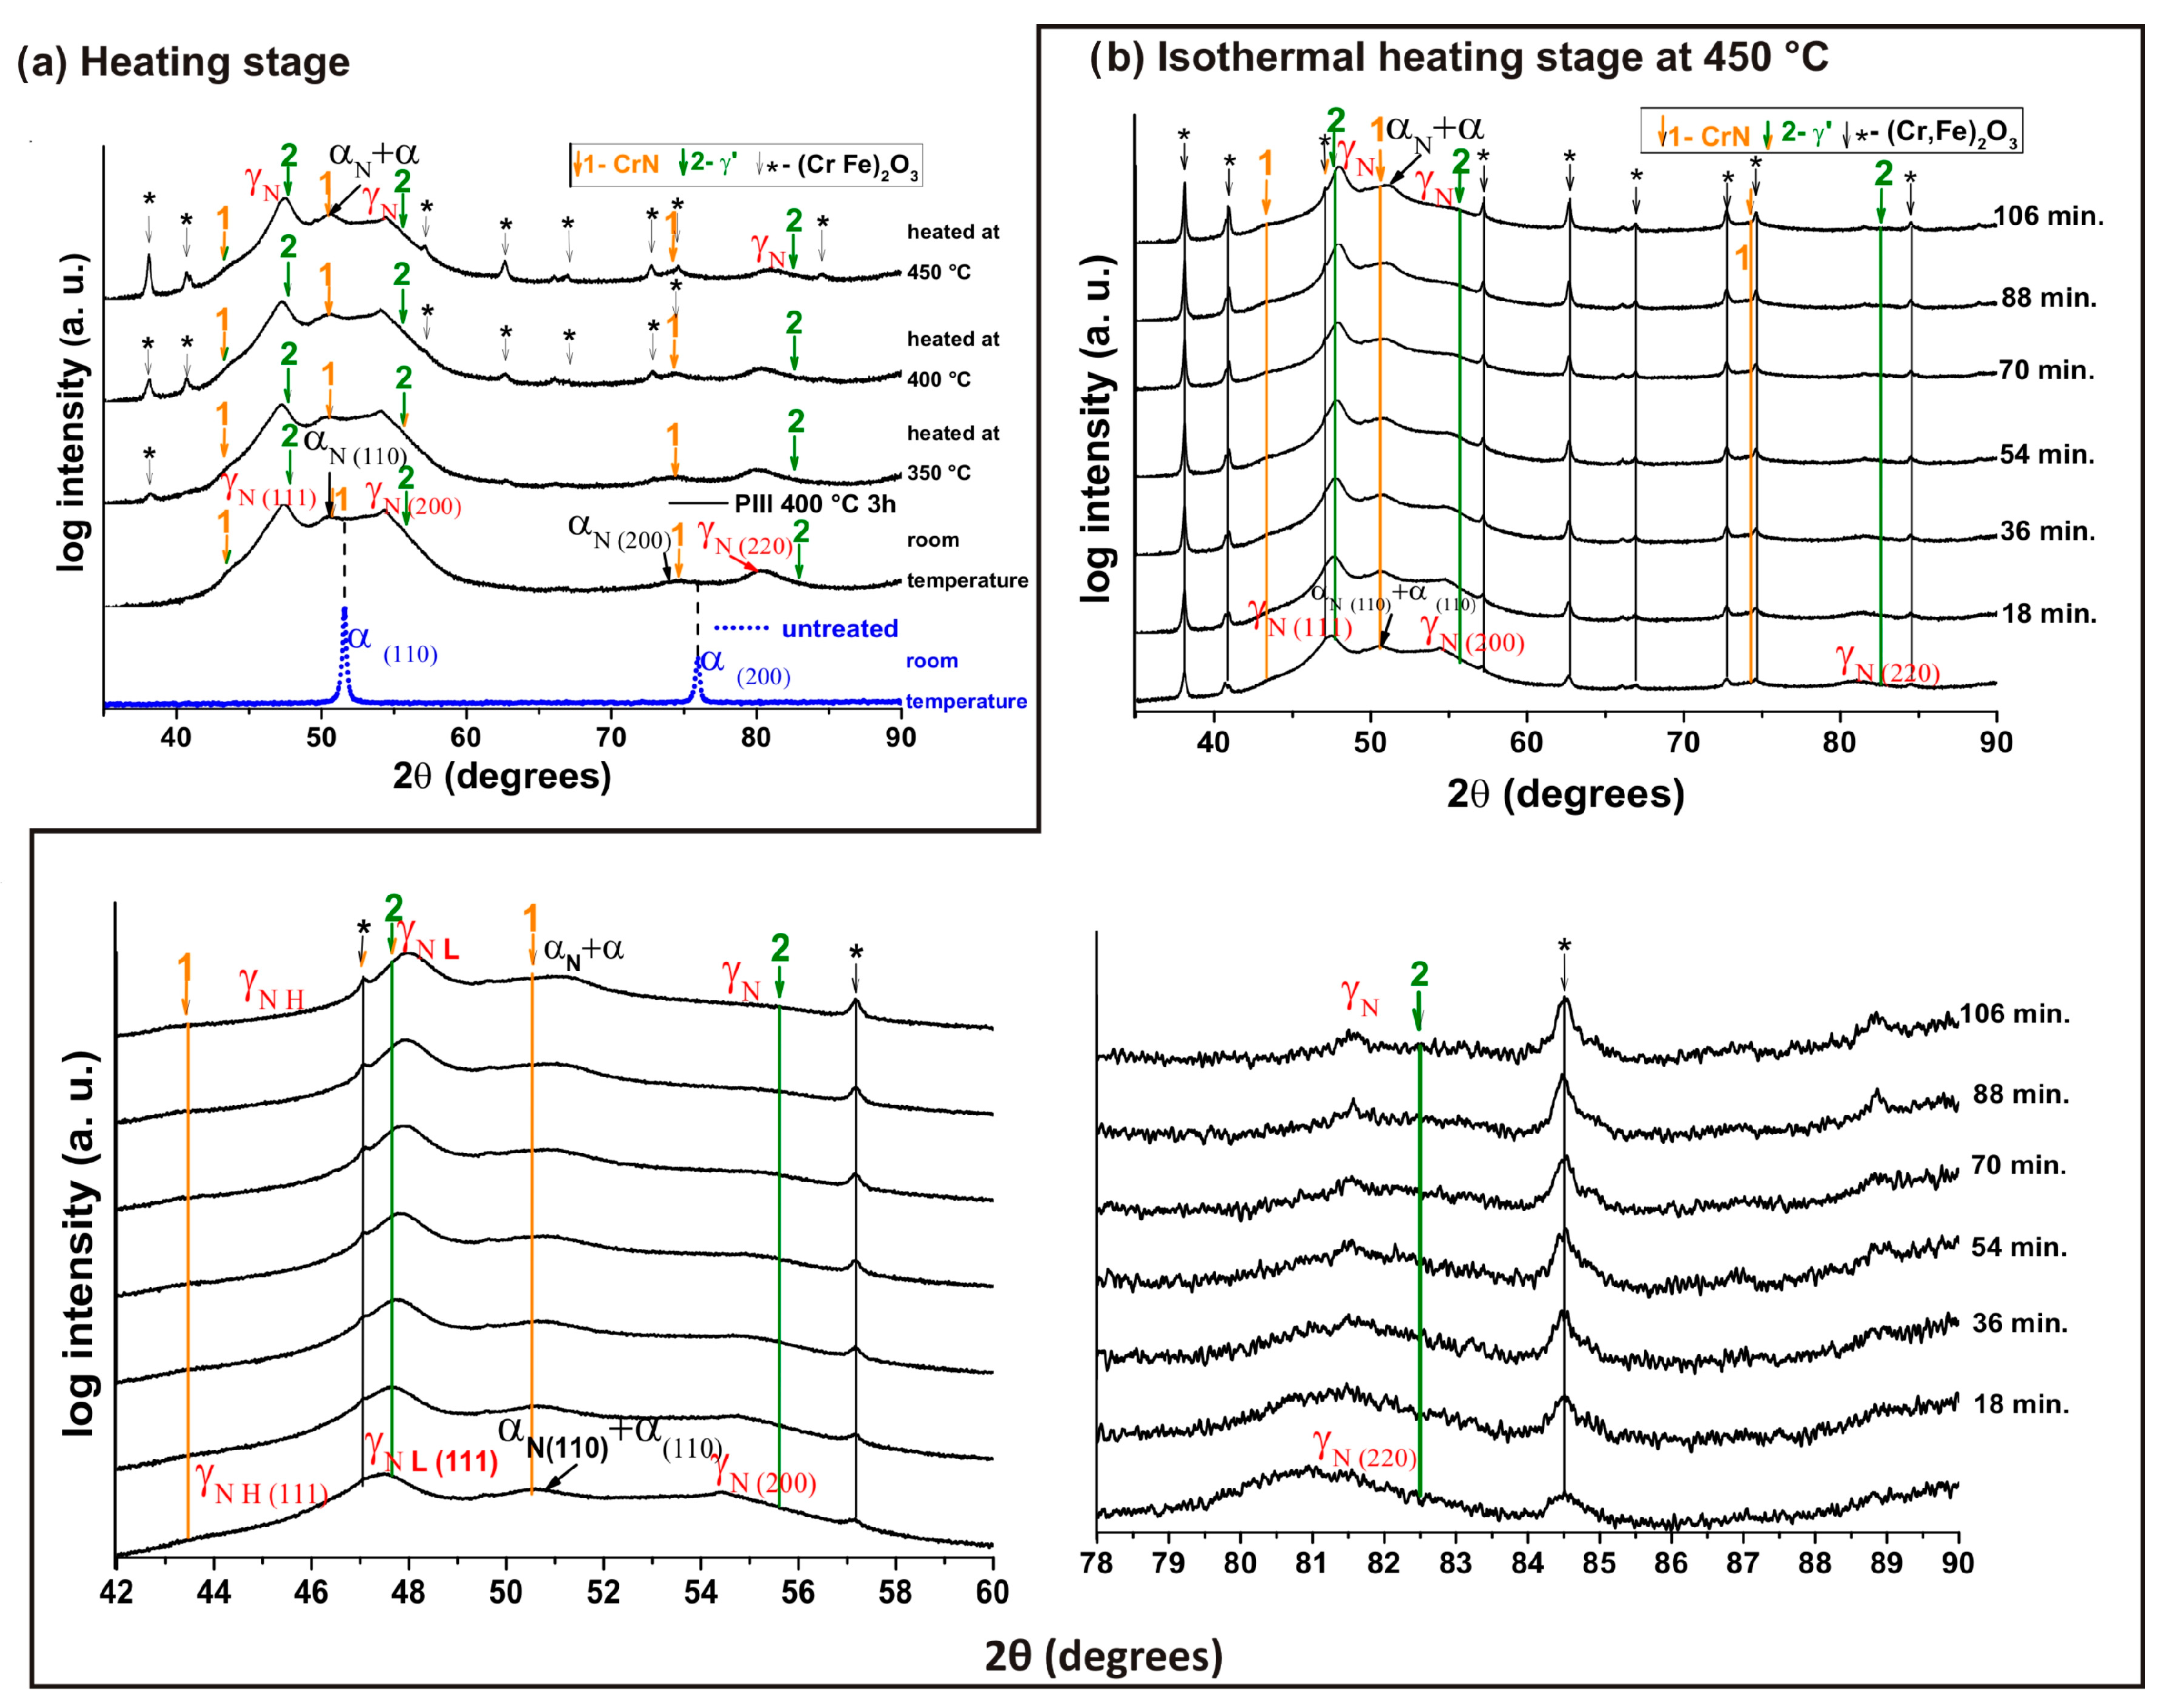
In Figure 7a, X-ray diffractograms of UNS S44400 steel samples nitrided at 400 °C for 3 h are shown. In this sample, where ion fluency (Table 1) increased due to the increase in frequency, the presence of the γN phase was more evident than in the 300 °C 6 h condition. In addition to the γN phase, diffractograms presented peaks relative to αN and CrN phases. During the heating period, although it may seem that the γN phase peaks did not change position until 350 °C, it actually means that the effects of thermal expansion and N diffusion occurred simultaneously and were (fortuitously) equivalent, so that the angular positions remained almost unchanged. At 450 °C (Figure 7a), the reduction in interplanar distances instead of thermal expansion was evident in the peaks related to the expanded phases due to nitrogen diffusion in the heating period.
During the isothermal period, shown in Figure 7b, it became more evident that γN peaks separated into two contributions, low-expansion (γN L) and high-expansion (γN H) γN phases, the same as observed in the 300 °C6 h sample (Figure 5b). All γN and αN peaks shifted to lower interplanar distances at this period. Prior to the heating period, lattice parameters calculated for γN H at 47.5° (γN (111)), 54.4° (γN (200)), and 80.2° (γN (220)) were 3.81 Å, 3.87 Å, and 3.89 Å, respectively. After the heat treatment, the peak positions of the γN phase displaced to 48.0° (γN (111)), 54.8° (γN (200)), and 82.2° (γN (220)), which corresponded to the lattice parameters 3.77Å, 3.85Å, and 3.81Å. These values were similar to each other before and after the heating period, as also observed for the 300 °C 6 h condition. However, the change in the lattice parameter after the heat treatment was smaller in the 400 °C 3 h sample than in the 300 °C 6 h, perhaps because N at the outermost surface (probed by X-rays) would need a much longer time to undergo a significant thermal diffusion within the thicker layer. In the diffractograms collected during the isothermal period, shown in Figure 7b, the CrN phase contribution increased with time.
There was no influence of the substrate in any of the XRD analyses carried out on the sample at 400 °C for 3 h due to the modified layer being much thicker (see Table 2) than the penetration depth of the XRD beam (~4 μm). Therefore, the alpha phase was not identified in the XRD analyses of this sample before the heat treatment at room temperature. After heating, as observed for the sample PIII 300 °C 6 h, the results indicate a transition from γN to α + CrN.
After the heat treatments, significant formations of iron oxides and chromium nitrides were observed only in the 300 °C 6 h and 400 °C 3 h samples, nitrided with the highest ionic fluences and both presenting the γN phase in the modified layer. As previously mentioned, the formation of oxides in these samples can also be related to the entrapment process of N by Cr [45]. The precipitation of chromium nitrides can be attributed to the high nitrogen content attained on the surfaces rich in the γN phase, which may hinder Cr mobility and decelerate nitrogen diffusion [27,39,46]. Furthermore, according to the literature, in the crystalline lattice, there is greater coherence between CrN and γN phases than between CrN and γ phases, favoring the formation of CrN under high-nitrogen-content conditions [39]. Peaks of the γ′ and ε phases should have appeared in the diffractograms, but less significantly than the expanded phases γN and αN; however, it was not possible to clearly index these phases due to the strong overlapping of peaks.

4. Conclusions

In the nitrided sample at 300 °C for 3 h, which is a typical treatment time in PIII, the αN phase was the predominant phase produced. Augmented ion fluences, attained either by increasing the treatment time from 3 h to 6 h (300 °C 6 h sample) or by increasing the temperature (400 °C 3 h sample), allowed the formation of the γN phase in the modified UNS S44400 stainless steel surfaces.
During the heat treatment of the treated surfaces, the structure evolution was monitored in situ, and the transformation of metastable expanded phases was featured mainly by a reduction in the lattice parameter, related to nitrogen diffusion. The ε and γ′ iron nitrides, if present on the nitrided surfaces, were in low amounts and not clearly detected in the XRD analyses.
During the isothermal period, the formation of CrN and contributions of the α phase peaks in the diffractograms were more evident, corroborating the possible transition from γN into α + CrN. A significant formation of oxides was observed after the heat treatments on the surfaces nitrided under the highest ion fluences and with the γN phase on the modified layer. Although it needs further investigation, in fact, this evidence points to a formation of the γN phase.
The αN phase in the sample PIII 300 °C 3 h remained as the predominant phase after the heat treatment, with no identifiable decay into CrN and oxides. These findings are of interest for corrosion protection applications.

Author Contributions

Conceptualization, B.C.E.S.K. and C.M.L.; methodology, B.C.E.S.K., C.M.L., W.R.d.O. and G.B.d.S.; formal analysis, B.C.E.S.K., C.M.L., W.R.d.O., G.B.d.S., F.C.S., R.P.C., J.C.K.d.N. and P.C.B.; investigation, B.C.E.S.K., C.M.L., R.P.C., J.C.K.d.N. and P.C.B.; resources, C.M.L.; data curation, B.C.E.S.K.; writing—original draft preparation, B.C.E.S.K. and C.M.L.; writing—review and editing, B.C.E.S.K., C.M.L., W.R.d.O., G.B.d.S., F.C.S., R.P.C., J.C.K.d.N. and P.C.B. All authors have read and agreed to the published version of the manuscript.

Funding

This work was part of the NESAP project (PRONEX CNPq/Fundação Araucária 15/2017). Bruna Kurelo was supported by a postdoctoral research scholarship, PNPD, granted by the Coordination for the Improvement of Higher Education Personnel during the completion of this research.

Data Availability Statement

The data used in this research are available in the article.

Acknowledgments

The authors thank the Villares Metals Company for the donation of the SFSS, C-LABMU/UEPG, and CMCM/UTFPR for the use of characterization facilities and LNLS for the synchrotron XRD analyses (proposal 20190153).

Conflicts of Interest

The authors declare no conflict of interest.

References

  1. Alphonsa, J.; Mukherjee, S.; Raja, V.S. Study of Plasma Nitriding and Nitrocarburising of AISI 430F Stainless Steel for High Hardness and Corrosion Resistance. Corros. Eng. Sci. Technol. 2018, 53, 51–58. [Google Scholar] [CrossRef]
  2. De Araújo, E.; Bandeira, R.M.; Manfrinato, M.D.; Moreto, J.A.; Borges, R.; Vales, S.D.S.; Suzuki, P.A.; Rossino, L.S. Effect of Ionic Plasma Nitriding Process on the Corrosion and Micro-Abrasive Wear Behavior of AISI 316L Austenitic and AISI 470 Super-Ferritic Stainless Steels. J. Mater. Res. Technol. 2019, 8, 2180–2191. [Google Scholar] [CrossRef]
  3. Gontijo, L.C.; Machado, R.; Casteletti, L.C.; Kuri, S.E.; Nascente, P.A.P. X-Ray Diffraction Characterisation of Expanded Austenite and Ferrite in Plasma Nitrided Stainless Steels. Surf. Eng. 2010, 26, 265–270. [Google Scholar] [CrossRef]
  4. Li, L.; Liu, R.; Liu, Q.; Wu, Z.; Meng, X.; Fang, Y. Effects of Initial Microstructure on the Low-Temperature Plasma Nitriding of Ferritic Stainless Steel. Coatings 2022, 12, 1404. [Google Scholar] [CrossRef]
  5. Tadepalli, L.D.; Gosala, A.M.; Kondamuru, L.; Bairi, S.C.; Subbiah, R.; Singh, S.K. A Review on Effects of Nitriding of AISI409 Ferritic Stainless Steel. Mater. Today Proc. 2020, 26, 1014–1020. [Google Scholar] [CrossRef]
  6. Jimenez, L.B.V.; Umemura, M.T.; Calderón-Hernández, J.W.; Magnabosco, R.; Pinedo, C.E.; Tschiptschin, A.P. Plasma Nitriding of 410S Ferritic/Martensitic Stainless Steel: Microstructure, Wear and Corrosion Properties. Tecnol. Metal. Mater. Mineração 2023, 20, e2809. [Google Scholar] [CrossRef]
  7. Borgioli, F. The “Expanded” Phases in the Low-Temperature Treated Stainless Steels: A Review. Metals 2022, 12, 331. [Google Scholar] [CrossRef]
  8. Blawert, C.; Mordike, B.L.; Rensch, U.; Oettel, H. The Effect of HV in the Nitriding of Ferritic Steels by Plasma Immersion Ion Implantation. Surf. Coatings Technol. 2001, 142–144, 376–383. [Google Scholar] [CrossRef]
  9. Schreiber, G.; Rensch, U.; Oettel, H.; Blawert, C.; Mordike, B.L. Thermal Stability of PI 3 Nitrided Surface Layers on Ferritic Steels. Surf. Coat. Technol. 2003, 170, 447–451. [Google Scholar] [CrossRef]
  10. Manova, D.; Eichentopf, I.-M.; Hirsch, D.; Mandl, S.; Neumann, H.; Rauschenbach, B. Influence of Microstructure on Nitriding Properties of Stainless Steel. IEEE Trans. Plasma Sci. 2006, 34, 1136–1140. [Google Scholar] [CrossRef]
  11. Schibicheski Kurelo, B.C.E.; de Souza, G.B.; Serbena, F.C.; Lepienski, C.M.; Borges, P.C. Mechanical Properties and Corrosion Resistance of AN-Rich Layers Produced by PIII on a Super Ferritic Stainless Steel. Surf. Coatings Technol. 2020, 403, 126388. [Google Scholar] [CrossRef]
  12. Luiz, L.A.; Kurelo, B.C.E.S.; de Souza, G.B.; de Andrade, J.; Marino, C.E.B. Effect of Nitrogen Plasma Immersion Ion Implantation on the Corrosion Protection Mechanisms of Different Stainless Steels. Mater. Today Commun. 2021, 201, 8131–8135. [Google Scholar] [CrossRef]
  13. Schibicheski Kurelo, B.C.E.; de Souza, G.B.; Serbena, F.C.; Lepienski, C.M.; Chuproski, R.F.; Borges, P.C. Improved Saline Corrosion and Hydrogen Embrittlement Resistances of Superaustenitic Stainless Steel by PIII Nitriding. J. Mater. Res. Technol. 2022, 18, 1717–1731. [Google Scholar] [CrossRef]
  14. Borgioli, F. From Austenitic Stainless Steel to Expanded Austenite-s Phase: Formation, Characteristics and Properties of an Elusive Metastable Phase. Metals 2020, 10, 187. [Google Scholar] [CrossRef]
  15. Blawert, C.; Mordike, B.L.; Jirásková, Y.; Schneeweiss, O. Structure and Composition of Expanded Austenite Produced by Nitrogen Plasma Immersion Ion Implantation of Stainless Steels X6CrNiTi1810 and X2CrNiMoN2253. Surf. Coatings Technol. 1999, 116, 189–198. [Google Scholar] [CrossRef]
  16. Fernandes, F.A.P.; Casteletti, L.C.; Gallego, J. Microstructure of Nitrided and Nitrocarburized Layers Produced on a Superaustenitic Stainless Steel. J. Mater. Res. Technol. 2013, 2, 158–164. [Google Scholar] [CrossRef]
  17. Stróz, D.; Psoda, M. TEM Studies of Plasma Nitrided Austenitic Stainless Steel. J. Microsc. 2010, 237, 227–231. [Google Scholar] [CrossRef] [PubMed]
  18. Che, H.L.; Lei, M.K. Microstructure of Perfect Nitrogen-Expanded Austenite Formed by Unconstrained Nitriding. Scr. Mater. 2021, 194, 113705. [Google Scholar] [CrossRef]
  19. Blawert, C.; Weisheit, A.; Mordike, B.L.; Knoop, R.M. Plasma Immersion Ion Implantation of Stainless Steel: Austenitic Stainless Steel in Comparison to Austenitic-Ferritic Stainless Steel. Surf. Coatings Technol. 1996, 85, 15–27. [Google Scholar] [CrossRef]
  20. Alphonsa, J.; Raja, V.S.; Mukherjee, S. Study of Plasma Nitriding and Nitrocarburizing for Higher Corrosion Resistance and Hardness of 2205 Duplex Stainless Steel. Corros. Sci. 2015, 100, 121–132. [Google Scholar] [CrossRef]
  21. Núñez de la Rosa, Y.E.; Palma Calabokis, O.; Borges, P.C.; Ballesteros Ballesteros, V. Effect of Low-Temperature Plasma Nitriding on Corrosion and Surface Properties of Duplex Stainless Steel UNS S32205. J. Mater. Eng. Perform. 2020, 29, 2612–2622. [Google Scholar] [CrossRef]
  22. Jirásková, Y.; Blawert, C.; Schneeweiss, O. Thermal Stability of Stainless Steel Surfaces Nitrided by Plasma Immersion Ion Implantation. Phys. Stat. Sol. (a) 1999, 175, 537–548. [Google Scholar] [CrossRef]
  23. Piekoszewski, J.; Sartowska, B.; Waliś, L.; Werner, Z.; Kopcewicz, M.; Prokert, F.; Stanisławski, J.; Kalinowska, J.; Szymczyk, W. Interaction of Nitrogen Atoms in Expanded Austenite Formed in Pure Iron by Intense Nitrogen Plasma Pulses. Nukleonika 2004, 49, 57–60. [Google Scholar]
  24. Manne, V.; Singh, S.K.; Sateesh, N.; Ram, S. A Review on Influence of Nitriding on AISI430 Ferritic Stainless Steel. Mater. Today Proc. 2020, 26, 1010–1013. [Google Scholar] [CrossRef]
  25. Sasidhar, K.N.; Meka, S.R. Thermodynamic Reasoning for Colossal N Supersaturation in Austenitic and Ferritic Stainless Steels during Low-Temperature Nitridation. Sci. Rep. 2019, 9, 7996. [Google Scholar] [CrossRef]
  26. Wang, D.; Kahn, H.; Ernst, F.; Heuer, A.H. “Colossal” Interstitial Supersaturation in Delta Ferrite in Stainless Steels: (II) Low-Temperature Nitridation of the 17-7 PH Alloy. Acta Mater. 2017, 124, 237–246. [Google Scholar] [CrossRef]
  27. Manova, D.; Mändl, S.; Neumann, H.; Rauschenbach, B. Formation of Metastable Diffusion Layers in Cr-Containing Iron, Cobalt and Nickel Alloys after Nitrogen Insertion. Surf. Coatings Technol. 2017, 312, 81–90. [Google Scholar] [CrossRef]
  28. Manova, D.; Lutz, J.; Gerlach, J.W.; Neumann, H.; Mändl, S. Relation between Lattice Expansion and Nitrogen Content in Expanded Phase in Austenitic Stainless Steel and CoCr Alloys. Surf. Coatings Technol. 2011, 205, S290–S293. [Google Scholar] [CrossRef]
  29. Tschiptschin, A.P.; Nishikawa, A.S.; Varela, L.B.; Pinedo, C.E. Thermal Stability of Expanded Austenite Formed on a DC Plasma Nitrided 316L Austenitic Stainless Steel. Thin Solid Films 2017, 644, 156–165. [Google Scholar] [CrossRef]
  30. Borgioli, F. The Corrosion Behavior in Different Environments of Austenitic Stainless Steels Subjected to Thermochemical Surface Treatments at Low Temperatures: An Overview. Metals 2023, 13, 776. [Google Scholar] [CrossRef]
  31. Brink, B.; Ståhl, K.; Christiansen, T.L.; Somers, M.A.J. Thermal Expansion and Phase Transformations of Nitrogen-Expanded Austenite Studied with in Situ Synchrotron X-Ray Diffraction. J. Appl. Crystallogr. 2014, 47, 819–826. [Google Scholar] [CrossRef]
  32. Somers, M.A.J.; van der Pers, N.M.; Schalkoord, D.; Mittemeijer, E.J. Dependence of the Lattice Parameter of γ′ Iron Nitride, Fe4N, on Nitrogen Content; Accuracy of the Nitrogen Absorption Data. Metall. Trans. A 1989, 20, 1533–1539. [Google Scholar] [CrossRef]
  33. Mayrhofer, P.H.; Tischler, G.; Mitterer, C. Microstructure and Mechanical/Thermal Properties of Cr-N Coatings Deposited by Reactive Unbalanced Magnetron Sputtering. Surf. Coatings Technol. 2001, 142–144, 78–84. [Google Scholar] [CrossRef]
  34. Chen, H.Y.; Tsai, C.J.; Lu, F.H. The Young’s Modulus of Chromium Nitride Films. Surf. Coatings Technol. 2004, 184, 69–73. [Google Scholar] [CrossRef]
  35. Bian, L.; Chen, Z.; Wang, L.; Li, F.; Chou, K. Oxidation Resistance, Thermal Expansion and Area Specific Resistance of Fe-Cr Alloy Interconnector for Solid Oxide Fuel Cell. J. Iron Steel Res. Int. 2017, 24, 77–83. [Google Scholar] [CrossRef]
  36. Wojdyr, M. Fityk: A General-Purpose Peak Fitting Program. J. Appl. Crystallogr. 2010, 43, 1126–1128. [Google Scholar] [CrossRef]
  37. de Oliveira, W.R.; Chuproski, R.F.; Valadão, G.M.; Cintho, O.M.; de Souza, E.C.F.; Serbena, F.C.; de Souza, G.B. Symmetry between the Anisotropic N Behavior in the Lattice under High Pressures and the Formation of Expanded Austenite. J. Alloys Compd. 2021, 871, 159509. [Google Scholar] [CrossRef]
  38. Fernandes, B.B.; Mändl, S.; Oliveira, R.M.; Ueda, M. Mechanical Properties of Nitrogen-Rich Surface Layers on SS304 Treated by Plasma Immersion Ion Implantation. Appl. Surf. Sci. 2014, 310, 278–283. [Google Scholar] [CrossRef]
  39. Christiansen, T.; Somers, M.A.J. Decomposition Kinetics of Expanded Austenite with High Nitrogen Contents. Int. J. Mater. Res. 2006, 97, 79–88. [Google Scholar] [CrossRef]
  40. Galdikas, A. The Anisotropic Stress-Induced Di Ff Usion and Trapping of Nitrogen in Austenitic Stainless Steel during Nitriding. Metals 2020, 10, 1319. [Google Scholar] [CrossRef]
  41. Moskalioviene, T.; Galdikas, A. Crystallographic Orientation Dependence of Nitrogen Mass Transport in Austenitic Stainless Steel. Metals 2020, 10, 615. [Google Scholar] [CrossRef]
  42. Christiansen, T.; Somers, M.A.J. On the Crystallographic Structure of S-Phase. Scr. Mater. 2004, 50, 35–37. [Google Scholar] [CrossRef]
  43. Ye, S.; Cao, Y. Structure of Iron Nitrides under Different Nitridation Temperatures. In Proceedings of the AMITP 2016, Guilin, China, 24–25 September 2016; Zheng, Z., Zhuo, X., Eds.; Atlantis Press: Guilin, China, 2016; pp. 6–9. [Google Scholar]
  44. Rohith, K.V.; Saravanan, P.; Sakar, M.; Balakumar, S. Insights into the Nitridation of Zero-Valent Iron Nanoparticles for the Facile Synthesis of Iron Nitride Nanoparticles. RSC Adv. 2016, 6, 45850–45857. [Google Scholar] [CrossRef]
  45. Cao, Y.; Norell, M. Role of Nitrogen Uptake during the Oxidation of 304L and 904L Austenitic Stainless Steels. Oxid. Met. 2013, 80, 479–491. [Google Scholar] [CrossRef]
  46. Manova, D.; Lotnyk, A.; Mändl, S.; Neumann, H.; Rauschenbach, B. CrN Precipitation and Elemental Segregation during the Decay of Expanded Austenite. Mater. Res. Express 2016, 3, 066502. [Google Scholar] [CrossRef]
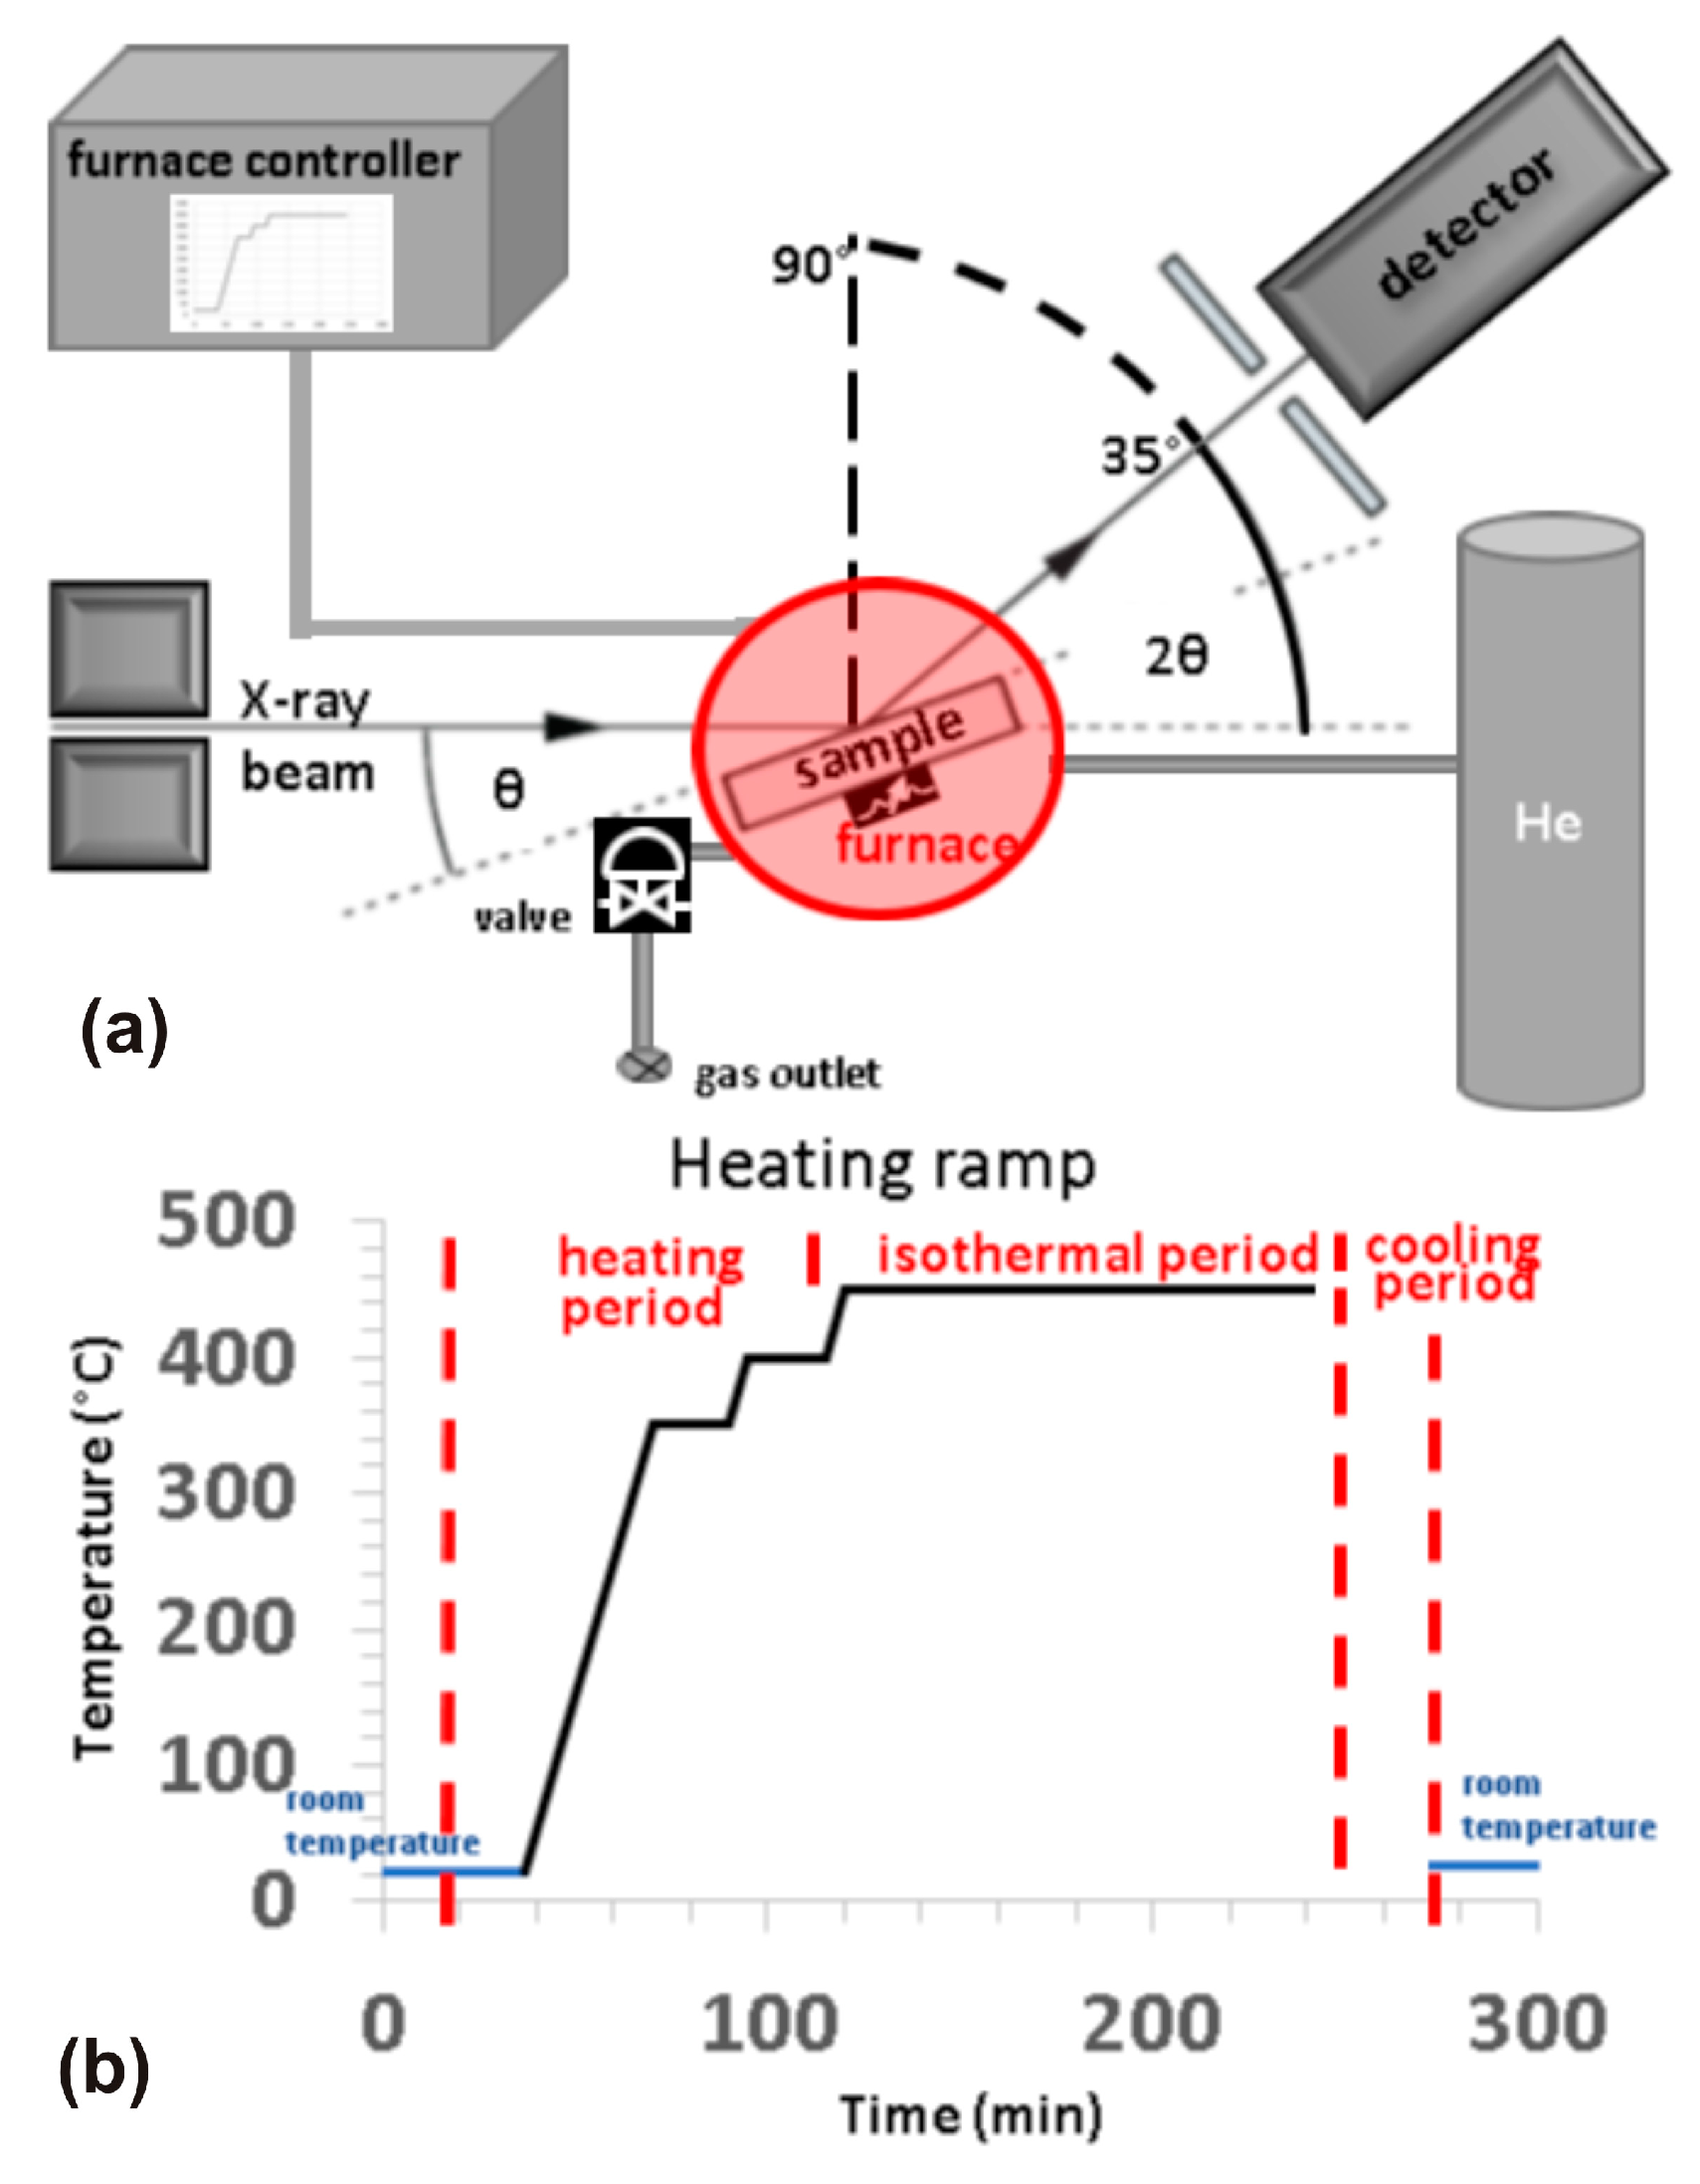
Figure 1. (a) Schematic diagram of ISS-XRD experiment, where the temperature varied according to (b) heating ramp.
Metals 13 01744 g001
Figure 2. Cross-section FEG-SEM and OM images for the nitrogen-implanted super ferritic steel before and after thermal treatment (HT), etched with Murakami’s reagent.
Metals 13 01744 g002
Figure 3. The nitrogen concentration, in wt.%, obtained by WDS point analysis measured on top and cross sections of nitrided samples before and after heat treatment.
Metals 13 01744 g003
Figure 4. X-ray diffractograms of UNS S44400 steel samples nitrided by PIII at 300 °C for 3 h obtained in situ (θ = 10°) during heat treatment: (a) in the heating period and (b) in the isothermal period at 450 °C for 2 h. The diffractograms of the nitrided samples with θ = 2°, before and after the heat treatment, are presented in (c). A diffractogram of the untreated sample is presented for comparison.
Metals 13 01744 g004
Figure 5. X-ray diffractograms of UNS S44400 steel samples nitrided by PIII at 300 °C for 6 h, obtained in situ (θ = 10°): (a) in the heating period and (b) in the isothermal period at 450 °C for 2 h with a detailed view of the different phases at different 2θ angular positions.
Metals 13 01744 g005
Figure 6. Diffractograms of samples nitrided at 300 °C for 6 h obtained at room temperature, before and after the heat treatment with different grazing incidence angle (θ): (a) θ = 2° and (b) θ = 10°.
Metals 13 01744 g006
Figure 7. X-ray diffractograms of UNS S44400 steel samples nitrided by PIII at 400 °C for 3 h, obtained in situ with θ = 10°: (a) in the heating period; (b) in the isothermal period at 450 °C for 2 h with a detailed view of the different phases at different 2θ angular positions.
Metals 13 01744 g007
Table 1. Average parameters of the Plasma Immersion Ion Implantation treatments.
SampleNitriding Parameters
Temperature
(°C)
Time (h)Frequency—f (Hz)Current Density—j (mA/cm2)Ion Fluence—Γ (ions/cm2)
Untreated---------------
PIII 300 °C 3 h300 °C37287.8 ± 0.22.5 × 1018
PIII 300 °C 6 h300 °C67287.7 ± 0.25.0 × 1018
PIII 400 °C 3 h400 °C398113.1 ± 0.15.7 × 1018
Table 2. Average layer thicknesses of the nitrogen-implanted super ferritic steel before and after thermal treatment (HT). The layer thicknesses were measured by SEM and Optical Microscopy on the etched cross-section samples.
SampleThickness (µm)
PIII 300 °C 3 h1.1 ± 0.1
PIII 300 °C 3 h HT2.1 ± 0.3
PIII 300 °C 6 h1.3 ± 0.2
PIII 300 °C 6 h HT3.2 ± 0.2
PIII 400 °C 3 h9.3 ± 1.3
PIII 400 °C 3 h HT13.3 ± 1.4
Table 3. Calculated values for average lattice parameters from XRD patterns obtained at room temperature before and after heat treatment (HT).
SampleAverage Lattice Parameter (Å)
αNγN
PIII 300 3 h2.91 ± 0.01---
PIII 300 3 h HT2.90 ± 0.01---
PIII 300 6 h2.91 ±0.013.85 ± 0.03
PIII 300 6 h HT2.91 ± 0.013.71 ± 0.06
PIII 400 3 h2.90 ± 0.033.86 ± 0.04
PIII 400 3 h HT2.90 ± 0.023.81± 0.04
Disclaimer/Publisher’s Note: The statements, opinions and data contained in all publications are solely those of the individual author(s) and contributor(s) and not of MDPI and/or the editor(s). MDPI and/or the editor(s) disclaim responsibility for any injury to people or property resulting from any ideas, methods, instructions or products referred to in the content.