
Physical Factors Controlling Large Shape Memory Effect in FCC ↔ HCP Martensitic Transformation in CrMnFeCoNi High-Entropy-Alloy Single Crystals

Abstract
:1. Introduction
2. Materials and Methods
2.1. Preparation of Single Crystals and Samples for Testing
2.2. Optical and Microstructural Studies
2.3. Thermal Transformation Studies
2.4. Mechanical Studies
3. Results
3.1. Thermal Transformation Behavior
3.2. Temperature Dependence of Yield Stress
3.3. Shape Memory Effect under External Tensile Stress
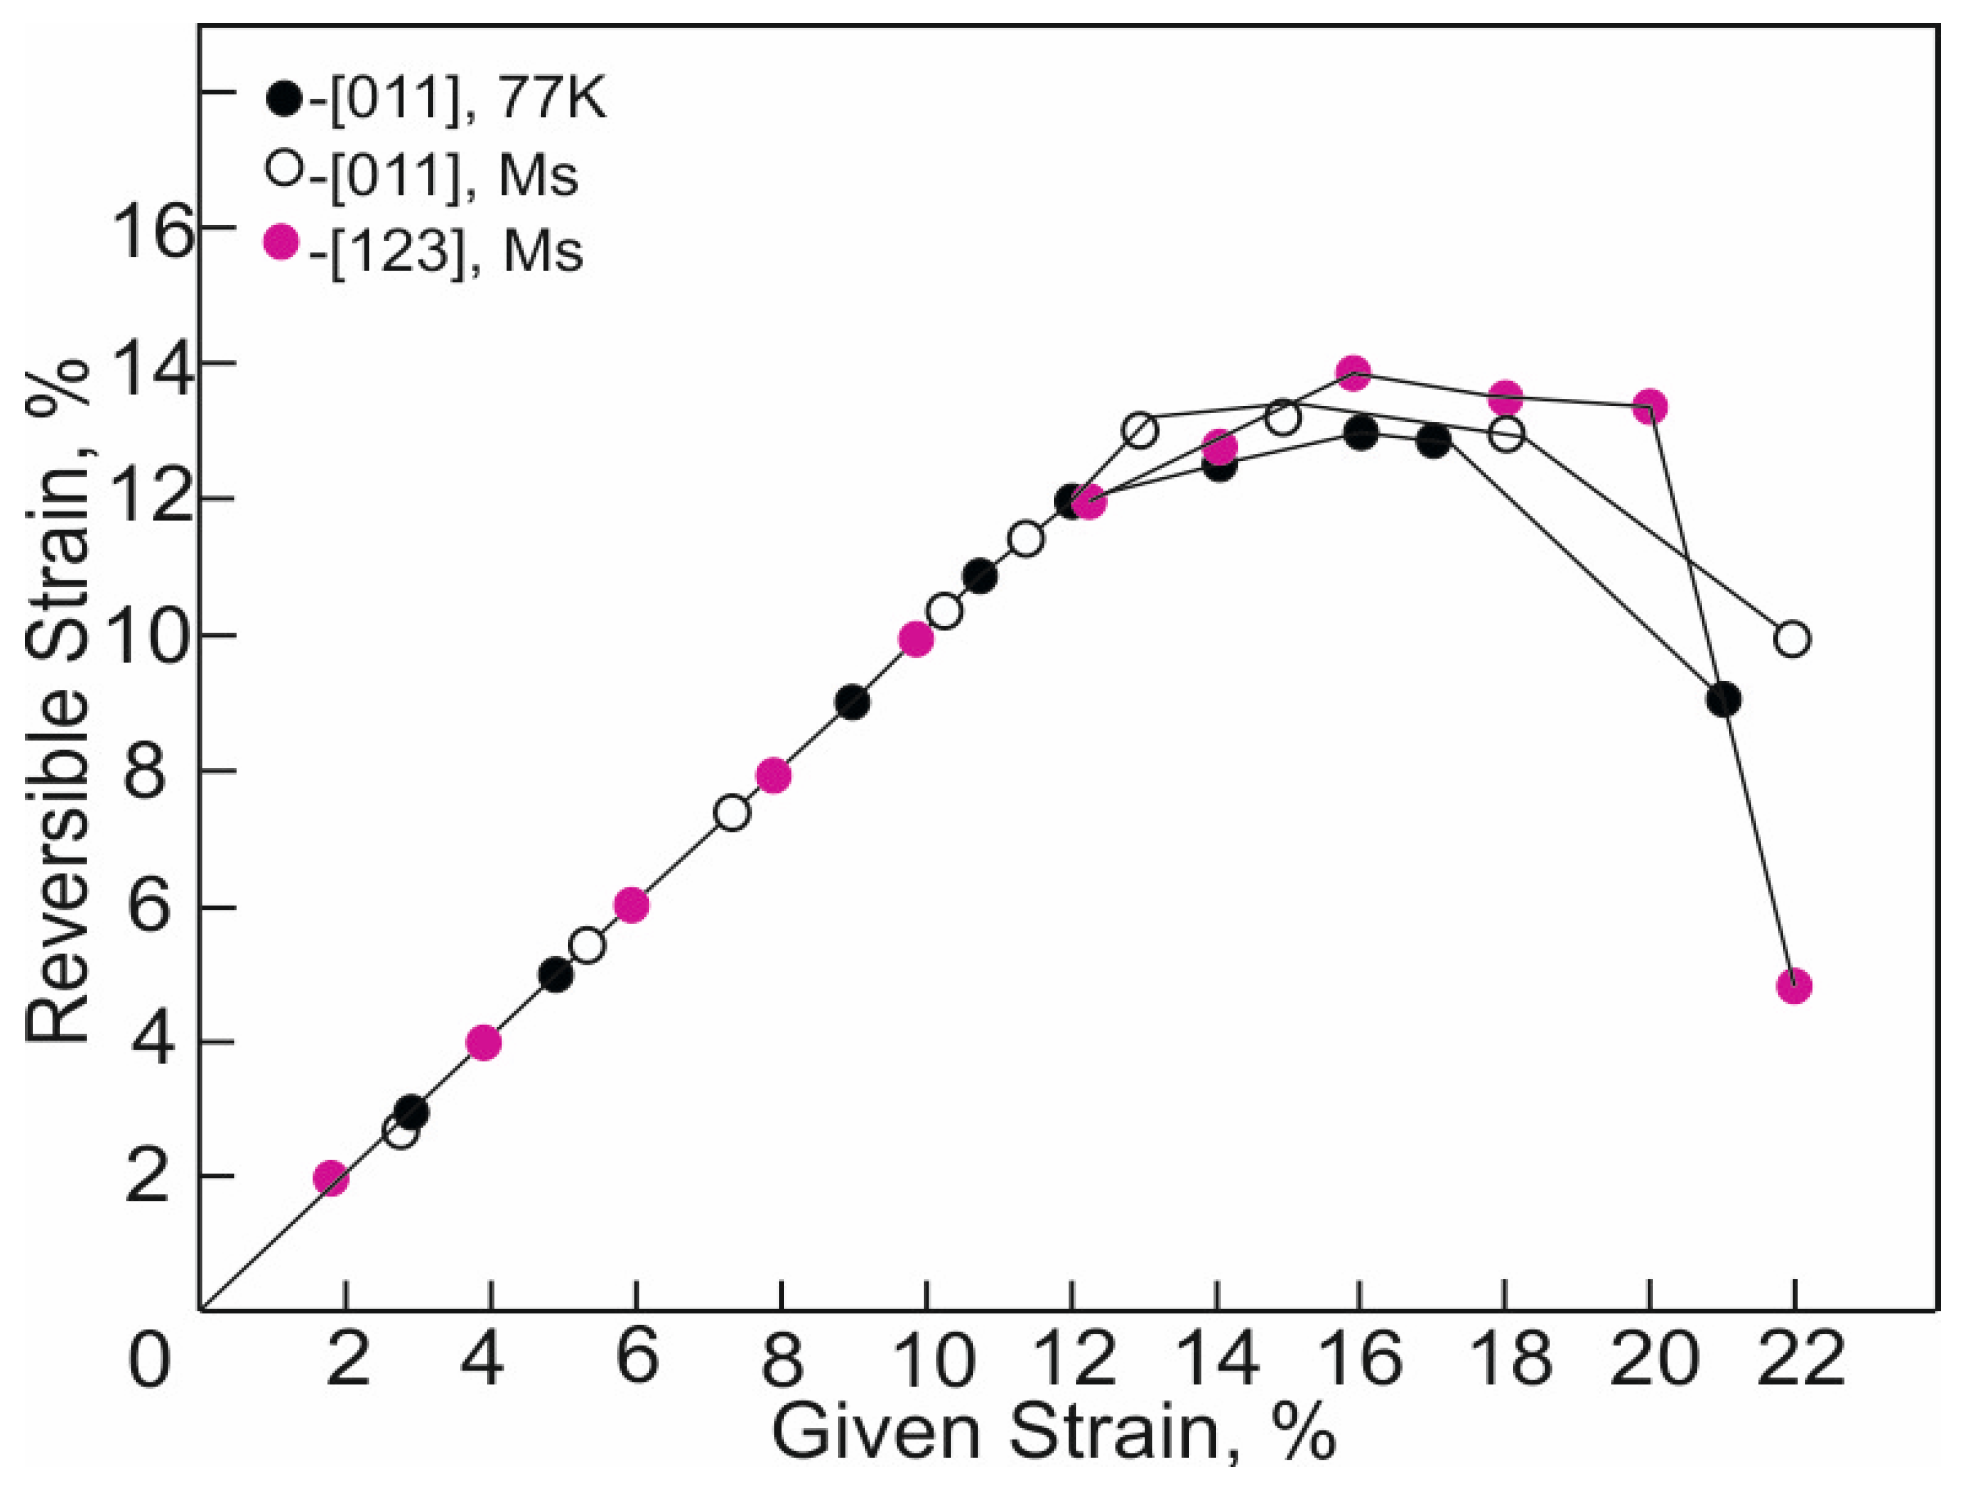
3.4. Shape Memory Effect under Tensile Strain at Different Temperatures
4. Discussion
4.1. The Main Parameters for the Implementation of a Reversible FCC–HCP MT
4.1.1. The Role of the Yield Stress σ0.1 of the Initial FCC Phase
4.1.2. The Role of Difference between the Critical Shear Stresses for Slip and HCP Martensite at the Ms Temperature
4.1.3. The Role of Short-Range Order
4.1.4. The Role of the Splitting of the a/2<110> Dislocation into the a/6<112> Partial Shockley Dislocations under External Stresses
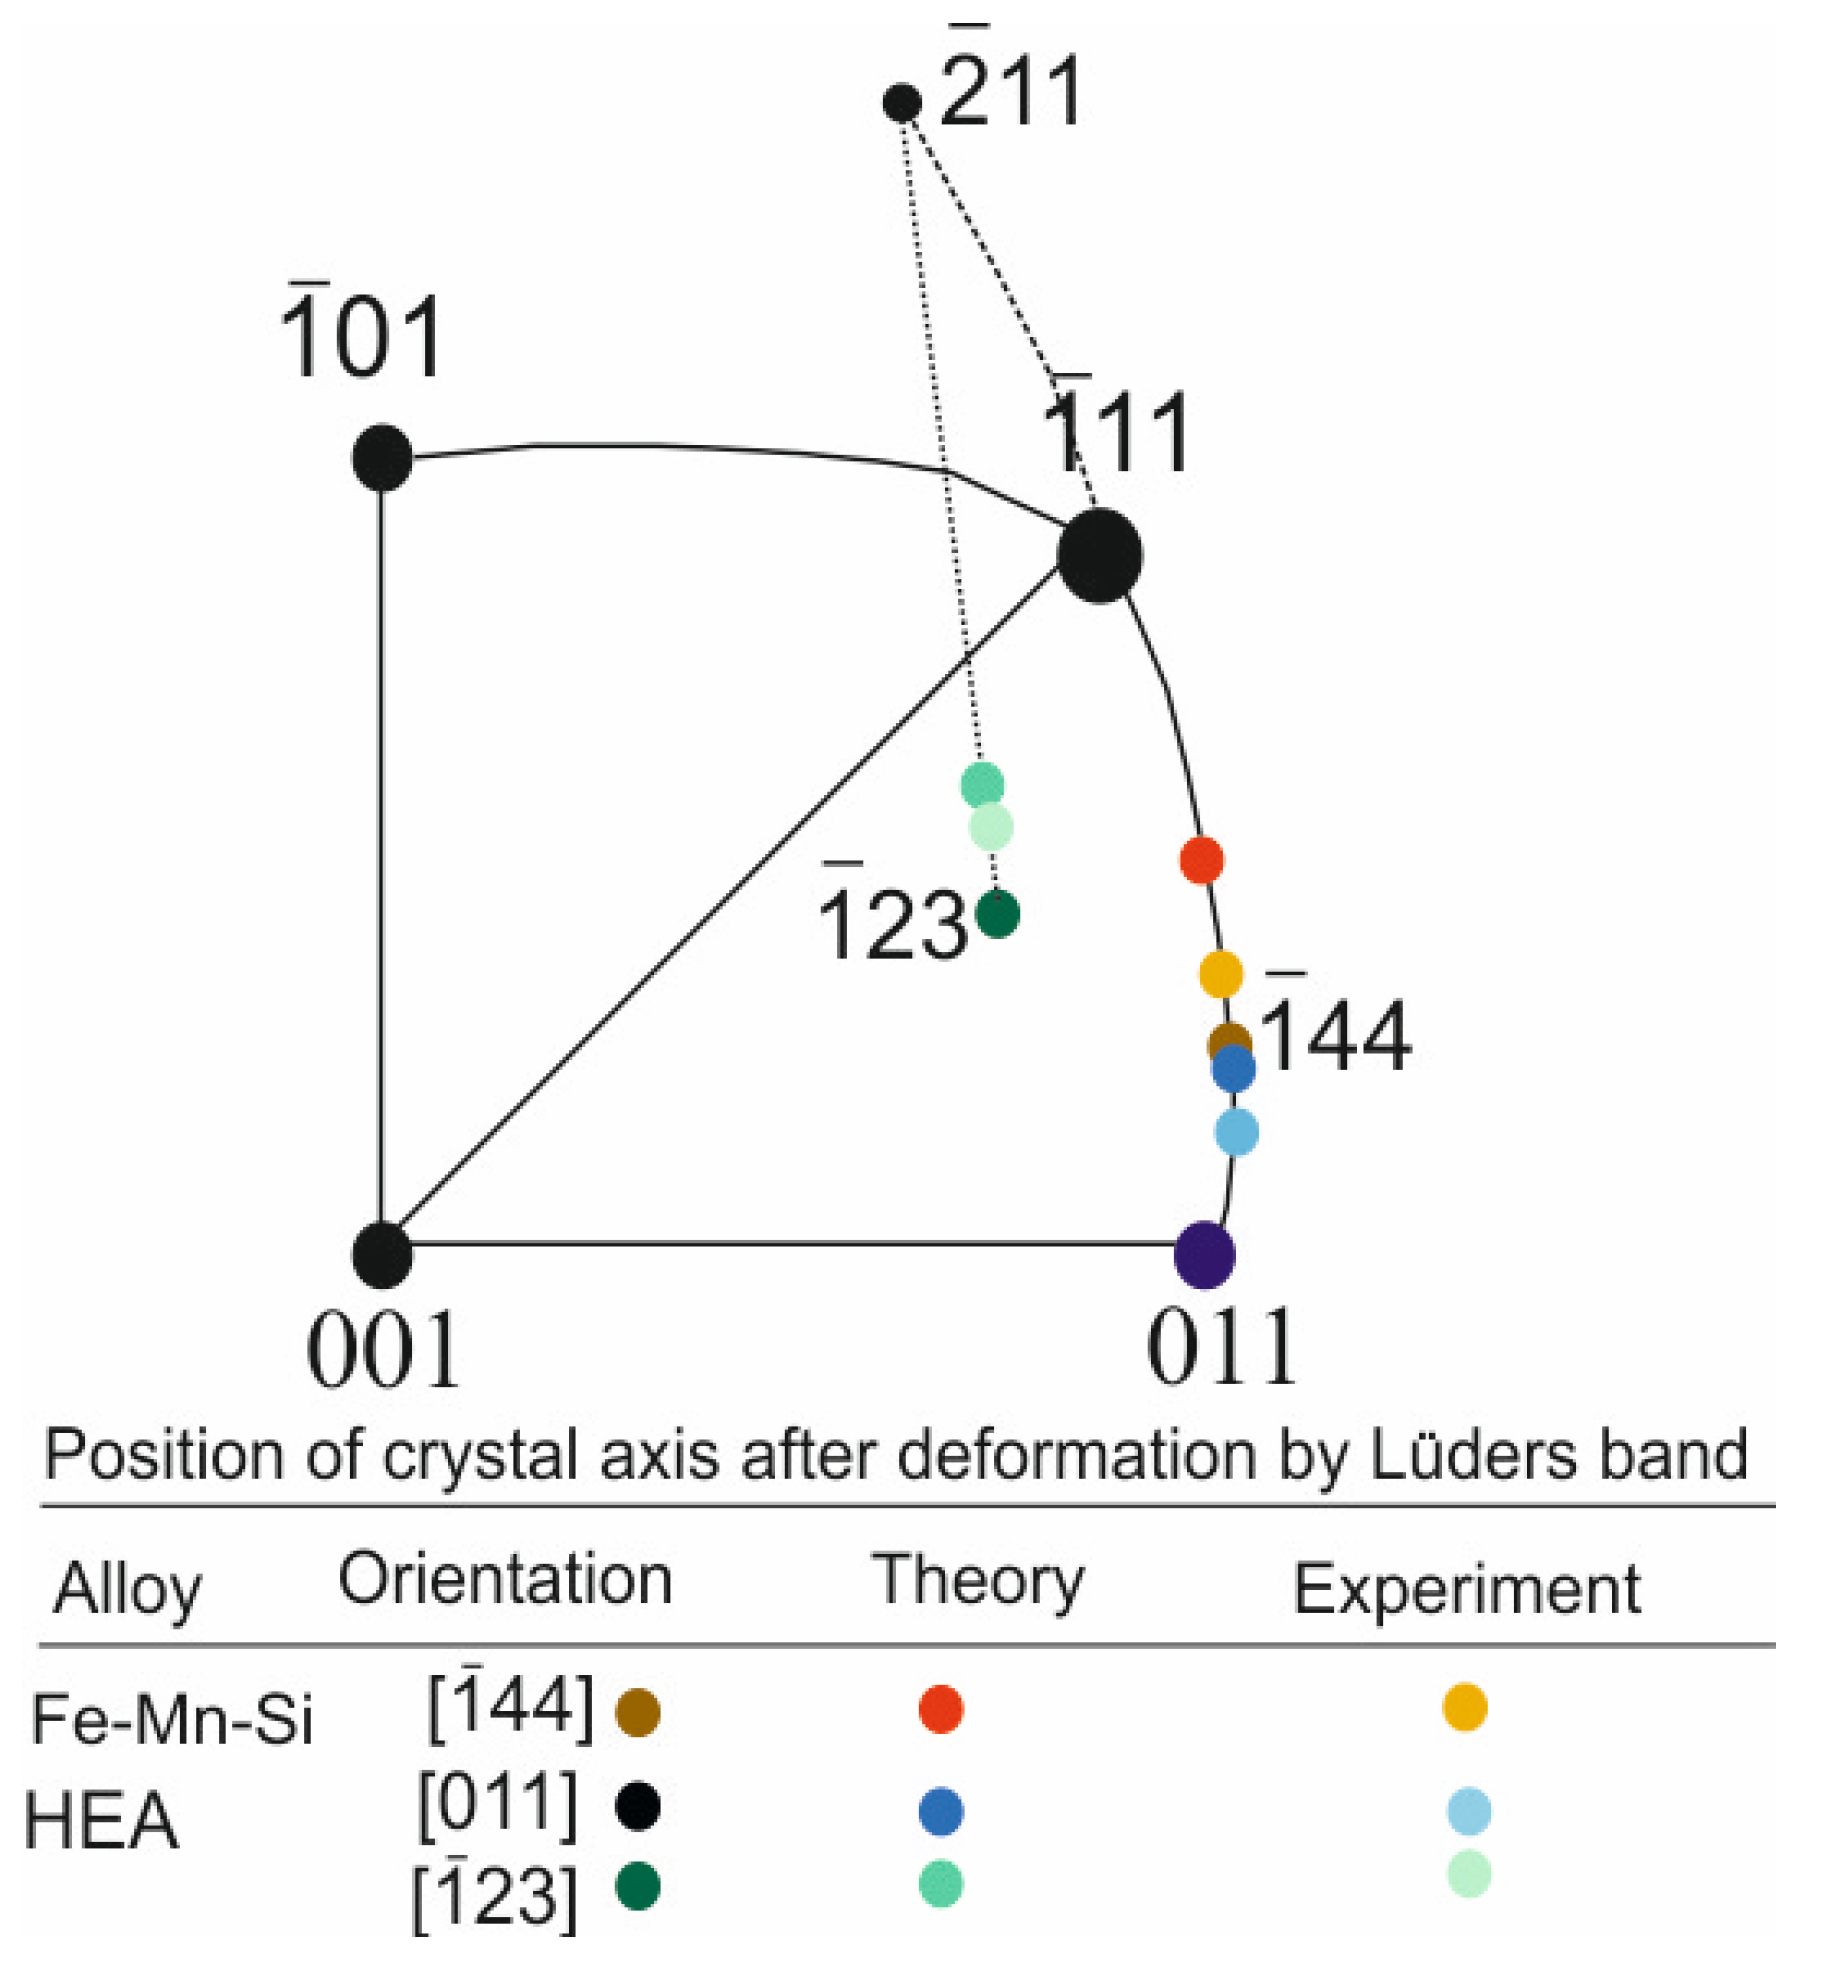
4.2. Orientation Dependence of SME in Cr20Mn20Fe20Co34.5Ni5.5 HEA Single Crystals
5. Conclusions
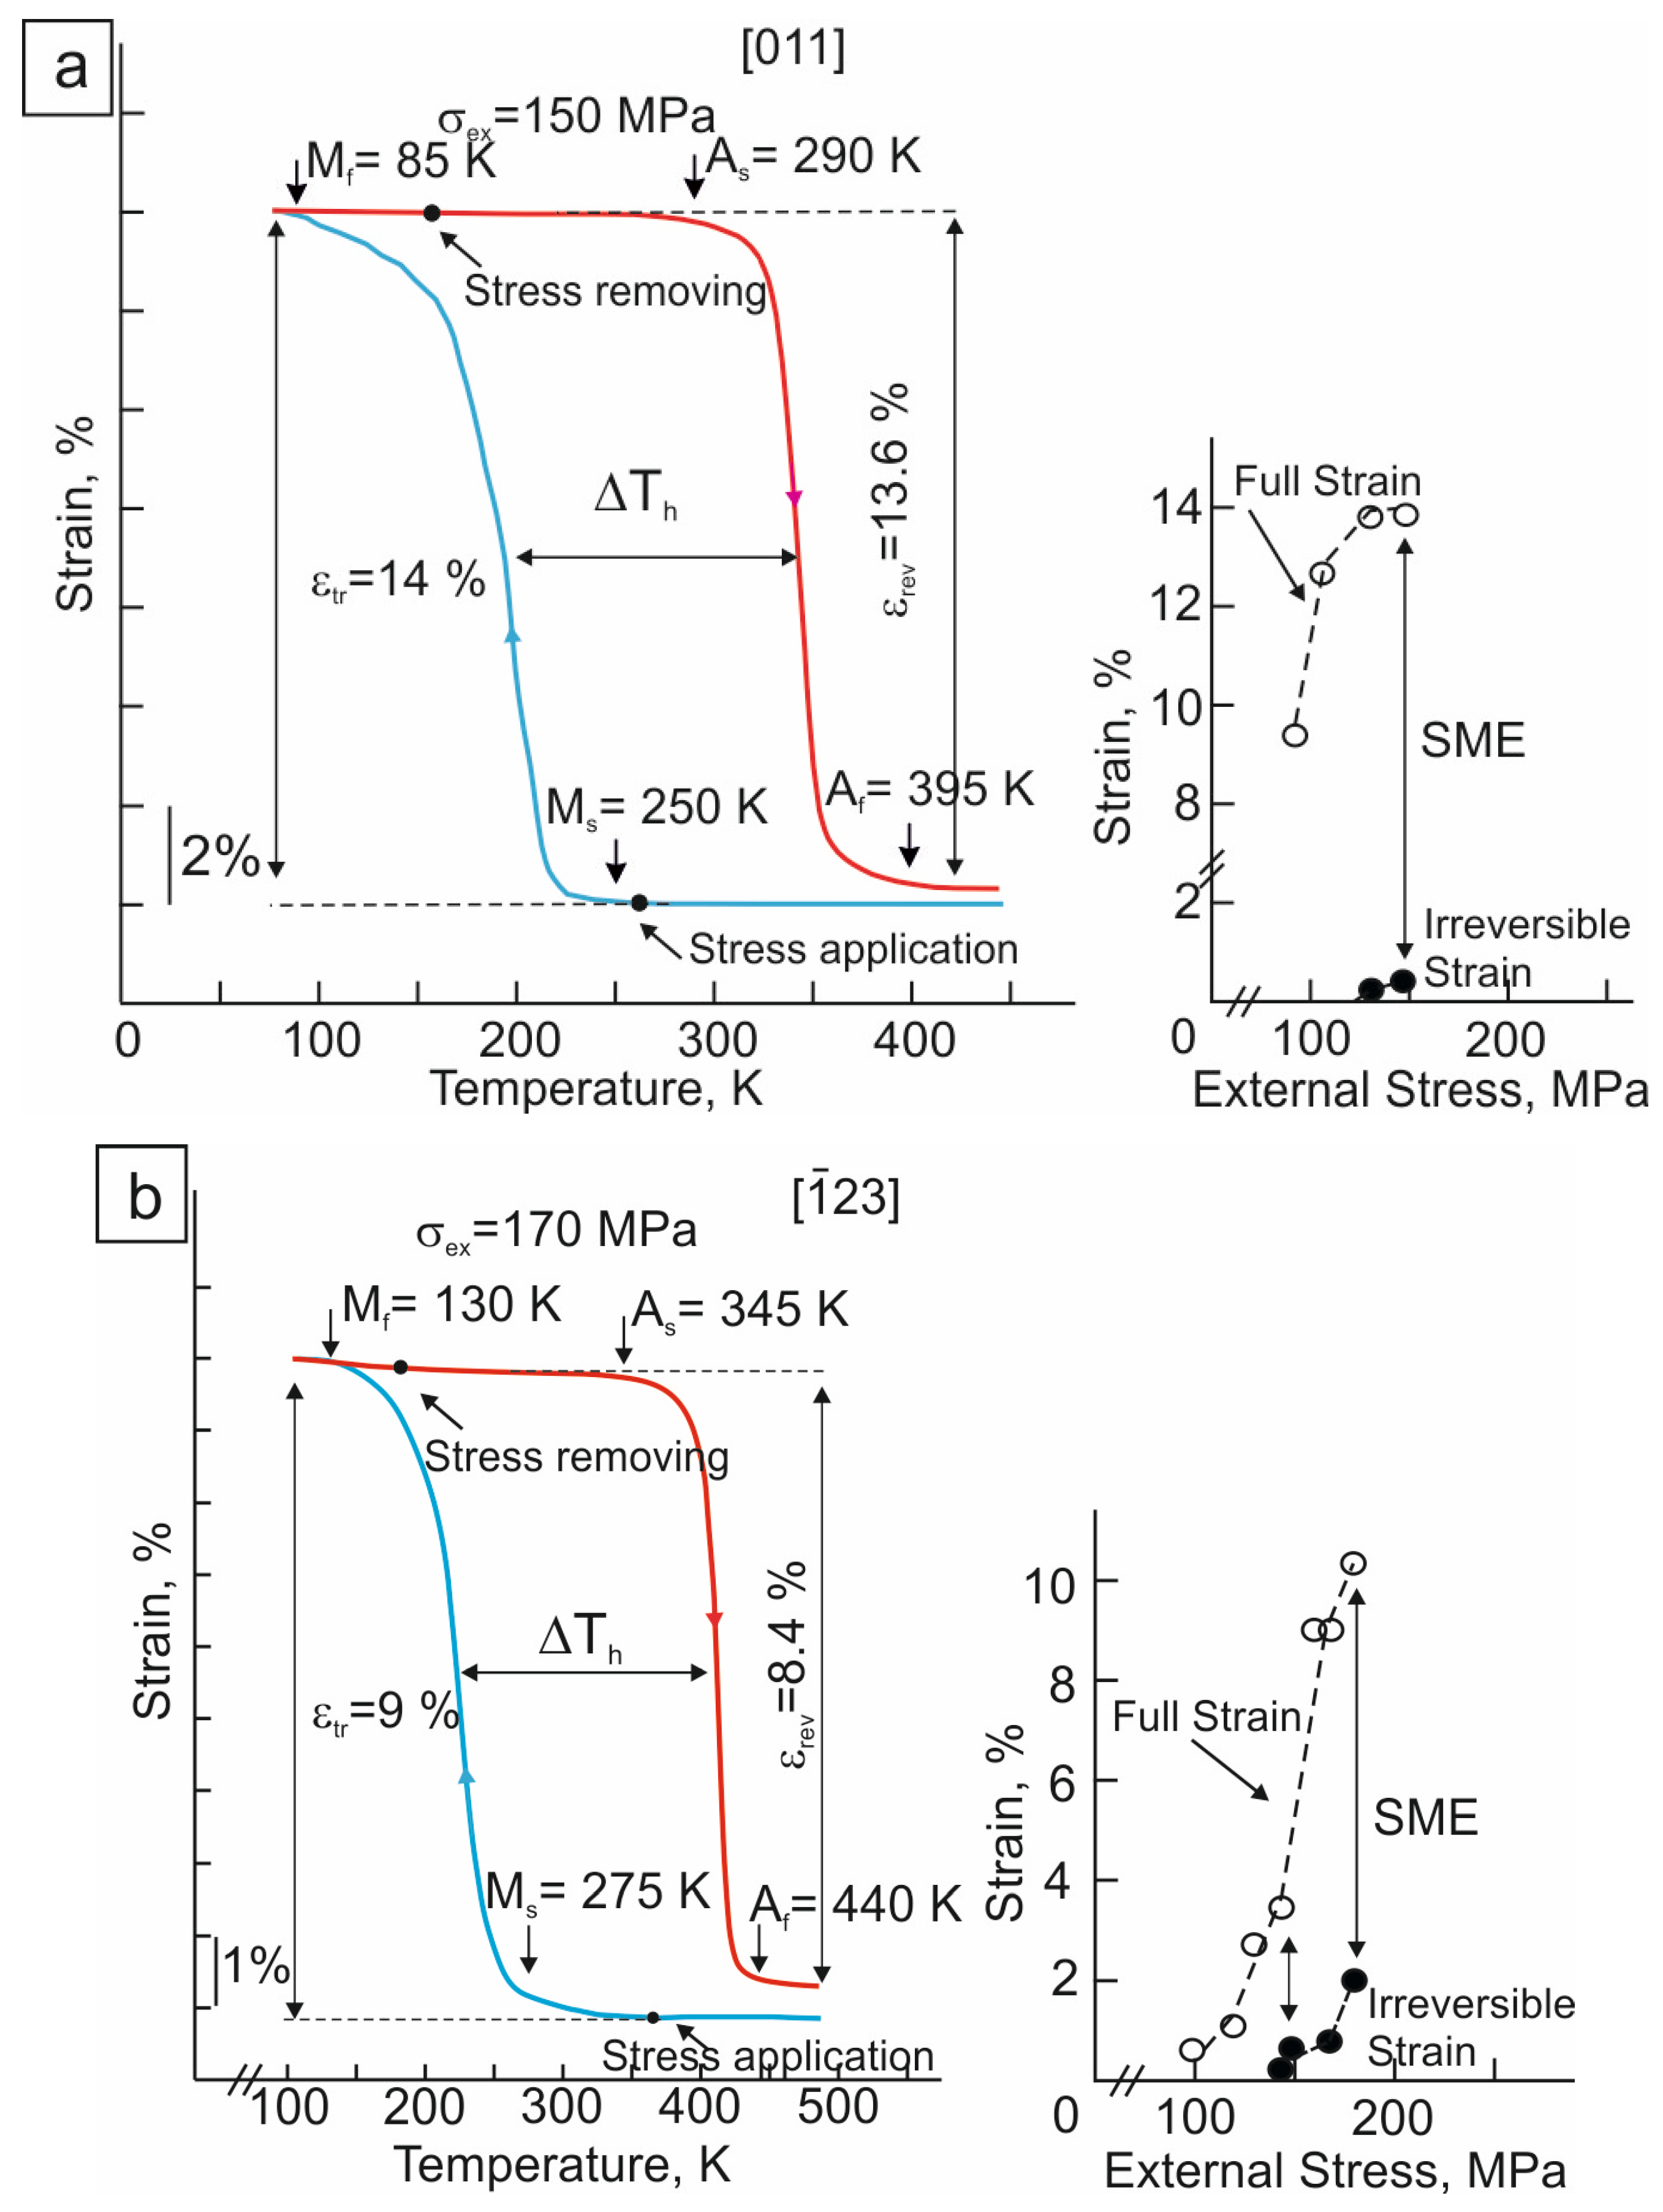
- In [011]- and -oriented Cr20Mn20Fe20Co34.5Ni5.5 HEA single crystals, FCC–HCP transformation develops upon cooling and heating in a free state and under stress. The start temperature of the forward FCC–HCP transformation upon a cooling Ms temperature is 195–200 K. The FCC–HCP transformation during cooling/heating in a free state and under stress is characterized by wide temperature hysteresis: ΔTh = Af − Ms = 180–195 K in a free state and ΔTh = 150–185 K at σex = 150–170 MPa.
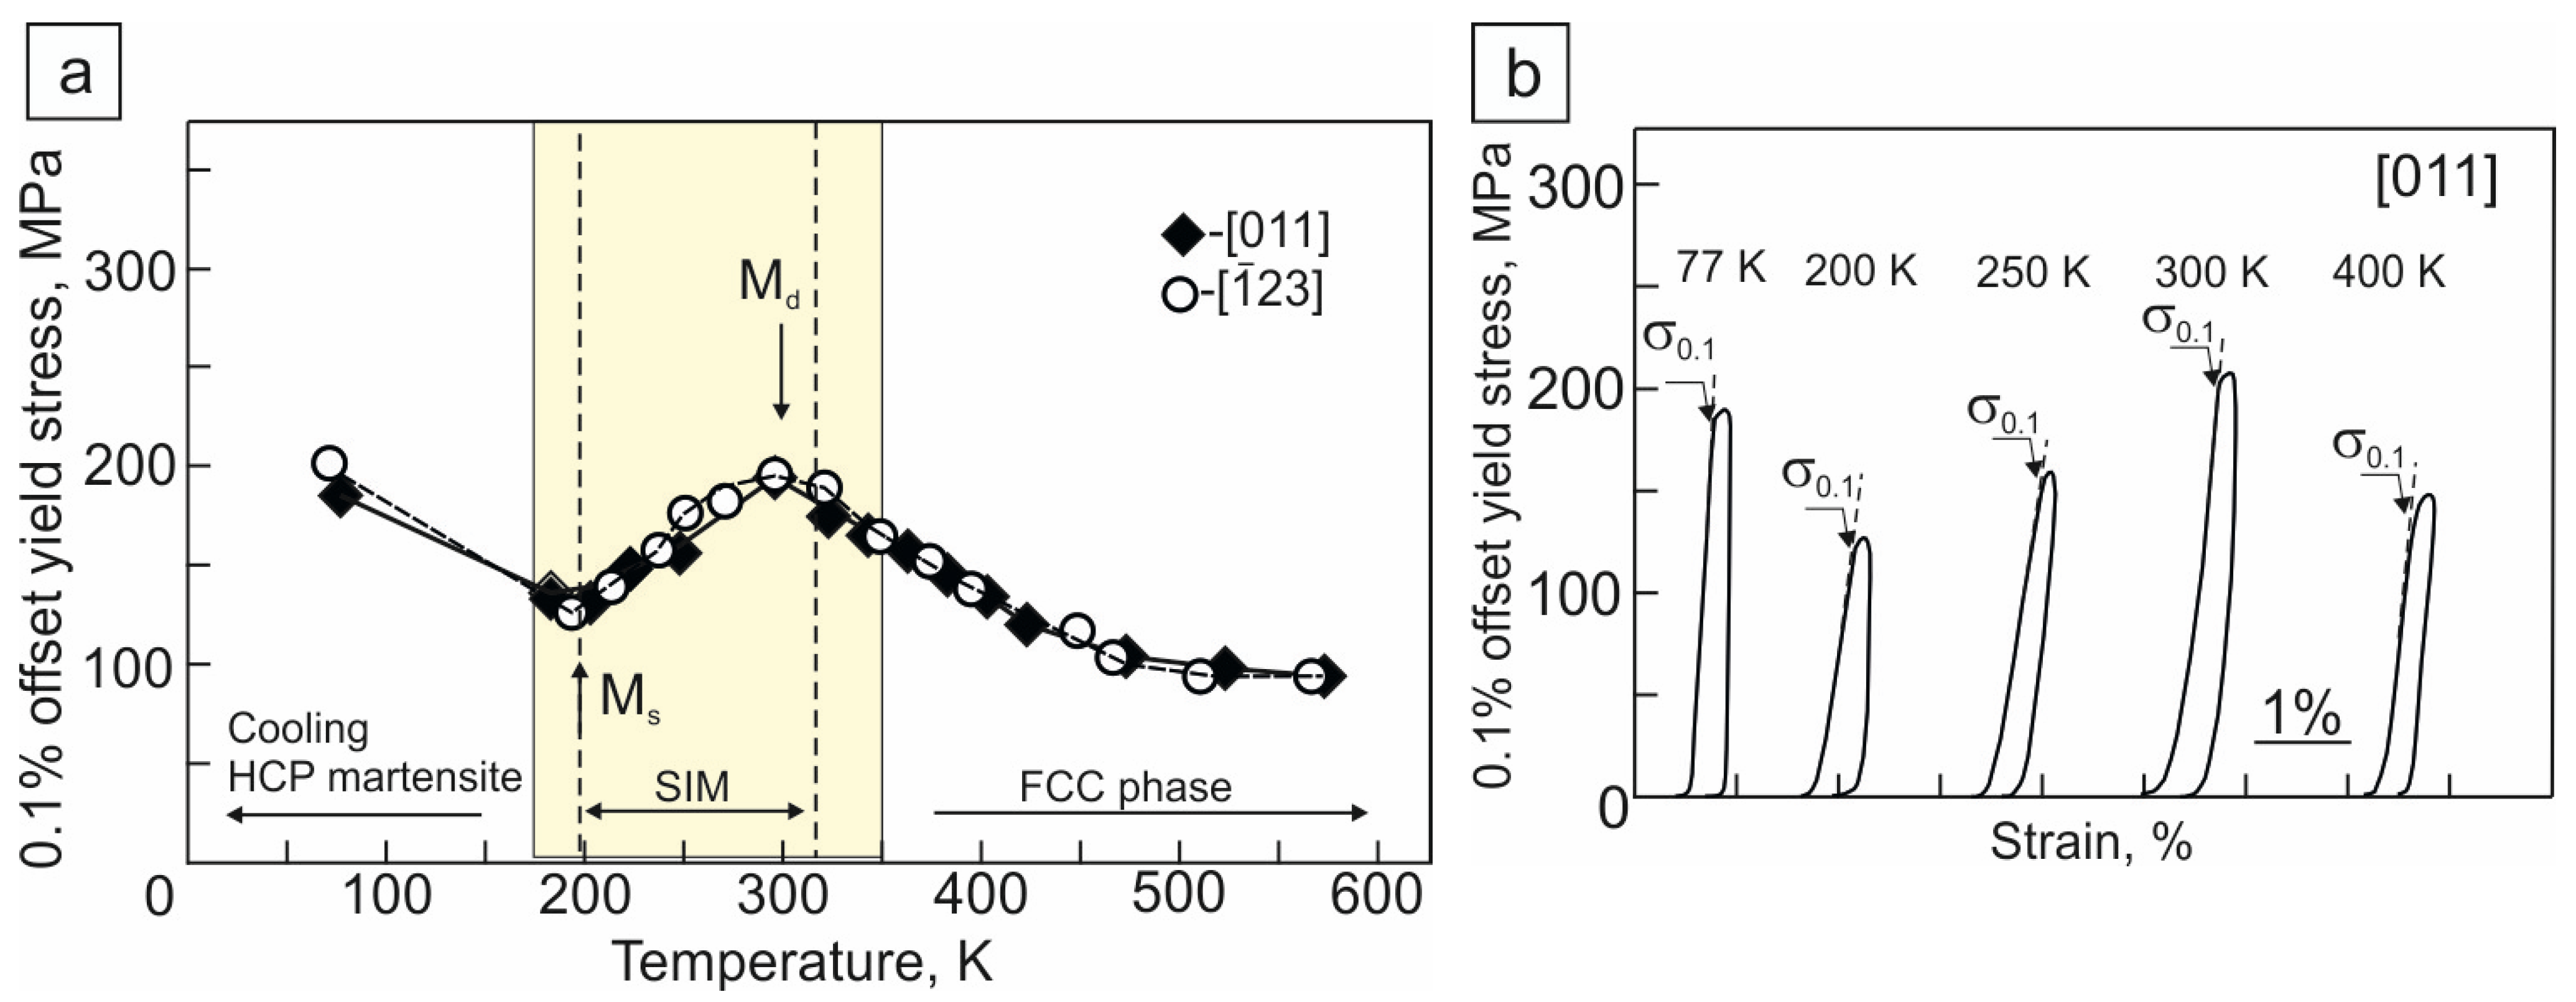
- The temperature dependence of the yield stress, σ0.1(T), has the form characteristic of alloys experiencing a martensitic transformation under stress and consists of three stages. The first stage at T < Ms is associated with the thermally activated motion of the interphase boundaries and introduction of thermally induced HCP martensite. The second one in the temperature range Ms < T < Md, on which a linear increase in stresses with increasing temperature is observed, is associated with the development of stress-induced HCP martensite and is described via the Clapeyron–Clausius relation. This stage in [011]- and -oriented crystals develops in a narrow temperature range, ΔTSIM = 105 K, and α = dσcr/dT at this stage weakly depends on the crystal orientation. The orientation dependence, α = dσcr/dT, is described via the orientation dependence of the theoretical value of the transformation strain, ε0Theory, for the FCC–HCP transition under tension in accordance with the Clausius–Clapeyron relation. The third stage, associated with the deformation of the FCC phase, takes place at a temperature above the Md temperature.
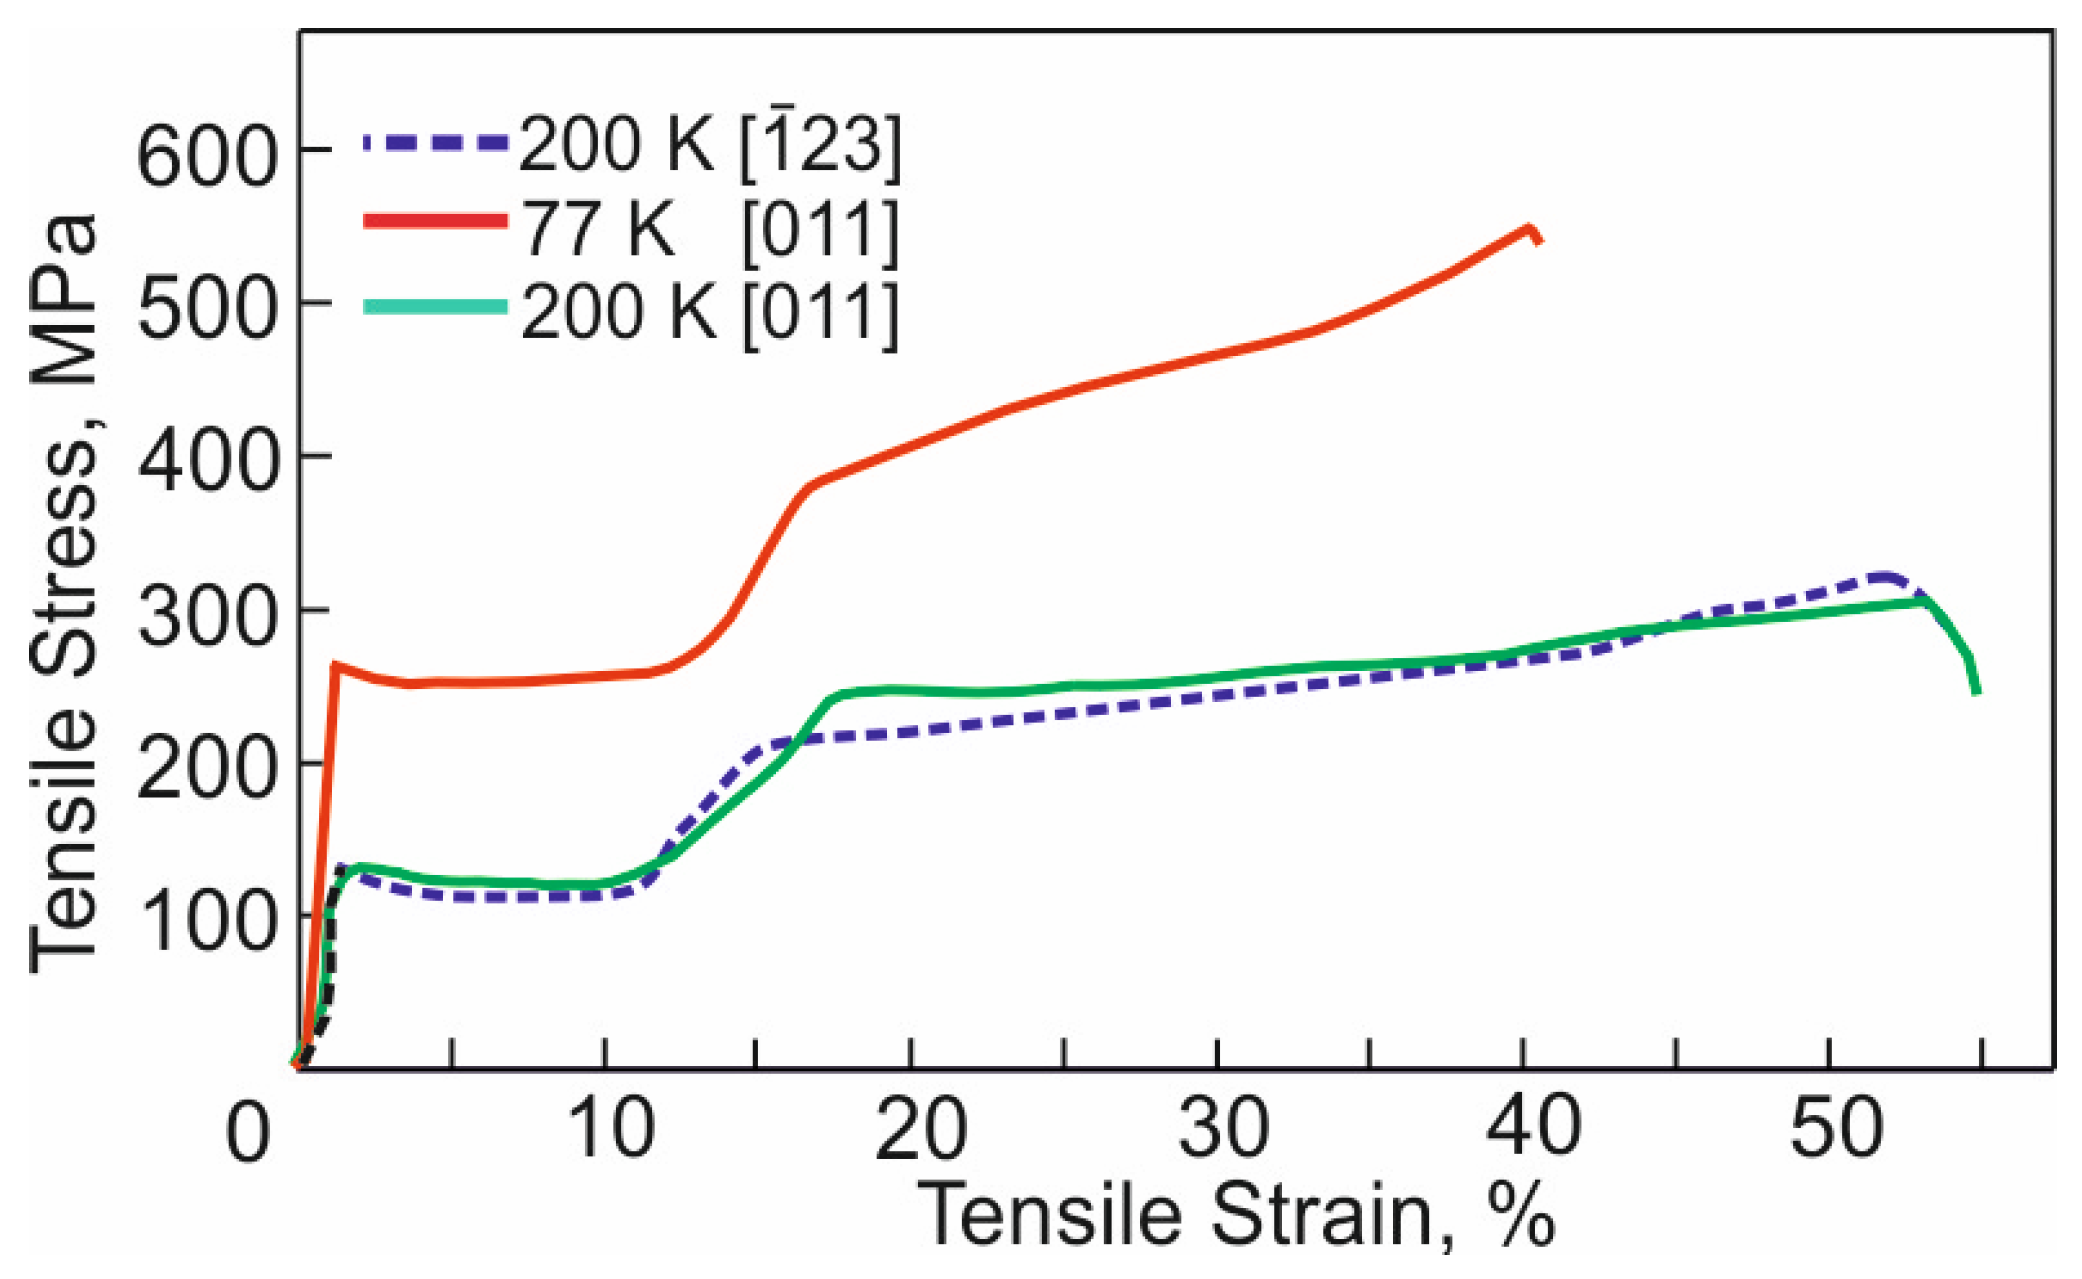
- For the first time, in [011]- and -oriented Cr20Mn20Fe20Co34.5Ni5.5 HEA crystals oriented for the development of HCP martensite in one system, the SME is realized under tension, which depends on the crystal orientation and external stresses, σex, in the “cooling-heating” cycle. The maximum SME is 13.6 ± 0.2% in [011]-oriented crystals at an external stress of 150 MPa, and 8.4 ± 0.2% in -oriented crystals at an external stress of 170 MPa. In the “stress-strain” cycle under tension, the maximum SME has the value of 14 ± 0.2% in -oriented crystals at the Ms temperature and of 13 ± 0.2% in [011]-oriented crystals at Ms and 77 K. The following physical factors are identified that contribute to the reversible movement of a/6<211> partial Shockley dislocations that are “exactly backward” when the stress is removed and lead to large SME: the stress level of the FCC phase, short-range order, and an increase in the splitting of a/2<110> perfect dislocations into a/6<211> partial Shockley dislocations in the external stress field.
Author Contributions
Funding
Institutional Review Board Statement
Informed Consent Statement
Data Availability Statement
Conflicts of Interest
References
- Sato, A.; Chishima, E.; Yamaji, Y.; Mori, T. Orientation and composition dependencies of shape memory effect in Fe–Mn–Si alloy. Acta Metall. 1984, 32, 539–547. [Google Scholar] [CrossRef]
- Sato, A.; Chishima, E.; Soma, K.; Mori, T. Shape memory effect in γ↔ε transformation in Fe–30Mn–1Si alloy single crystals. Acta Metall. 1982, 30, 1177–1183. [Google Scholar] [CrossRef]
- Sato, A.; Yamaji, Y.; Mori, T. Physical properties controlling shape memory effect in Fe–Mn–Si alloys. Acta Metall. 1986, 34, 287–294. [Google Scholar] [CrossRef]
- Otsuka, K.; Wayman, C.M. Shape Memory Materials; Cambridge University Press: Cambridge, UK, 1998; p. 284. [Google Scholar]
- Sawaguchi, T.; Maruyama, T.; Otsuka, H.; Kushibe, A.; Inoue, Y.; Tsuzaki, K. Design concept and applications of Fe–Mn–Si–based alloys—From shape memory to seismic response control. Mater. Trans. 2016, 57, 283–293. [Google Scholar] [CrossRef]
- Tang, Y.; Arabi-Hashemi, A.; Leinenbach, C.; Shahverdi, M. Influence of thermal treatment conditions on recovery stress formation in an FeMnSi-SME. Mater. Sci. Eng. A 2021, 802, 140694. [Google Scholar] [CrossRef]
- Wen, Y.H.; Peng, H.B.; Raabe, D.; Gutierrez-Urrutia, I.; Chen, J.; Du, Y.Y. Large recovery strain in Fe–Mn–Si-based shape memory steels obtained by engineering annealing twin boundaries. Nat. Commun. 2014, 5, 4964. [Google Scholar] [CrossRef]
- Otsuka, K.; Ren, X. Physical metallurgy of Ti–Ni-based shape memory alloys. Prog Mater Sci. 2005, 50, 135–678. [Google Scholar] [CrossRef]
- Chen, C.H.; Chen, Y.J.; Shen, J.J. Microstructure and mechanical properties of (TiZrHf)50(NiCoCu)50 high entropy alloys. Met Mater Int. 2020, 26, 617–629. [Google Scholar] [CrossRef]
- Lagoudas, D.C. Shape Memory Alloys: Modeling and Engineering Applications; Springer: Berlin/Heidelberg, Germany, 2008; ISBN 978-0-387-47684-1. [Google Scholar] [CrossRef]
- Lauhoff, C.; Pham, T.; Paulsen, A.; Krooss, P.; Frenzel, J.; Eggeler, G.; Niendorf, T. A novel thermos-mechanical processing route exploiting abnormal grain growth in Heusler-type Co–Ni–Ga shape memory alloys. Metall. Mater. Trans. A 2022, 53, 4139–4142. [Google Scholar] [CrossRef]
- Kim, D.; Hong, K.; Sim, J.; Lee, J.; Lee, W. Shape memory and mechanical properties of cold rolled and annealed Fe–17Mn–5Si–5Cr–4Ni–1Ti–0.3C alloy. Materials 2021, 14, 255. [Google Scholar] [CrossRef] [PubMed]
- Lee, J.I.; Tsuchiya, K.; Tasaki, W.; Oh, H.S.; Sawaguchi, T.; Murakami, H.; Hiroto, T.; Matsushita, Y.; Park, E.S. A strategy of designing high-entropy alloys with high-temperature shape memory effect. Sci. Rep. 2019, 9, 13140. [Google Scholar] [CrossRef] [PubMed]
- Zhang, Y.; Zuo, T.T.; Tang, Z.; Gao, M.C.; Dahmen, K.A.; Liaw, P.K.; Lu, Z.P. Microstructures and properties of high-entropy alloys. Prog. Mater. Sci. 2014, 61, 1–93. [Google Scholar] [CrossRef]
- Zhang, Z.; Mao, M.M.; Wang, J.; Glodovatz, B.; Zhang, Z.; Mao, S.X.; George, E.P.; Yu, Q.; Ritchie, R.O. Nanoscale origins of the damage tolerance of the high-entropy alloy CrMnFeCoNi. Nat. Commun. 2015, 6, 10143. [Google Scholar] [CrossRef] [PubMed]
- Joo, S.-H.; Kato, H.; Jang, M.J.; Moon, J.; Tsai, C.W.; Yeh, J.W.; Kim, H.S. Tensile deformation behavior and deformation twinning of an equimolar CoCrFeMnNi high-entropy alloy. Mater. Sci. Eng. A 2017, 689, 122–133. [Google Scholar] [CrossRef]
- Kireeva, I.V.; Chumlyakov, Y.I.; Vyrodova, A.V.; Saraeva, A.A. Critical resolved shear stress for twinning and twinning-induced plasticity in single crystals of the CoCrFeNiMo0.2 high-entropy alloy. Mater. Sci. Eng. A 2022, 850, 143586. [Google Scholar] [CrossRef]
- Kireeva, I.V.; Chumlyakov, Y.I.; Saraeva, A.A.; Vyrodova, A.V. Giant shape memory effect of the -oriented FCC CrMnFeCoNi high-entropy alloy single crystals with FCC↔HCP martensitic transformation. Scripta Mater. 2023, 235, 115621. [Google Scholar] [CrossRef]
- Kireeva, I.V.; Chumlyakov, Y.I.; Saraeva, A.A.; Vyrodova, A.V.; Pobedennaya, Z.V. Shape memory effect of -oriented Cr20Mn20Fe20Co35Ni5 high-entropy alloy single crystals. Mater. Lett. 2023, 331, 133461. [Google Scholar] [CrossRef]
- Kireeva, I.V.; Chumlyakov, Y.I.; Saraeva, A.A.; Vyrodova, A.V.; Kuksgauzen, D.A.; Kirillov, A.V. Thermoelastic martensitic transformation and shape memory effect in [001]-oriented single crystals of high-entropy alloy. Russ. Phys. J. 2023, 65, 1625–1635. [Google Scholar] [CrossRef]
- Park, K.W.; Kim, W.J. Recovery stress and strain behavior of Cr20Mn20Fe20Co35Ni5 high-entropy alloy deformed via severe plastic deformation. Mater. Charact. 2023, 197, 112641. [Google Scholar] [CrossRef]
- Liao, Q.; Jing, T.; Wang, Y.; Peng, H.; Wen, Y. A CoCrFeNiMnSi high entropy alloy showing a good combination of shape memory effect and mechanical properties. J. Alloy Compod. 2022, 926, 1666803. [Google Scholar] [CrossRef]
- De Cooman, B.C.; Estrin, Y.; Kim, S.K. Twinning-induced plasticity (TWIP) steels. Acta Mater. 2018, 142, 283–362. [Google Scholar] [CrossRef]
- Abuzaid, W.; Sehitoglu, H. Critical resolved shear stress for slip and twin nucleation in single crystalline FeNiCoCrMn high entropy alloy. Mater. Charact. 2017, 129, 288–299. [Google Scholar] [CrossRef]
- Barrett, C.S.; Massalski, T.B. Structure of Metals: Crystallographic Methods, Principles, and Data; Pergamon: New York, NY, USA, 1980. [Google Scholar]
- Kawamura, M.; Asakura, M.; Okamoto, N.L.; Kishida, K.; Inui, H.; George, E.P. Plastic deformation of single crystals of the equiatomic Cr–Mn–Fe–Co–Ni high-entropy alloy in tension and compression from 10 K to 1273 K. Acta Mat. 2021, 203, 116454. [Google Scholar] [CrossRef]
- Laplanche, G.; Kostka, A.; Horst, O.M.; Eggeler, G.; George, E.P. Microstructure evolution and critical stress for twinning in the CrMnFeCoNi high-entropy alloy. Acta Mater. 2016, 118, 152–163. [Google Scholar] [CrossRef]
- Liu, Y.; Liu, Y.; Tan, G.; Miyazaki, S.; Jiang, B.; Liu, Y. Stress-induced FCC↔HCP martensitic transformation in CoNi. J. Alloy Compod. 2004, 368, 157–163. [Google Scholar] [CrossRef]
- Mohammed, A.S.K.; Sidharth, R.; Abuzaid, W.; Akamine, H.; Nishida, M.; Sehitoglu, H. Orientation relationships in FeMnNiAl governed by martensitic subsructure. Shap. Mem. Superelasticity 2023, 9, 473–484. [Google Scholar] [CrossRef]
- Sato, A.; Soma, K.; Mori, T. Hardening due to pre-existing ε-martensite in an Fe–30Mn–1Si alloy single crystal. Acta Metall. 1982, 30, 19011907. [Google Scholar] [CrossRef]
- Honeycombe, R.W.K. The Plastic Deformation of Metals; London: Arnold, 1968, translated under the title Plasticheskya deformatsiya metallov; Mir Publisher: Moscow, Russia, 1972. (In Russian) [Google Scholar]
- Berner, R.; Kronmuller, H. Plasticheskya deformatsiya monokristallov [Plastische Verformung von Eikristallen]; Mir Publisher: Moscow, Russia, 1969. (In Russian) [Google Scholar]
- Cohen, J.B.; Fine, M.E. Some aspects of short-range order. J. Phys. Radium. 1962, 23, 749–762. [Google Scholar] [CrossRef]
- Lai, M.J.; Li, Y.J.; Lillpopp, L.; Ponge, D.; Will, S.; Raabe, D. On the origin of the improvement of shape memory effect by precipitating VC in FeMnSi-based shape memory alloys. Acta Mat. 2018, 155, 222–235. [Google Scholar] [CrossRef]
- Huang, S.; Li, W.; Lu, S.; Tian, F.; Shen, J.; Holmstrom, E.; Vitos, L. Temperature dependent stacking fault energy of FeCrCoNiMn high entropy alloy. Scripta Mater. 2015, 108, 44–47. [Google Scholar] [CrossRef]
- Zaddach, A.J.; Niu, C.; Koch, C.C.; Irving, D.L. Mechanical properties and stacking fault energies of NiFeCrCoMn high-entropy alloy. JOM 2013, 65, 1780–1789. [Google Scholar] [CrossRef]
- Wu, Z.; Bei, H.; Pharr, G.M.; George, E.P. Temperature dependence of the mechanical properties of equiatomic solid solution alloys with face-centered cubic crystal structures. Acta Mater. 2014, 81, 428–441. [Google Scholar] [CrossRef]
- Copley, S.M.; Kear, B.H. The dependence of the width of a dissociated dislocation on dislocation velocity. Acta Metall. 1968, 16, 227–231. [Google Scholar] [CrossRef]
- Byun, T.S. On the stress dependence of partial dislocation separation and deformation microstructure in austenitic stainless steel. Acta Mater. 2003, 51, 3063–3071. [Google Scholar] [CrossRef]
- Laplanche, G.; Gadaud, P.; Horst, O.; Otto, F.; Eggeler, G.; George, E.P. Temperature dependencies of the elastic moduli and thermal expansion coefficient of an equiatomic single-phase CoCrFeMnNi high-entropy alloy. J. Alloys Compd. 2015, 623, 348–353. [Google Scholar] [CrossRef]


| Orientation | Schmid Factor for Slip, msl | Schmid Factor for FCC–HCP Transition, mFCC–HCP | Theoretical Value ε0Theory, % |
|---|---|---|---|
| 0.45 | 0.45 | 15.7 | |
| [011] | 0.41 | 0.47 | 16.4 |
| FCC Alloys | ΔV, % | TNe, K | σ0.1(Md), MPa | σ0.1(Ms), MPa | , MPa | SRO | , %, for Different Orientations |
|---|---|---|---|---|---|---|---|
| Fe–Mn–Si alloys [1,30] | 1.26–1.42, [13] | TNe ≈ Ms | 160 | 45 | 30 | no or weakly expressed | |
| 0.5–1.2, [001] | |||||||
| Cr20Mn20Fe20Co34.5Ni5.5 HEA in the present paper | 1.15, [13] | TNe = 23 K << Ms | 205 | 115–125 | 65 | Yes SRO | 13.6, [011] |
| , [18] | |||||||
| 3.6, [001], [20] |
| Orientation | m1 [38] | m2 [38] | [38] | γ0, J/m2 [35] | γef, J/m2 | d0, nm | d, nm |
|---|---|---|---|---|---|---|---|
| 0.45 | 0.32 | −0.07 | 0.012 | 0.0108 | 6 | 6.7 | |
| [011] | 0.47 | 0.24 | −0.12 | 0.012 | 0.0100 | 6 | 7.25 |
Disclaimer/Publisher’s Note: The statements, opinions and data contained in all publications are solely those of the individual author(s) and contributor(s) and not of MDPI and/or the editor(s). MDPI and/or the editor(s) disclaim responsibility for any injury to people or property resulting from any ideas, methods, instructions or products referred to in the content. |
© 2023 by the authors. Licensee MDPI, Basel, Switzerland. This article is an open access article distributed under the terms and conditions of the Creative Commons Attribution (CC BY) license (https://creativecommons.org/licenses/by/4.0/).
Share and Cite
Kireeva, I.V.; Chumlyakov, Y.I.; Saraeva, A.A.; Vyrodova, A.V. Physical Factors Controlling Large Shape Memory Effect in FCC ↔ HCP Martensitic Transformation in CrMnFeCoNi High-Entropy-Alloy Single Crystals. Metals 2023, 13, 1755. https://doi.org/10.3390/met13101755
Kireeva IV, Chumlyakov YI, Saraeva AA, Vyrodova AV. Physical Factors Controlling Large Shape Memory Effect in FCC ↔ HCP Martensitic Transformation in CrMnFeCoNi High-Entropy-Alloy Single Crystals. Metals. 2023; 13(10):1755. https://doi.org/10.3390/met13101755
Chicago/Turabian StyleKireeva, Irina V., Yuriy I. Chumlyakov, Anastasia A. Saraeva, and Anna V. Vyrodova. 2023. "Physical Factors Controlling Large Shape Memory Effect in FCC ↔ HCP Martensitic Transformation in CrMnFeCoNi High-Entropy-Alloy Single Crystals" Metals 13, no. 10: 1755. https://doi.org/10.3390/met13101755
APA StyleKireeva, I. V., Chumlyakov, Y. I., Saraeva, A. A., & Vyrodova, A. V. (2023). Physical Factors Controlling Large Shape Memory Effect in FCC ↔ HCP Martensitic Transformation in CrMnFeCoNi High-Entropy-Alloy Single Crystals. Metals, 13(10), 1755. https://doi.org/10.3390/met13101755