Article

Electrophoretic Deposition of Chitosan–Hydroxyapatite Films and Their Electrochemical Behavior in Artificial Plasma

by
J. P. Mata-Davila
1,
C. D. Arrieta-Gonzalez
2,
F. J. Perez-Arizmendi
3,
M. A. Dorta-Leon
3,
F. Brown-Bojorquez
4 and
J. Porcayo-Calderon
1,*
1
Department of Chemical Engineering and Metallurgy, University of Sonora, Hermosillo 83000, Sonora, Mexico
2
Department of Chemical and Biochemistry Engineering, National Technologic of Mexico/Technological Institute of Zacatepec, Calzada Instituto Tecnologico 27, Zacatepec 62780, Morelos, Mexico
3
DIPROCAT, Economos 6719, Zapopan 45037, Jalisco, Mexico
4
Department of Polymers and Materials Research, University of Sonora (UNISON), Hermosillo 83000, Sonora, Mexico
*
Author to whom correspondence should be addressed.
Metals 2023, 13(11), 1828; https://doi.org/10.3390/met13111828
Submission received: 11 September 2023 / Revised: 17 October 2023 / Accepted: 25 October 2023 / Published: 30 October 2023
(This article belongs to the Special Issue Surface Treatment and Coatings for Metals)

Abstract

:
The electrochemical behavior of chitosan–hydroxyapatite films deposited on Ti CP was evaluated. Hydroxyapatite was synthesized from eggshell at different precipitation pH conditions. The films were deposited on the Ti CP surface from chitosan–hydroxyapatite solutions by means of electrophoretic deposition. The hydroxyapatite content of the solutions varied from 0 to 20 g/L. The different films obtained were evaluated by means of electrochemical measurements such as polarization curves, open circuit potential measurements, polarization resistance, and electrochemical impedance. The results obtained showed that regardless of the precipitation pH, it is possible to obtain pure hydroxyapatite from a waste such as eggshell. The incorporation of hydroxyapatite within the chitosan structure allows for improvement of the electrochemical performance of the bare Ti CP surface. It was observed that the passive zone was achieved at lower current densities, and that the stability zone of the passive layer increased. Electrochemical impedance analyzes showed that there is an improvement in corrosion resistance due to a more controlled growth of the passive layer that allows for the formation of a dense and compact film.

1. Introduction

Biomaterials have been widely used to replace body components that have lost their functionality. However, the human body is a hostile environment for many biomaterials, and their useful life can be compromised by the type of damage to their surface induced different compounds that may be present in the environment [1]. This has motivated the search for materials that are chemically stable in environments such as those that prevail within the human body in order to have those that guarantee a longer useful life and biocompatibility [2,3,4,5,6,7,8,9].
In the case of metallic biomaterials, body fluids can induce a type of damage to their surface known as localized corrosion. The damage caused by this type of corrosion can induce the release of cationic species and the fracture of the material due to corrosion fatigue processes [10].
Despite the excellent chemical stability of the surface of a biomaterial, one way to improve it and increase its biocompatibility is through its surface modification. This can be achieved through the use of biopolymers [11,12,13,14] or bioceramics [13,14,15,16,17,18].
One of the natural biopolymers that has attracted the most attention is chitosan [11]. Chitosan is a linear polysaccharide of cationic nature with many properties such as being biocompatible, biodegradable, and non-toxic. Chitosan is also known as deacetylated chitin ((C8H13O5N)n). These properties have attracted attention to its use as a coating to improve the biocompatibility of biomaterials, and due to its cationic nature, its deposition has been carried out via electrophoretic deposition (EPD) [12]. Its deposition is possible due to the increase in pH on the cathode surface, due to the reduction reactions that occur, which causes its precipitation as an insoluble film [13].
C h i t N H 3 + + O H C h i t N H 2 + H 2 O ,
In an attempt to improve the properties of the deposited films, co-deposition of other materials (SiO2, hydroxyapatite (HAp), nanoparticles) is also possible [13,14]. HAp (Ca10(PO4)6OH2) is the main component of bone (≈69%) and is considered a bioactive bioceramic [14,16] which can be synthesized from different sources and synthesis processes. The superficial modification of the biomaterial with a HAp coating increases its biocompatibility, reduces its degradation and therefore the release of metal cations [15]. It has been reported that the synthesis of HAp from natural sources is simpler, cheaper, and more environmentally friendly than those processes that use only chemical reagents [19]. One of these natural resources is the eggshell, a by-product that is treated as waste but that can be treated as the starting point for the synthesis of a highly useful bioceramic [15,19,20,21,22,23,24,25,26,27,28].
Both chitosan and HAp have been considered as important components for bone replacement [14]. The use of both compounds in the form of composites can contribute to a good integration of a biomaterial with the surrounding tissues. This is possible due to the high charge density of chitosan due to which it can interact with negatively charged surfaces such as proteins [14].
Therefore, in an attempt to reduce the deterioration (metallic dissolution, localized corrosion, etc.) caused by the electrochemical interaction between the surface of a biomaterial and body fluids, this study reports the electrochemical behavior of the surface of a biomaterial, such as Ti CP, modified by electrophoretic deposition (EPD) of chitosan–HAp composites. The HAp used was synthesized from eggshell at different precipitation pH conditions. Different chitosan–HAp composites were deposited on the biomaterial and the electrochemical response of its surface was measured using linear polarization techniques, open circuit potential (OCP) measurement, resistance to linear polarization (Rp), and electrochemical impedance spectroscopy (EIS) in artificial plasma.

2. Materials and Methods

2.1. Synthesis of Hydroxyapatite

The hydroxyapatite used in this study was obtained from eggshell. Various studies for the synthesis of hydroxyapatite from eggshell can be found in the literature [15,19,20,21,22,23,24,25,26,27,28]. In general, the first step involves pretreatment of the eggshell to obtain calcium oxide (CaO). In summary, this step involves removing the membrane adhered to its inner face, washing, drying, and crushing the eggshell to reduce its size to particles smaller than 5 mm. Subsequently, the crushed eggshell is subjected to a calcination process at 1000 °C to achieve its complete decomposition to CaO according to the following reaction:
C a C O 3 C a O + C O 2 ,
Once the CaO was obtained, the HAp was synthesized according to the procedure described by Muñoz-Sanchez et al. [15] and Mokhtar et al. [29] with some modifications. The starting reactants were CaO (obtained from the eggshell) and potassium dihydrogen phosphate (KH2PO4), the amounts used of each of them were those corresponding to the stoichiometry of HAp (Ca/P molar ratio = 1.67). For this, a 1 M solution of calcium nitrate (Ca(NO3)2) was prepared as follows: one mole of CaO was dissolved in distilled water followed by the addition of two moles of nitric acid (HNO3). On the other hand, a 6 M KH2PO4 solution was prepared with distilled water.
The (Ca(NO3)2) solution was added slowly (≈10 mL/min) to the KH2PO4 solution maintaining constant stirring and pH of the solution. Once the addition was finished, stirring was maintained for 4 h, and later it was left to rest for 12 h for the complete precipitation of HAp. The HAp was recovered by filtration and dried at 100 °C for 6 h. After drying, the HAp was pulverized in an agate mortar and in that condition; it was used for subsequent tests.
In this study, the synthesis of HAp was carried out at different pH values, namely 8, 9, 10, and 11. The pH of the solution during the synthesis was regulated by the addition of ammonium hydroxide (NH4OH) solution.

2.2. Electrophoretic Deposition

Chitosan–HAp films were deposited onto Ti CP. Ti CP plates (10 × 10 × 3 mm) which was used a as cathode, and a graphite plate (area greater than cathode) was used as an anode, with an anode–cathode separation distance of 10 mm. Prior to deposition, a Cu wire was welded to the Ti CP plates using the spot-welding technique and encapsulated in epoxy resin. In this condition, they were superficially prepared with abrasive paper from 120 to 600 grain and washed with distilled water and ethanol.
Low molecular weight deacetylated chitosan (Sigma-Aldrich, Iceland, Deacetylated chitin) was used to prepare the chitosan solutions. Different solutions were prepared according to what is indicated in Table 1.
The chitosan solution was prepared by dissolving 0.5 g of chitosan in a 1% (v/v) acetic acid solution and graduated to one liter. The different chitosan–HAp solutions were prepared by adding the amounts of HAp indicated in Table 1 plus 0.5 g of chitosan in a 1% (v/v) acetic acid solution and graduated to one liter of solution. Each solution was kept under stirring for 24 h and subsequently filtered for use in electrophoretic deposition tests. Electrophoretic deposition was performed using an ethanol–(chitosan–HAp solution) mixture, where the percentage of chitosan–HAp solution was 17% (v/v). The deposition of the films was carried out applying a voltage of 5 V and a deposition time of two hours [30]. Once the films were deposited onto Ti CP surface, they were allowed to dry at room temperature for 24 h before any further analysis or use.

2.3. Electrochemical Evaluation

Both the Ti CP and the different deposited films were evaluated in artificial plasma at 37 ± 1 °C. Table 2 shows the composition for the formulation of the simulated physiological fluid [31]:
The electrochemical performance of the different surfaces was determined by potentiodynamic polarization tests, open circuit potential (OCP) measurements, resistance to linear polarization (Rp) measurements, and electrochemical impedance spectroscopy (EIS) using a Gamry Potentiostat/Galvanostat (model 1010E). Measurements were made using a typical arrangement of three electrodes, where the different surfaces were used as a working electrode; a saturated calomel electrode as reference electrode, and a graphite rod as counter electrode.
The potentiodynamic polarization curves were obtained by polarizing the different surfaces from −300 to 2300 mV with respect to their corrosion potential, using a scan rate of 1 mV/s. The estimation of the electrochemical parameters was performed by extrapolating the anodic and cathodic regions in an interval of ±250 mV (Tafel extrapolation) around the corrosion potential. OCP measurements were made by measuring the potential of the working electrode relative to the reference electrode at hourly intervals for a duration of 24 h. Rp measurements were carried out at hourly intervals, with a duration of 24 h. For this, the working electrode was polarized ±10 mV with respect to its OCP at a scan rate of 0.1667 mV/s. The Rp value was obtained from the slope of the current–potential relationship (i-E) obtained. Electrochemical impedance spectra (EIS) were obtained by applying to the surface of the working electrode a ±10 mV (AC) perturbation with respect to the OCP of the working electrode over a frequency range of 100 kHz to 0.01 Hz. The measurements were made from an initial measurement (0 h) and later at 3, 6, 9, 12, 18, and 24 h of immersion.
In all cases, before starting any measurement, once the working electrode was introduced into the electrolyte, the electrochemical cell was allowed to stabilize for 15 min.

3. Results

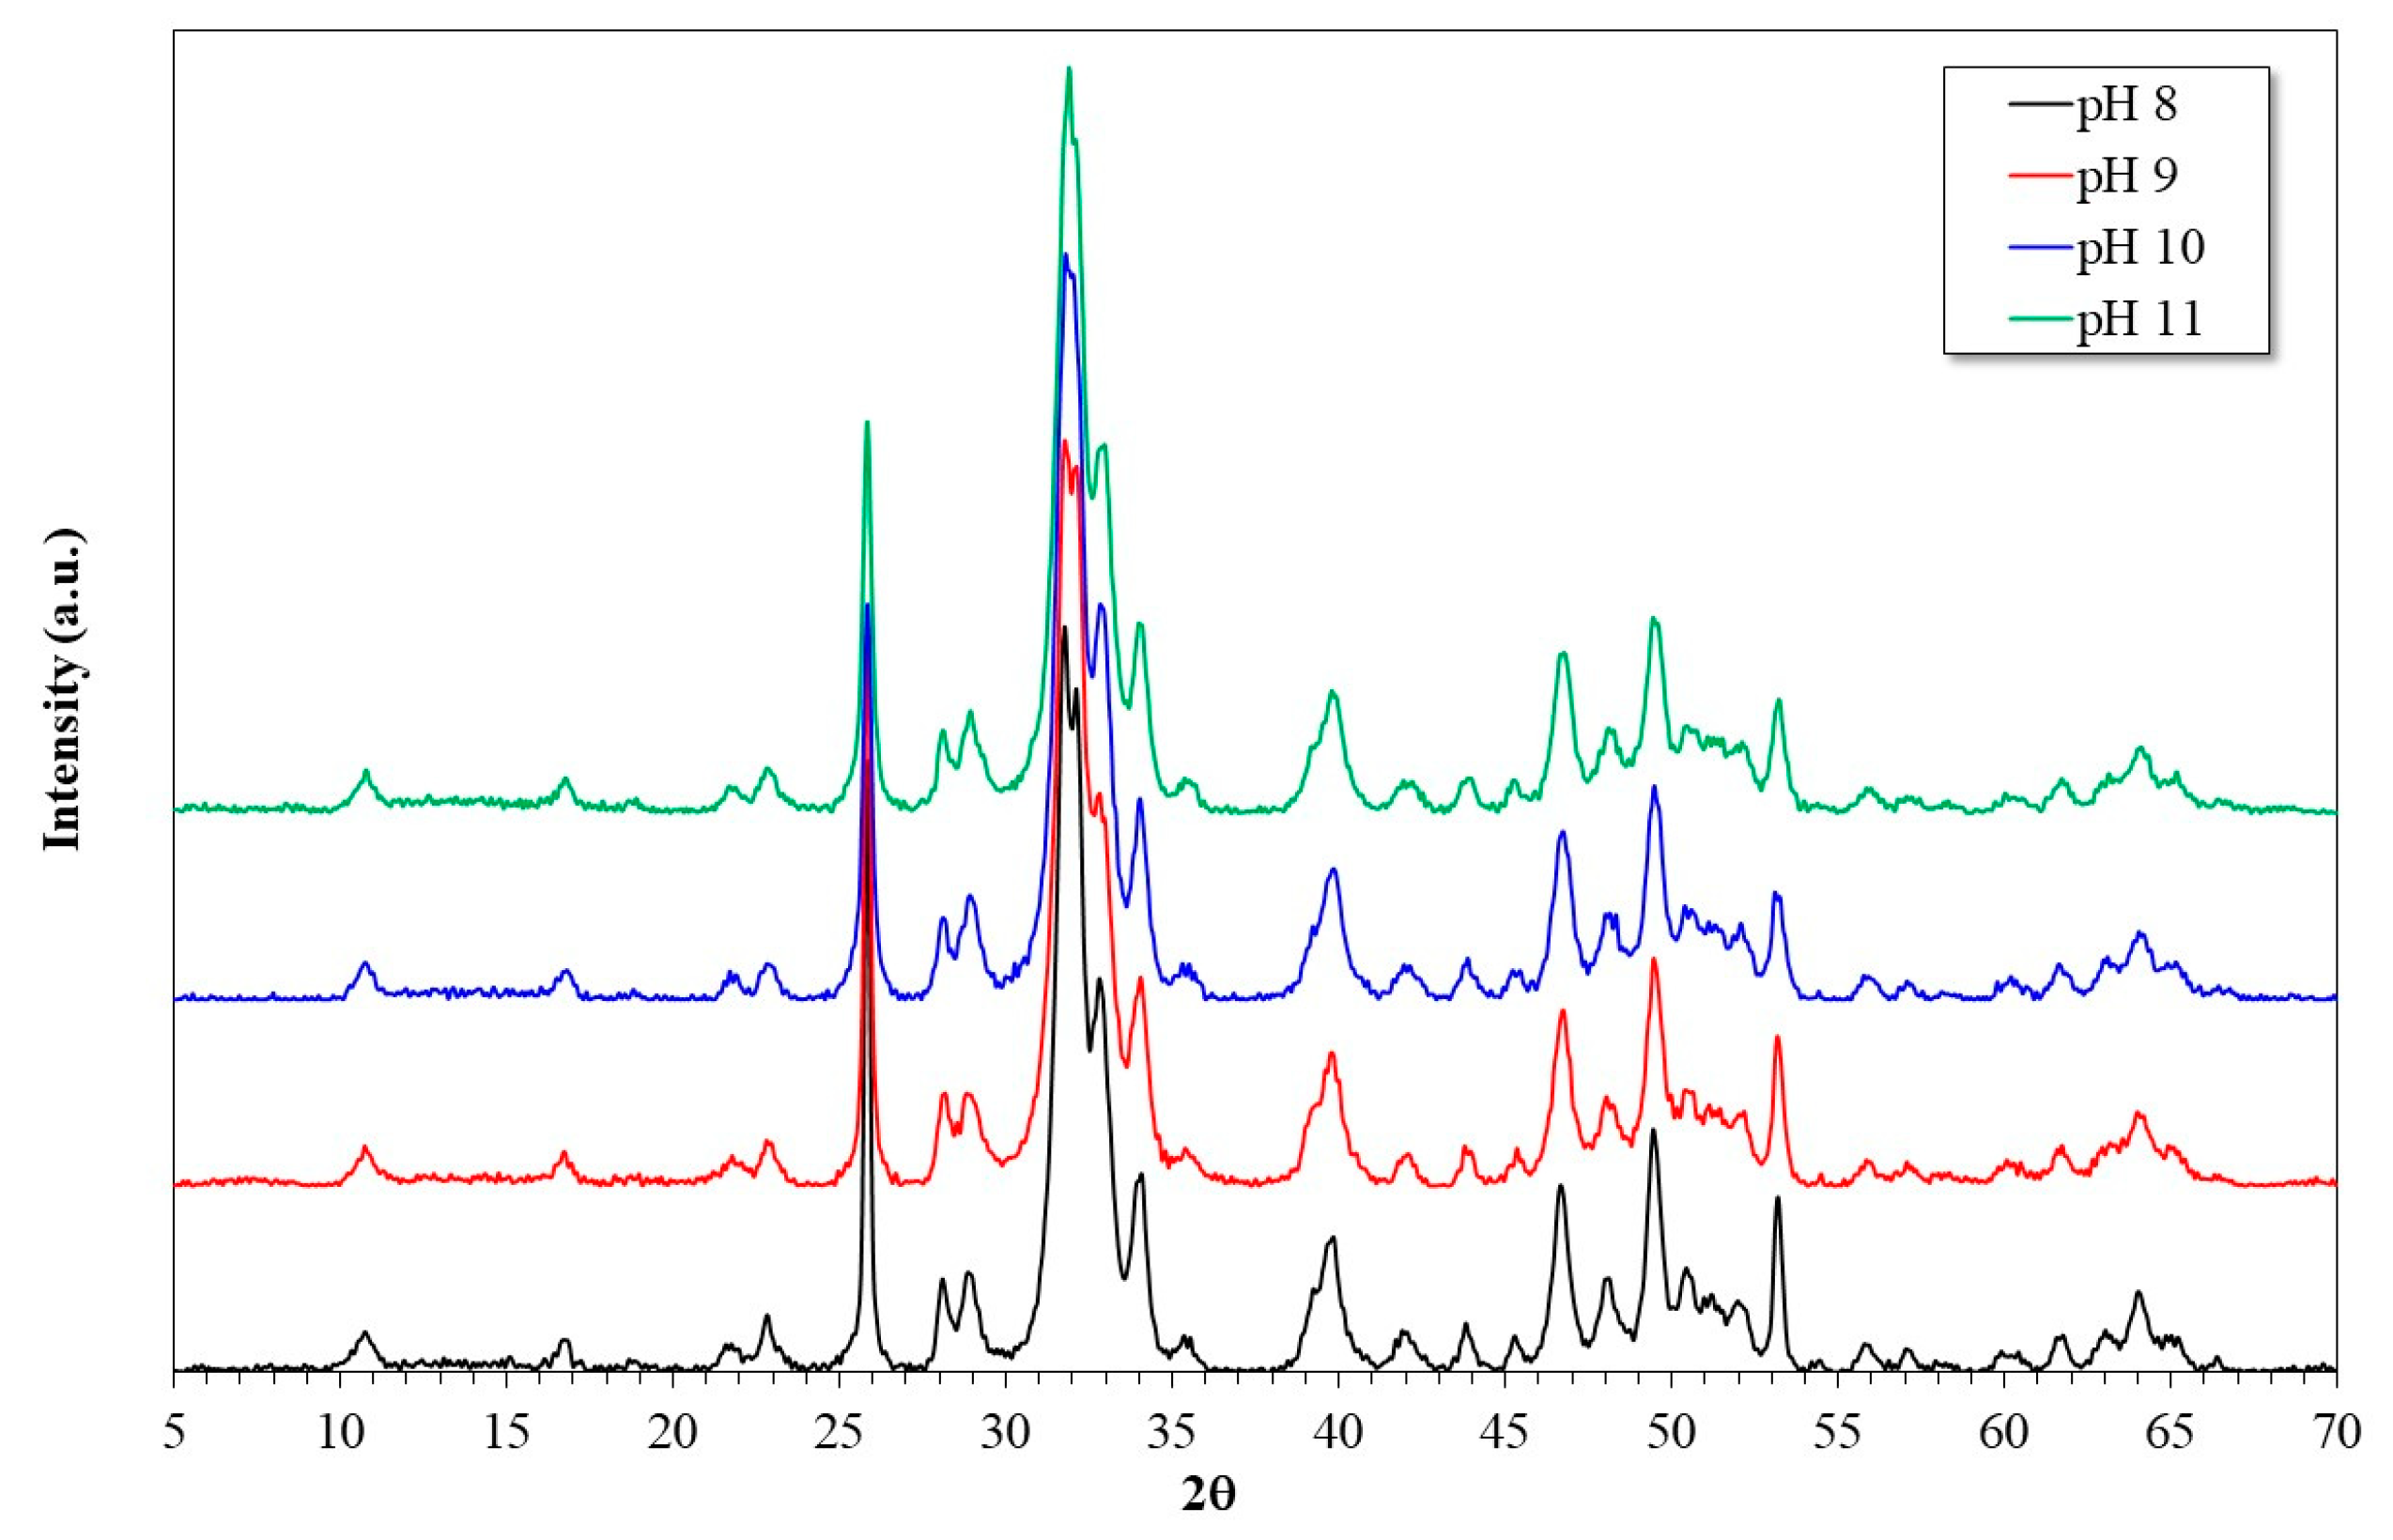
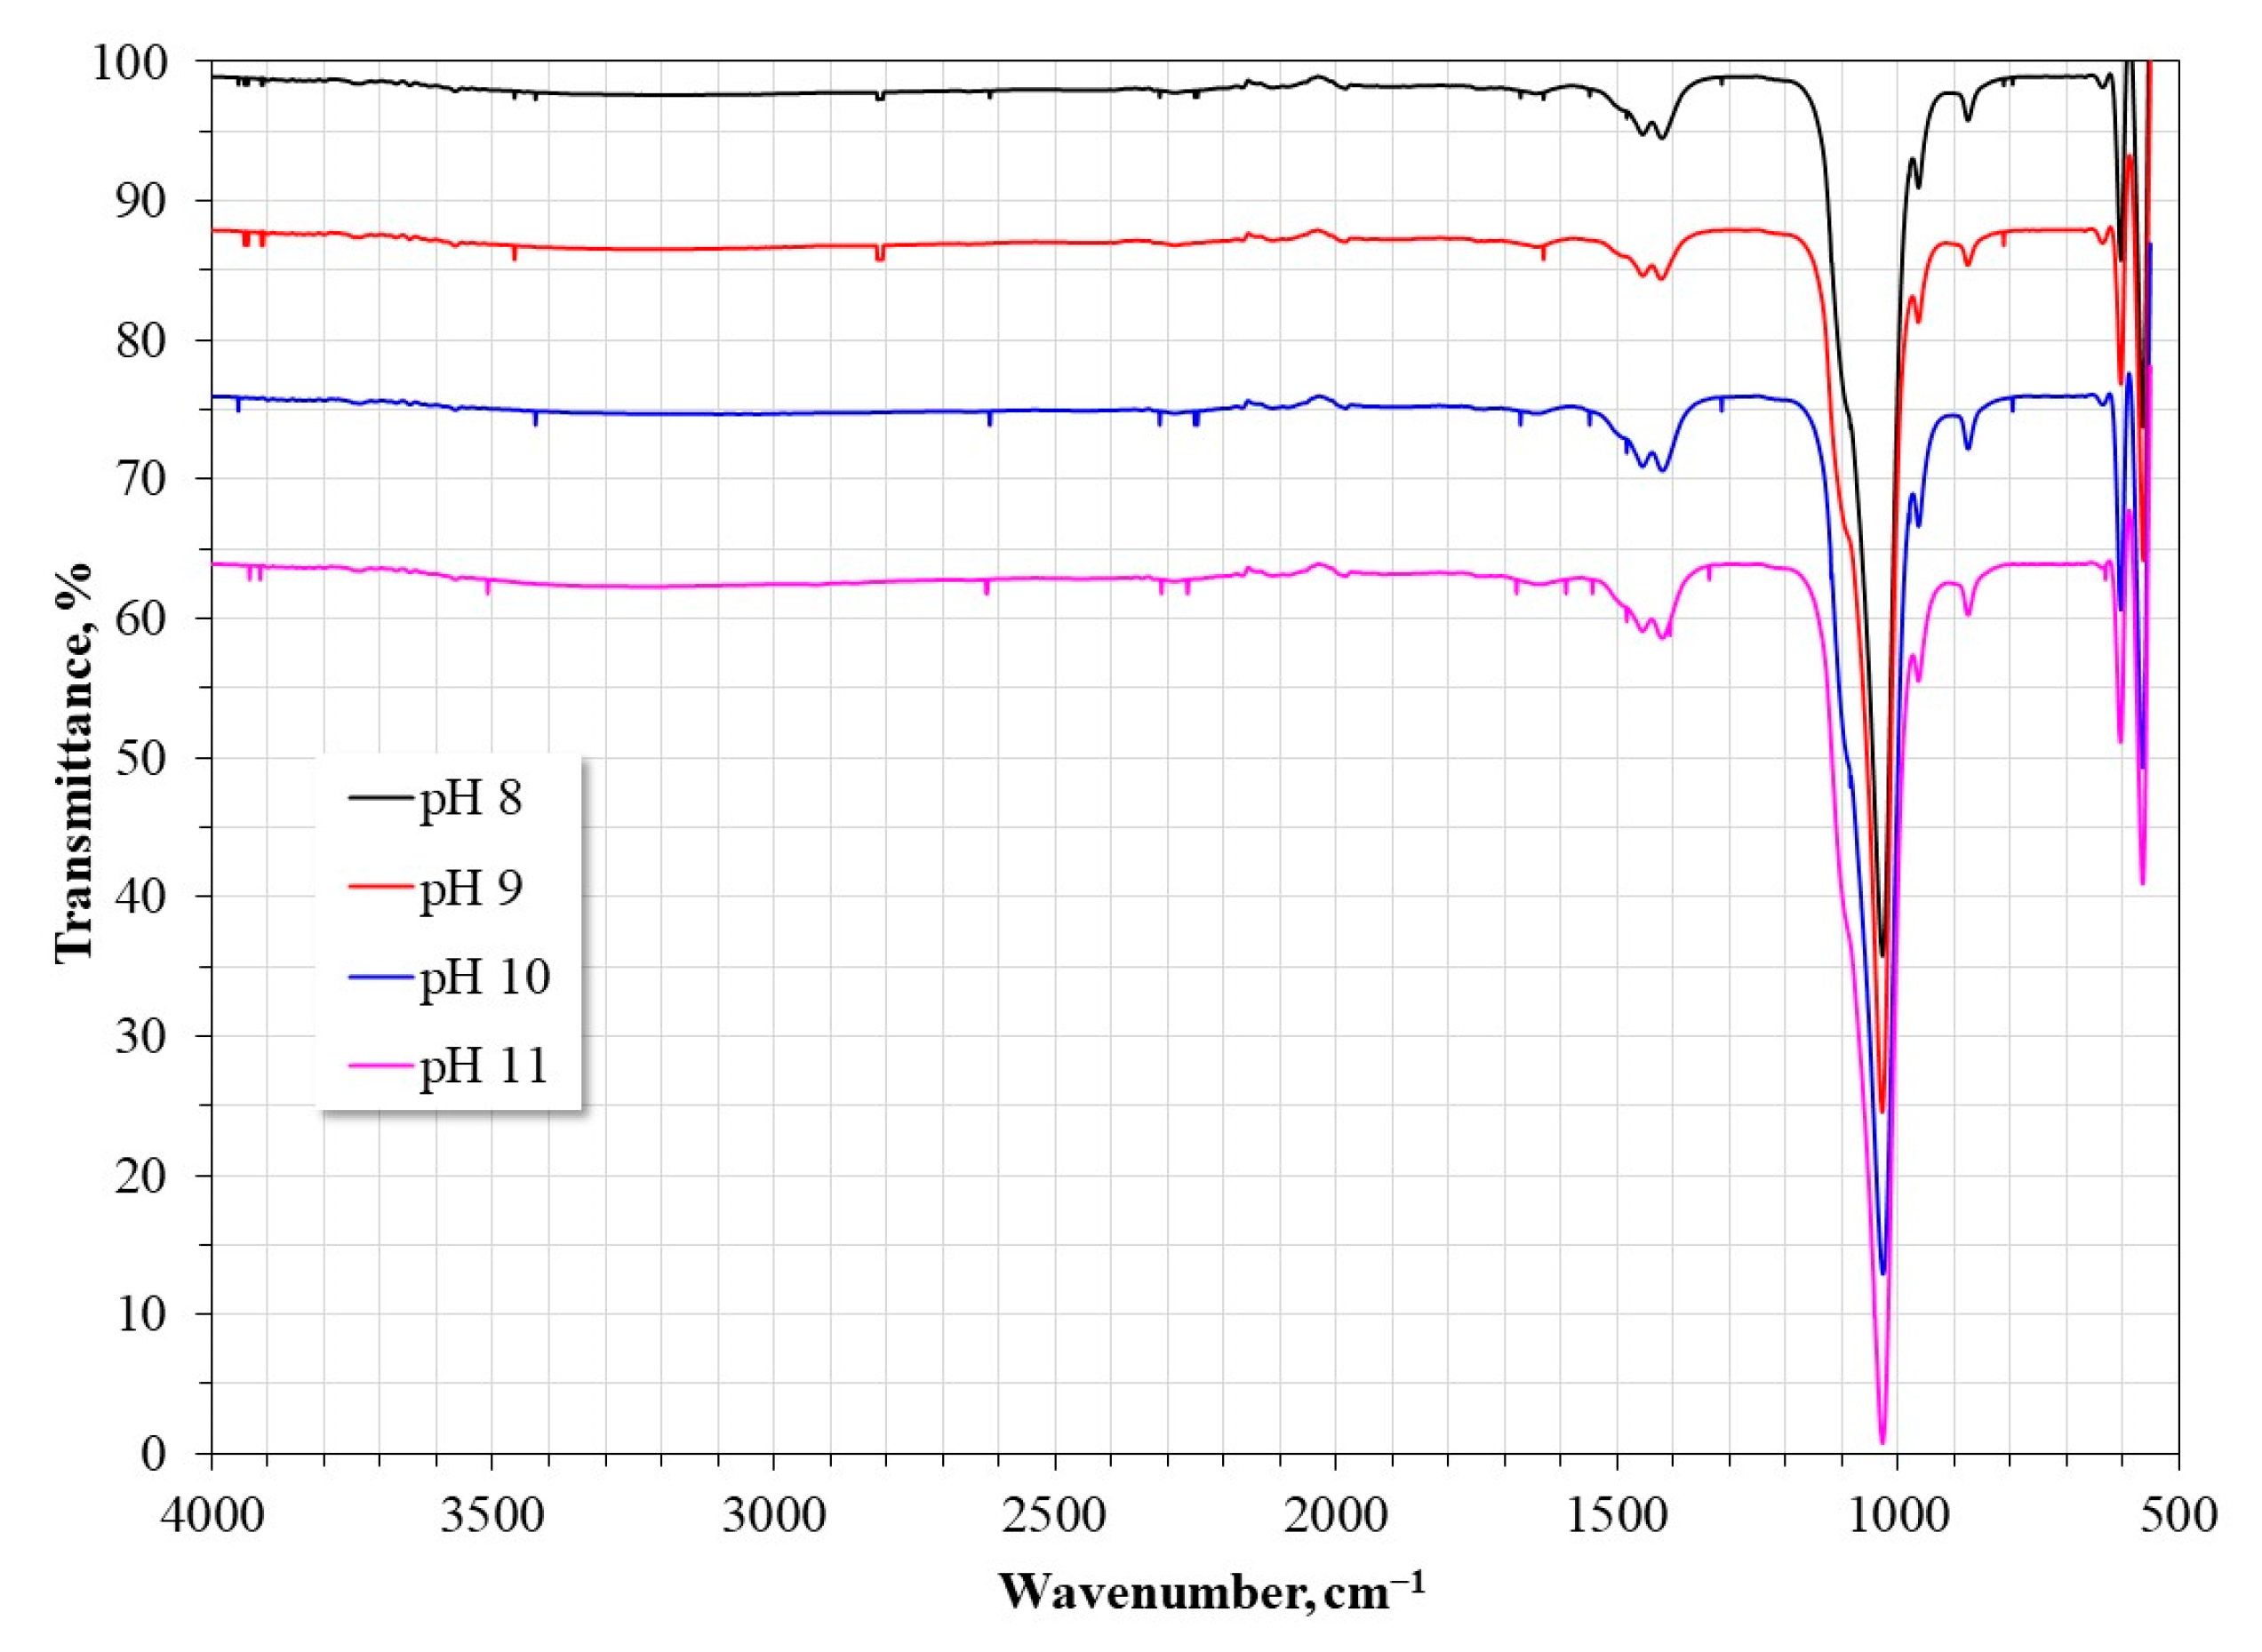
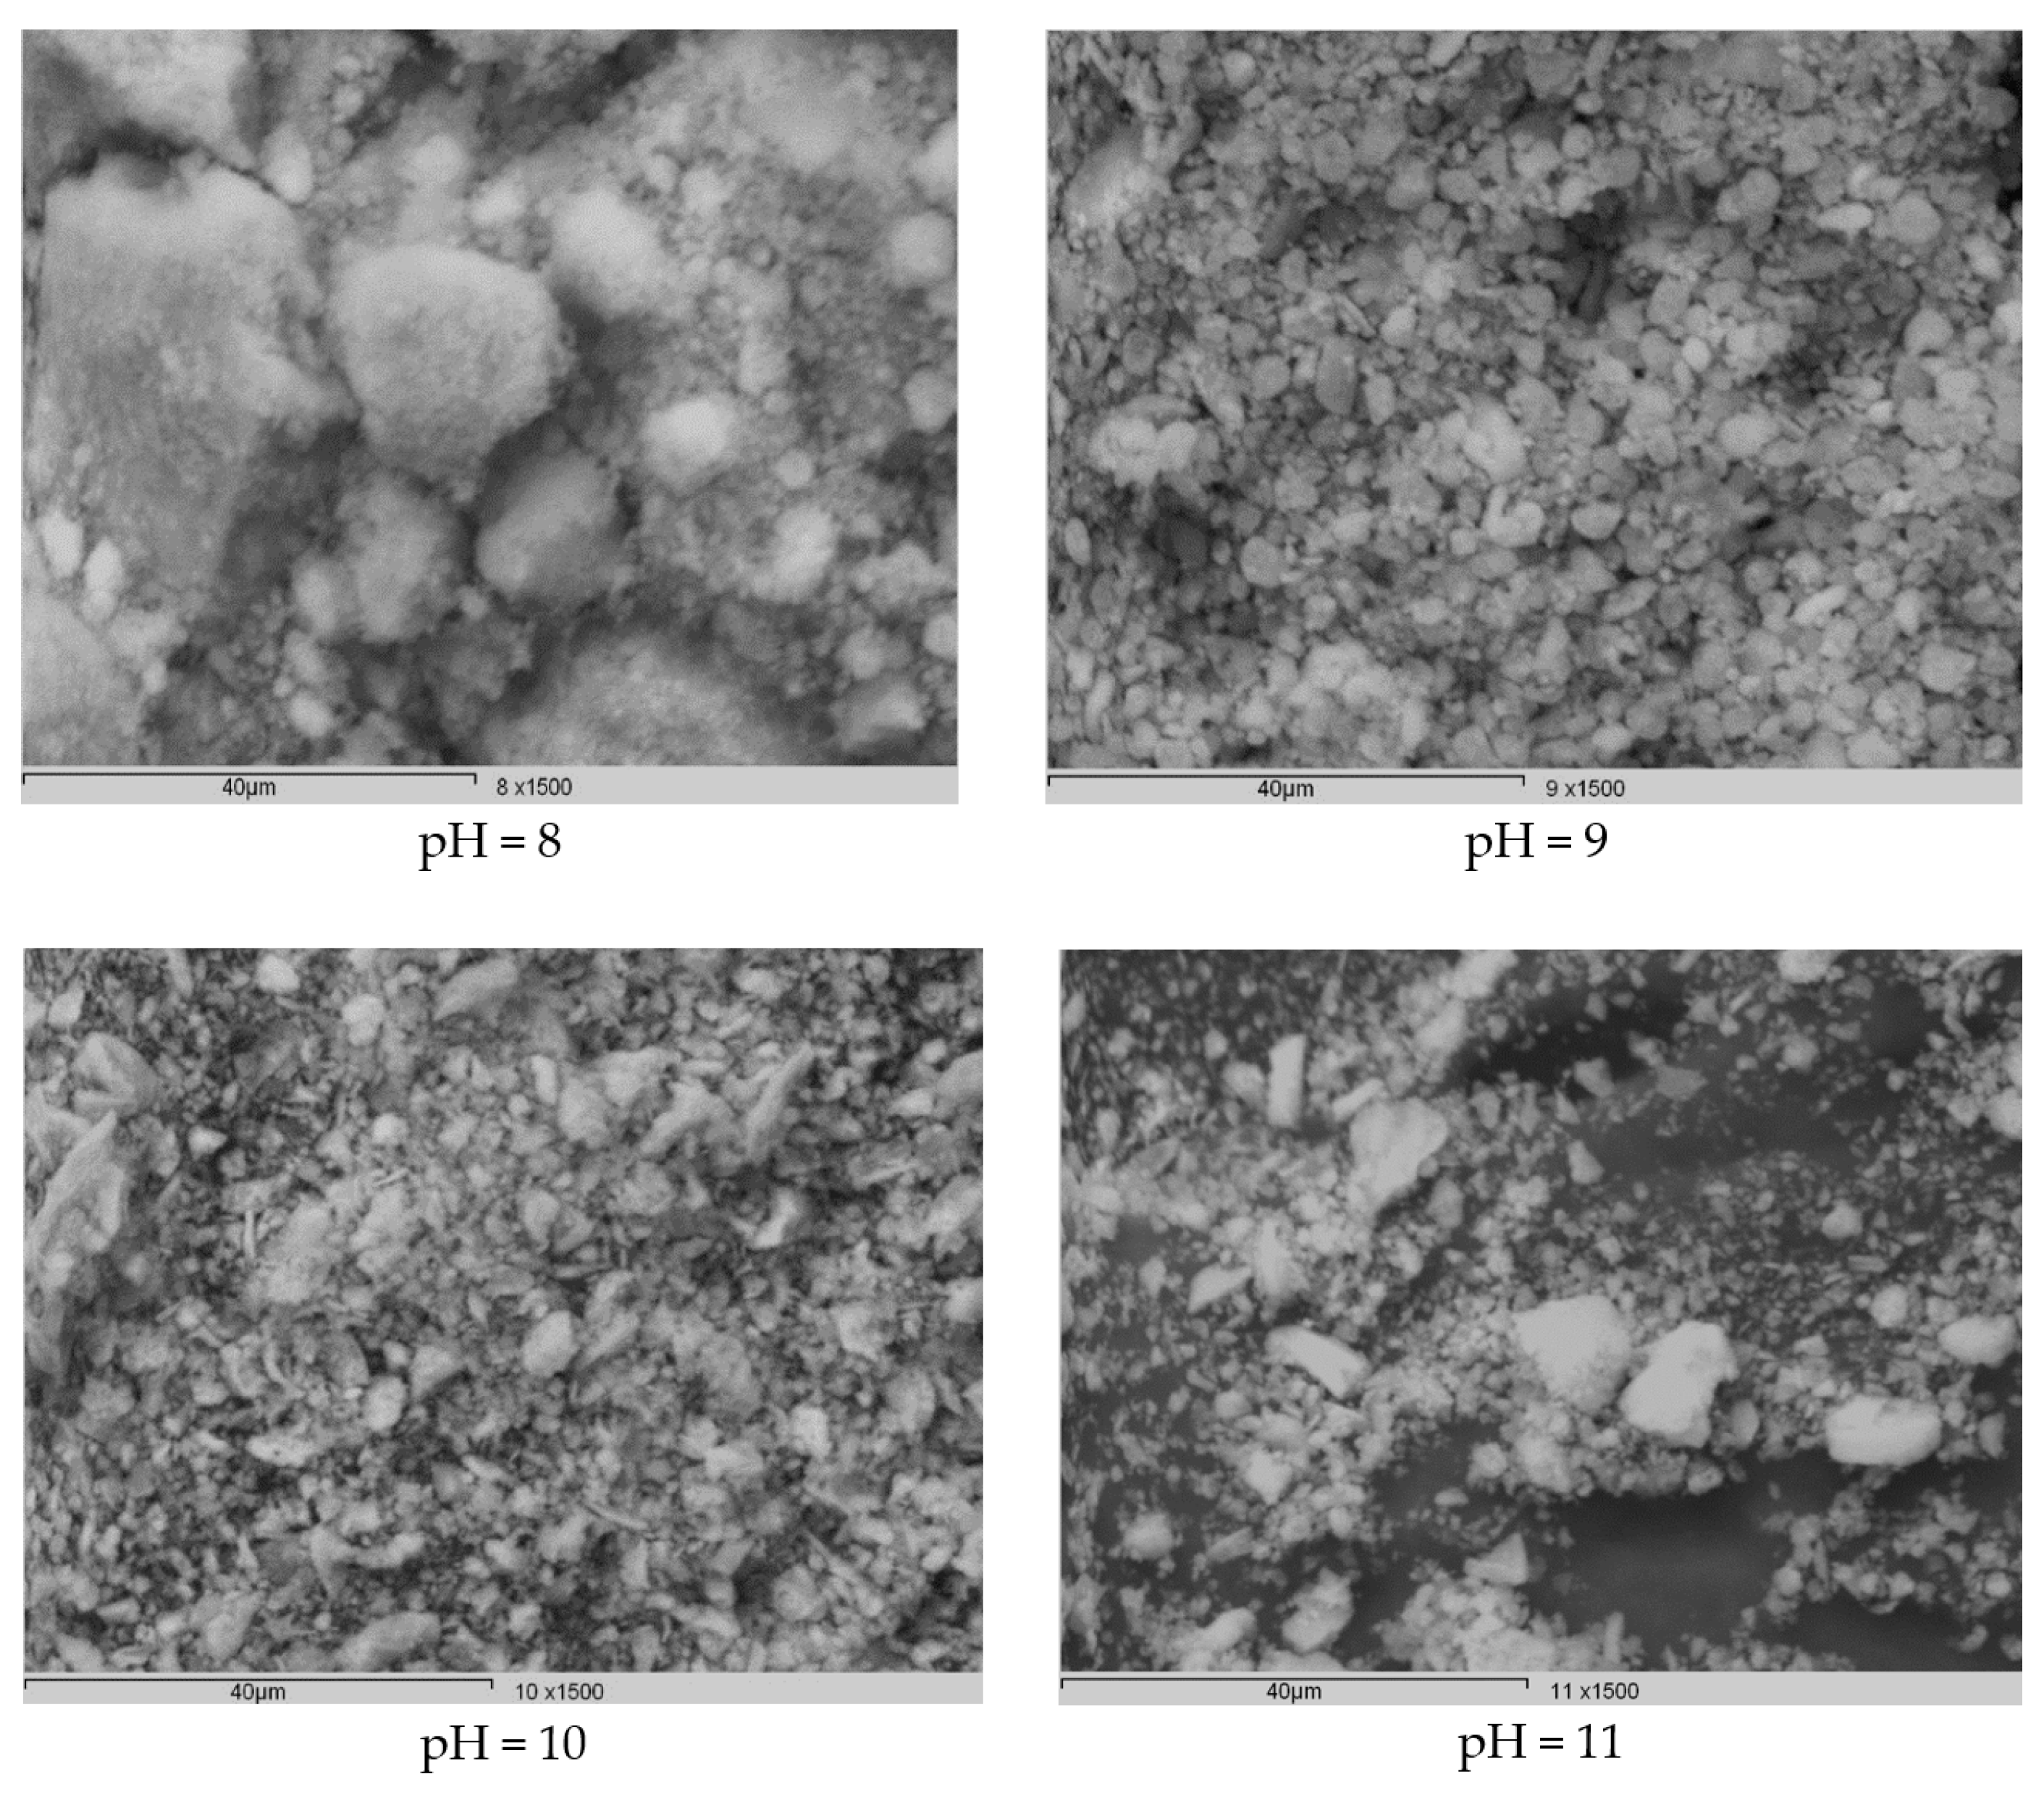
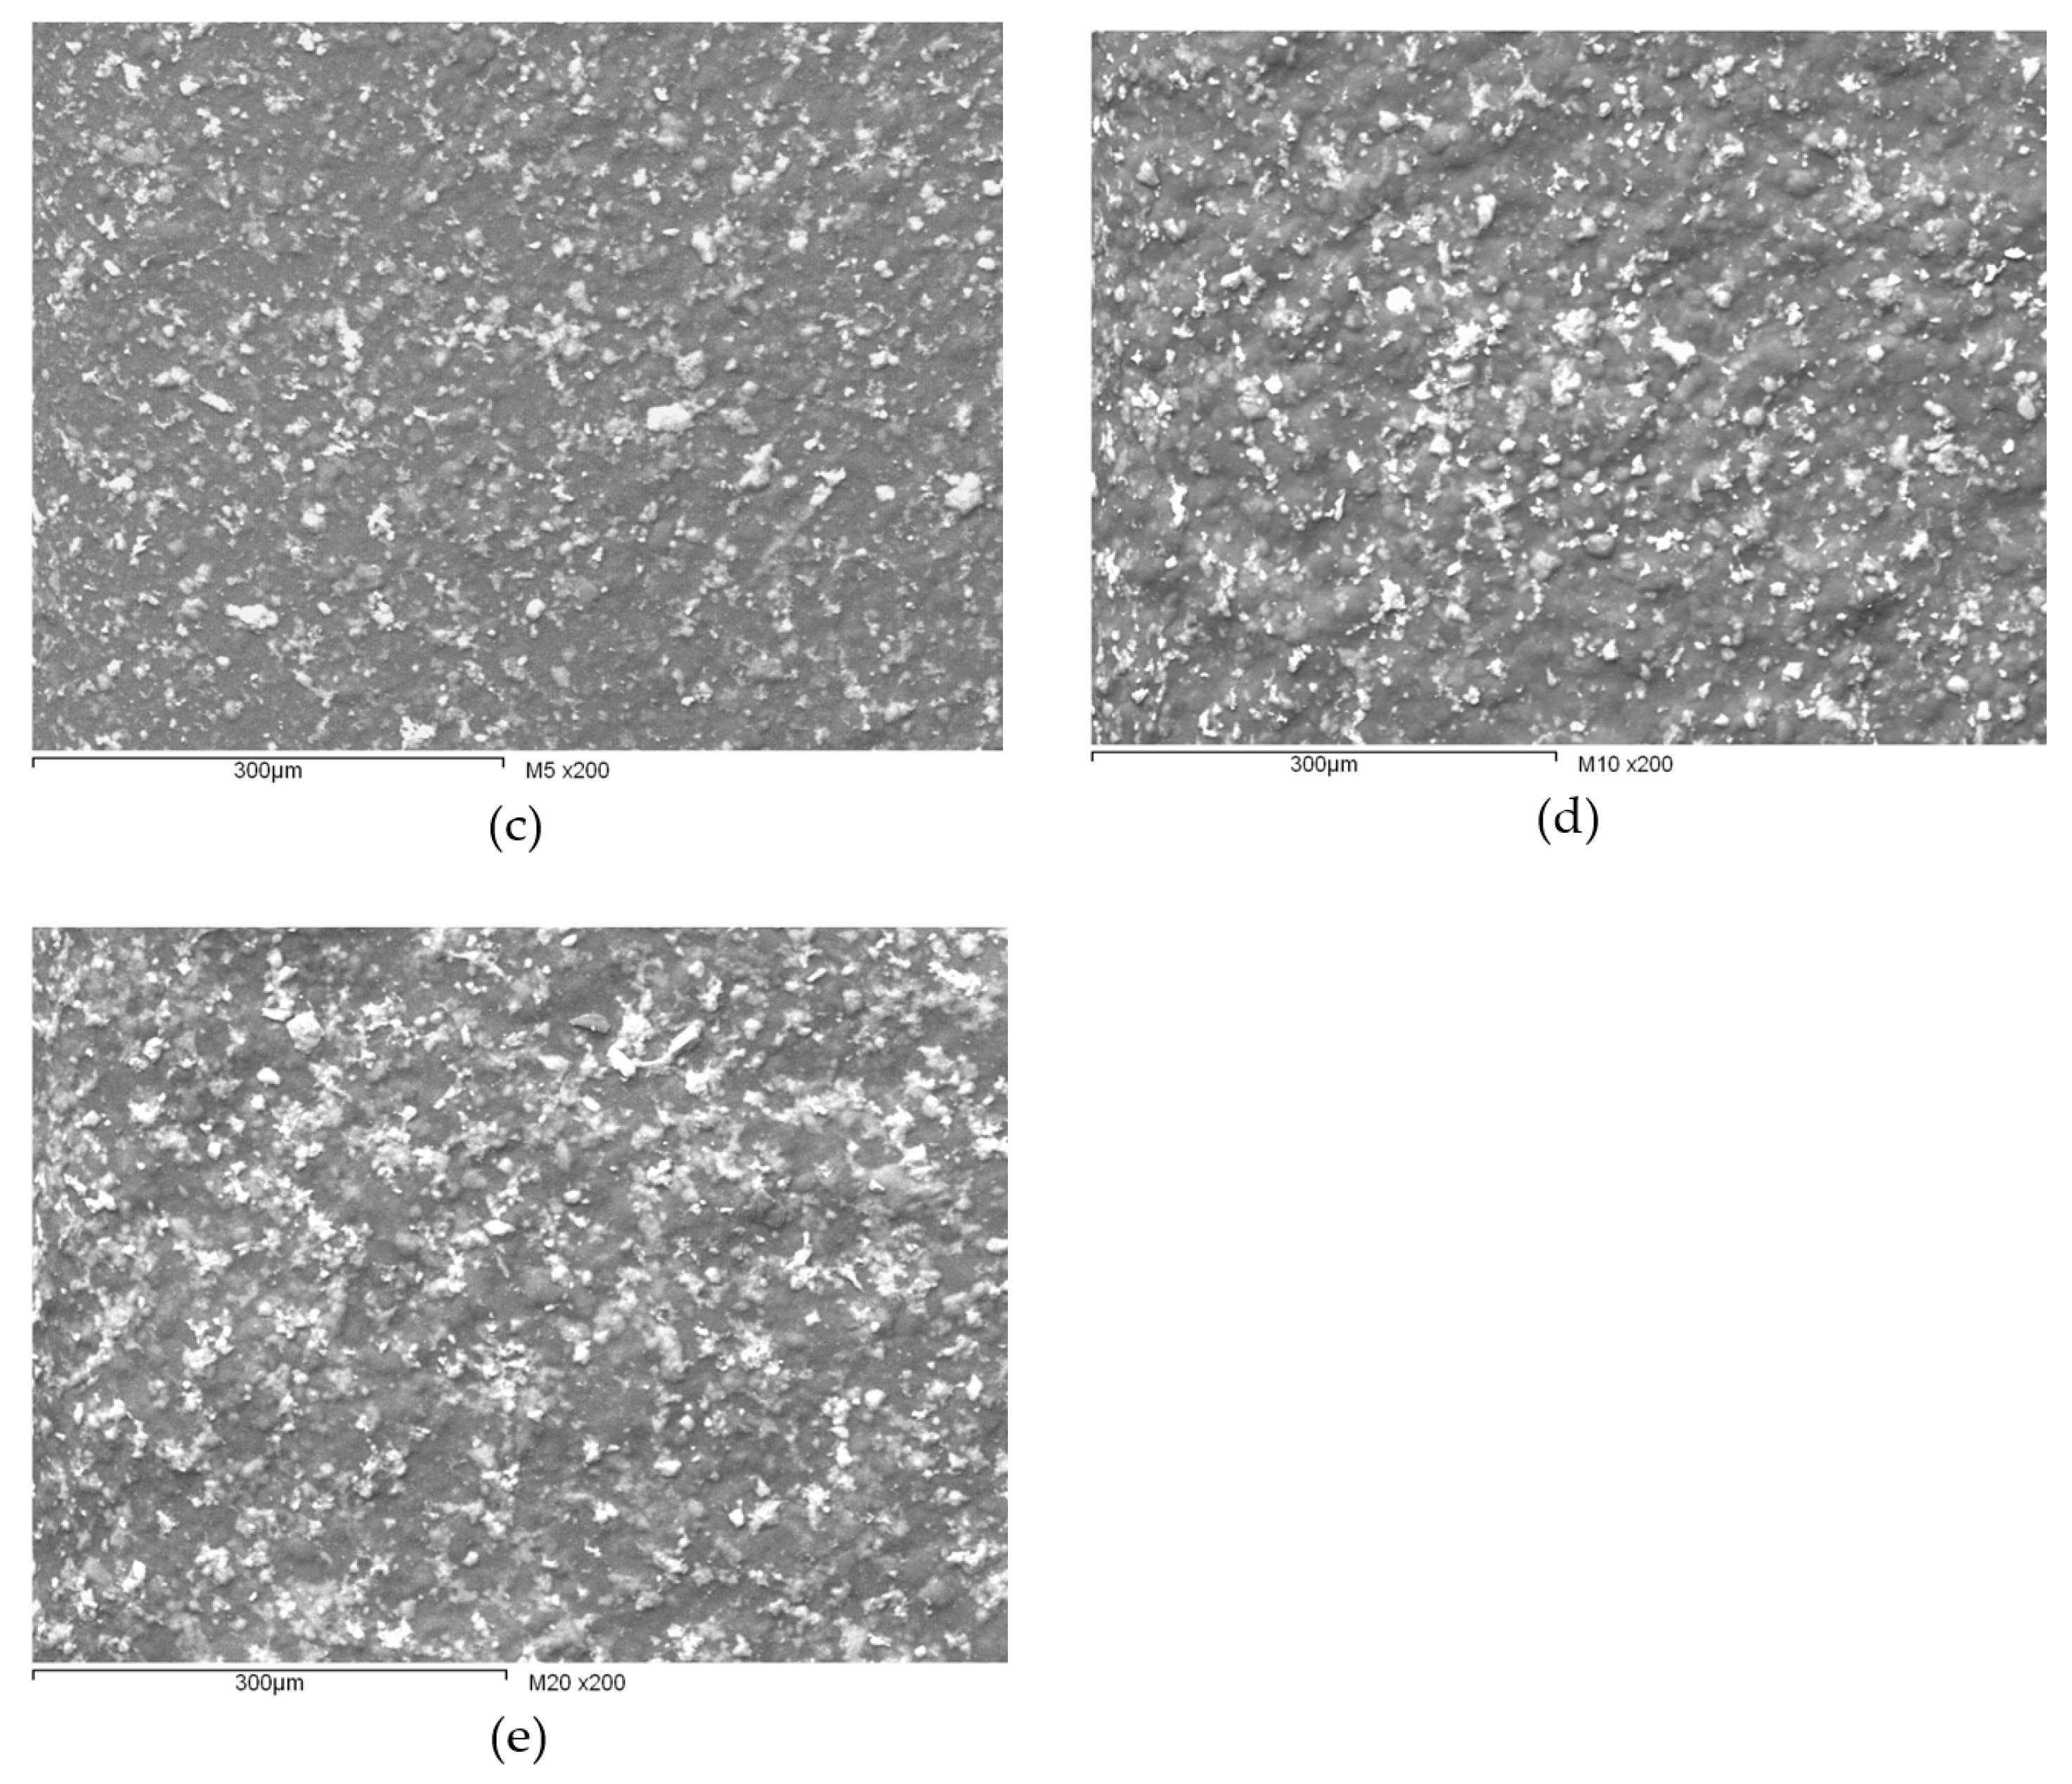
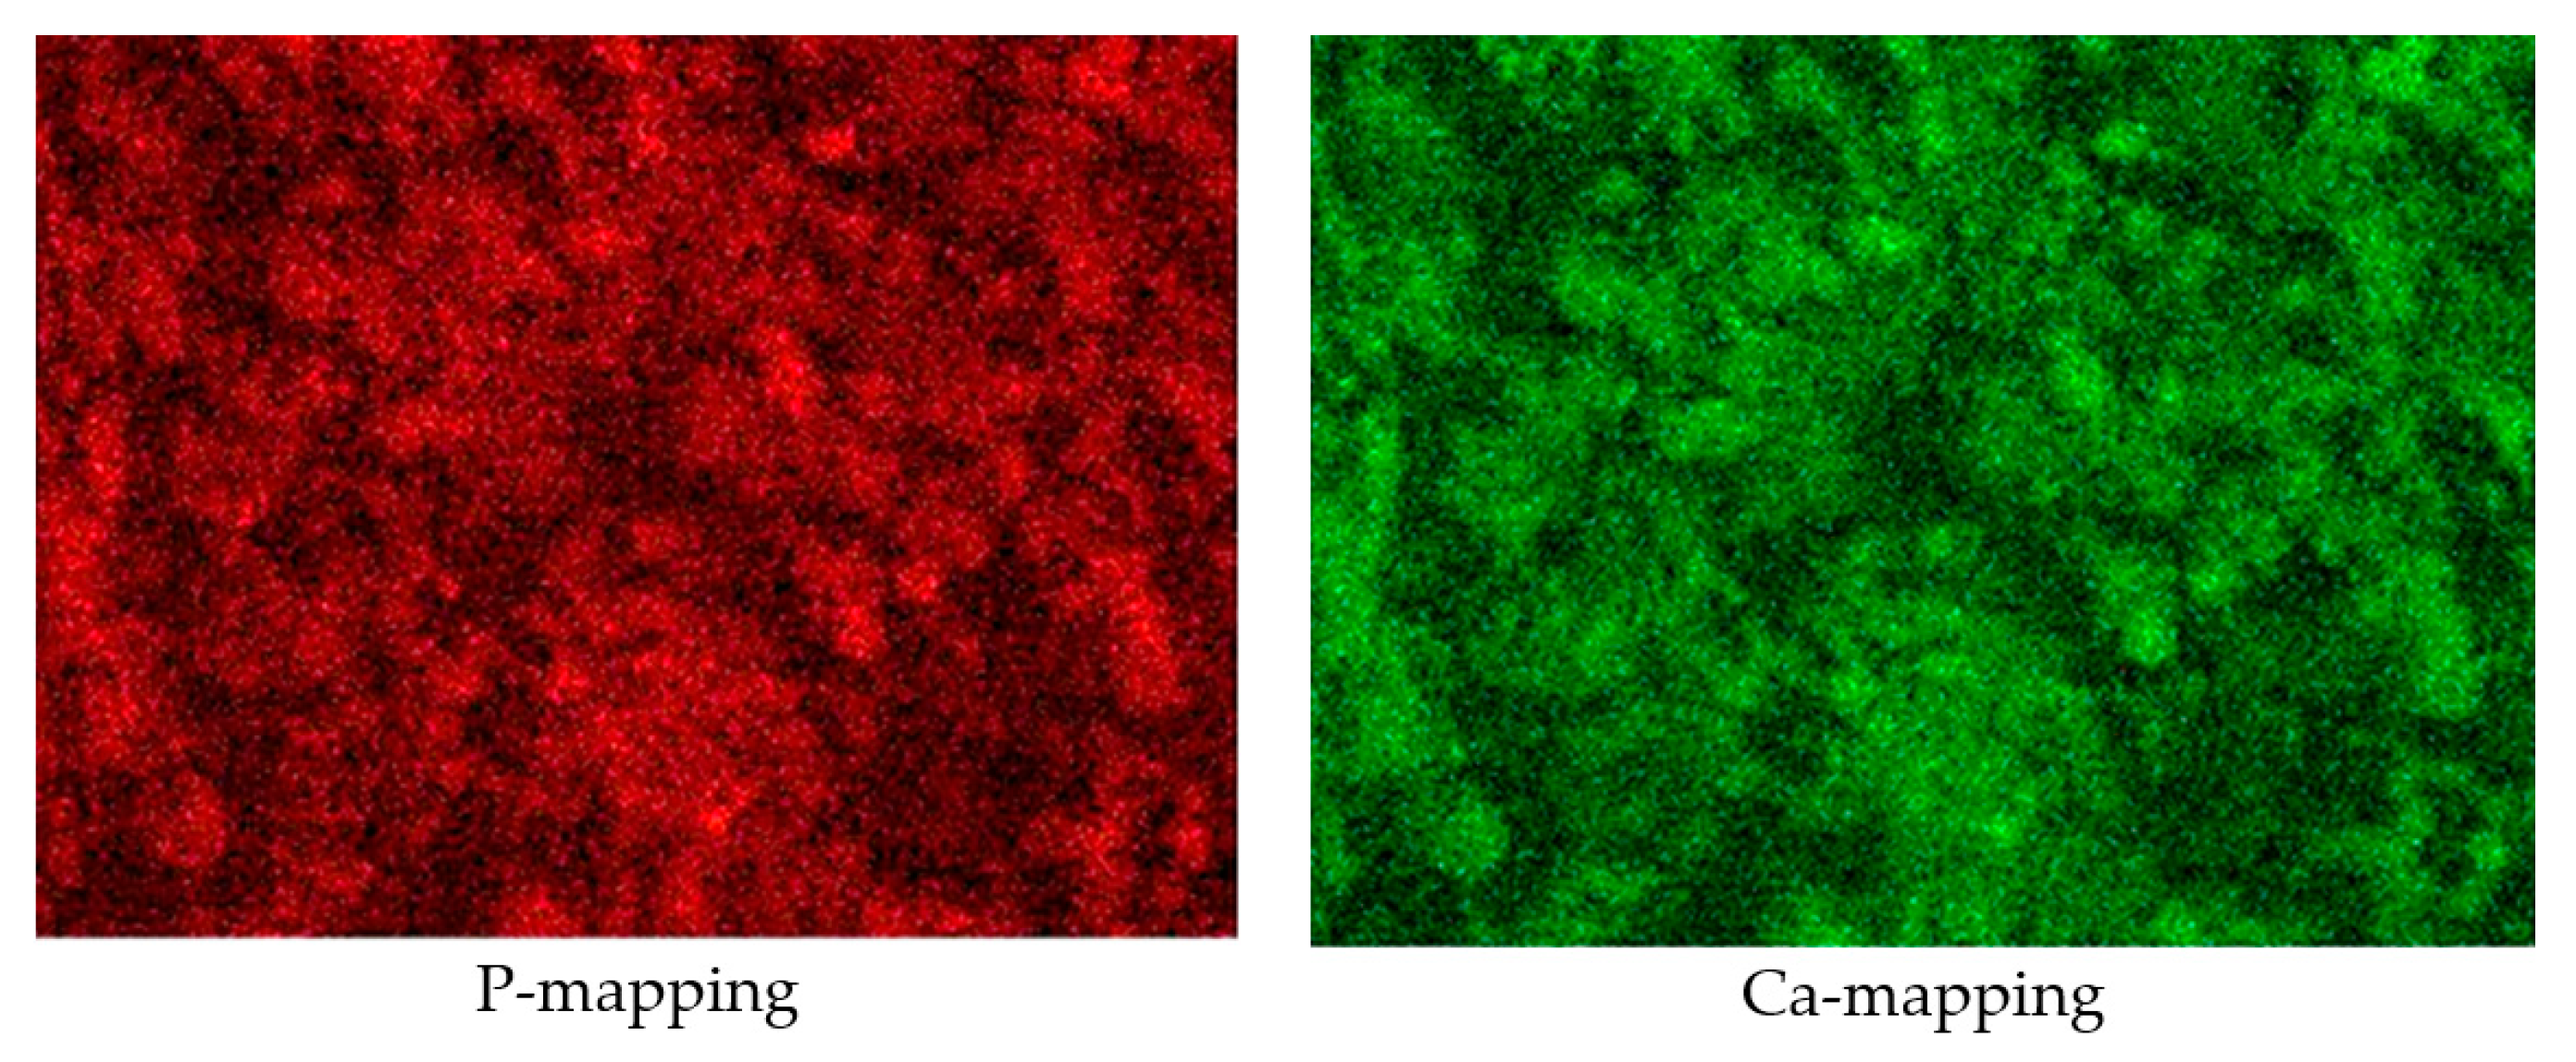
3.1. Characterization of the Synthesized HAp and Deposited Films

Figure 1 shows the X-ray diffraction pattern of HAp obtained at different pH conditions.
The analyses showed that regardless of the synthesis pH, it is possible to obtain crystalline HAp. The diffraction peaks correspond to pure and stoichiometric HAp ((Ca10(PO4)6(OH)2) according to the Powder Diffraction File (00-076-0694, 00-003-0747, 00-073-1731, 00-086 -0740, 00-074-0566). Identical X-ray diffraction patterns have been reported in other studies for HAp obtained from eggshell [15,19,24,26,32]. According to the Scherrer equation applied to the highest diffraction peak (2θ ≈ 31.8), the size of the crystallite (D) was determined [19]:
D = K λ β   c o s θ   ,
where crystallite size is in nanometers, λ = wavelength of incident radiation (nm), K = 0.94 (Scherer’s constant), θ = angle of diffraction (rad), and β   = width at half maximum of the X-ray reflection (rad). The results obtained indicated that regardless of the pH of synthesis, the size of the crystallite was 55.3 ± 0.01 nm. This is consistent since when all the diffraction patterns overlap, they completely coincide with each other.
Figure 2 shows the FT-IR spectra of the HAp obtained at different pH conditions. A comparison of the different signals obtained showed that the FT-IR spectra are identical regardless of the pH of the synthesis process. Furthermore, the observed vibrational modes are identical to those reported in other studies [15,22,24,26,27,28]. The main signals associated with the (PO4)3− group are well defined at wavelengths 960 and 1030 cm−1, associated with stretching vibrations, and at 568 and 301 cm−1 related to the bending mode of PO−34. The absence of peaks at 3570, 3449, 1665, and 1733 cm–1 indicates the absence of moisture.
Figure 3 shows the morphological aspects of HAp synthesized at different pH conditions. Micrographs show that at a synthesis pH of 8, HAp particles form clumps of submicron particles and a spongy appearance is observed. However, by increasing the synthesis pH, the particles are smaller, appearing dense and fragile. Due to this, in subsequent studies, it was decided to work with the HAp synthesized at pH = 8.
After the electrophoretic deposition process, the films were allowed to dry at room temperature for 24 h and under these conditions they were used for electrochemical studies. The films were analyzed by SEM-EDS to determine their morphological aspects, elemental chemical composition, and element distribution.
Figure 4 shows the morphological characteristics of the films deposited on the Ti CP surface. In the absence of HAp, it was observed that the chitosan film showed a uniform surface free of bubbles that could have formed due to trapped hydrogen during the deposition process. However, with the addition of HAp, the surface aspects show a surface with protuberances due to the HAp particles embedded in the film structure, and by increasing its concentration the amount of particles on the surface increased notably. This may be evidence of the distribution and quantity of particles embedded within the structure of the films formed.
Figure 5 shows a closer view at higher magnification of the surface of the 20 g HAp film and the mapping of its main elements. In general, it was observed that the incorporation of HAp particles reduced the intensity of the Ti signal and the density of Ca and P increased. A more homogeneous distribution in Ca and P was observed at the maximum incorporated concentration (Figure 5), which suggests a high density of HAp particles incorporated into the chitosan structure. This indicates that the presence of the bioceramic will be an additional barrier to the free diffusion of the aggressive species of the electrolyte and thus can contribute to increasing the corrosion resistance of the substrate.

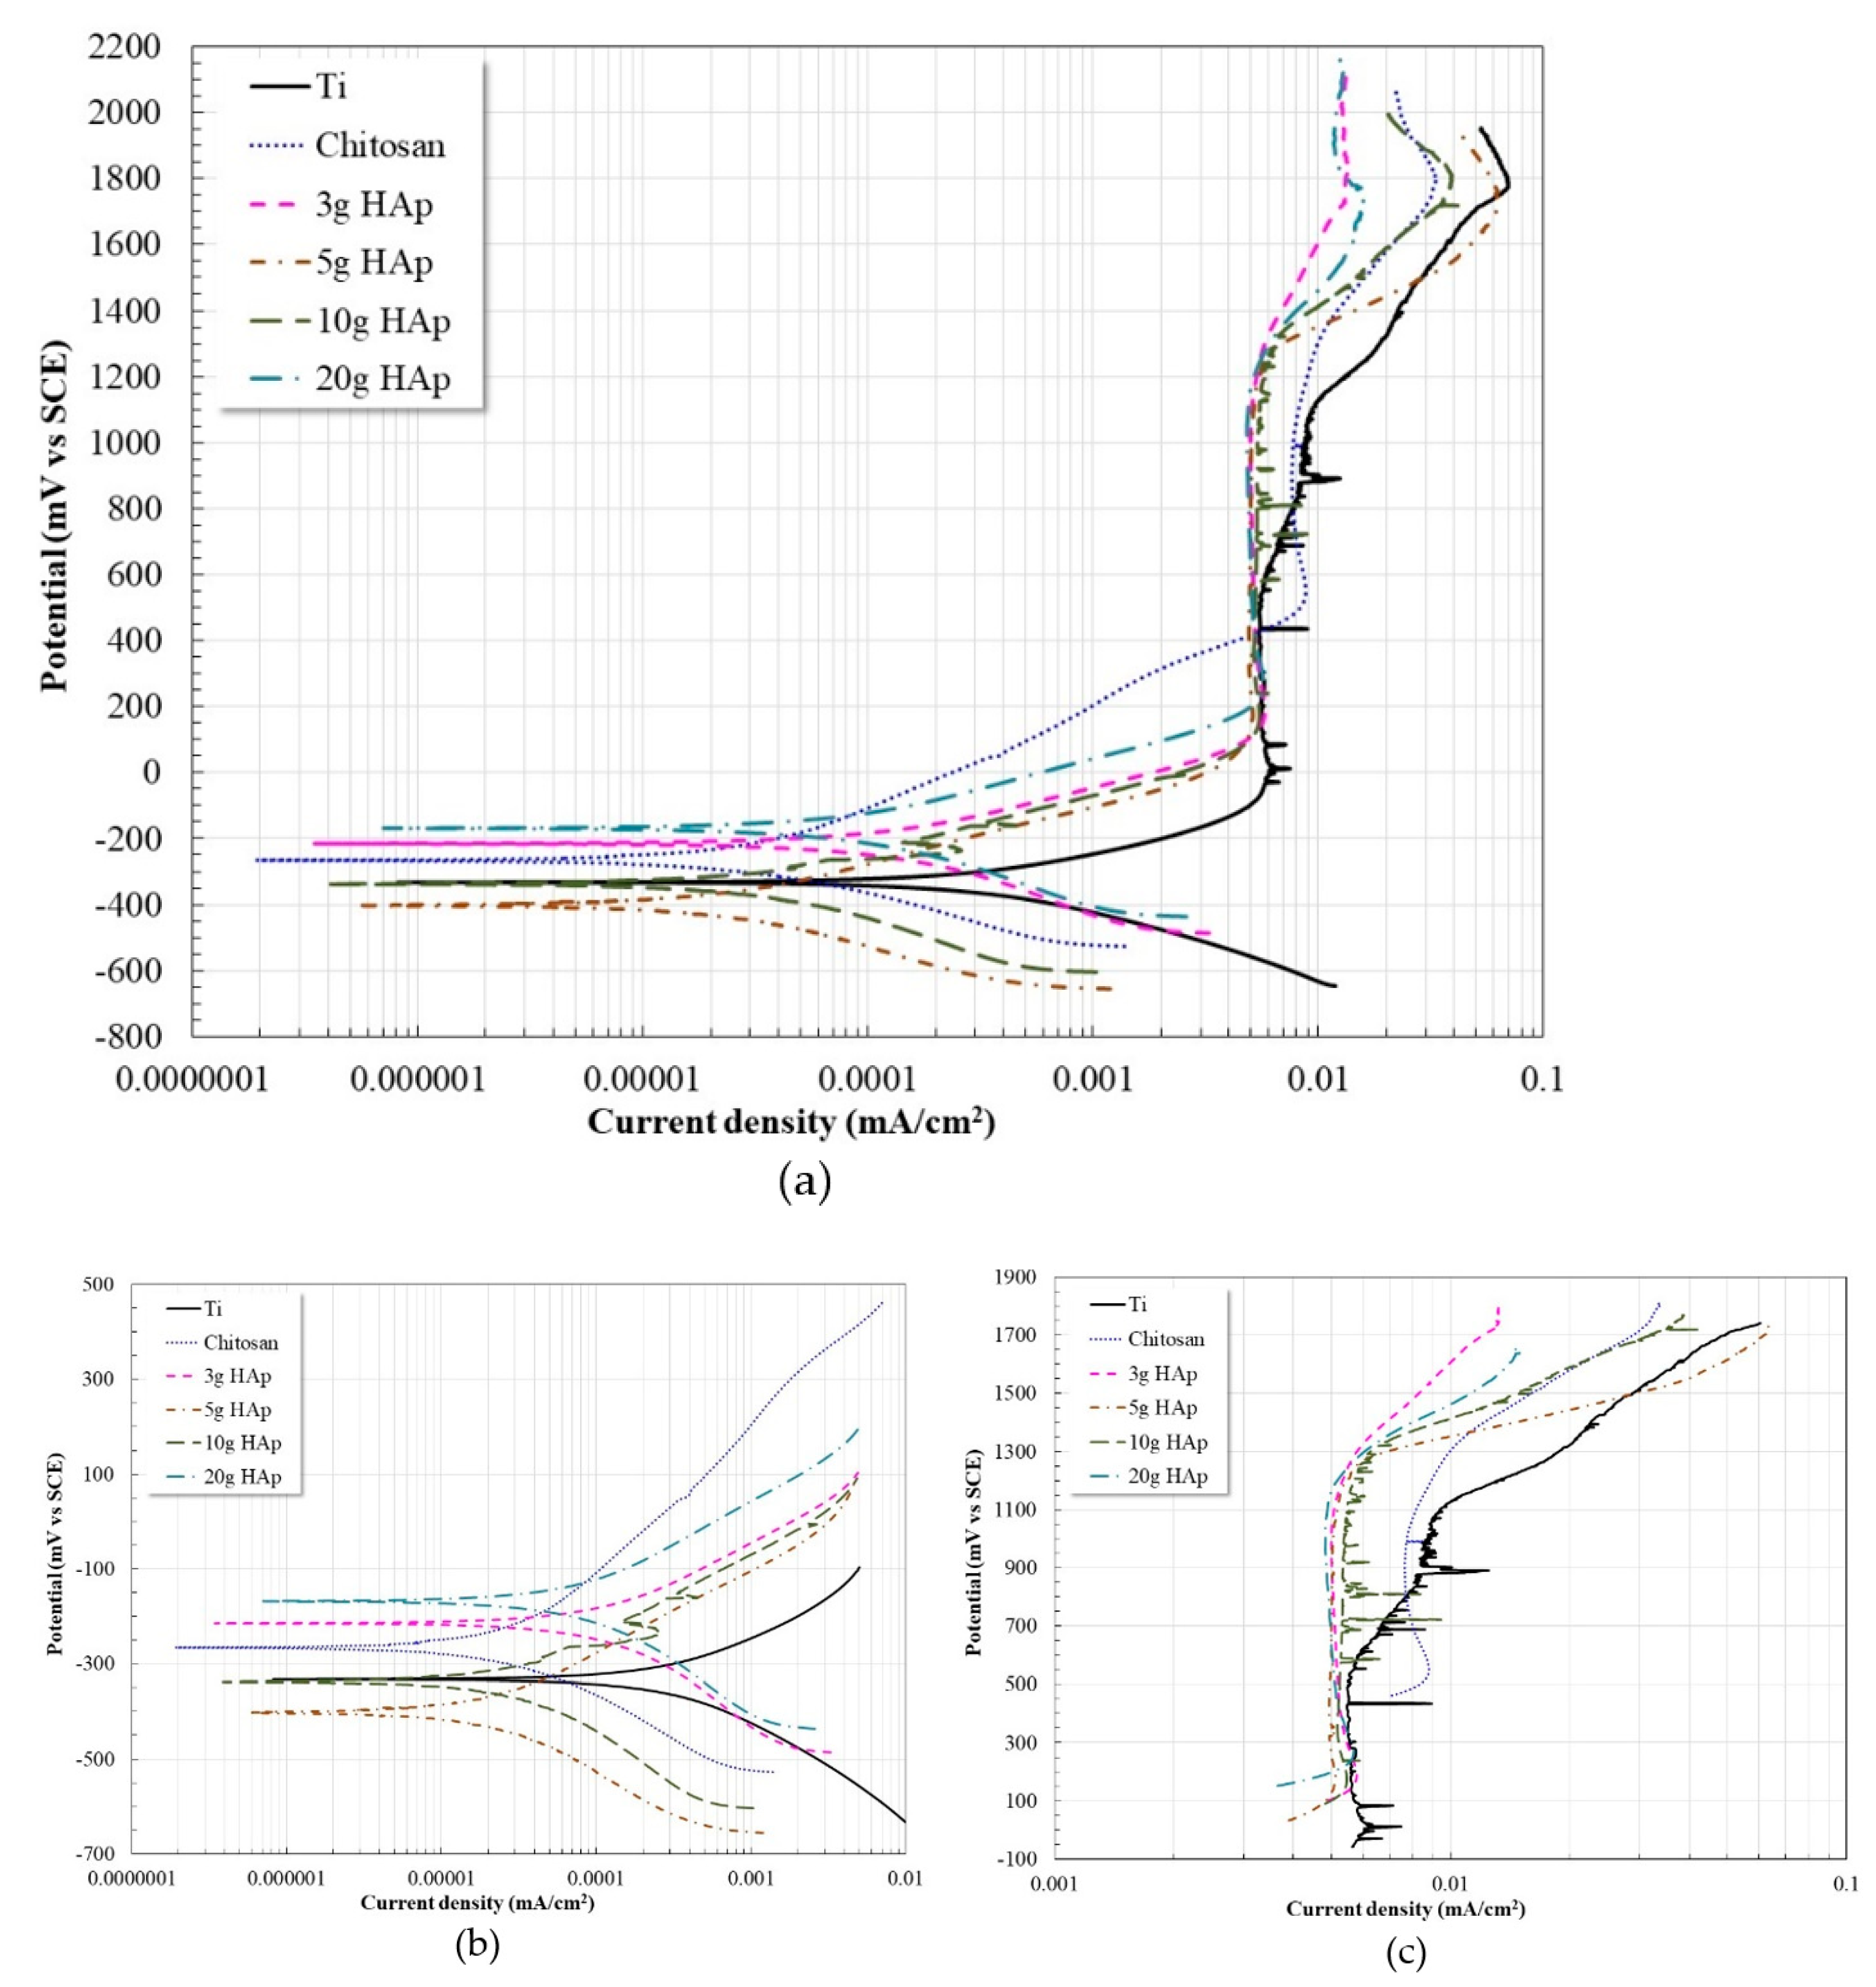
3.2. Potentiodynamic Polarization

Figure 6a shows the potentiodynamic polarization curves of the different Ti CP surfaces with and without surface modification, evaluated in artificial plasma at 37 °C. Figure 6b,c shows a close-up of the Tafel and passive zone regions, respectively.
The general behavior observed for Ti CP (without surface modification) indicates an active–passive behavior. Its active behavior occurs up to approximately 440 mV above its corrosion potential, and later it tends to develop a passive zone of around 1000 mV. The passive zone presents instabilities due to the breakdown and regeneration of the protective oxide (TiO2) [1,4,5,6,15]. At higher potentials its current density increases again without showing the visible presence of localized corrosion.
On the other hand, the surface of the Ti CP coated with chitosan showed a more noble corrosion potential, and showed an active–passive behavior where the active zone was wider, and the passive zone was shorter. The active zone was around 700 mV with respect to the corrosion potential, and the passive zone around 600 mV. That is, the passivation was reached at higher potentials and its amplitude was lower, but its stability range was higher than that observed on the uncoated Ti CP surface. This can be associated with the protective capacity of the chitosan film that reduced the free diffusion of aggressive species to the Ti CP surface and therefore passivation was reached at higher potentials and showed a more stable behavior.
In the case of the chitosan–HAp films, in all cases an active–passive behavior was also observed where the corrosion potential did not show a defined trend with the amount of HAp added. This may be associated with the spatial distribution of the HAp particles within the chitosan film matrix, i.e., heterogeneity in their distribution. However, despite this, the development of a more stable passive zone was observed, and its formation occurred at lower current densities and with a greater amplitude than that observed in the Ti CP and chitosan surface.
Table 3 shows the electrochemical parameters obtained from the Tafel zones and the passive zones. According to the values obtained, it is observed that the Ti CP surface shows the lowest value of anodic slope, and in the presence of the chitosan film the highest anodic slope. The different chitosan–HAp surfaces showed similar values (≈ 200 mV/Dec) of anodic slope. This suggests that the different films deposited reduced the rate of the oxidation reaction. Regarding the cathodic slope, it can be observed that in all cases its values oscillated between 200–300 mV/Dec. This suggests an insignificant impact on the reduction reaction rate. This is reflected in the Icorr values, in the case of the Ti CP surface the highest value was observed, and in the presence of a surface film the lowest values were observed. According to these values, the corrosion rate was reduced between 80–90%. According to the values of the passivation potential (Epas) it is observed that in the presence of the different films the passivation is reached at higher potentials and the passivation current is very similar. The amplitude of the passive zone was higher in the presence of the chitosan–HAp films, and lower in the chitosan film.

3.3. Open Circuit Potential Measurements

Figure 7 shows the variation of the OCP values of Ti CP with and without surface modification, evaluated in artificial plasma at 37 °C.
The Ti CP, without surface modification, showed an abrupt increase in its OCP in the first three hours of immersion, and subsequently a constant increase until the end of the test. This trend suggests the continued formation of a thermodynamically stable TiO2 passive layer [1,15,33,34]. The continuous growth of the passive layer gives rise to the formation of a protective bilayer. It has been reported that the layer adhered to Ti, or its alloys, is dense, compact, adherent and with excellent resistance to corrosion, and on it forms a layer with a porous appearance that contributes to the bone integration of the biomaterial [6,33,35,36,37,38,39].
In the presence of a chitosan layer, the Ti CP surface showed more noble OCP values, but with a tendency to steadily decrease until reaching values similar to those of the Ti CP surface without surface modification, at the end of the test. It has been reported that this behavior is associated with water absorption and swelling of the chitosan film with increasing immersion time [30,40,41,42].
On the other hand, as was observed with the Ecorr values of the Ti CP surface modified with the different chitosan–HAp films, in this case it was not possible to observe a definite trend between the OCP values and the amount of HAp added either. The only observed trend is that regardless of the amount of HAp, the OCP values showed a constant increase or remained in a quasi-steady state. This trend suggests that the incorporation of HAp into chitosan films contributes to the stability of the Ti CP surface.

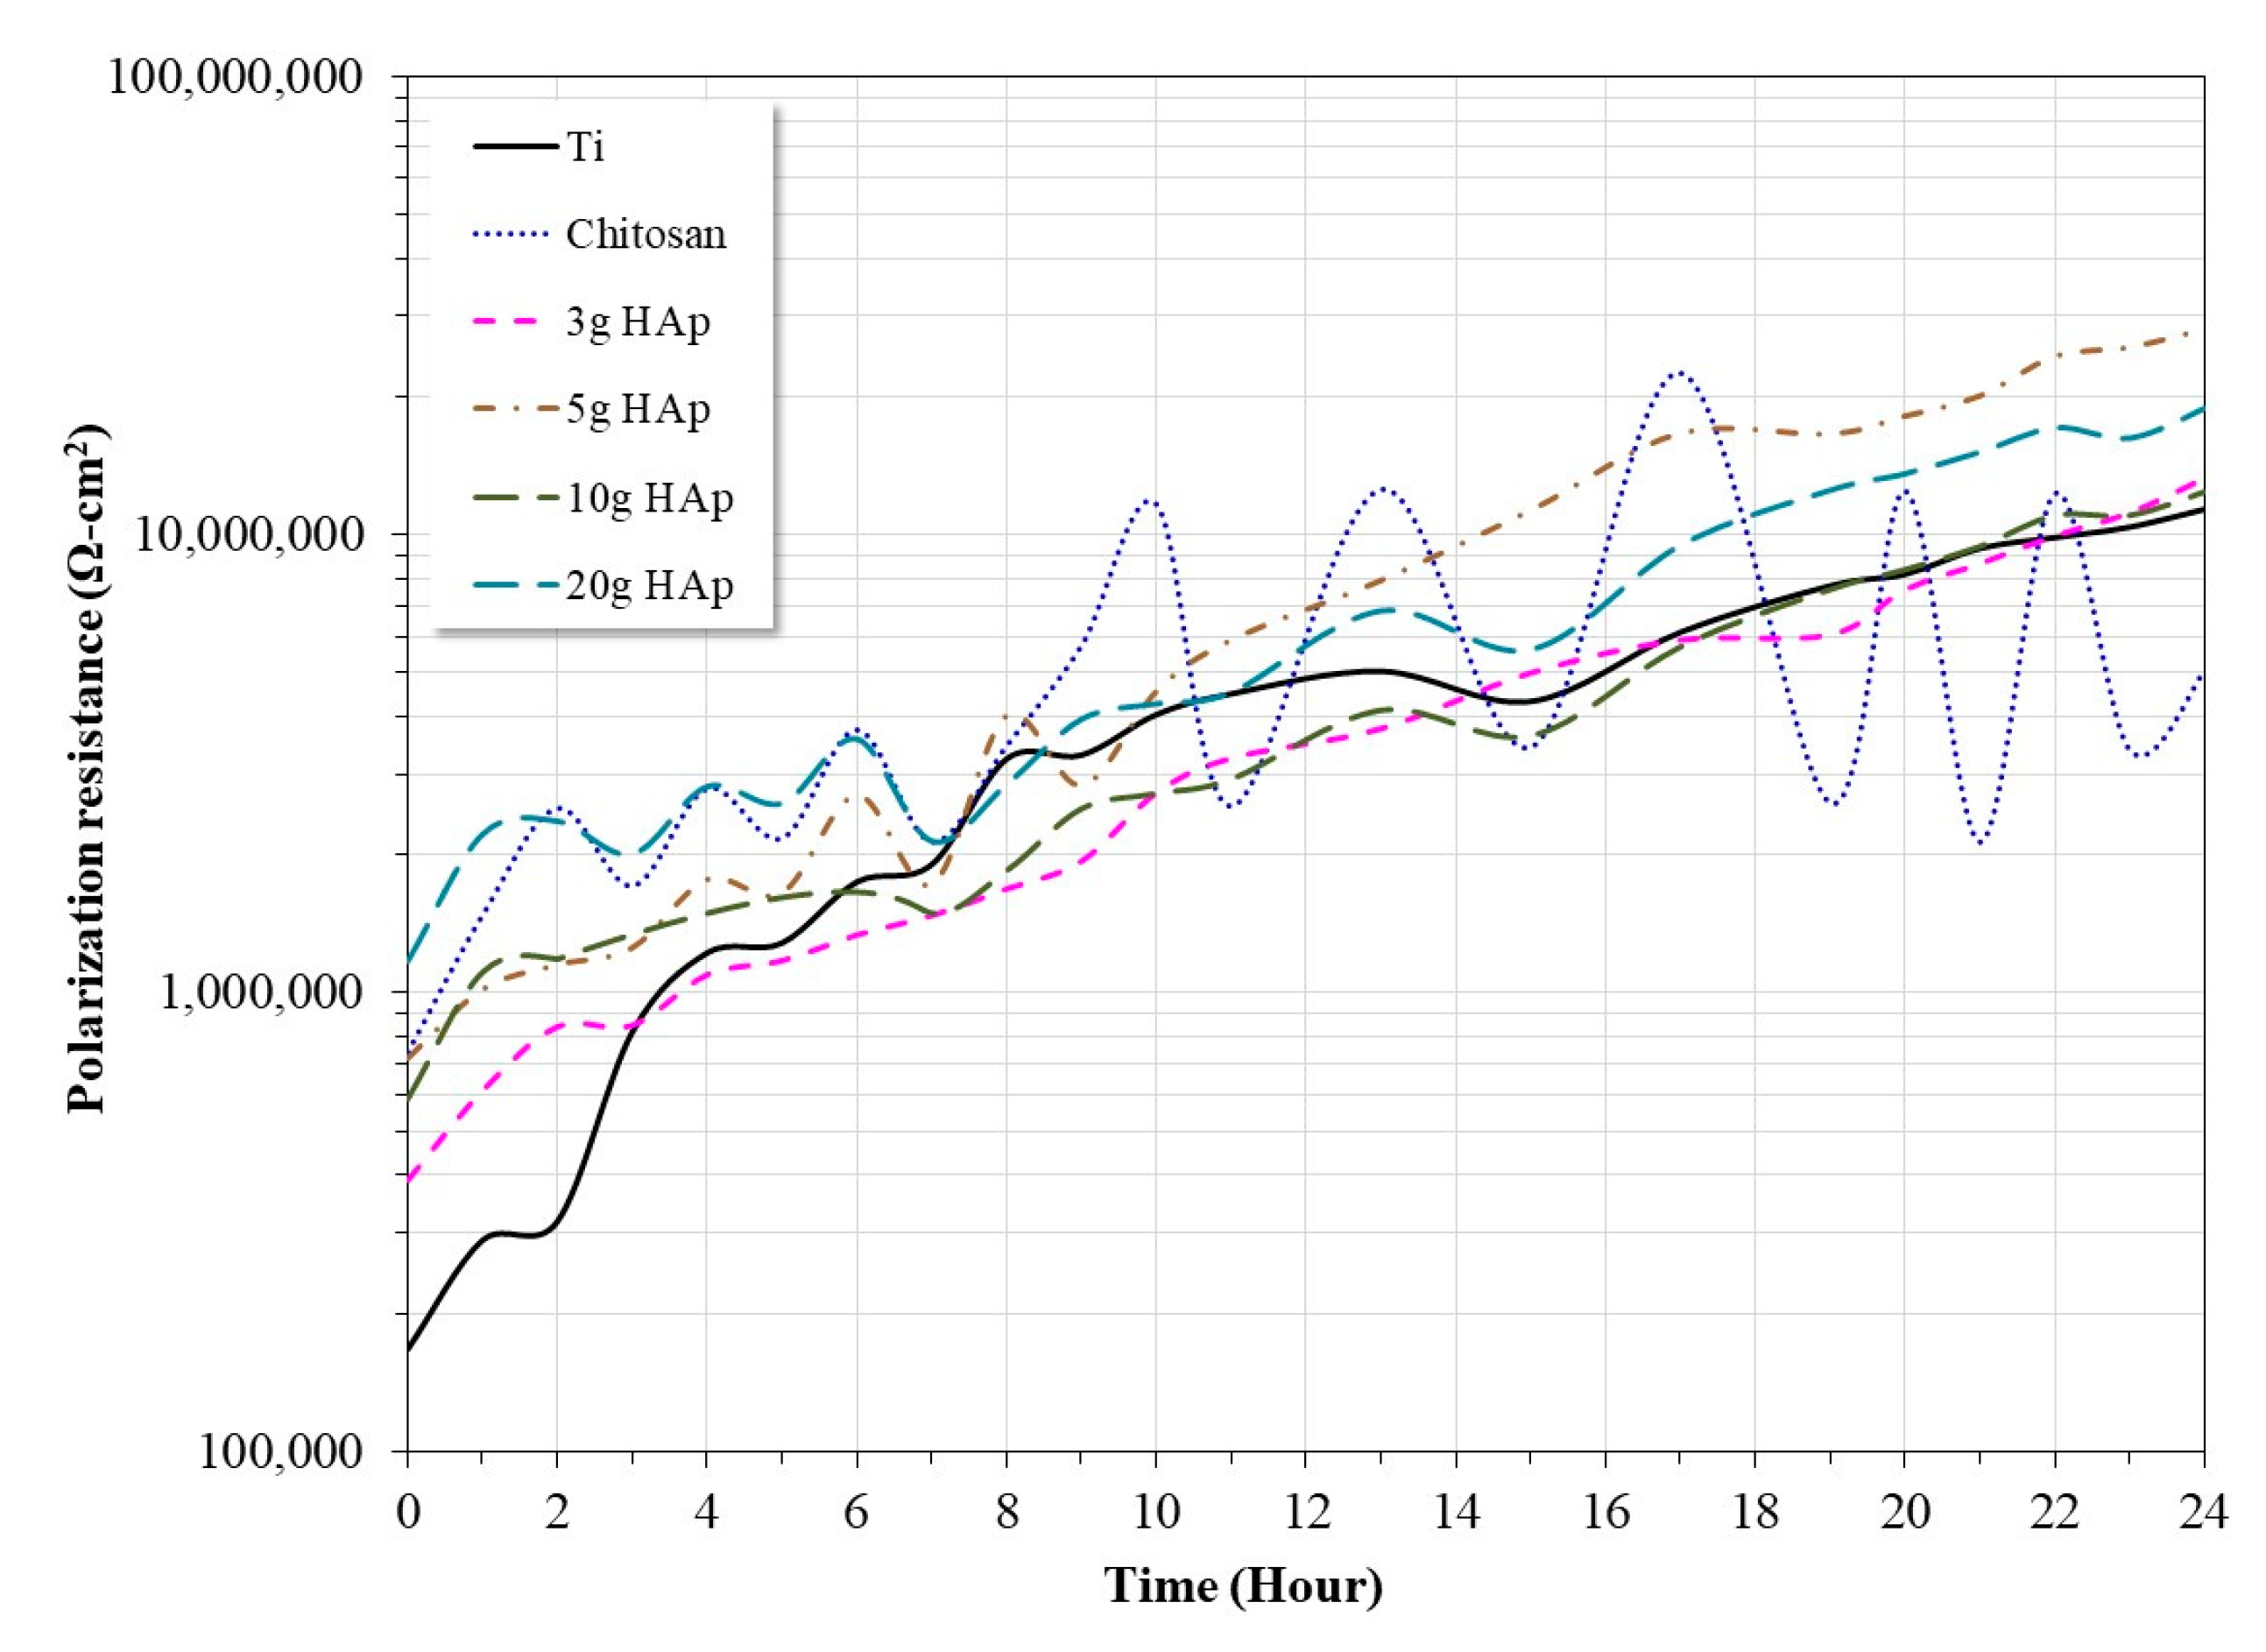
3.4. Polarization Resistance Measurements

Figure 8 shows the variation of the Rp values of Ti CP with and without surface modification by electrophoretic deposition of chitosan and chitosan–HAp mixtures, evaluated in artificial plasma at 37 °C.
The behavior observed by the Ti CP indicates a constant increase in its Rp values throughout the entire test. It is possible to observe two behaviors, a greater increase (ΔRp/Δt) in the first 8 h of immersion and later its rate decreased, possibly due to the formation of a stable passive layer on its surface. The magnitude of the Rp values shows the high corrosion resistance of Ti CP and its capacity as a stable passive film in chloride-rich environments [1].
The chitosan-modified Ti CP surface shows a similar trend, but with large fluctuations in its Rp values. As with the trend observed in the variation of its OCP values, this may be associated with the absorption of water and swelling of the chitosan film during the test [30,40,41,42].
Unlike the previous behaviors, the Ti CP surface modified with chitosan–HAp composites all showed a constant increase in their Rp values, and their values were similar to or higher than those observed in the absence of the film. This suggests the formation of a more uniform passive layer with greater protective capacity.

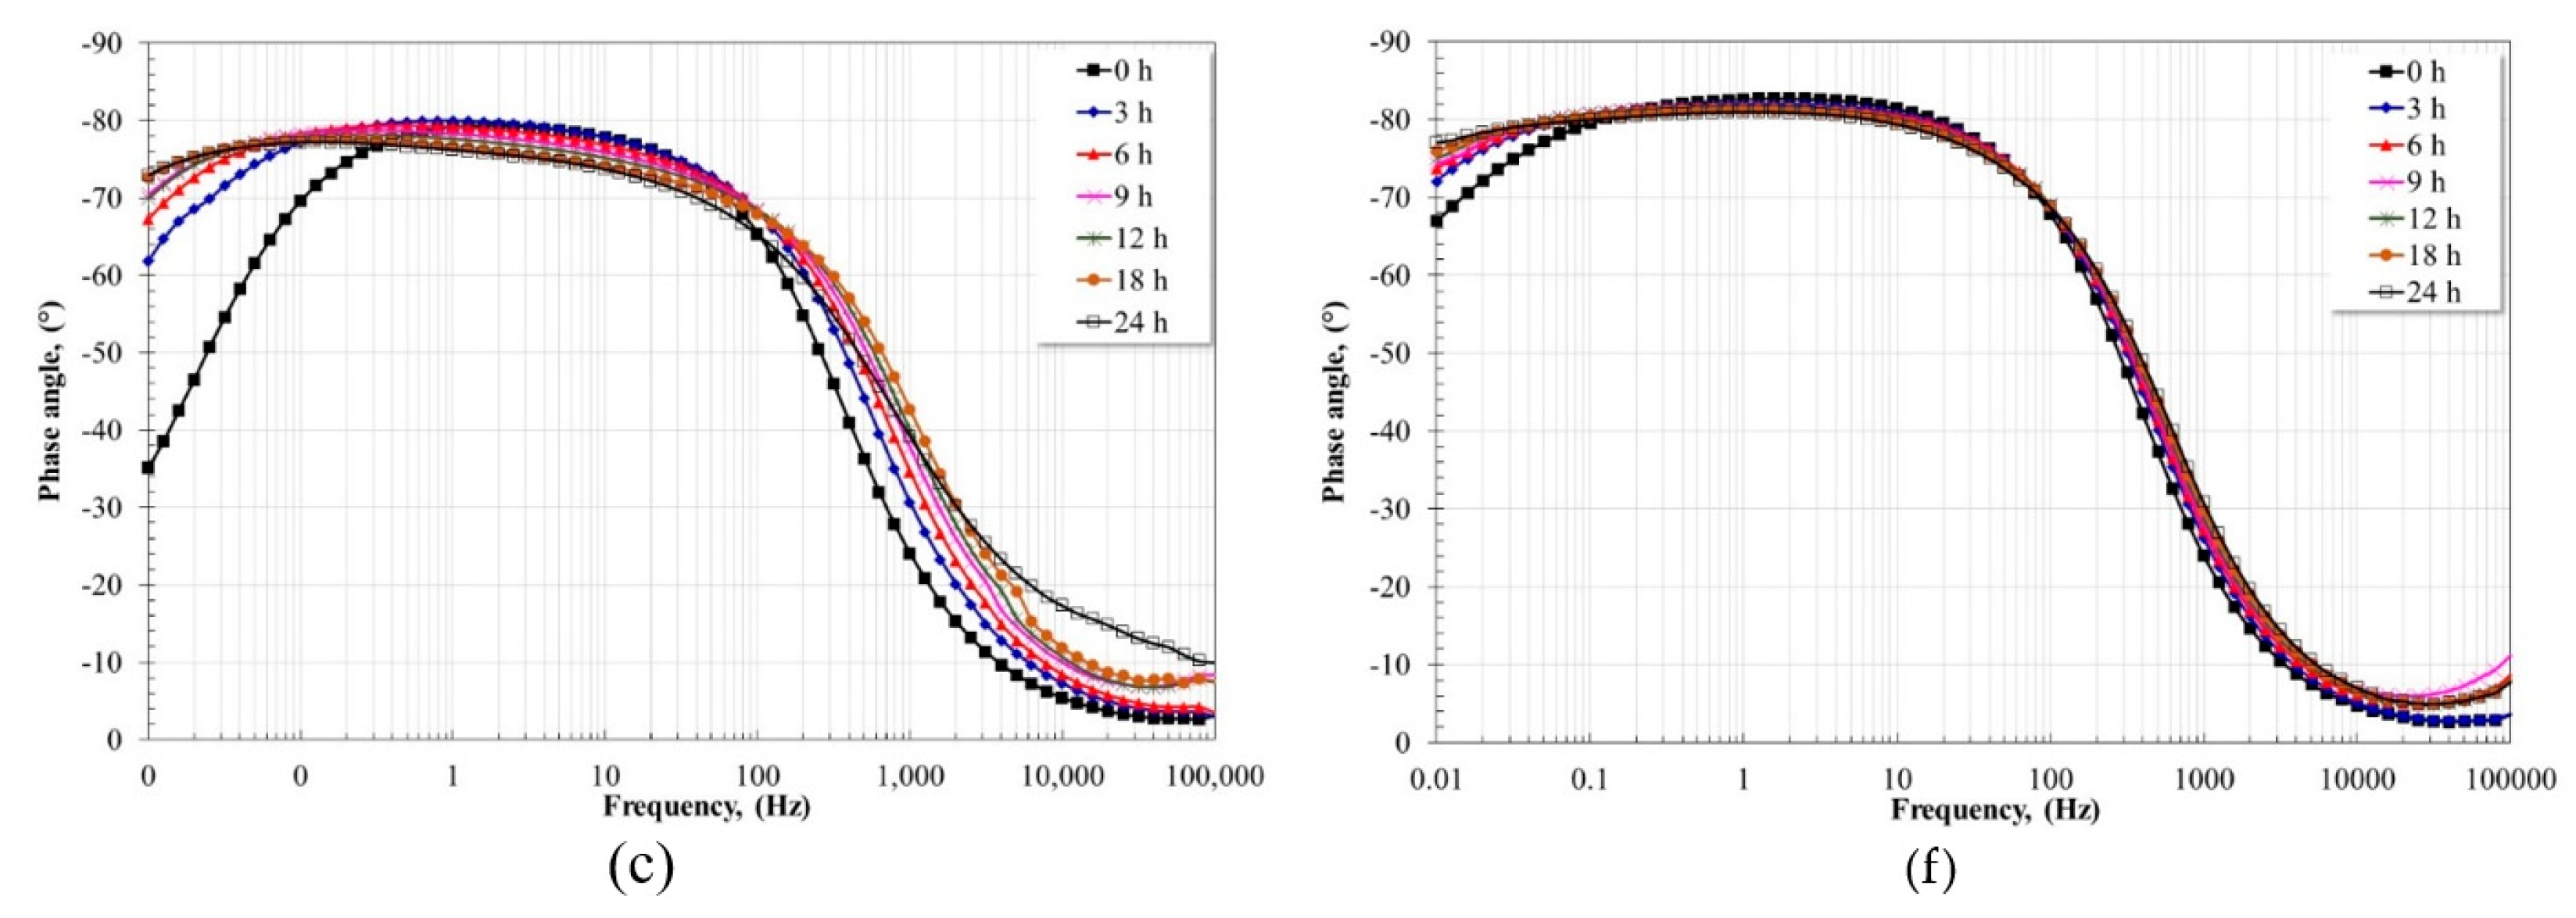
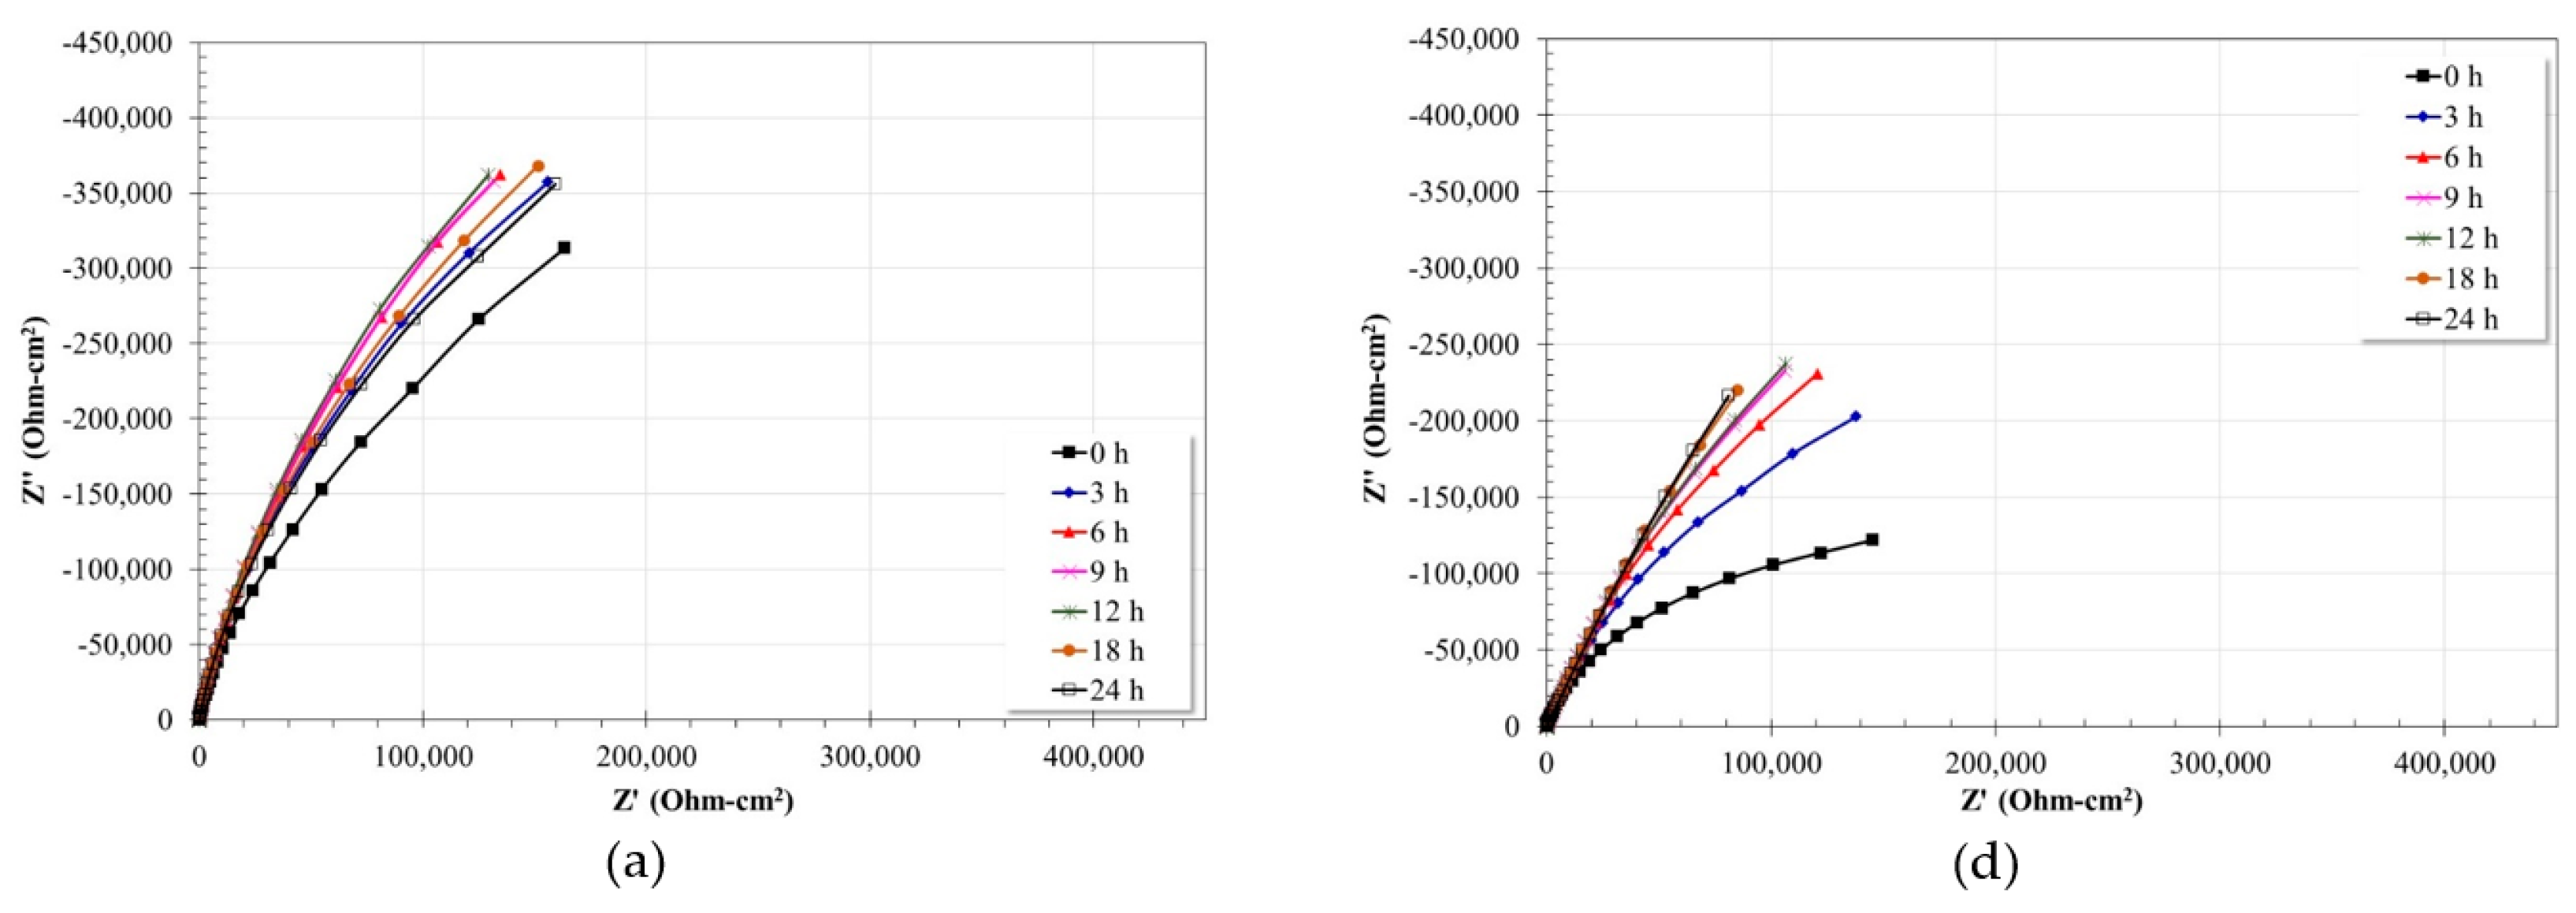
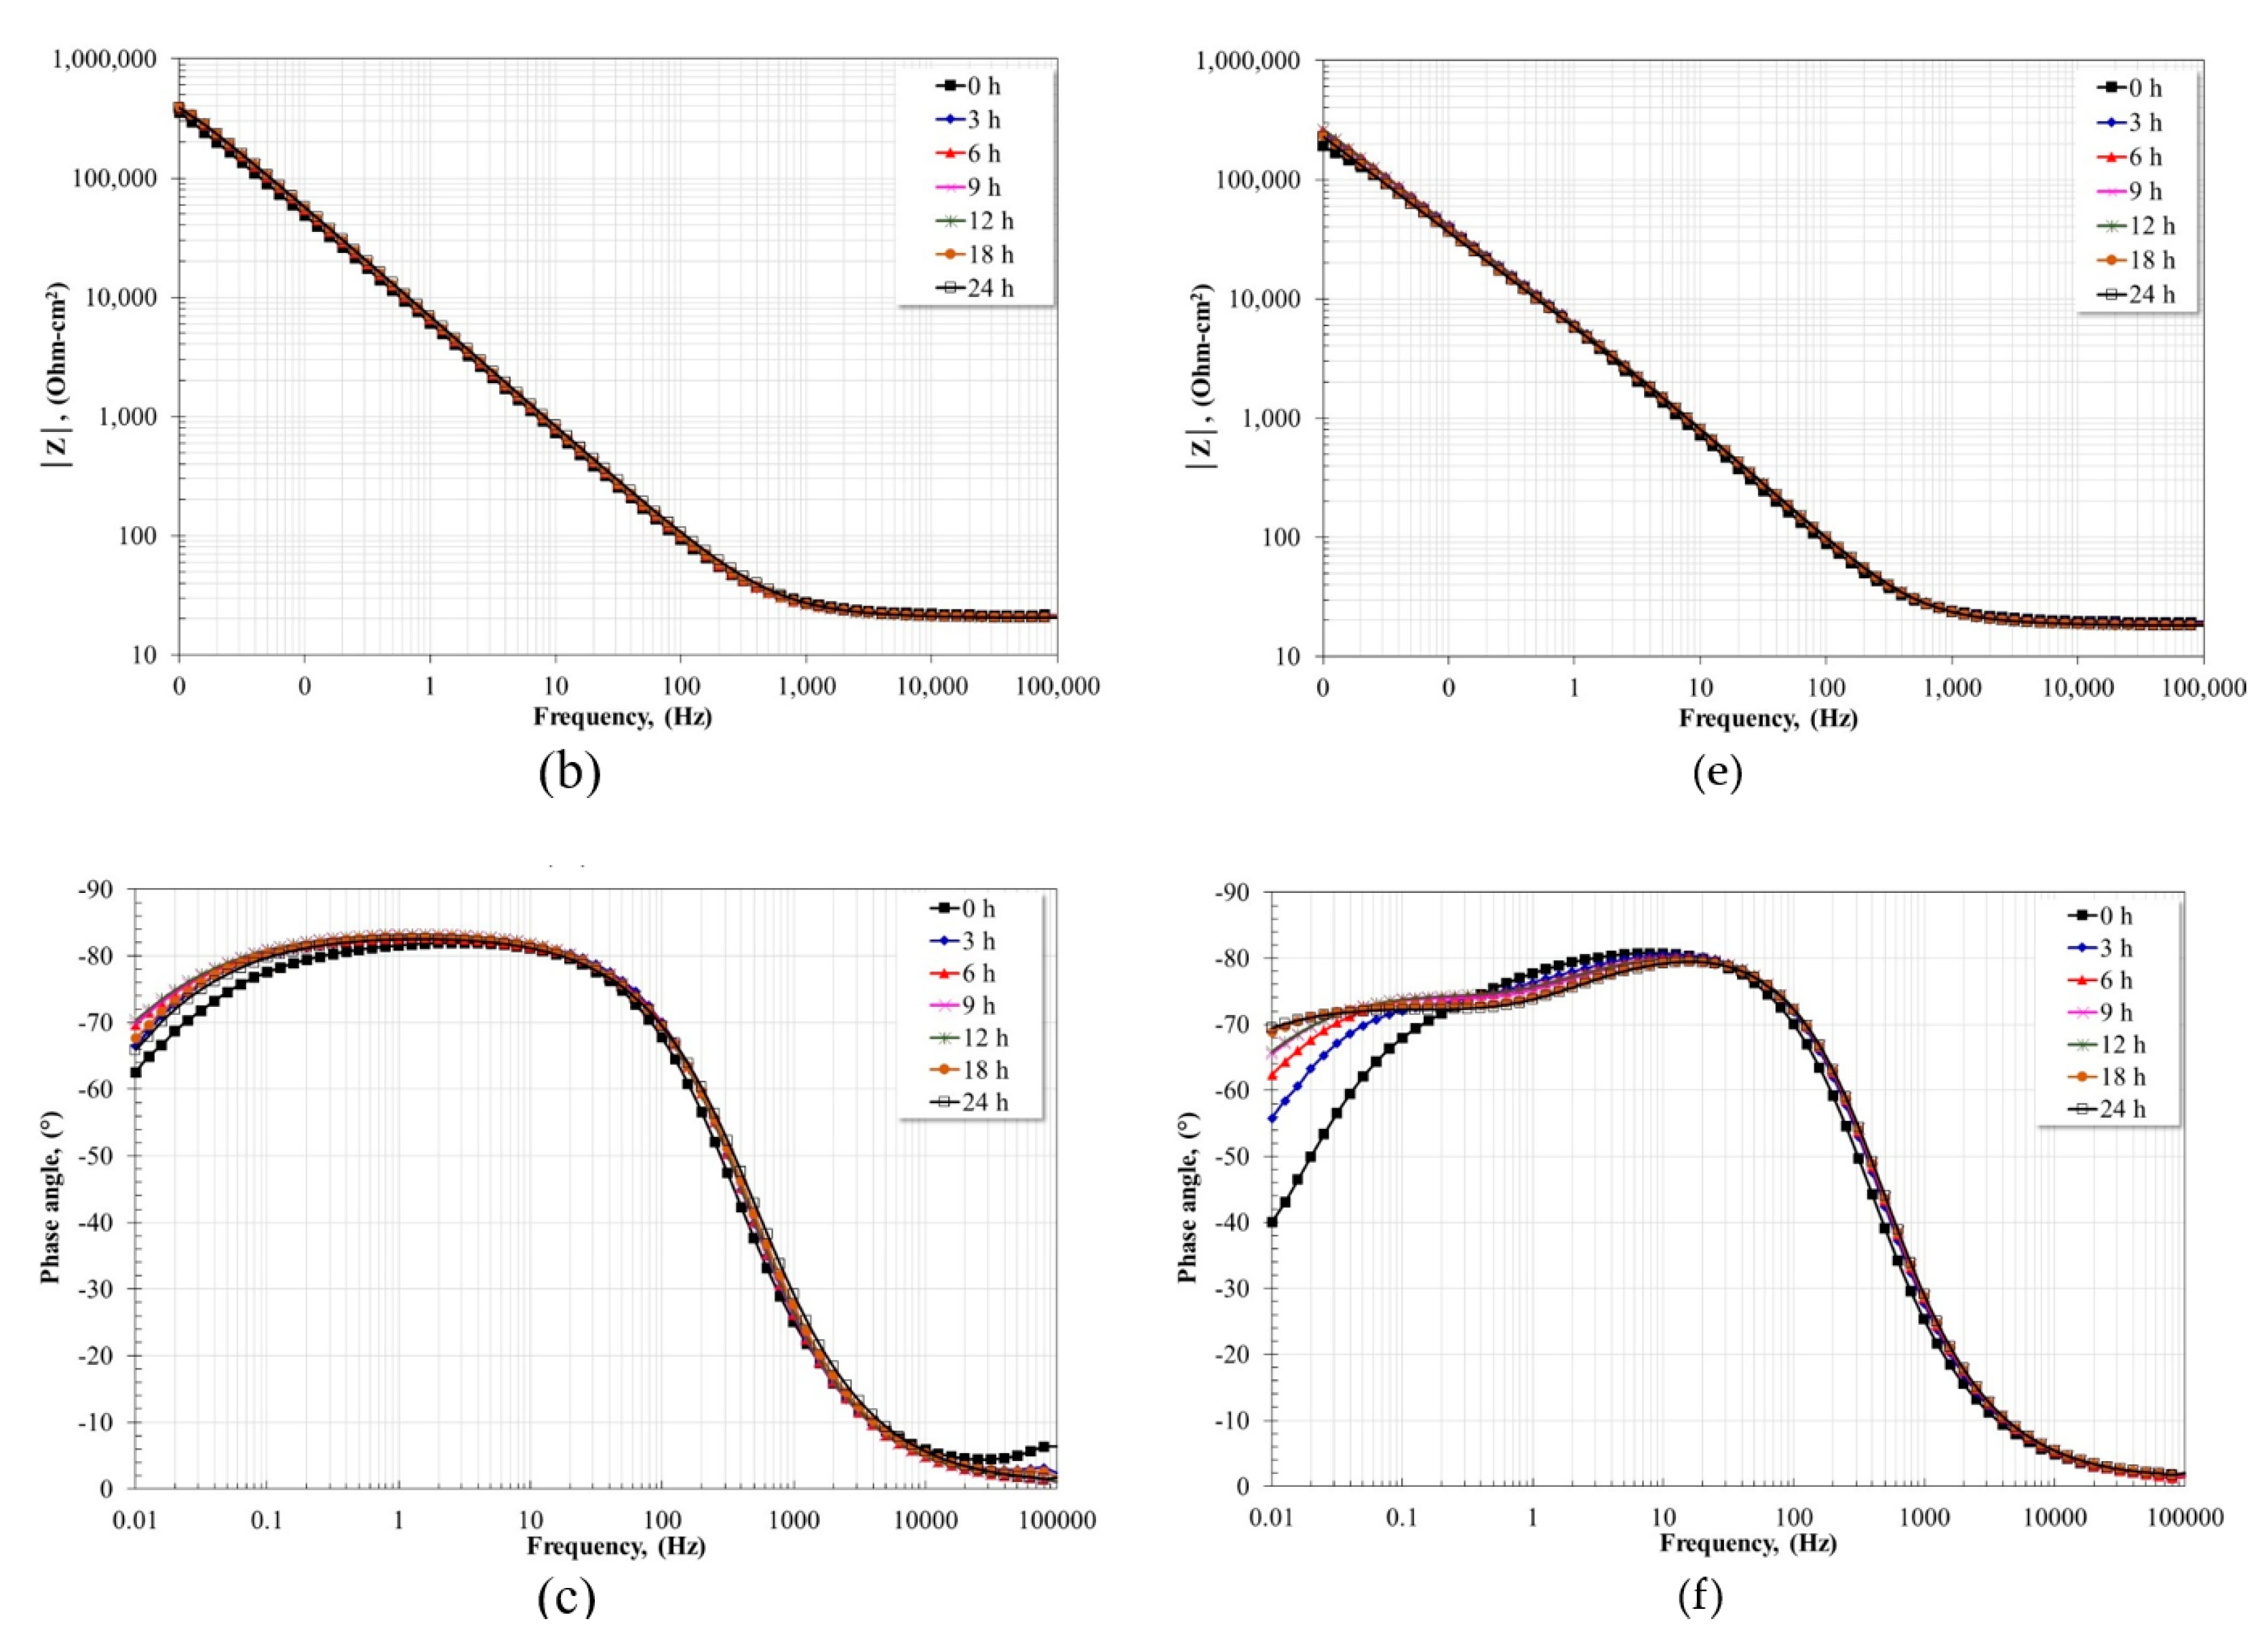
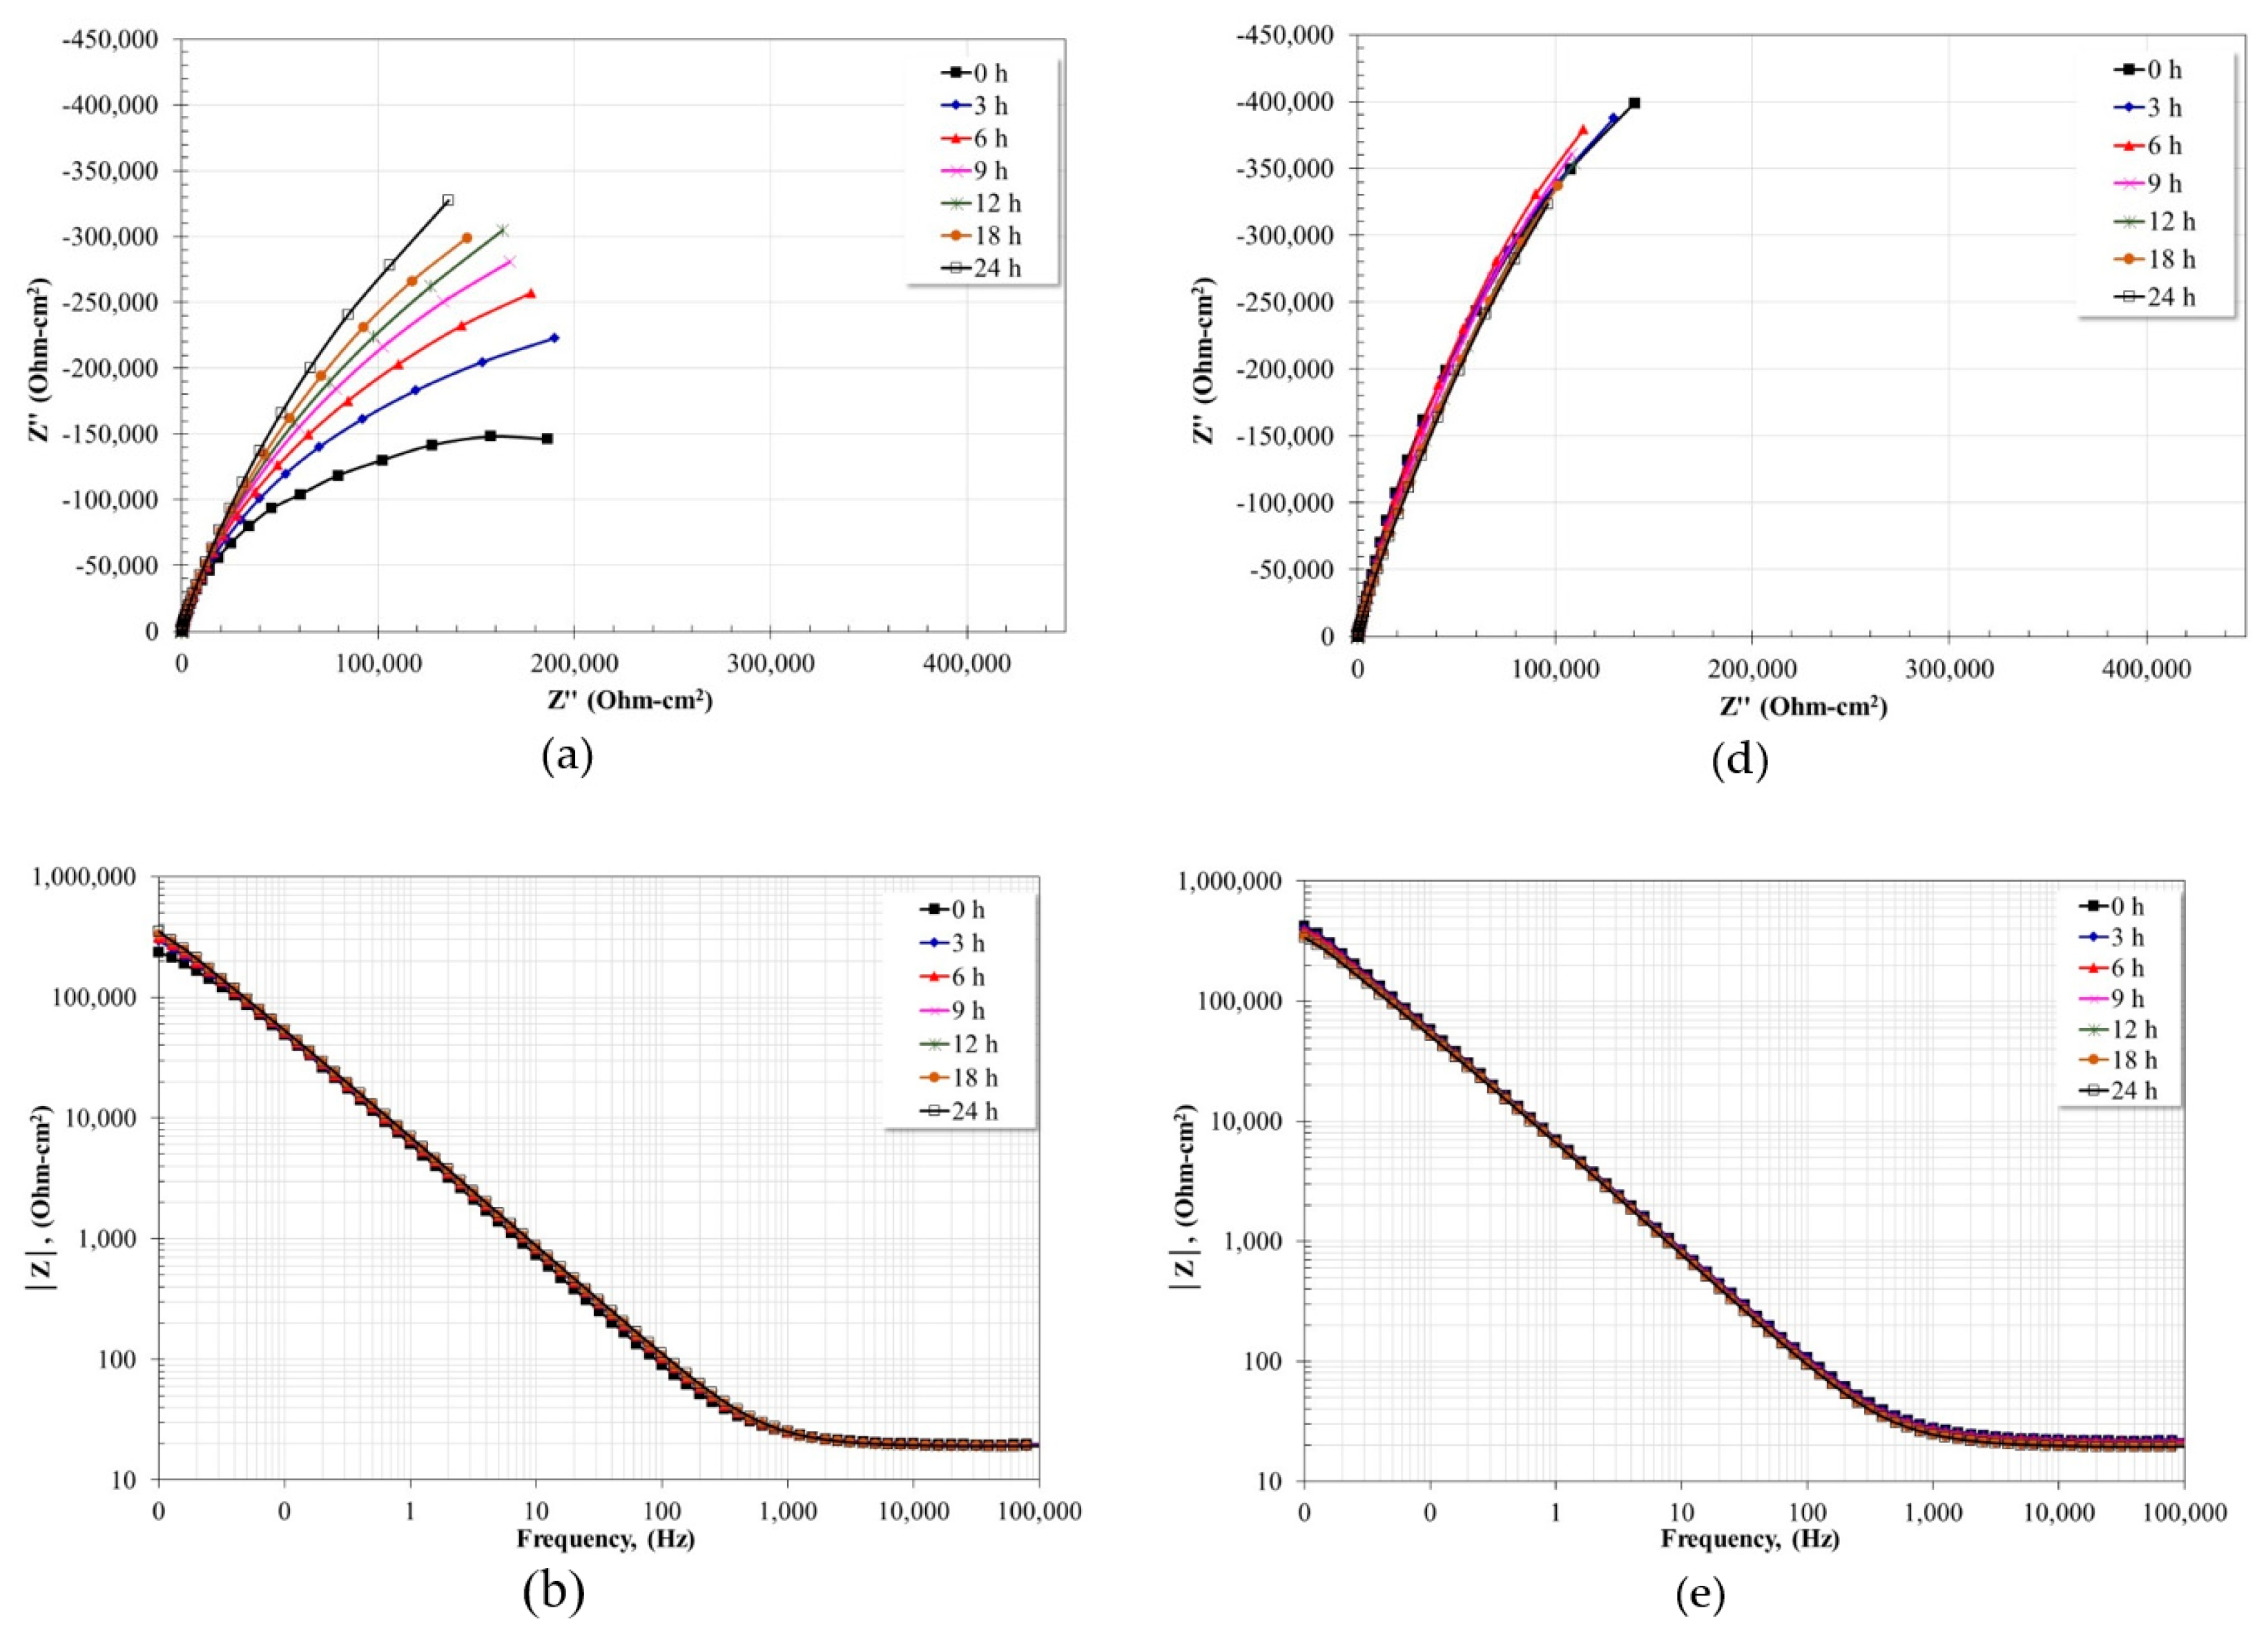
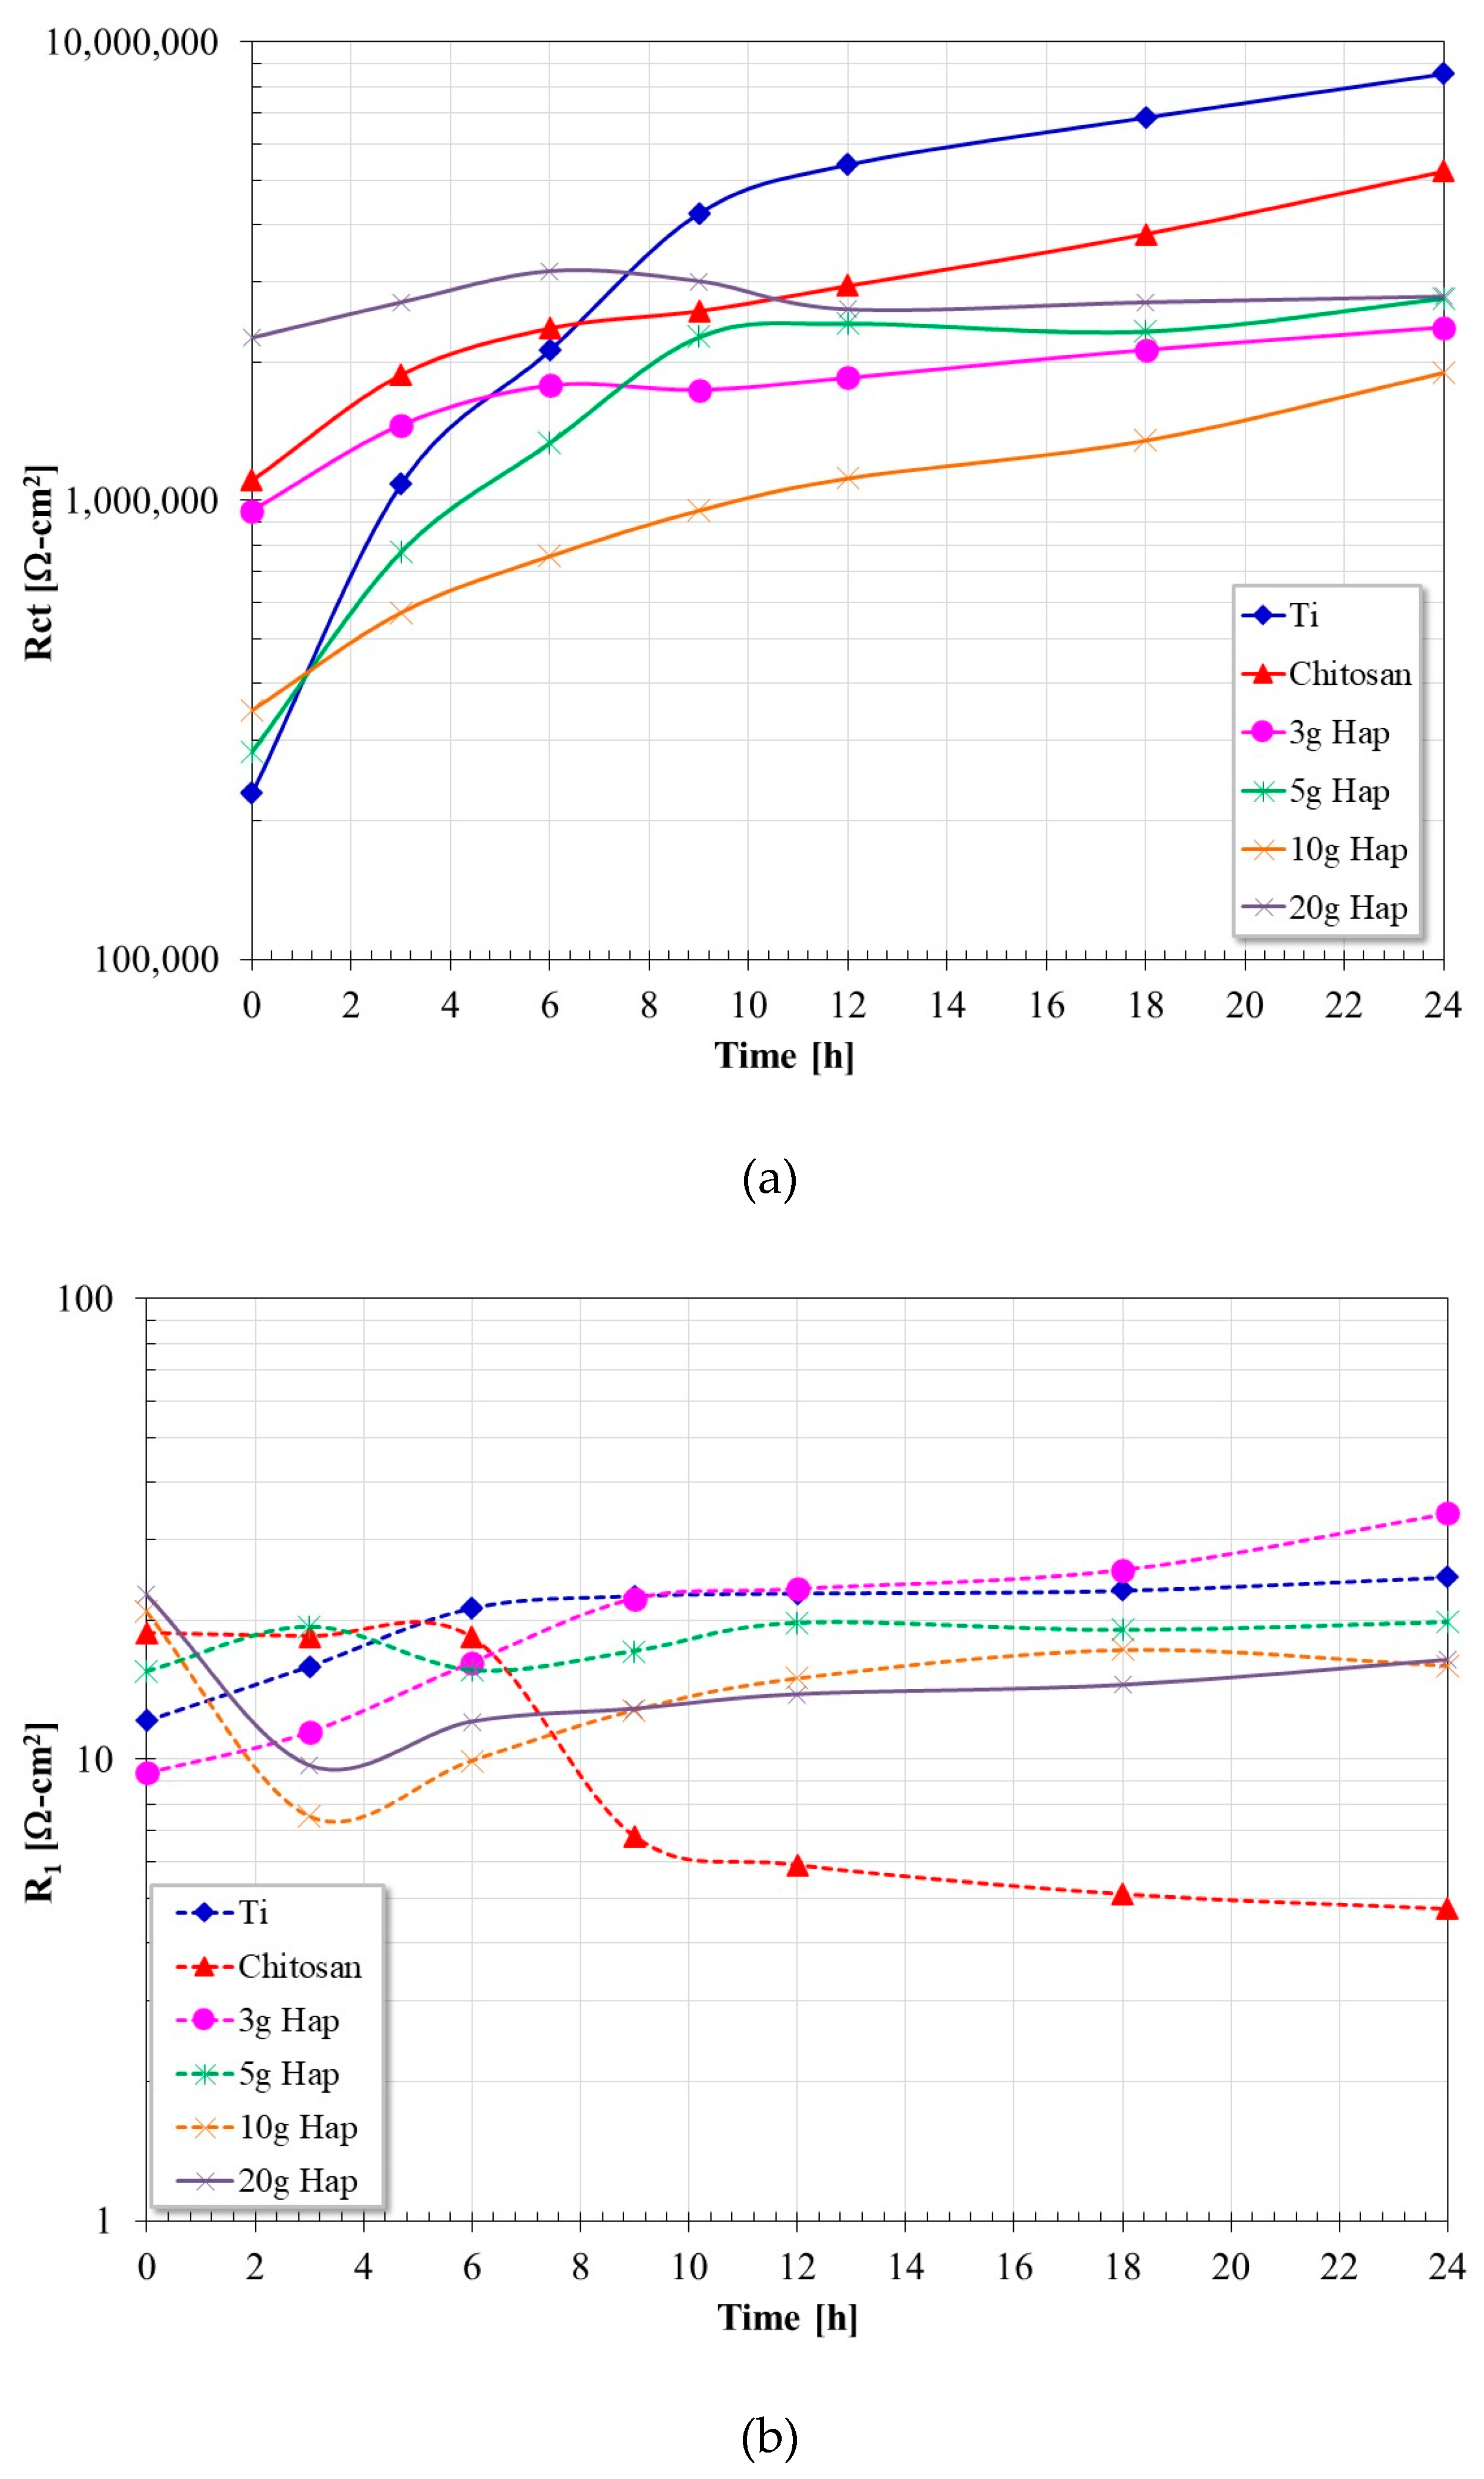
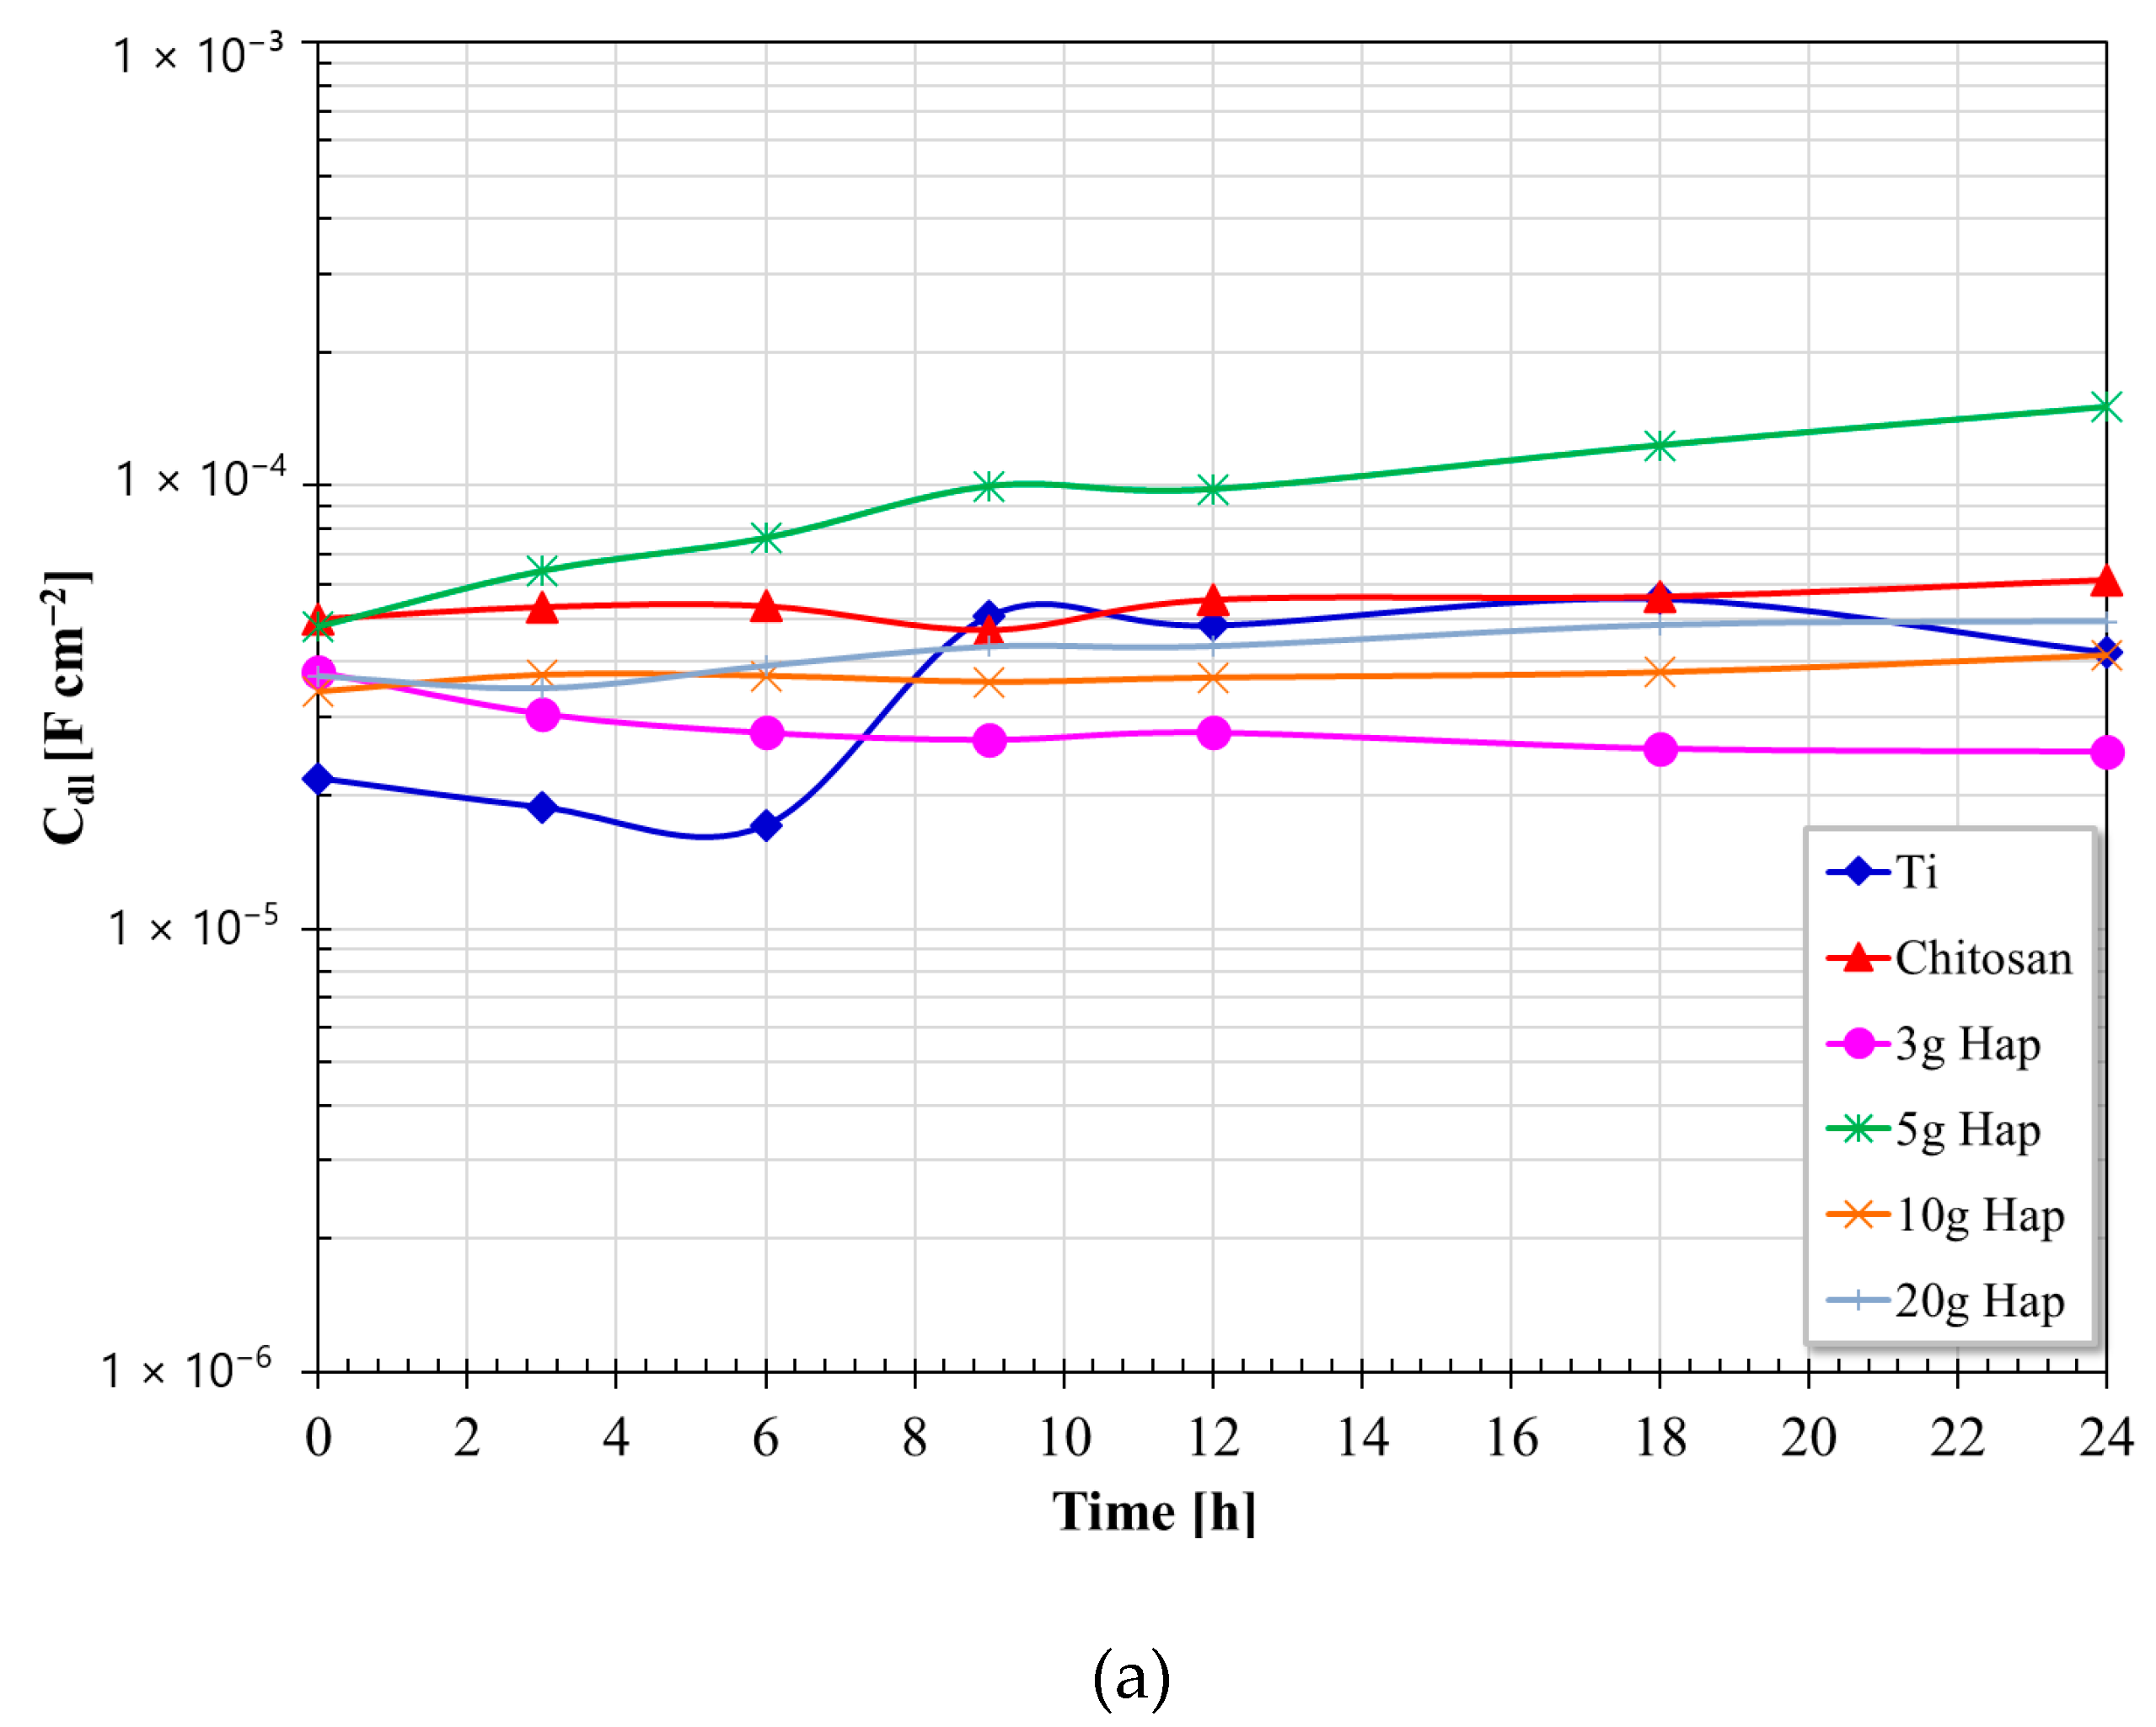
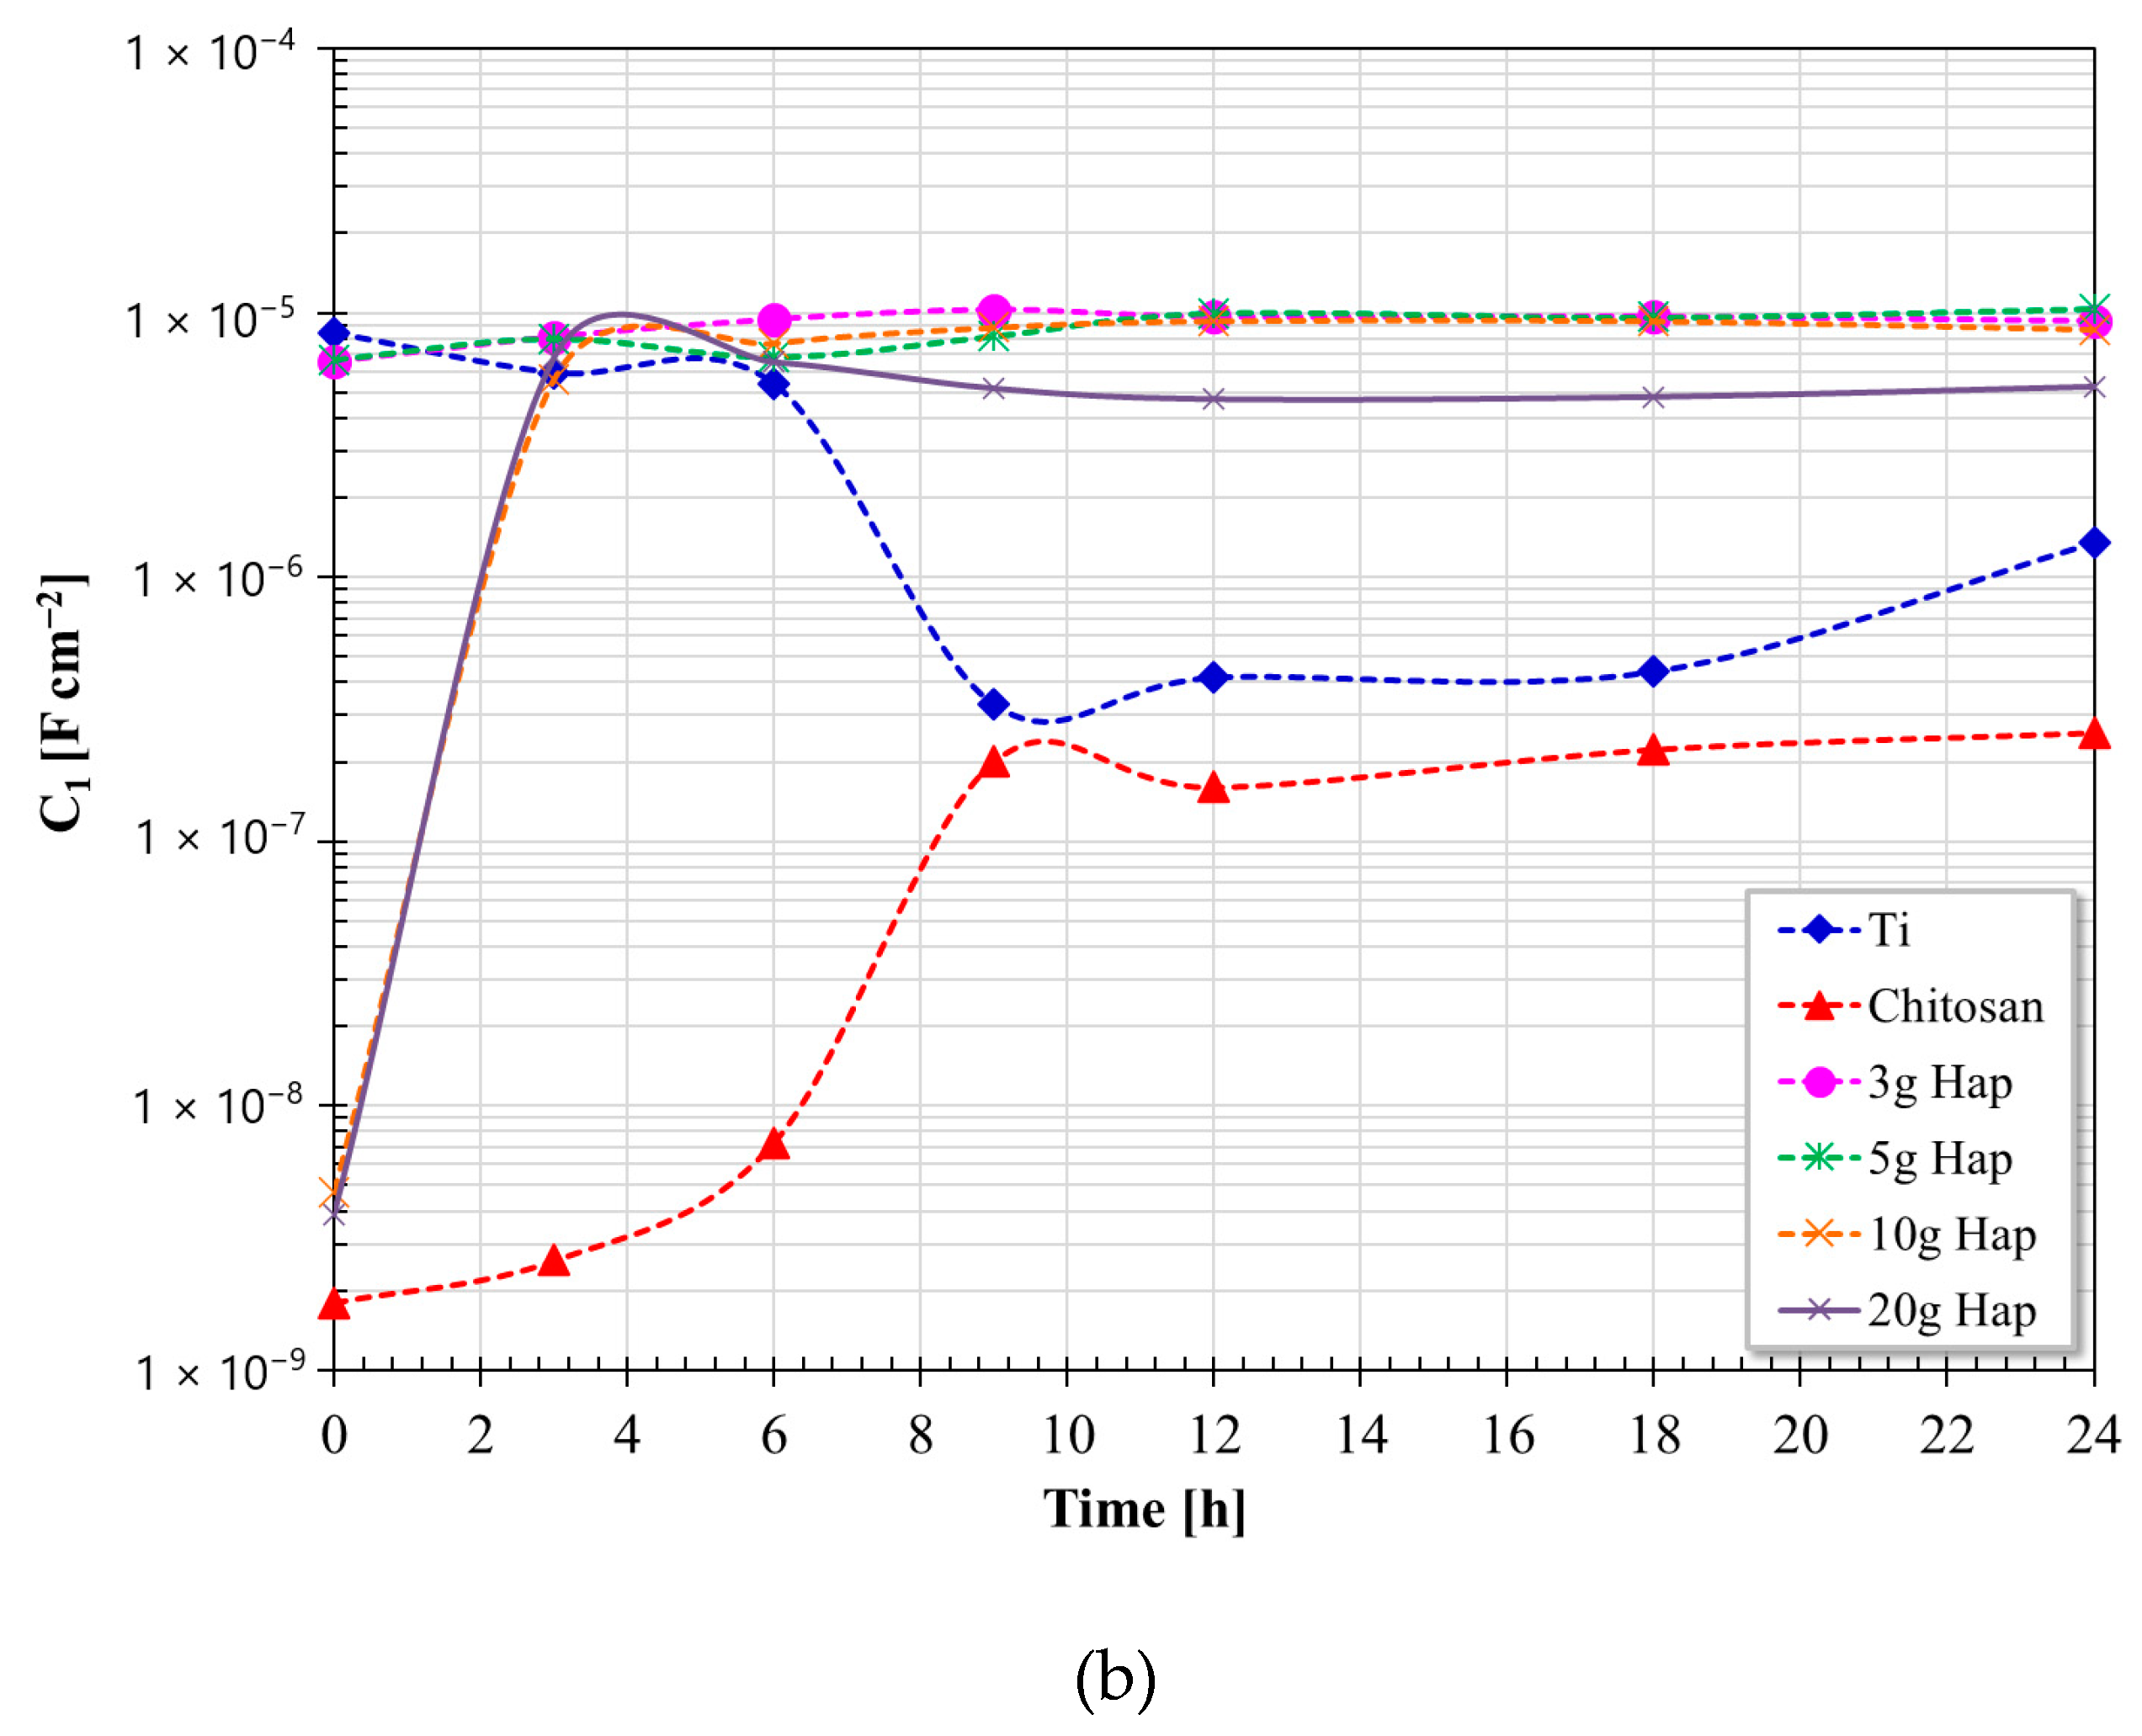
3.5. Electrochemical Impedance Spectroscopy

Figure 9, Figure 10 and Figure 11 show the electrochemical impedance spectra of the Ti CP surface, with and without the presence of a protective film based on chitosan and HAp, evaluated in artificial plasma at 37 °C.
In the case of the Ti CP surface, from the Nyquist diagram, the apparent formation of a single capacitive semicircle is observed whose diameter increases with immersion time and whose capacitance decreases. From the Bode diagram in its impedance module format, in the high frequency region it is possible to observe the formation of the high frequency plateau starting at 1000 Hz; however, as time increases, its formation occurs at higher frequencies (>10,000 Hz). In the region of intermediate frequency and low frequency, the apparent presence of a single linear relationship (log f-log |Z|) is observed, and it is not possible to define the low-frequency plateau. This suggests that the impedance modulus is greater than the last recorded value. However, from the Bode diagram in its phase angle format, in the high-frequency region as time increases the phase angle tends to zero at frequencies greater than 1000 Hz (in agreement with those observed with the high frequency plateau). In the intermediate and low frequency region it is possible to distinguish at least two overlapping time constants with phase angles between 70–80°. That is why in the Bode plot in its impedance modulus format, a single slope appears to be observed in these regions. The first time constant (between 30–100 Hz) shows an increase in its maximum phase angle and a displacement (with time) of its maximum at higher frequencies. The second time constant (between 1–0.1 Hz) shows an increase in its maximum phase angle and a shift (with time) to lower frequencies. This behavior may be associated with the characteristics of the passive layer formed on the Ti CP surface; it is commonly accepted that the passive layer has a bilayer type structure where the external part is porous (first time constant) and the internal part is compact and dense (second time constant) and therefore it presents the largest phase angle [6,33,35,36,37,38,39].
In the case of the Ti CP surface with the chitosan film, the Nyquist diagram shows the same characteristics as those detected in its absence, that is, the apparent formation of a single capacitive semicircle with a diameter increasing over time and its capacitance decreasing. In the case of the Bode diagram in its impedance modulus format, the spectra did not show large variations. However, in the high frequency region it is possible to observe the formation of the high frequency plateau slightly above 1000 Hz. In the intermediate and low frequency region, only the presence of a linear relationship (log f-log |Z|) is observed, and it is not possible to define the low-frequency plateau either. This also suggests that the impedance modulus is greater than the last recorded value. From the Bode plot in its phase angle format, little variation between different spectra was also observed. In the high frequency region at 1000 Hz, the phase angle is smaller (and with little variation) than that observed in the absence of the chitosan film, and it also tends to zero at frequencies slightly above 1000 Hz. In the intermediate and low frequency regions two overlapping time constants with phase angles around 80° are also observed. The first-time constant was observed around 10 Hz with little variation in its maximum phase angle, and the second time constant is located at frequencies below 1 Hz and shows a shift to lower frequencies with a slight increase in its maximum of phase angle. In this case, it is possible that the first-time constant is attributed to the chitosan film and the second time constant to the passive layer (TiO2). Where the passive layer does not show the characteristic of a bilayer film, only a compact and dense single protective layer.
In the case of the Ti CP surfaces covered with chitosan–HAp films, the Nyquist and Bode diagrams in their impedance modulus format show characteristics similar to those described in the previous cases. The main differences are seen in the Bode plots in their phase angle format. In the case of the chitosan film with 3 g of HAp, the spectra show little variation between them. In the high frequency region, the phase angle clearly tends to zero at frequencies greater than 1000 Hz. In the intermediate and low frequency region, the presence of two-time constants with phase angle maxima slightly above 80° is observed, and the phase angle tends to zero at frequencies less than 0.01 Hz. Its characteristics are very similar to those observed with the chitosan film. With the addition of 5 g and 10 g of HAp, the characteristics of the first-time constant are similar to those previously described; however, the second time constant shows an increase in its maximum phase angle and a shift to lower frequencies by increasing time. Its maximum phase angle is lower than that observed in previous films; this may be associated with blocking access to aggressive species due to a higher density of HAp particles into chitosan film structure. This limited the oxidation of the Ti CP surface, and therefore the growth of the passive film. With the addition of 20 g of HAp, the spectra showed practically no significant variation with immersion time for either the first or the second time constant.
Based on the discussion of the EIS spectra, the equivalent circuit of two-time constants shown in Figure 12 was used for the modeling of the electrochemical processes of the different Ti CP surfaces. Rs represents the electrolyte resistance, ZCPE1-R1 represents the resistive–capacitive response of the first time constant, and ZCPEdl-RCT represents the resistive–capacitive response of the second time constant. In the case of Ti CP without a film, ZCPE1 and R1 are the impedance and resistance of the TiO2 porous outer layer, and in the case of the Ti CP surface with deposited film, they represent the impedance and resistance of the deposited film. In the equivalent circuit RCT ≈ Rp.
In the model, the impedance of the constant phase element (CPE) is defined by [43]:
Z C P E = 1 Y 0 j ω n   ,
The CPE was used instead of the capacitance to compensate the surface irregularities that give rise to a non-uniform distribution of charge transfer [44]. In the expression, Y0 is a proportionality factor, i = √−1, j = frequency, and n = α/(π/2) where α is the CPE phase angle. It is commonly accepted that if n = 1, the CPE represents an ideal capacitor and therefore Y0 = capacitance, and if n = 0.5, the CPE represents the Warburg impedance. The capacitance values can be obtained from the expression [45]:
C i = Y 0 i R i 1 n i 1 n i   ,
Figure 13 shows the values of RCT and R1 determined after fitting the experimental data to the proposed equivalent circuit. Both the trend and the magnitude of the RCT values are very similar to the Rp values obtained from polarization resistance measurements. This suggests that the proposed equivalent circuit is adequate to represent the electrode processes on the different surfaces of Ti CP. On the other hand, the R1 values for the Ti CP surface (without film) show very stable values, on the contrary, for the case of the chitosan film, its R1 values tended to decrease over time, due to the moisture adsorption. In the case of chitosan–HAp films, they showed higher R1 values due to the presence of HAp particles in the chitosan structure.
Regarding the capacitance values (Figure 14), it is observed that in general the Cdl values are within the same order of magnitude. In all cases, the presence of a film on the Ti CP surface contributed to obtaining more stable Cdl values. The Cdl values obtained are consistent with values reported in other studies [46,47,48,49,50]. The Cdl values are affected by the water absorption capacity of the film [46], and the type of aggressive species present in the electrolyte [47]. Kumar and Narayanam [47] report values of the order of 10−4–10−5 Fcm−2 for the Ti-15Mo alloy immersed in saline solution with and without fluoride ions, de Assis et al. [48] report values of 10−6 Fcm−2 for Ti alloys immersed in Hank’s solution, Lindholm-Sethson and Ardlin [49] report values between 10−4–10−6 Fcm−2 for titanium immersed in saline solution at different pH values, and Alvesa et al. [50] report values of the order of 10−5–10−6 for Ti CP anodized evaluated in saline solution.
On the other hand, the values of C1 that correspond to the porous layer of the passive film of Ti CP, at the beginning of the test these are similar to the magnitude of Cdl. However, as time increases their values tend to decrease. According to the definition of capacitance [46]:
C = ε ε o A d  
where εo = vacuum dielectric constant, A = reaction area, ε = dielectric constant, and d = thickness, it is possible that this decrease is due to an increase in the thickness of the external porous layer of the passive film.
In the case of the chitosan film, its C1 values tended to increase with time. This may be due to both the increase in film thickness due to water absorption and the contribution of the high dielectric constant of the adsorbed water [51,52,53,54]. In the case of the different chitosan–HAp films, their capacitance values were similar and constant, this suggests that the incorporation of HAp particles contributes to reducing the increase in film thickness and/or the amount of adsorbed water molecules.
The results obtained show a beneficial effect of the superficial modification of Ti CP through the electrophoretic deposition of chitosan–HAp films. In general, it improves its properties by reducing the adsorption of aggressive species, reducing the increase in film thickness, and acting as a barrier that limits the free diffusion of aggressive species. All this contributes to the formation of a more stable passive layer (dense and compact) onto Ti CP surface.

4. Conclusions

The different studies carried out and their results showed the following.
XRD and FT-IR studies indicated that it is possible to obtain pure HAp using an agricultural waste such as eggshell. The precipitation pH conditions did not affect the purity of the product obtained or the size of its crystallite. However, the SEM analysis indicated that at pH 8 a HAp with a spongier appearance and submicron size is obtained, and that the increase in pH increases the size of the particles due to the formation of denser and more compact clusters.
The incorporation of HAp into the chitosan films improved the electrochemical behavior of the Ti CP surface. The polarization curves showed a more stable behavior of the passive zone and a decrease in the Icorr values. OCP measurements indicated that the evolution of its values is more stable than the behavior observed in its absence, suggesting a more stable surface.
The Rp measurements showed that in the absence of the chitosan–HAp films, at the beginning of the test the Ti CP surface showed an abrupt increase in its Rp values; however, in the presence of the different films with HAp, the rate of increase is lower but with higher values of Rp. This increase suggests a controlled growth of the passive layer which improves its protective properties.
The EIS studies indicated that both the presence of the chitosan–HAp films and the increase in the HAp concentration improve the response of the Ti CP surface. The increase in concentration improves the resistive–capacitive response of its surface due to the formation of a more stable passive film according to the evolution of the EIS spectra.

Author Contributions

Formal analysis, J.P.M.-D., C.D.A.-G., F.J.P.-A., M.A.D.-L. and J.P.-C.; Investigation, J.P.M.-D., F.J.P.-A., M.A.D.-L., F.B.-B. and J.P.-C.; Methodology, J.P.M.-D., C.D.A.-G., F.B.-B. and J.P.-C.; Resources, C.D.A.-G., F.J.P.-A. and M.A.D.-L.; Software, F.B.-B.; Validation, C.D.A.-G.; Writing—original draft, J.P.-C.; Writing—review and editing, C.D.A.-G., F.J.P.-A., M.A.D.-L. and J.P.-C. All authors have read and agreed to the published version of the manuscript.

Funding

This research received no external funding.

Institutional Review Board Statement

Not applicable.

Informed Consent Statement

Not applicable.

Data Availability Statement

Not applicable.

Conflicts of Interest

The authors declare no conflict of interest.

References

  1. Porcayo-Palafox, E.; Carrera-Chavez, S.I.; Casolco, S.R.; Porcayo-Calderon, J.; Salinas-Bravo, V.M. Electrochemical Performance of Ti-based Commercial Biomaterials. Adv. Mater. Sci. Eng. 2019, 2019, 4352360. [Google Scholar] [CrossRef]
  2. Huzum, B.; Puha, B.; Necoara, R.M.; Gheorghevici, S.; Puha, G.; Filip, A.; Sirbu, P.D.; Alexa, O. Biocompatibility assessment of biomaterials used in orthopedic devices: An overview. Exp. Ther. Med. 2021, 22, 1315. [Google Scholar] [CrossRef] [PubMed]
  3. Davis, R.; Singh, A.; Jackson, M.J.; Coelho, R.T.; Prakash, D.; Charalambous, C.P.; Ahmed, W.; da Silva, L.R.R.; Lawrence, A.A. A comprehensive review on metallic implant biomaterials and their subtractive manufacturing. Int. J. Adv. Manuf. Technol. 2022, 120, 1473–1530. [Google Scholar] [CrossRef] [PubMed]
  4. Chua, K.; Khan, I.; Malhotra, R.; Zhu, D. Additive manufacturing and 3D printing of metallic biomaterials. Eng. Regen. 2021, 2, 288–299. [Google Scholar] [CrossRef]
  5. Thakur, A.; Kumar, A.; Kaya, S.; Marzouki, R.; Zhang, F.; Guo, L. Recent Advancements in Surface Modification, Characterization and Functionalization for Enhancing the Biocompatibility and Corrosion Resistance of Biomedical Implants. Coatings 2022, 12, 1459. [Google Scholar] [CrossRef]
  6. Rahimi, M.; Aghdam, R.M.; Sohi, M.H.; Rezayan, A.H.; Ettelaei, M. Improving biocompatibility and corrosion resistance of anodized AZ31 Mg alloy by electrospun chitosan/mineralized bone allograft (MBA) nanocoatings. Surf. Coat. Technol. 2021, 405, 126627. [Google Scholar] [CrossRef]
  7. Wathanyu, K.; Tuchinda, K.; Daopiset, S.; Sirivisoot, S. Corrosion resistance and biocompatibility of cold-sprayed titanium on 316L stainless steel. Surf. Coat. Technol. 2022, 445, 128721. [Google Scholar] [CrossRef]
  8. Lai, K.C.; Chao, S.C.; Tseng, K.K.; Yeh, J.W.; Chen, P.Y. Biocompatible as-cast and homogenized TiNbTaZrMoV high entropy alloys: Mechanical properties, corrosion resistance and in vitro studies. J. Mater. Res. Technol. 2023, 24, 9708–9721. [Google Scholar] [CrossRef]
  9. Du, P.; Xiang, T.; Cai, Z.; Xie, G. The influence of porous structure on the corrosion behavior and biocompatibility of bulk Ti-based metallic glass. J. Alloys Compd. 2022, 906, 164326. [Google Scholar] [CrossRef]
  10. Eliaz, N. Corrosion of metallic biomaterials: A review. Materials 2019, 12, 407. [Google Scholar] [CrossRef]
  11. Hassan, N.; Hendy, A.; Ebrahim, A.; Tamer, T.M. Synthesis and evaluation of novel O-functionalized aminated chitosan derivatives as antibacterial, antioxidant and anticorrosion for 316L stainless steel in simulated body fluid. J. Saudi Chem. Soc. 2021, 25, 101368. [Google Scholar] [CrossRef]
  12. Witecka, A.; Valet, S.; Basista, M.; Boccaccini, A.R. Electrophoretically deposited high molecular weight chitosan/bioactive glass composite coatings on WE43 magnesium alloy. Surf. Coat. Technol. 2021, 418, 127232. [Google Scholar] [CrossRef]
  13. Bozkurt, Y.B.; Kavasoğlu, Y.S.; Atik, B.; Kovacı, H.; Uzun, Y.; Çelik, A. Comparison study of corrosion behavior for chitosan coated Ti6Al4V alloy produced by selective laser melting and forging. Prog. Org. Coat. 2023, 182, 107655. [Google Scholar] [CrossRef]
  14. Wang, J.; Deng, S.; Meng, M.; Tu, W.; Ou, J. Improved corrosion resistance and biocompatibility of AZ31 alloy by acid pickling pretreatment and (H+) hydroxyapatite/chitosan composite coating. Surf. Coat. Technol. 2023, 454, 129157. [Google Scholar] [CrossRef]
  15. Muñoz-Sanchez, E.R.; Arrieta-Gonzalez, C.D.; Quinto-Hernandez, A.; Garcia-Hernandez, E.; Porcayo-Calderon, J. Synthesis of hydroxyapatite from eggshell and its electrochemical characterization as a coating on Titanium. Int. J. Electrochem. Sci. 2023, 18, 100204. [Google Scholar] [CrossRef]
  16. Jing, Z.; Cao, Q.; Jun, H. Corrosion, wear and biocompatibility of hydroxyapatite bio-functionally graded coating on titanium alloy surface prepared by laser cladding. Ceram. Int. 2021, 47, 24641–24651. [Google Scholar] [CrossRef]
  17. Mohammad, N.F.; Ahmad, R.N.; Rosli, N.M.; Manan, M.A.; Marzuki, M.; Wahi, A. Sol gel deposited hydroxyapatite-based coating technique on porous titanium niobium for biomedical applications: A mini review. Mater. Today Proc. 2021, 41, 127–135. [Google Scholar] [CrossRef]
  18. Lin, M.H.; Chen, Y.C.; Liao, C.C.; Lin, L.W.; Chen, C.F.; Wang, K.K.; Chen, S.-T.; Hsueh, Y.H.; Wu, C.H.; Ou, S.F. Improvement in bioactivity and corrosion resistance of Ti by hydroxyapatite deposition using ultrasonic mechanical coating and armoring. Ceram. Int. 2022, 48, 4999–5008. [Google Scholar] [CrossRef]
  19. Muthu, D.; Kumar, G.S.; Gowri, M.; Prasath, M.; Viswabaskaran, V.; Kattimani, V.S.; Girija, E.K. Rapid synthesis of eggshell derived hydroxyapatite with nanoscale characteristics for biomedical applications. Ceram. Int. 2022, 48, 1326–1339. [Google Scholar] [CrossRef]
  20. Wu, S.-C.; Hsu, H.-C.; Wang, H.-F.; Liou, S.-P.; Ho, W.-F. Synthesis and Characterization of Nano-Hydroxyapatite Obtained from Eggshell via the Hydrothermal Process and the Precipitation Method. Molecules 2023, 28, 4926. [Google Scholar] [CrossRef]
  21. Goh, K.W.; Wong, Y.H.; Ramesh, S.; Chandran, H.; Krishnasamy, S.; Ramesh, S.; Sidhu, A.; Teng, W.D. Effect of pH on the properties of eggshell-derived hydroxyapatite bioceramic synthesized by wet chemical method assisted by microwave irradiation. Ceram. Int. 2021, 47, 8879–8888. [Google Scholar] [CrossRef]
  22. Alhasan, H.S.; Alahmadi, N.; Yasin, S.A.; Khalaf, M.Y.; Ali, G.A.M. Low-Cost and Eco-Friendly Hydroxyapatite Nanoparticles Derived from Eggshell Waste for Cephalexin Removal. Separations 2022, 9, 10. [Google Scholar] [CrossRef]
  23. Pu’ad, N.A.S.M.; Alipal, J.; Abdullah, H.Z.; Idris, M.I.; Lee, T.C. Synthesis of eggshell derived hydroxyapatite via chemical precipitation and calcination method. Mater. Today Proc. 2021, 42, 172–177. [Google Scholar] [CrossRef]
  24. Shi, D.; Tong, H.; Lv, M.; Luo, D.; Wang, P.; Xu, X.; Han, Z. Optimization of hydrothermal synthesis of hydroxyapatite from chicken eggshell waste for effective adsorption of aqueous Pb(II). Environ. Sci. Pollut. Res. 2021, 28, 58189–58205. [Google Scholar] [CrossRef] [PubMed]
  25. Khalid, M.; Jikan, S.S.B.; Adzila, S.; Murni, Z.; Badarulzaman, N.A.; Rosley, R.; Hameed, M.U. Synthesis and Characterizations of Hydroxyapatite using Precursor Extracted from Chicken Egg Shell Waste. Biointerface Res. Appl. Chem. 2022, 12, 5663–5671. [Google Scholar] [CrossRef]
  26. Baskar, K.; Karthikeyan, B.S.; Gurucharan, I.; Mahalaxmi, S.; Rajkumar, G.; Dhivya, V.; Kishen, A. Eggshell derived nano-hydroxyapatite incorporated carboxymethyl chitosan scaffold for dentine regeneration: A laboratory investigation. Int. Endod. J. 2022, 55, 89–102. [Google Scholar] [CrossRef]
  27. Sangmala, A.; Naemchanthara, P.; Limsuwan, P.; Naemchanthara, K. Replacement of hydroxyapatite from chicken eggshell waste for ceramic properties improvement. Int. J. Appl. Ceram. 2021, 18, 2132–2142. [Google Scholar] [CrossRef]
  28. Mardziah, C.M.; Ramesh, S.; Chandran, H.; Sidhu, A.; Krishnasamy, S. Properties of sintered zinc hydroxyapatite bioceramic prepared using waste chicken eggshells as calcium precursor. Ceram. Int. 2023, 49, 12381–12389. [Google Scholar] [CrossRef]
  29. Mokhtar, M.Z.; Altujjar, A.; Wang, B.; Chen, Q.; Ke, J.C.R.; Cai, R.; Zibouche, N.; Spencer, B.F.; Jacobs, J.; Thomas, A.G.; et al. Spherical hydroxyapatite nanoparticle scaffolds for reduced lead release from damaged perovskite solar cells. Commun. Mater. 2022, 3, 77. [Google Scholar] [CrossRef]
  30. Martinez-Gomez, M.; Quinto-Hernandez, A.; Flores-Garcia, N.S.; Mayén, J.; Dominguez-Diaz, M.; Martinez, H.; Porcayo-Calderon, J.; Gonzalez-Rodriguez, J.G.; Martinez-Gomez, L. Electrophoretic deposition of chitosan films doped with Nd2Ti2O7 nanoparticles as protective coatings against corrosion in saline solutions. Int. J. Polym. Sci. 2019, 2019, 3864835. [Google Scholar] [CrossRef]
  31. ISO 10993-15:2001; Part 1—Biological Evaluation of Medical Devices, 10993. ISO: Geneva, Switzerland, 2001.
  32. Workeneh, K.; Zereffa, E.A.; Segne, T.A.; Eswaramoorthy, R. Eggshell-Derived Nanohydroxyapatite Adsorbent for Defluoridation of Drinking Water from Bofo of Ethiopia. J. Nanomater. 2019, 2019, 2458312. [Google Scholar] [CrossRef]
  33. Al-Mobarak, N.A.; Al-Swayih, A.A.; Al-Rashoud, F.A. Corrosion Behavior of Ti-6Al-7Nb Alloy in Biological Solution for Dentistry Applications. Int. J. Electrochem. Sci. 2011, 6, 2031–2042. [Google Scholar] [CrossRef]
  34. Yu, S.Y.; Scully, J.R. Corrosion and Passivity of Ti-13% Nb-13% Zr in Comparison to Other Biomedical Implant Alloys. Corrosion 1997, 53, 965–976. [Google Scholar] [CrossRef]
  35. Aziz-Kerrzo, M.; Conroy, K.G.; Fenelon, A.M.; Farrell, S.T.; Breslin, C.B. Electrochemical studies on the stability and corrosion resistance of titanium-based implant materials. Biomaterials 2001, 22, 1531–1539. [Google Scholar] [CrossRef] [PubMed]
  36. Ibris, N.; Mirza-Rosca, J.C. EIS study of Ti and its alloys in biological media. J. Electroanal. Chem. 2002, 526, 53–62. [Google Scholar] [CrossRef]
  37. Marino, C.E.B.; Helena-Mascaro, L. EIS characterization of a Ti-dental implant in artificial saliva media: Dissolution process of the oxide barrier. J. Electroanal. Chem. 2004, 568, 115–120. [Google Scholar] [CrossRef]
  38. Figueira, N.; Silva, T.M.; Carmezim, M.J.; Fernandes, J.C.S. Corrosion behaviour of NiTi alloy. Electrochim. Acta 2009, 54, 921–926. [Google Scholar] [CrossRef]
  39. Wang, B.L.; Zheng, Y.F.; Zhao, L.C. Electrochemical corrosion behavior of biomedical Ti-22Nb and Ti-22Nb-6Zr alloys in saline medium. Mater. Corros. 2009, 60, 780–794. [Google Scholar] [CrossRef]
  40. Tual, C.; Espuche, E.; Ecoubes, M.; Domard, A. Transport Properties of Chitosan Membranes: Influence of Crosslinking. J. Polym. Sci. B Polym. Phys. 2000, 38, 1521–1529. [Google Scholar] [CrossRef]
  41. Giannakas, A.; Grigoriadi, K.; Leontiou, A.; Barkoula, N.-M.; Ladavos, A. Preparation, characterization, mechanical and barrier properties investigation of chitosan-clay nanocomposites. Carbohydr. Polym. 2014, 108, 103–111. [Google Scholar] [CrossRef]
  42. Ostrowska-Czubenko, J.; Gierszewska-Druyska, M. Effect of ionic crosslinking on the water state in hydrogel chitosan membranes. Carbohydr. Polym. 2009, 77, 590–598. [Google Scholar] [CrossRef]
  43. Amin, M.A.; Khaled, K.F.; Mohsen, Q.; Arida, H.A. A study of the inhibition of iron corrosion in HCl solutions by some amino acids. Corros. Sci. 2010, 52, 1684–1695. [Google Scholar] [CrossRef]
  44. Ferrer, J.E.; Victori, L. Oxygen evolution reaction on the iridium electrode in basic medium studied by electrochemical im-pedance spectroscopy. Electrochim. Acta 1994, 39, 581–588. [Google Scholar] [CrossRef]
  45. Ma, H.; Cheng, X.; Li, G.; Chen, S.; Quan, Z.; Zhao, S.; Niu, L. The influence of hydrogen sulfide on corrosion of iron under different conditions. Corros. Sci. 2000, 42, 1669–1683. [Google Scholar] [CrossRef]
  46. Liu, X.; Xiong, J.; Lv, Y.; Zuo, Y. Study on corrosion electrochemical behavior of several different coating systems by EIS. Prog. Org. Coat. 2009, 64, 497–503. [Google Scholar] [CrossRef]
  47. Kumar, S.; Narayanan, T.S.N.S. Corrosion behaviour of Ti–15Mo alloy for dental implant applications. J. Dent. 2008, 36, 500–507. [Google Scholar] [CrossRef]
  48. de Assis, S.L.; Wolynec, S.; Costa, I. Corrosion characterization of titanium alloys by electrochemical techniques. Electrochim. Acta 2006, 51, 1815–1819. [Google Scholar] [CrossRef]
  49. Lindholm-Sethson, B.; Ardlin, B.I. Effects of pH and fluoride concentration on the corrosion of titanium. J. Biomed. Mater. Res. A 2008, 86A, 149–159. [Google Scholar] [CrossRef]
  50. Alvesa, A.C.; Wenger, F.; Ponthiaux, P.; Celis, J.-P.; Pinto, A.M.; Rocha, L.A.; Fernandes, J.C.S. Corrosion mechanisms in titanium oxide-based films produced by anodic treatment. Electrochim. Acta 2017, 234, 16–27. [Google Scholar] [CrossRef]
  51. Gomez-Guzman, N.B.; Canto, J.; Martinez-de-la-Escalera, L.M.; Neri, A.; Porcayo-Calderon, J. Inhibition of X52 Corrosion in CO2-Saturated Brine by a Dialkyl-Diamide from Coffee Bagasse Oil. Molecules 2023, 28, 763. [Google Scholar] [CrossRef]
  52. Musa, A.Y.; Jalgham, T.T.R.; Mohamad, A.B. Molecular dynamic and quantum chemical calculations for phthalazine derivatives as corrosion inhibitors of mild steel in 1 M HCl. Corros. Sci. 2012, 56, 176–183. [Google Scholar] [CrossRef]
  53. Solmaz, R. Investigation of the inhibition effect of 5-((E)-4-phenylbuta-1, 3-dienylideneamino)-1, 3, 4-thiadiazole-2-thiol Schiff base on mild steel corrosion in hydrochloric acid. Corros. Sci. 2010, 52, 3321–3330. [Google Scholar] [CrossRef]
  54. Ahamad, I.; Quraishi, M.A. Bis(benzimidazol-2-yl) disulphide: An efficient water soluble inhibitor for corrosion of mild steel in acid media. Corros. Sci. 2009, 51, 2006–2013. [Google Scholar] [CrossRef]
Figure 1. X-ray diffraction pattern of HAp as synthesized at different pH conditions.
Metals 13 01828 g001
Figure 2. Fourier transform infrared (FT-IR) spectroscopy of HAp as synthesized at different pH conditions.
Metals 13 01828 g002
Figure 3. Morphological aspects of HAp as synthesized at different pH conditions.
Metals 13 01828 g003
Figure 4. Morphological aspects of chitosan films with different HAp content; (a) chitosan, (b) 3 g HAp, (c) 5 g HAp, (d) 10 g HAp, (e) 20 g HAp.
Metals 13 01828 g004aMetals 13 01828 g004b
Figure 5. Morphological aspects of 20 g HAp film and element mapping.
Metals 13 01828 g005aMetals 13 01828 g005b
Figure 6. (a) Potentiodynamic polarization curves of Ti CP, with and without coating, evaluated in artificial plasma at 37 °C; (b) approach to the Tafel area; (c) approach to the pseudopassive region.
Metals 13 01828 g006
Figure 7. Variation in OCP values of Ti CP, with and without coating, evaluated in artificial plasma at 37 °C.
Metals 13 01828 g007
Figure 8. Evolution of the Rp values of Ti CP, with and without coating, evaluated in artificial plasma at 37 °C.
Metals 13 01828 g008
Figure 9. Evolution of the Nyquist and Bode diagrams; (ac) Ti CP; (df) Ti CP coated with chitosan. Evaluated in artificial plasma (37 °C) for 24 h.
Metals 13 01828 g009aMetals 13 01828 g009b
Figure 10. Evolution of the Nyquist and Bode diagrams; (ac) Ti CP coated with 3 g HAp; (df) Ti CP coated with 5 g HAp. Evaluated in artificial plasma (37 °C) for 24 h.
Metals 13 01828 g010aMetals 13 01828 g010b
Figure 11. Evolution of the Nyquist and Bode diagrams; (ac) Ti CP coated with 10 g HAp; (df) Ti CP coated with 20 g HAp. Evaluated in artificial plasma (37 °C) for 24 h.
Metals 13 01828 g011aMetals 13 01828 g011b
Figure 12. Equivalent circuit used to fit the impedance spectra.
Metals 13 01828 g012
Figure 13. Variation as a function of time of the values of; (a) Charge transfer resistance, Rct, and (b) Resistance of the protective film, R1.
Metals 13 01828 g013
Figure 14. Variation as a function of time of the values of; (a) Double layer capacitance, Cdl, and (b) Capacitance of the protective film, C1.
Metals 13 01828 g014aMetals 13 01828 g014b
Table 1. Solutions used for the electrophoretic deposition process.
NomenclatureChitosan–HAp Solutions
Chitosan0.5% chitosan solution
3 g HAp0.5% chitosan and 3% Hap
5 g HAp0.5% chitosan and 5% HAp
10 g HAp0.5% chitosan and 10% HAp
20 g HAp0.5% chitosan and 20% HAp
Table 2. Artificial plasma composition [31].
ComponentConcentration (g/L)
NaCl6.8
CaCl20.2
KCl0.4
MgSO40.1
NaHCO32.2
NaHPO40.126
NaH2PO40.026
Table 3. Electrochemical parameters obtained from the polarization curves.
MaterialEcorr
(mV)
ba
(mv/Dec)
bc
(mV/Dec)
Icorr
(nA/cm2)
Epas
(mV)
Ipas
(µA/cm2)
Passive Zone
(mV)
Ti−3331852013983205–91000
Chitosan−265326200367707–8600
3 g HAp−215197254913685–61150
5 g HAp−401190200255105–61160
10 g HAp−337192243414605–61170
20 g HAp−168204231963985–61100
Disclaimer/Publisher’s Note: The statements, opinions and data contained in all publications are solely those of the individual author(s) and contributor(s) and not of MDPI and/or the editor(s). MDPI and/or the editor(s) disclaim responsibility for any injury to people or property resulting from any ideas, methods, instructions or products referred to in the content.

