Article

Influence of Specimen Diameter for Titanium Grade 1 on SHPB Tests and Its Verification Using FEM

Department of Aerospace Engineering, Pusan National University, Busan 46241, Republic of Korea
*
Author to whom correspondence should be addressed.
Metals 2023, 13(12), 1941; https://doi.org/10.3390/met13121941
Submission received: 13 October 2023 / Revised: 21 November 2023 / Accepted: 24 November 2023 / Published: 27 November 2023

Abstract

:
The split Hopkinson pressure bar (SHPB) is a machine used for obtaining dynamic material properties at high strain rates of 102–104 s−1. In the SHPB test, the material properties obtained vary depending on the shape of the specimen. In other words, it is important to understand the behavior of the specimen when selecting the specimen dimensions. However, specific standards, such as the size of specimens and bars for the SHPB, have not yet been established. This study investigates the effect of changing the specimen diameter on strain and stress results. Comparison and verification with experimental results were performed using the LS-DYNA program. Specimens are cylindrical titanium grade 1. The specifications of bars and length ( L ) of the specimens were not changed. The results revealed that the reflected ratio increased, and the transmitted ratio decreased as the area of the specimen decreased. The ratios of these strains are affected by impedance ( Z = ρ A C ). The area reduction of specimens under the same conditions made it possible to obtain dynamic properties at a higher strain rate. It was shown that the impedance relationship and strain rate can be altered by varying the diameter of the specimen without changing the dimensions or material of the bar itself.

1. Introduction

Material properties are a basic consideration in manufacturing. Researchers and engineers must carefully examine material characteristics like stress ( σ ), strain ( ε ) and strain rate ( ε   ˙ ). Stress and strain are affected by the strain rate and vary between quasi-static and dynamic conditions. The strain rate represents the amount of change in strain per unit time, and it must be considered since materials have different behaviors based on it. Materials have a high yield stress and ultimate strength at high strain rates [1,2]. This is called the strain rate effect, which is important for understanding high-speed loading scenarios, such as car collisions and explosions. Furthermore, dynamic properties can be used in a high-velocity forming process, which can improve the formability and strength of the material. Currently, machines for obtaining high-speed material properties are typically high-speed tensile test machines [3], the split Hopkinson pressure bar (SHPB) [4,5,6,7,8] and the split Hopkinson tensile bar (SHTB) [9,10,11,12]. The split Hopkinson bar (SHB) is an apparatus that is designed for acquiring dynamic material properties of a specimen for a given high strain rate of 102–104 s−1. SHB machines have been supplemented and improved from the initial model [13,14] and should be designed and manufactured to suit the situation of each laboratory. Raw data obtained through them can be converted to high-speed material properties using the Johnson-Cook [15] or Cowper-Symonds constitutive models [16]. The Hopkinson bar has been widely used to obtain dynamic material properties for various materials such as metals [17,18], concretes [19] and composites [20,21]. It can be also modified to measure dynamic behavior in ultra-high [22] or ultra-low temperatures [23]. Recently, there have been efforts to apply peridynamic modeling in SHPB analysis to achieve more accurate simulation results [24,25].
Material properties such as Young’s modulus (E) and the stress-strain (S-S) curve in a quasi-static state are obtained through uniaxial tensile tests. The test must be performed after an appropriate specimen size is selected for each material to be measured in ASTM standards. While some researchers are working to standardize the SHPB through the round-robin test [26,27], specific standards for the SHPB have not been officially established. An appropriate specimen diameter (D) and thickness (L) can be selected by referring to previous studies. Because the specifications of SHPBs used in laboratories are different, and various specimen sizes are recommended, more studies are required. SHPB specimens are typically shaped similarly to a cylindrical rod. Factors involved in shape are thickness and diameter. Previous studies have suggested that different material properties can be obtained depending on the shape of the specimen [28,29].
In this study, an SHPB experiment was conducted to investigate the effect of the specimen diameter using titanium grade 1. The cross-sectional area of the specimen is an important factor in the impedance relationship and is expected to have a direct effect on the SHPB test. The experiment was conducted with specimen diameters of 5, 6, 7, 8 and 10 mm, and the thicknesses of all specimens were 5 mm. By maintaining a constant thickness and varying the diameter of the specimen, the effect of diameter was determined, and material properties for various strain rates were obtained.
Titanium grade 1, which is one of four commercially pure titanium materials, was selected as the specimen material. Titanium is widely used in aerospace, automotive and marine industries, owing to its high corrosion resistance and weldability. Because aircraft and cars are often exposed to high-speed loading conditions, understanding the dynamic material properties of titanium grade 1 is required.
The pressure of the pneumatic launcher was set to 0.5, 1.0 and 1.5 bar. Subsequently, dynamic compression curves were obtained by applying the S-S curves from each test to the Shin-Kim model [30]. LS-DYNA (R12.0, Livermore Software Technology Corporation (LSTC), Livermore, CA, USA), a commercial software program, was used to verify the effect of the diameter and material properties obtained in experiments.

2. Experimental Work

2.1. SHPB Apparatus and Theory

The SHPB apparatus includes a striker, incident bar, transmitted bar, specimen and data acquisition devices (Figure 1). The striker bar is launched by a gas gun. It collides with the incident bar at a velocity of V 0 and generates compressive elastic waves. V 0   is measured using a photogate. Voltage signals are measured from strain gauges attached to the incident and transmitted bar to quantify the elastic waves propagating through them using an oscilloscope and amplifier. Owing to the impedance difference, the incident wave is divided into reflected and transmitted waves after passing the interface between the specimen and the incident bar. These are the incident pulse ( ε I t ), reflected pulse ( ε R t ) and transmitted pulse ( ε T t ). They are used to calculate the stress ( σ S ), strain ( ε S ) and strain rate ( ε S ˙ ) of the specimen using SHB theory and engineering relationships, as shown in the following equations [8]:
σ S t = A B A S E B ε T t   ,
ε S t = 2 C B L S 0 t ε R t d t   ,
ε ˙ S t = 2 C B L S ε R t   ,
where A S , A B , E B L S and C B are the area of the specimen, area of the pressure bar, Young’s modulus of bars, thickness of the specimen and elastic wave speed of the pressure bar, respectively. Equations (1)–(3) are based on the assumptions of uniaxial and uniform stress in the specimen and satisfy a stress equilibrium condition (i.e., σ I + σ R = σ T ).
SNCM439 is used for pressure bars in SHPB theory, assuming an elastic deformation of incident and transmitted bars. In addition, the pressure bar should be long enough to prevent wave overlap. Detailed specifications for the bars are available in Table 1 and Table 2 [31].

2.2. Wave Impedance in the SHPB Test

The SHPB test is based on one-dimensional (1D) stress wave propagation through materials, including pressure bars and specimens. The stress wave traveling through the incident bar encounters the material specimen of interest. At the interface between the incident bar and specimen, some of the incident pulse reflects while the rest transmits through the specimen (Figure 2). The material properties of the specimen can be determined by analyzing the reflected and transmitted stress waves. Equations (4) and (5) show the relationship between the incident stress wave ( σ I ), reflected stress wave ( σ R ) and transmitted wave ( σ T ).
σ T = 2 A 1 ρ 2 C 2 A 1 ρ 1 C 1 + A 2 ρ 2 C 2 σ I = 2 A 1 ρ 2 C 2 Z 1 + Z 2 σ I   ,  
σ R = A 2 ρ 2 C 2 A 1 ρ 1 C 1 A 1 ρ 1 C 1 + A 2 ρ 2 C 2 σ I = Z 2 Z 1 Z 1 + Z 2 σ I   ,
These can also be defined as the relational expression of impedance ( Z = A ρ C ) . A is the cross-sectional area, ρ is the density, and C is a 1D wave velocity of the medium. Because striker and incident bars in SHPB tests are typically designed with the same material and cross-sectional area, stress waves are transmitted without reflection. However, there is a difference in impedance between the bars and specimen, causing the incident wave to split into reflected and transmitted waves. The voltage signals from the strain gauge attached to the incident and transmitted bars can measure the reflected and transmitted waves, respectively.
We attempted to vary the impedance ratio by changing the pressure bar, but preparing corresponding bars for each specimen was inefficient and costly. ASTM standards currently provide guidelines for specimen details for quasi-static tensile tests. There is no specific standard for the specimen in an SHPB experiment, only a size recommendation by several researchers. It is difficult to establish a specific standard because different laboratories have varying SHPB apparatus specifications. To conduct an accurate test, researchers must carefully select the size of the specimen based on the properties of the material being tested and equipment being used. During the SHPB test, it is crucial to consider the wave impedance relationship regarding the specimen shape to obtain precise material properties. The diameter and thickness of the cylindrical specimen are the primary factors that determine its shape in tests. Changing the diameter may affect the initial impedance. The cross-sectional area can control the reflected and transmitted ratio. In this study, the effect of diameter was investigated while the thickness was fixed.

2.3. Specimen Dimensions

The stress wave investigation of the titanium grade 1 specimen was conducted by varying the diameter of the specimen during the dynamic compression test. To determine the effect of diameter only, specimens of fixed thicknesses (5 mm) and varying diameters (5, 6, 7, 8 and 10 mm) were used. Figure 3 shows specimens used in SHPB tests. The experiments were conducted at three different pressures: 0.5, 1.0 and 1.5 bar. Table 3 shows the dimensions and slenderness ratio (L/D) of the specimens.

3. Experimental Results

3.1. Equilibrium Check

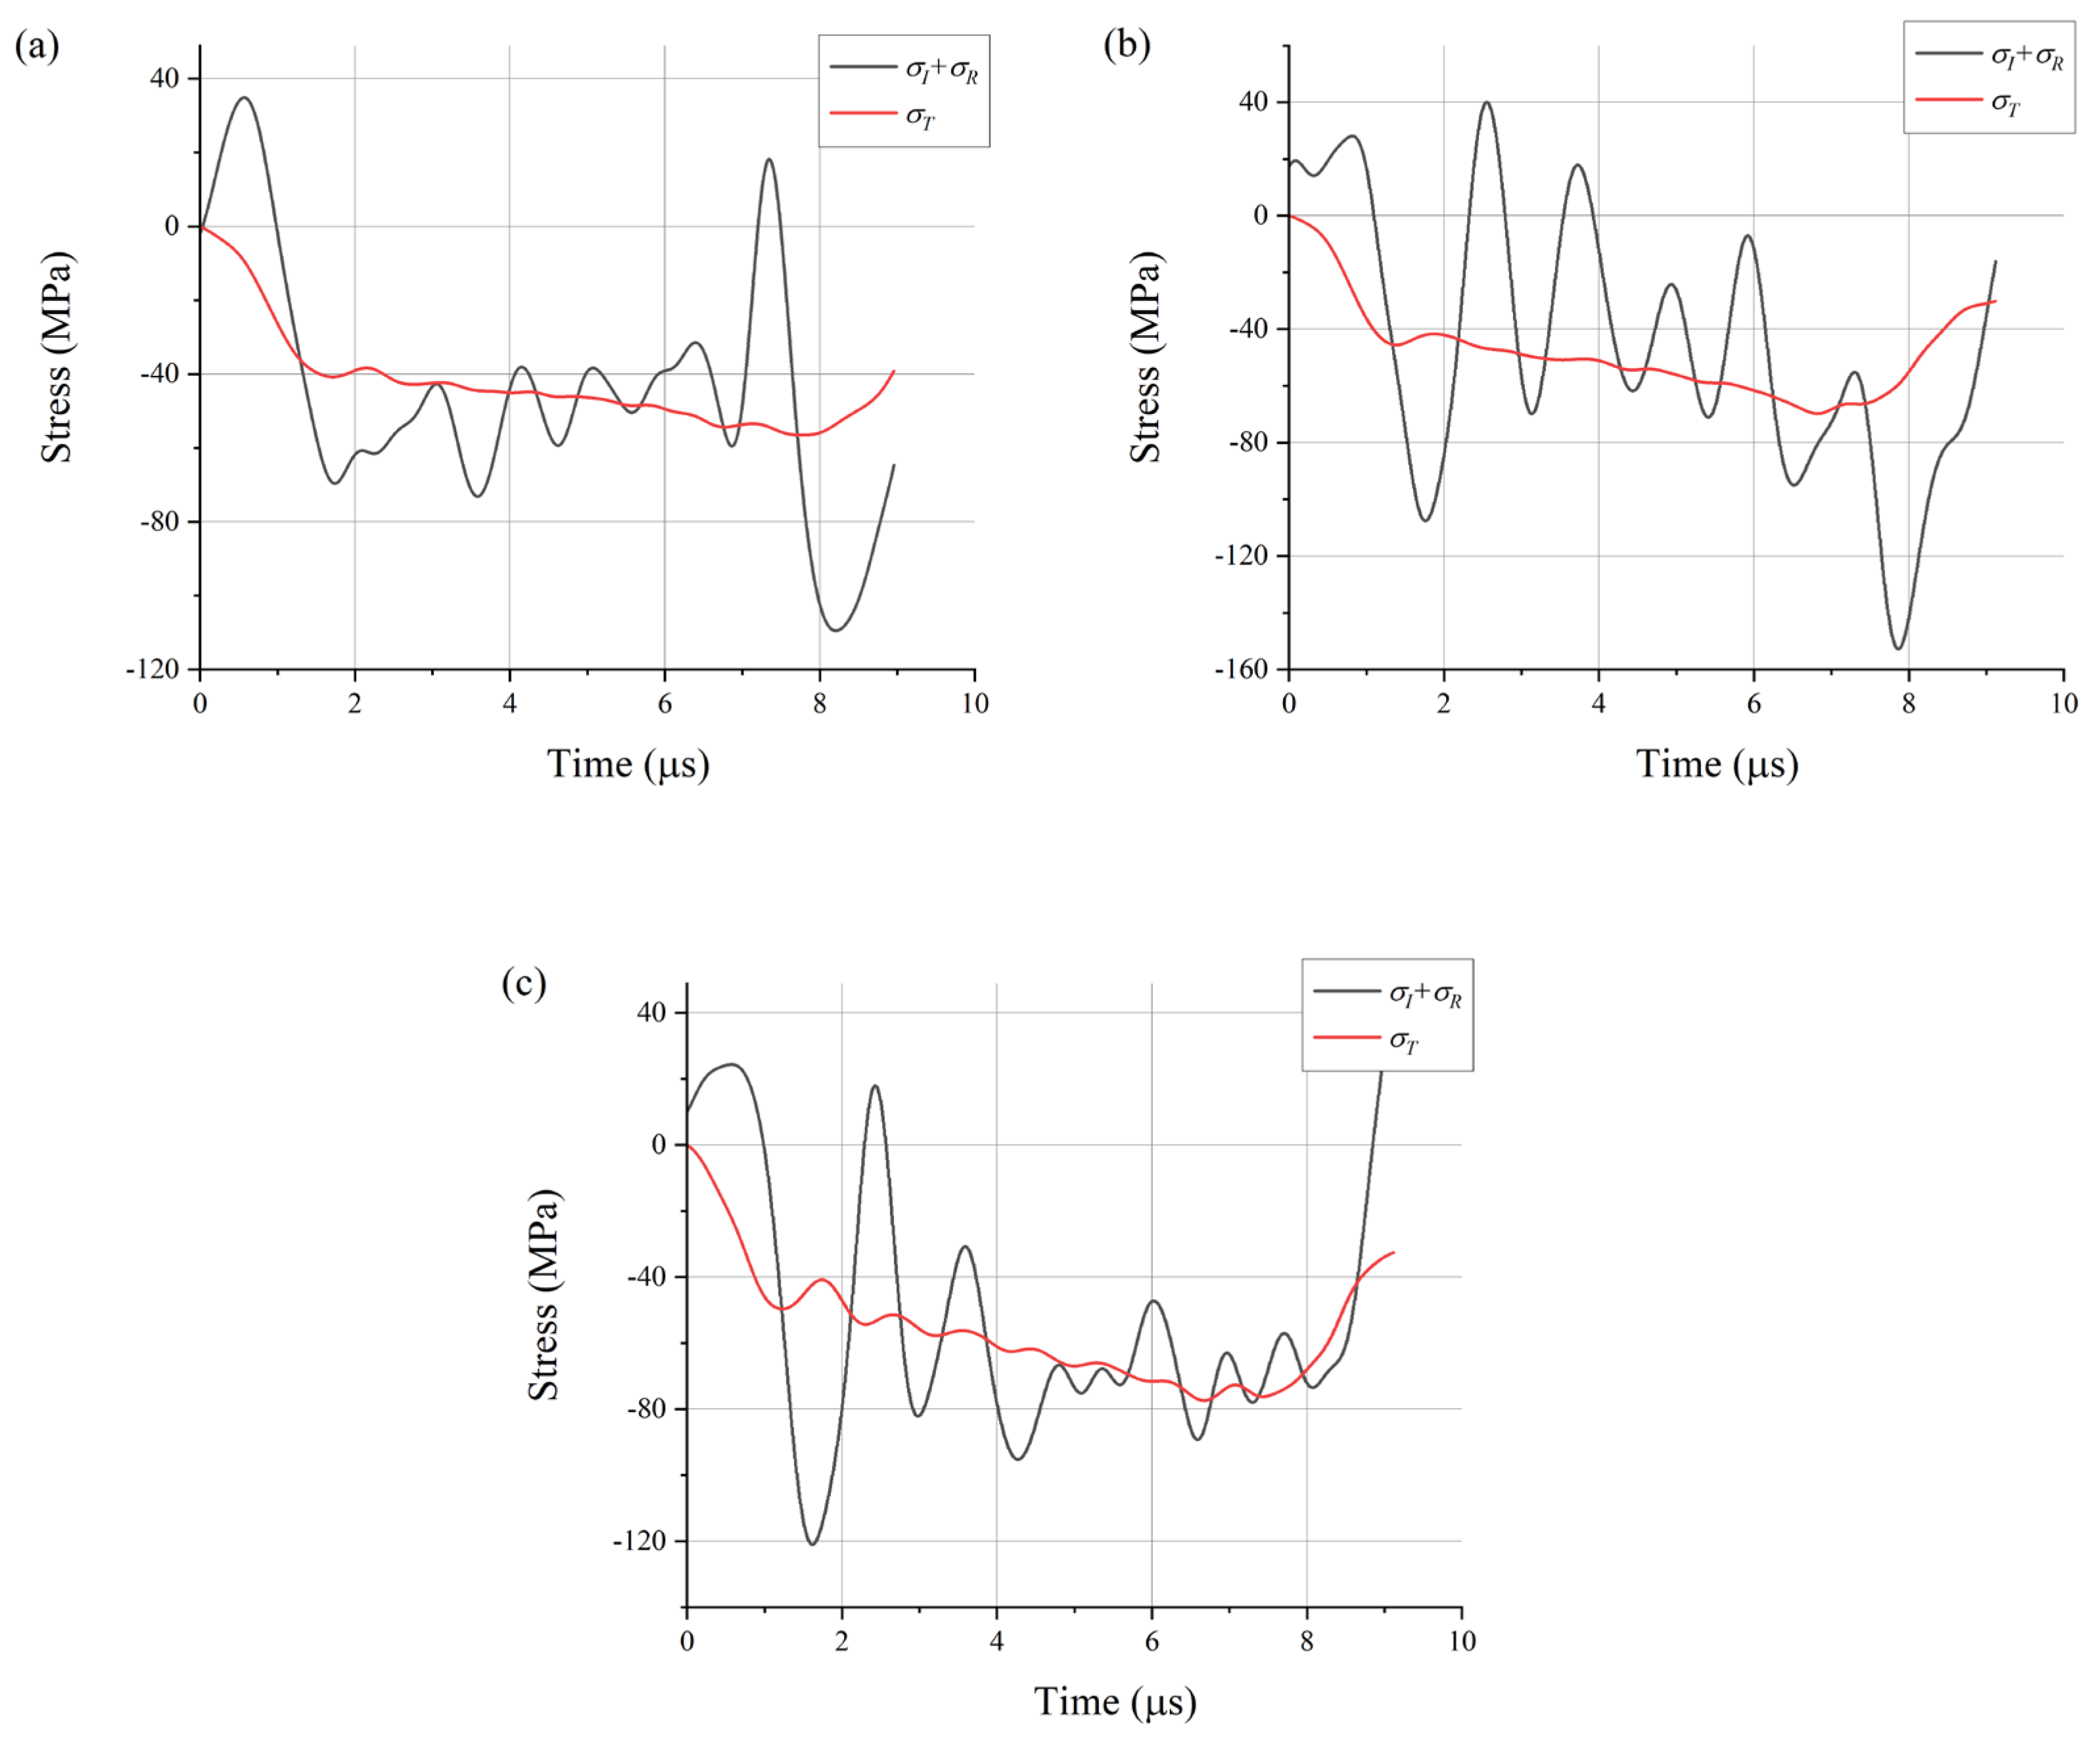
The objective of the SHPB test is to obtain the dynamic properties of the material, particularly the S-S curves at specific strain rates. Because these values are obtained from Equations (1)–(3), it is important to verify if the assumptions of the equations are satisfied. Equations (1)–(3) assume the following conditions: (a) one-dimensional stress wave propagation through the pressure bars and (b) uniform and uniaxial stress and strain within the specimen. Under these assumptions, the sum of the incident stress and reflected stress is expected to be equal to the transmitted stress (i.e., σ I + σ R = σ T ). This means that stress on both sides of the specimen is the same. Figure 4 demonstrates the strain equilibrium for each pressure condition. Large oscillation in the incident and reflected pulse is inevitable unless a pulse shaper is used [32,33]. In contrast, the transmitted pulse has less oscillation as it passes through a plastically deformed specimen. While there may appear to be a significant difference between σ I + σ R with a high oscillation and σ T with low oscillation, fitted pulses closely match each other.
To assess the equilibrium condition, we employed average percentages of discrepancy [26] and equilibrium factor. The average percentages of discrepancy F e q a v e for each experiment were calculated as follows:
F e q a v e = ± 1 n F 1 i F 2 i F 2 i 2 n × 100 %   ,
F 1 is the force at the interface of the specimen and incident bar, and F 2 is the force at the interface of the specimen and transmitted bar. The results of F e q a v e can be found in Table 4. The discrepancies were generally low, except for a few cases. The maximum discrepancy of ±26.8% is still considered a valid value for obtaining an accurate S-S curve [26].
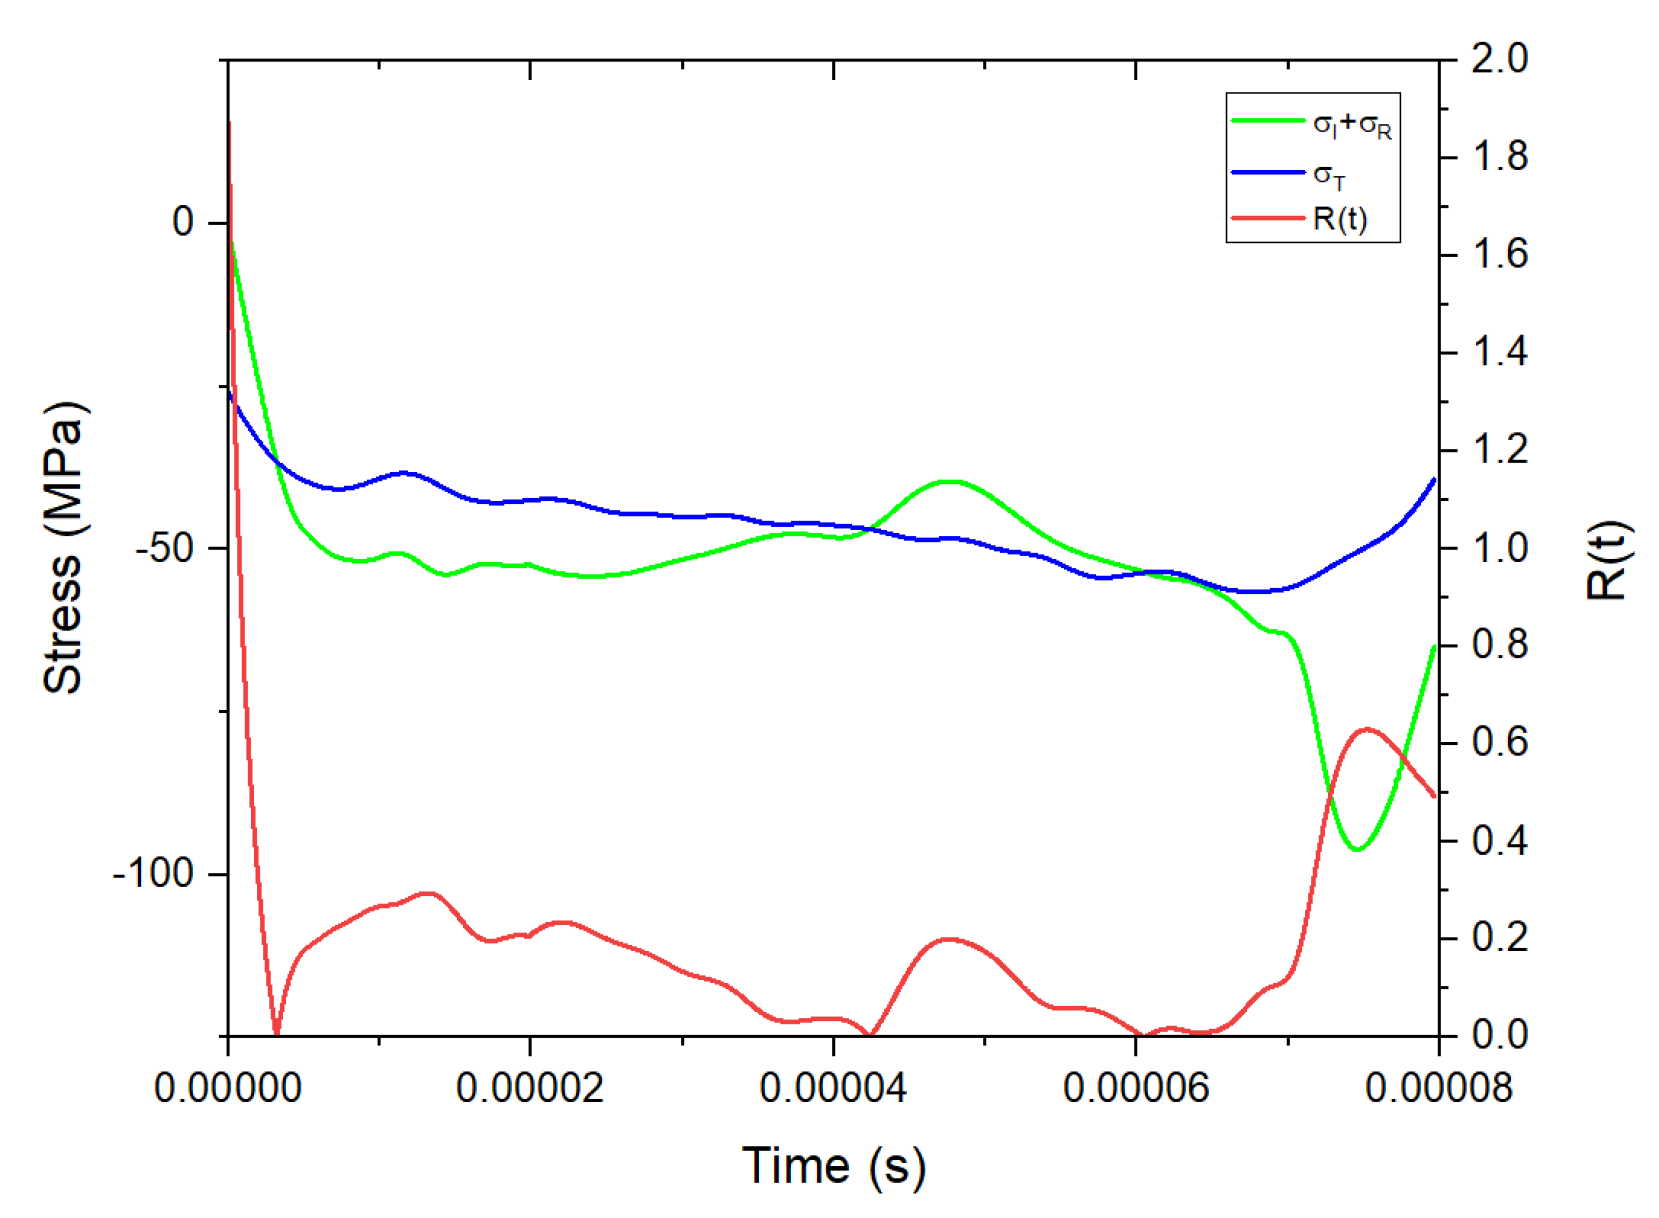
The equilibrium factor R t is defined as follows:
R t = σ ( t ) σ m ( t )   ,
σ t = ( σ I + σ R ) σ T   ,
σ m t = ( ( σ I + σ R ) + σ T ) / 2   ,
σ ( t ) is stress difference between the two faces of the specimen and σ m ( t ) is mean stress. The example of R t for our experiment is shown in Figure 5. R t was mostly high during rise and fall time of the pulse. Except for that region, the value was below approximately 0.3, which means that maximum difference between σ I + σ R and σ T is 30% of the average stress σ m ( t ) .

3.2. The Experimental Results of Reflected and Transmitted Pulses

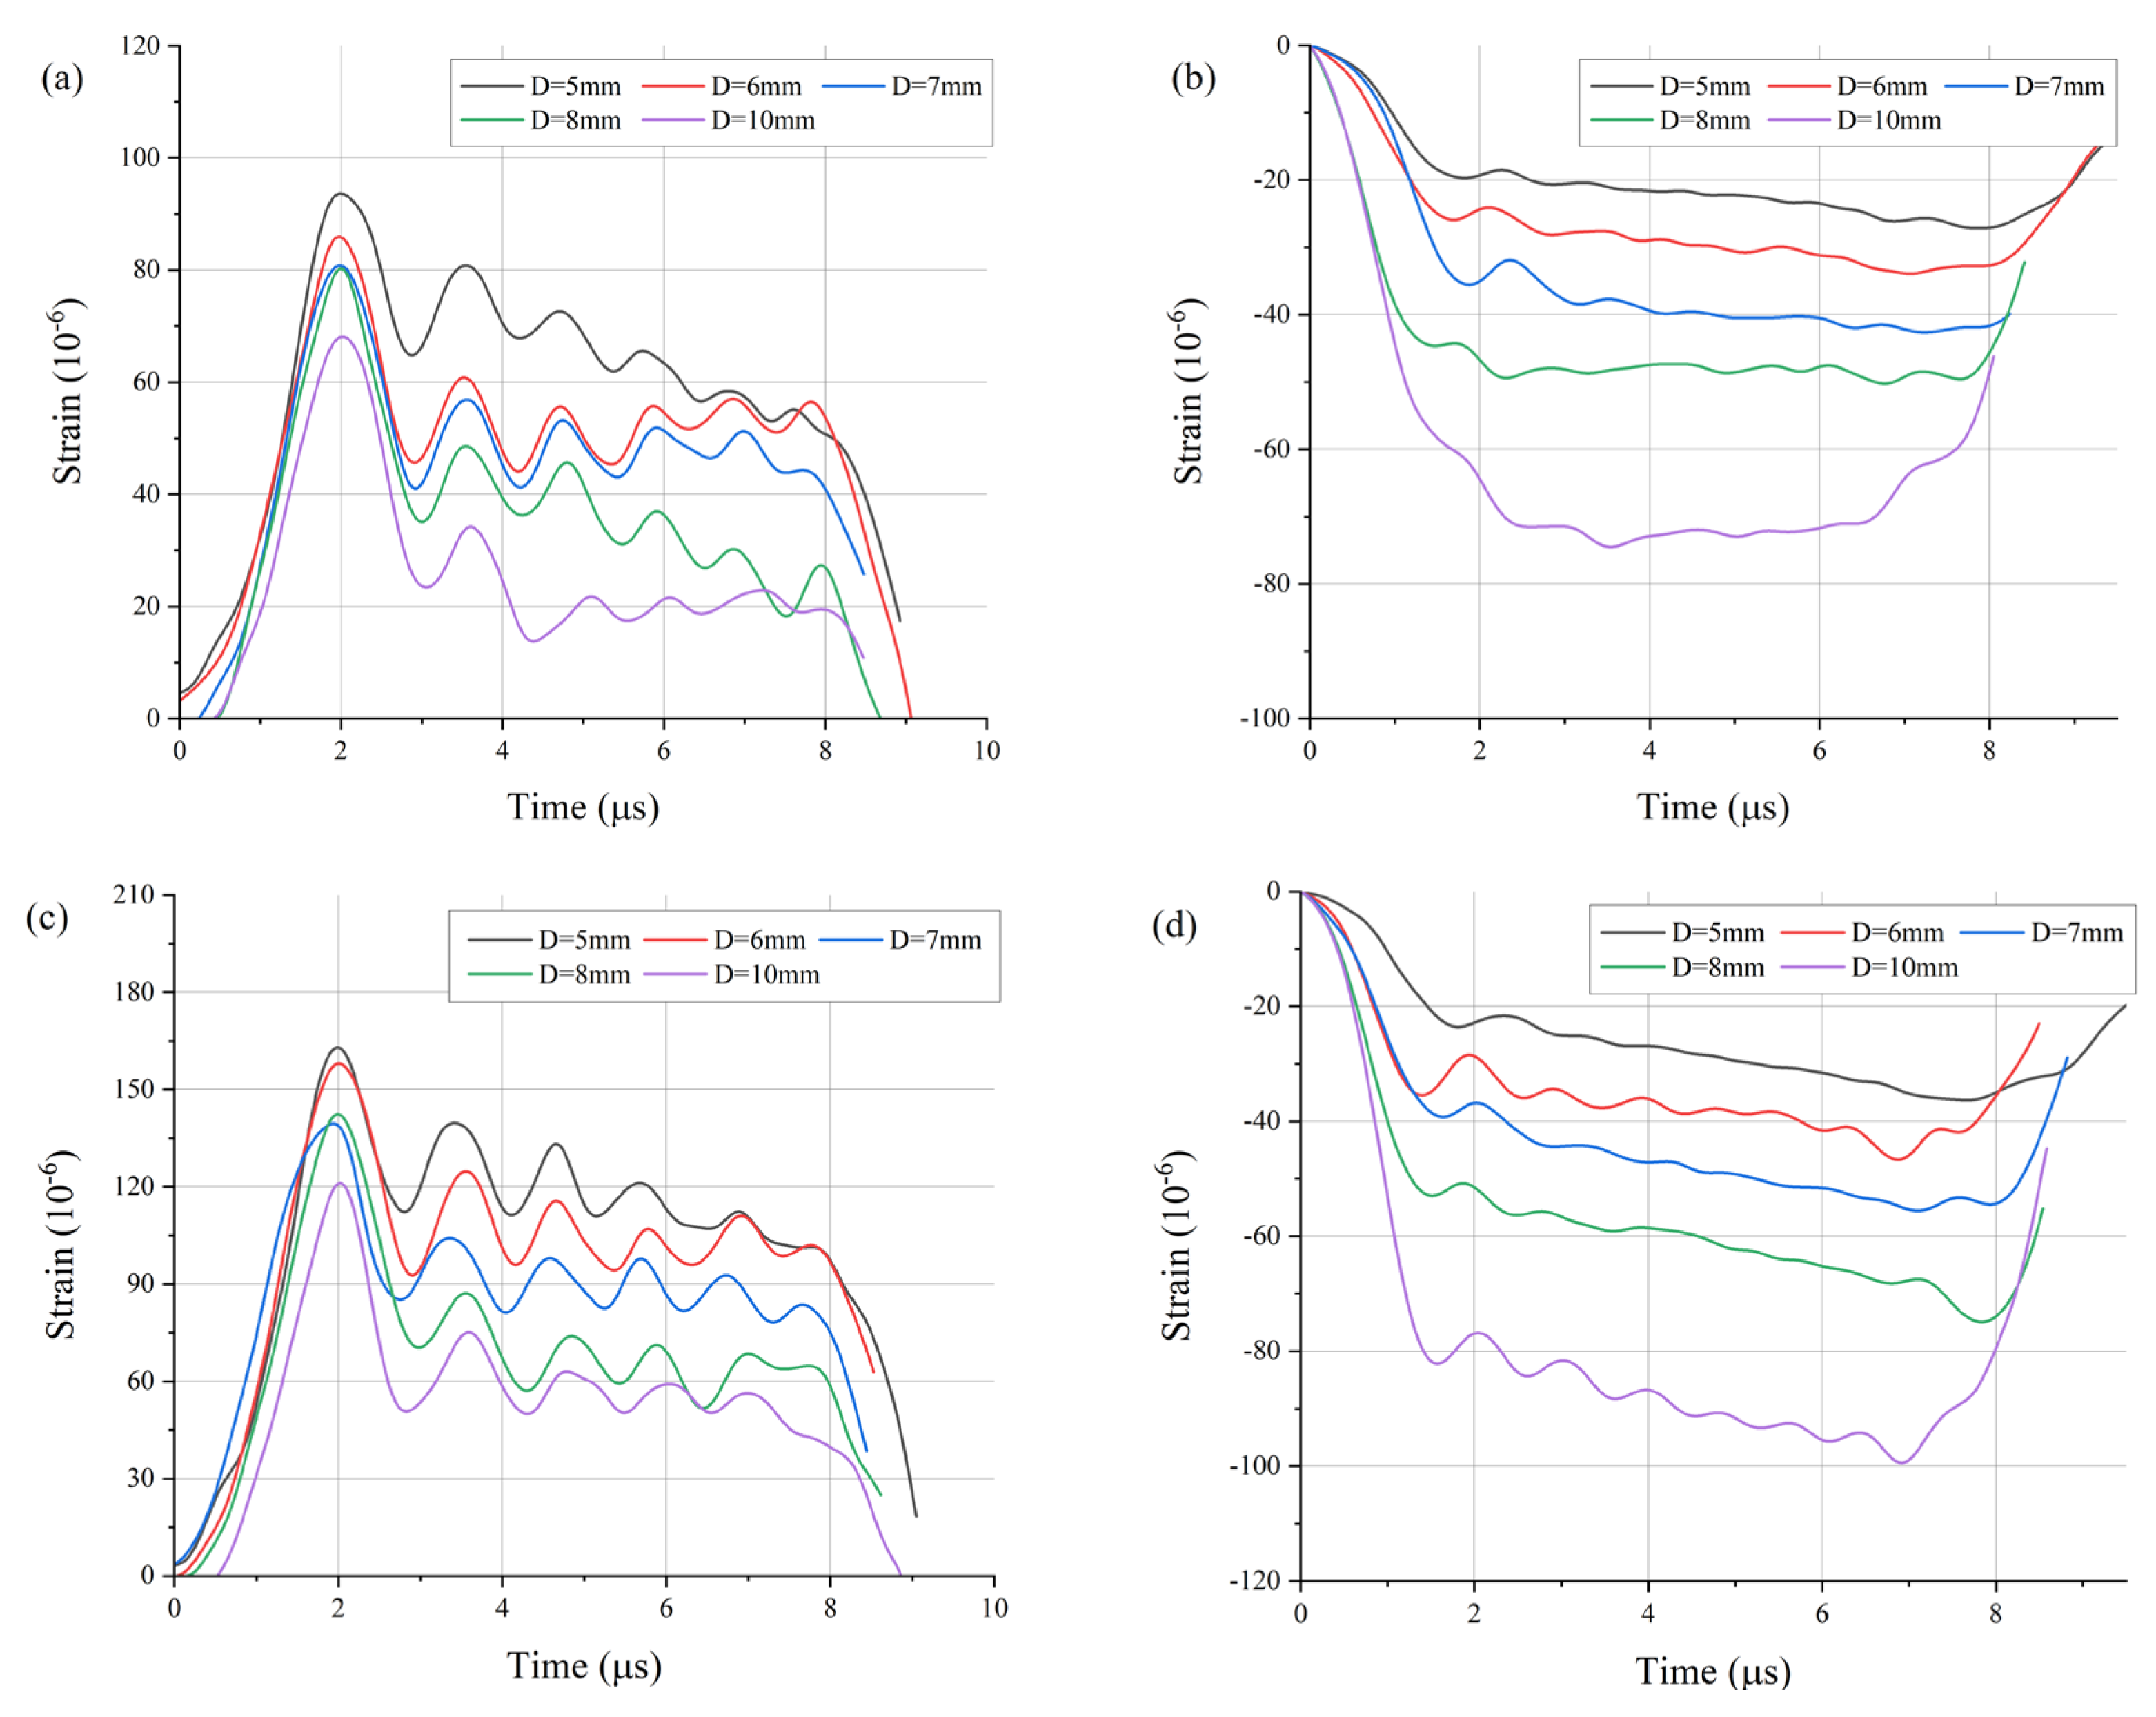
The reflected pulse ( ε R ) and transmitted pulse ( ε T ) measured from strain gauges are used to obtain a strain rate–strain curve and true S-S curve using Equations (1)–(3). To acquire highly reliable material properties, the reproducibility of the obtained strain signals must be verified by conducting repeated tests under the same conditions. In this study, we verified reproducibility by conducting more than 10 tests on each specimen. Figure 6 shows the reflected and transmitted waves measured in each specimen under various diameters and pressure conditions.
The transmitted pulses have fewer oscillations because they are measured through the plastically deformed specimen. Conversely, a significant dispersive phenomenon was observed in the reflected waves. This was significantly affected by the contact area of the specimen as the wave was propagated or reflected inside the incident bar. In some studies, a one-wave analysis method using only the transmitted pulse was adopted. This method is appropriate when the stresses at the front and end of the specimen coincide well during the test. If the consistency of the front and end stress wave is low or if a damaged transmitted pulse is measured, the reliability of material property will be reduced. Therefore, a two-wave analysis method using Equations (1)–(3) was adopted in this study.
The incident pulse is only affected by the striker and incident bars. When tests were conducted under the same pressure conditions, identical incident waves were measured regardless of the specimen. Conversely, the reflected and transmitted pulses were affected by the impedance difference between the specimen and pressure bars. As expressed in Equations (4) and (5), the reflected ratio increases and the transmitted ratio decreases when the area of the specimen decreases for the same incident pulse. Experimental results show that, even under the same pressure conditions, the shape of reflected and transmitted pulses varied depending on the diameter. As the diameter of the specimen decreases, the reflected pulses tend to increase, and the transmitted pulses tend to decrease (Figure 6). Even simply changing the diameter of the specimen has a significant effect on the waveform. However, it does not verify if the material properties of each elastic wave correspond to diameter or if the S-S curves of different strain rate regions are obtained by experimentally influencing it.

3.3. Acquisition of Dynamic Compression Material Properties in an Experiment

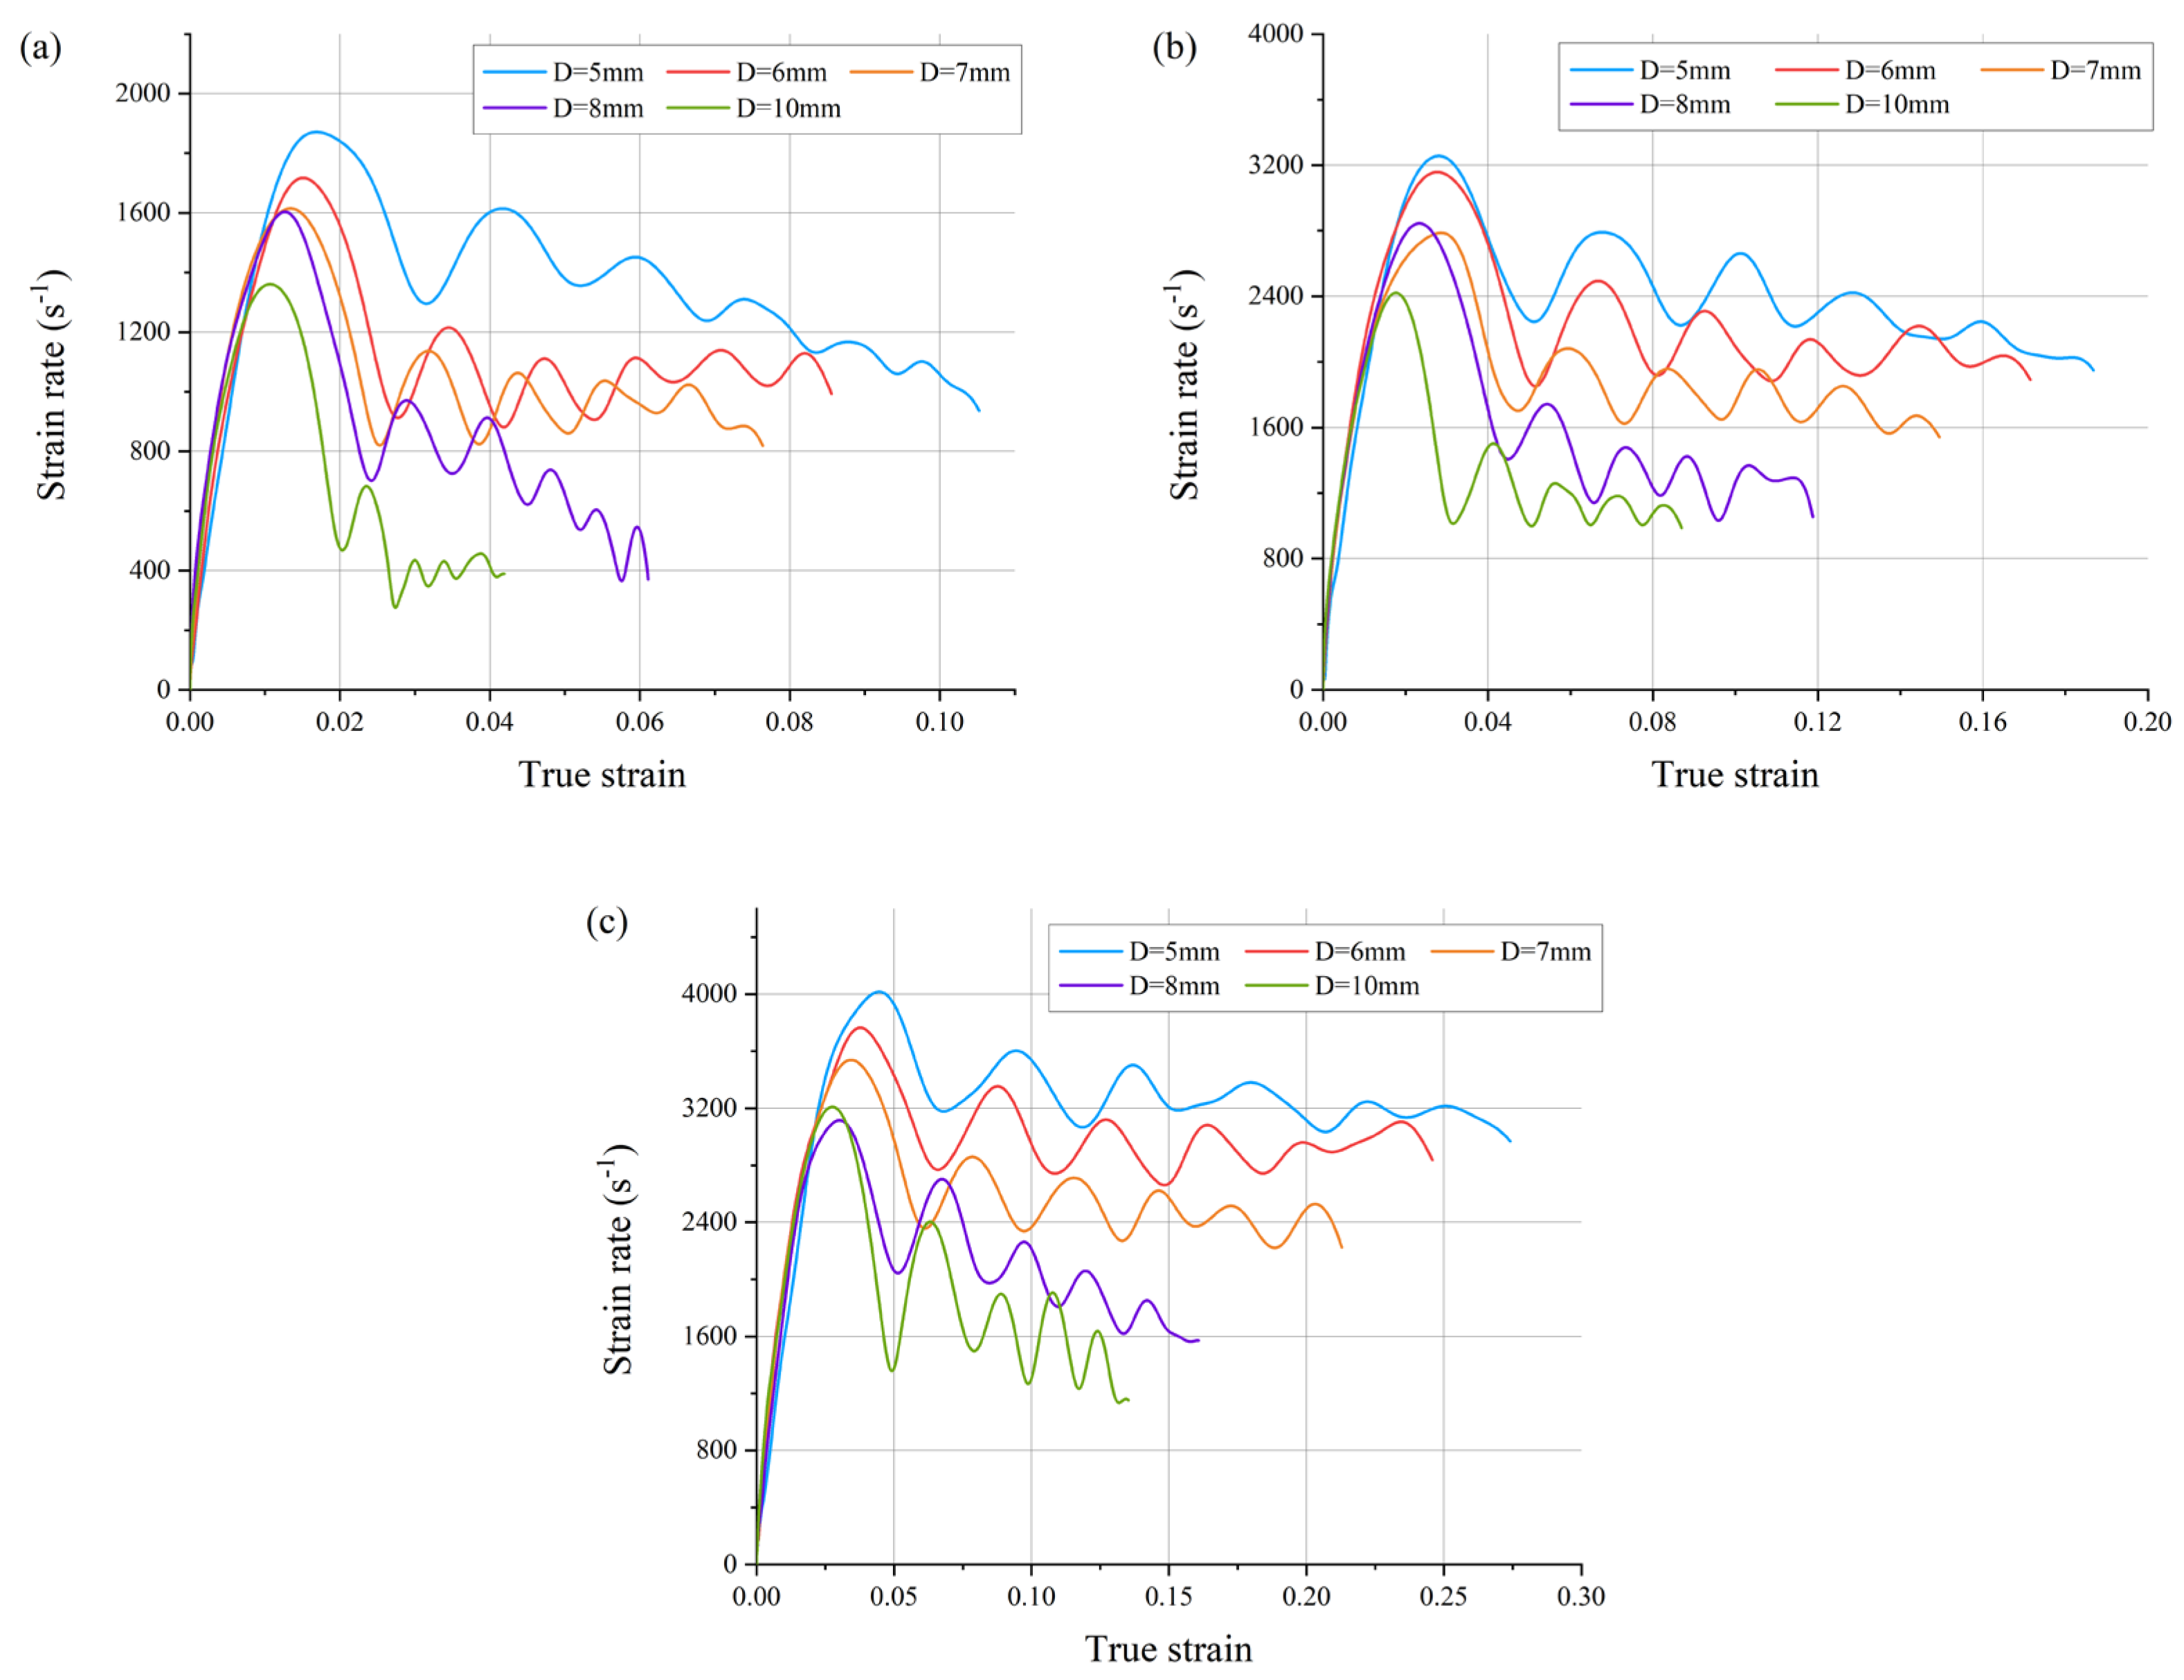
The reflected pulses measured under each pressure condition can be used to calculate true strain and strain rate values using Equations (2) and (3). Figure 7 shows the strain rate-true strain curves obtained from the reflected waves shown in Figure 6. Even when the experiment was conducted under the same conditions, the specimen deformed in a higher-strain-rate region as the diameter decreased. The increase in the reflected ratio as the diameter decreased enabled the acquisition of material properties at higher strain rates. However, when the 10 mm-diameter test was conducted under any condition, a significant deviation was observed after the initial strain rate section. Furthermore, because the secured strain section is narrow, it is difficult to obtain reliable material properties. In contrast, with a smaller diameter, a longer range of strain can be secured, and the deviation can be reduced while increasing the strain rate. Therefore, it would be possible to obtain dynamic compressive properties at a wider range of strain rates by selecting an appropriate diameter of the specimen.
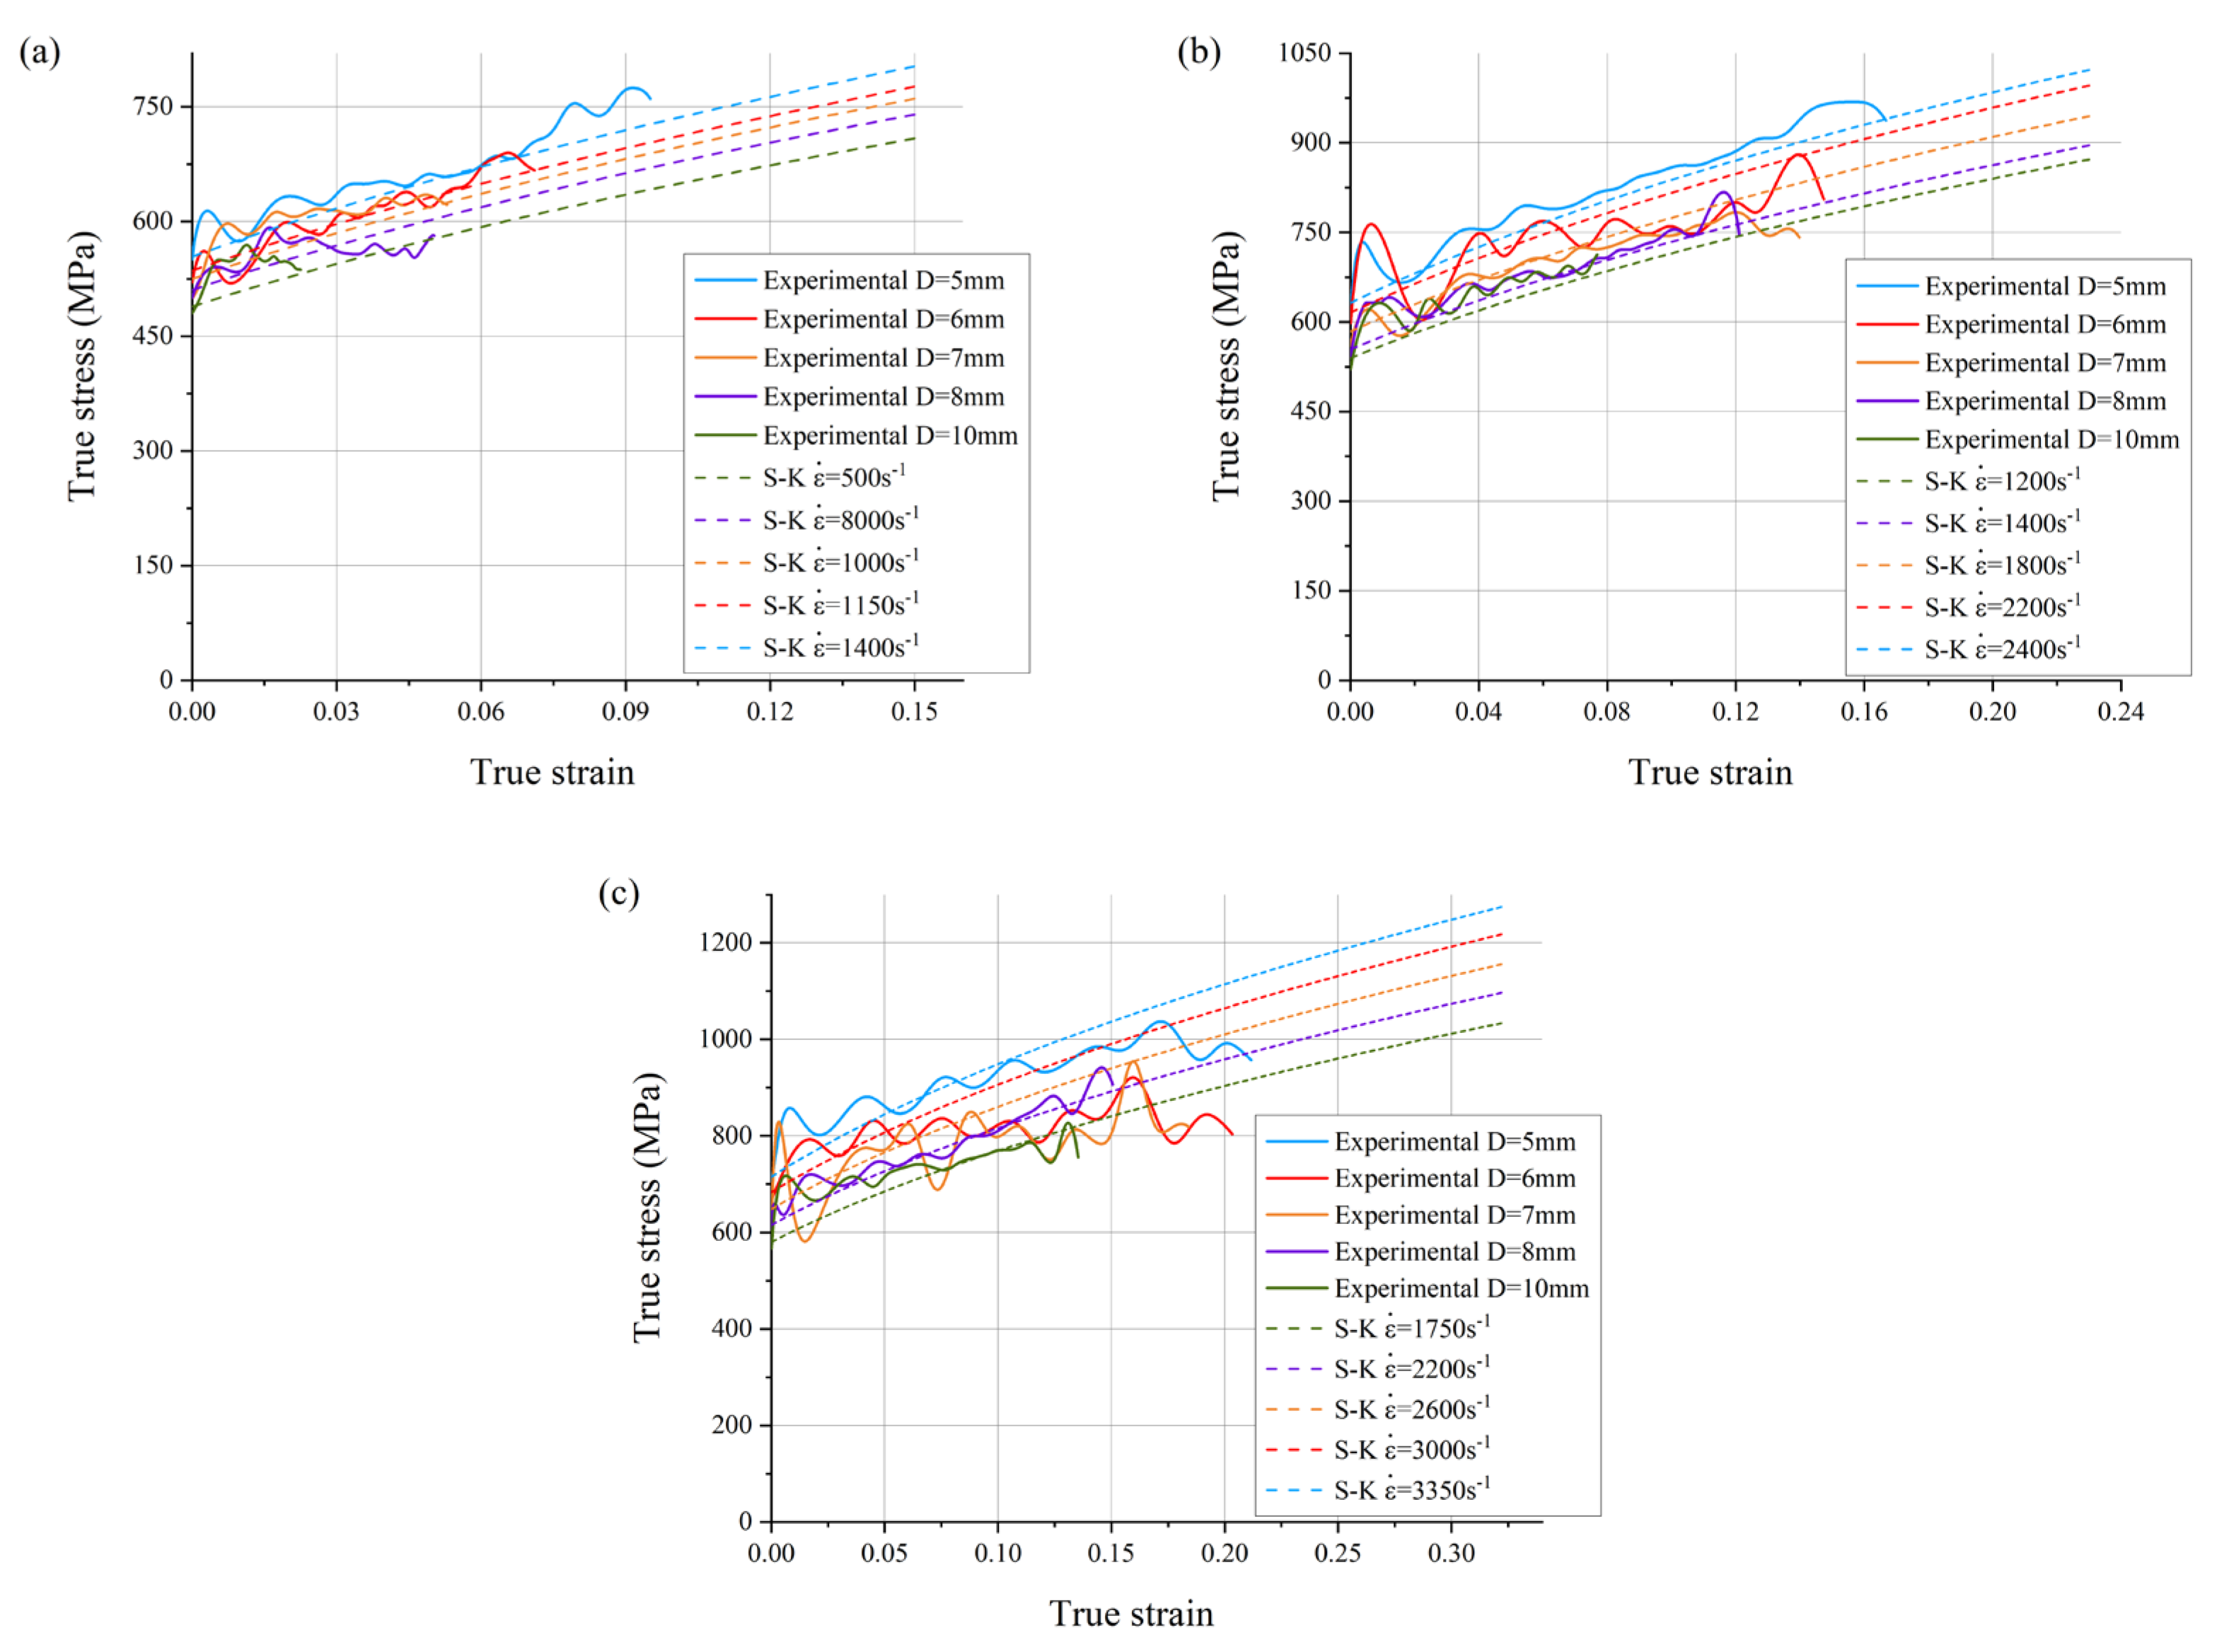
The transmitted pulses measured under each pressure condition can be used to calculate true stress through Equation (1). Figure 8 shows the true stress–true strain curves and the Shin-Kim model obtained from the reflected and transmitted waves in Figure 6. Constitutive equations are mainly used to apply the experimentally obtained S-S curve into an analytical model. Unlike the quasi-static test, the SHPB test must consider the strain rate effect when selecting a constitutive equation. Typically, the Johnson-Cook (J-C) or the Cowper-Symonds (C-S) model is used. However, these models have problems with strain and strain rate hardening terms and fit well in a specific strain-rate region only. Shin proposed the Shin-Kim (S-K) model [30] to address these issues (Equation (10)). The S-K model was well matched in the overall strain-hardening term and was observed to fit well with the SHPB test that acquires dynamic compressive properties in the high-strain region.
σ = A + B 1 exp C ε D ln ε ˙ ε ˙ 0 + exp E ε ˙ ε ˙ 0   ,
σ is the flow stress, ε is the strain, ε ˙ is the strain rate, ε ˙ 0 is the reference strain rate, A is the yield strength, and B and C are strain-hardening constants. The first bracket (i.e., A + B 1 exp C ε   ) corresponds to the Voce hardening law, and the values of A, B and C were selected based on the S-S curve of the quasi-static tensile test of titanium grade 1.   D and E are terms affected by the strain rate, and values of D = 0.014 and E = 0.0000083 were used in this study. These parameter values are listed in Table 5.
As shown in Figure 6, the transmitted pulses decrease as the specimen diameter decreases. In addition, based on Equation (1), specimen stress ( σ S ) should decrease when the transmitted pulse decreases. However, Figure 8 demonstrates that the overall stresses increase as the diameters increase. This is because the cross-sectional area of the specimen ( A S ) acted as a more dominant factor in Equation (1).

4. Numerical Analysis

4.1. Finite Element Model

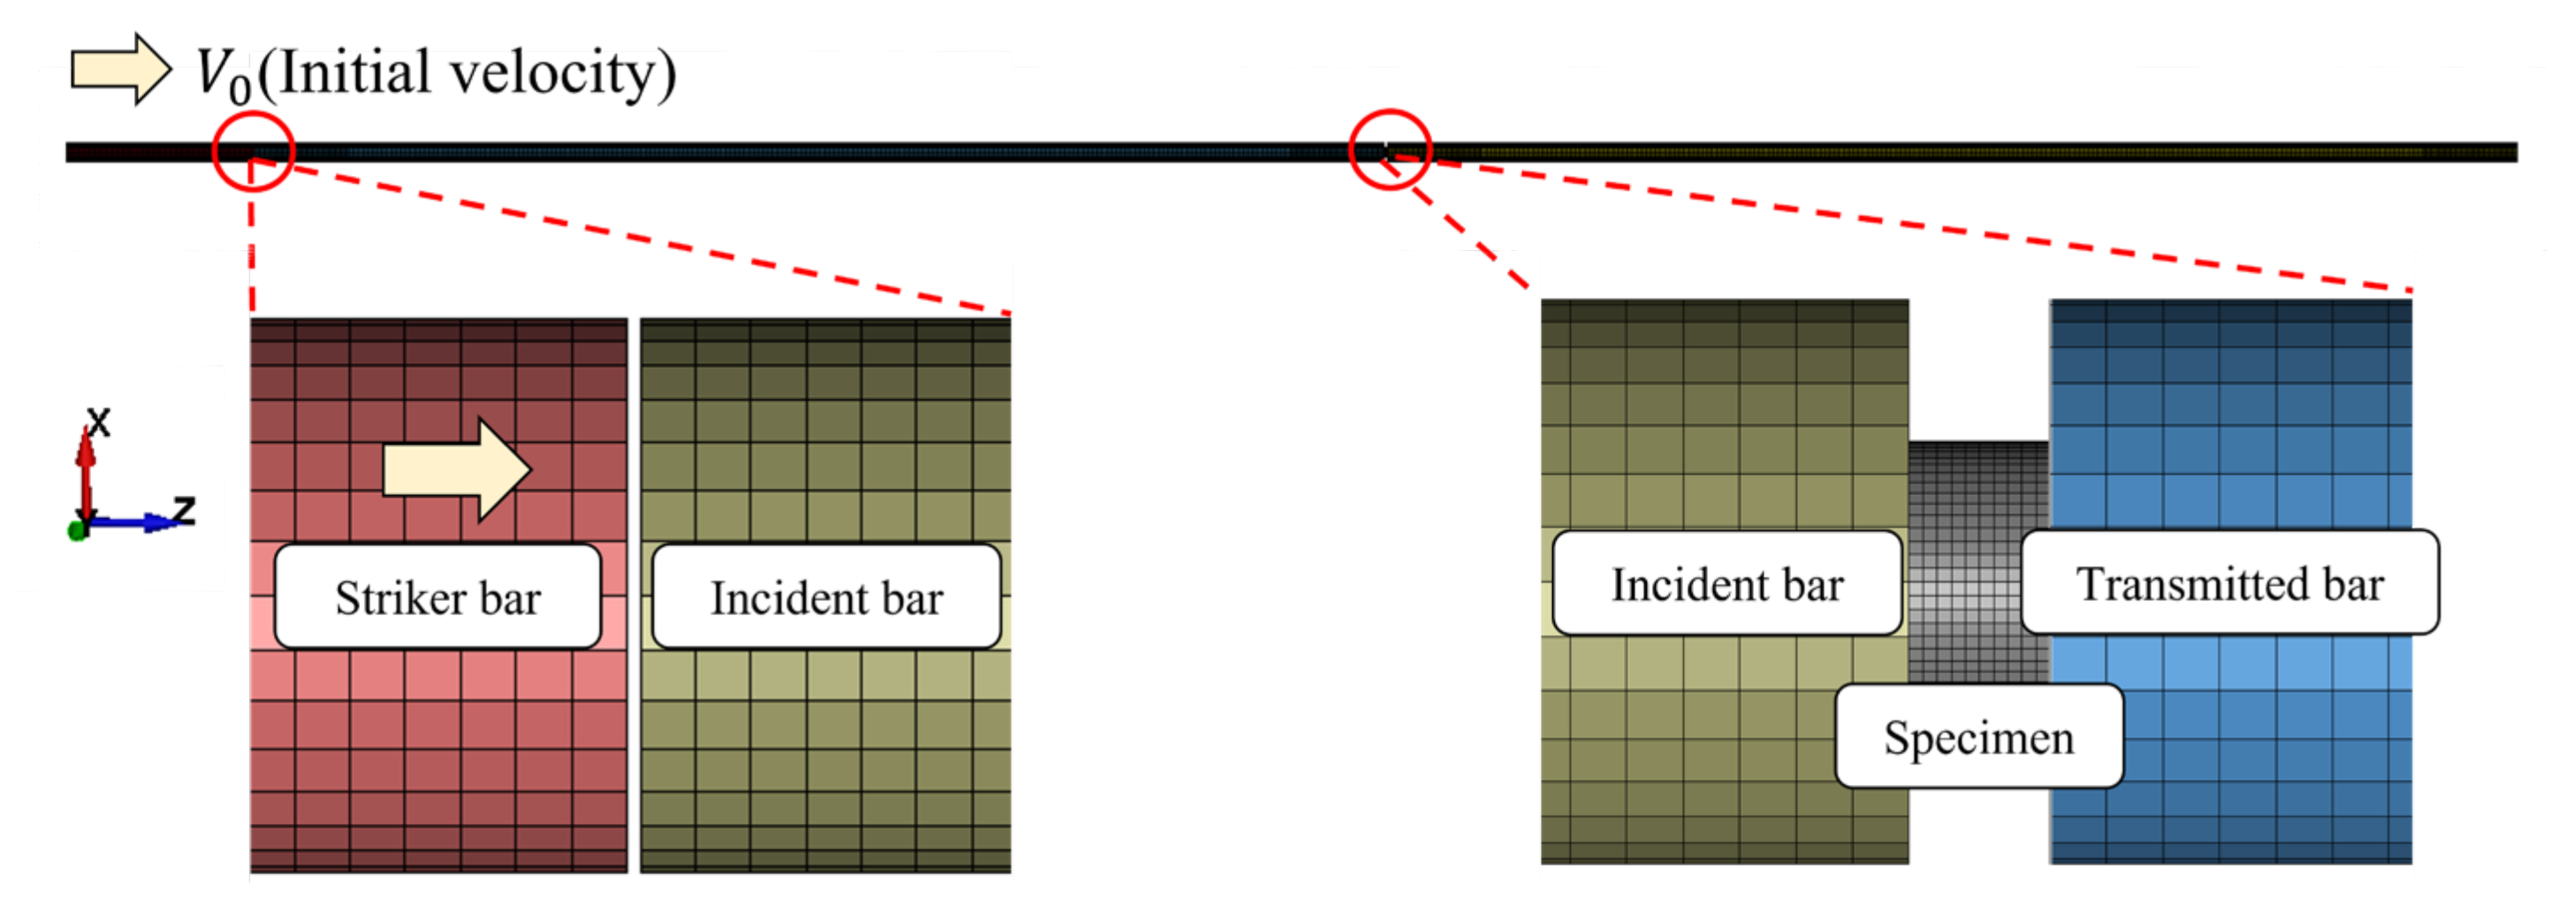
The commercial software LS-DYNA (R12.0, Livermore Software Technology Corporation (LSTC), Livermore, CA, USA) was used to construct finite element models based on the specifications listed in Table 1. The specimens had diameters of 5, 6, 7, 8 and 10 mm with a thickness of 5 mm. The material used for the pressure bars was SNCM439 (Table 2), which was assigned using the MAT001_ELASTIC keyword in LS-DYNA. The S-S curve obtained through the S-K model was applied to the specimen using the keyword MAT024_PIECEWISE_LINEAR_PLASTICITY. In the experiment pressures of 0.5, 1.0 and 1.5 bar were applied to a pneumatic compression launcher. This pressure accelerated the striker bar from zero to the collision speed V 0 . For the analytical model(Figure 9), V 0 was the initial velocity of the striker bar 0.1 mm from the incident bar. According to the empirical data from the experiment, V 0 was set to 11, 17 and 20.5 m/s for 0.5, 1.0 and 1.5 bar, respectively. The friction between the bars and specimen was ignored in this analysis.

4.2. FEM Results

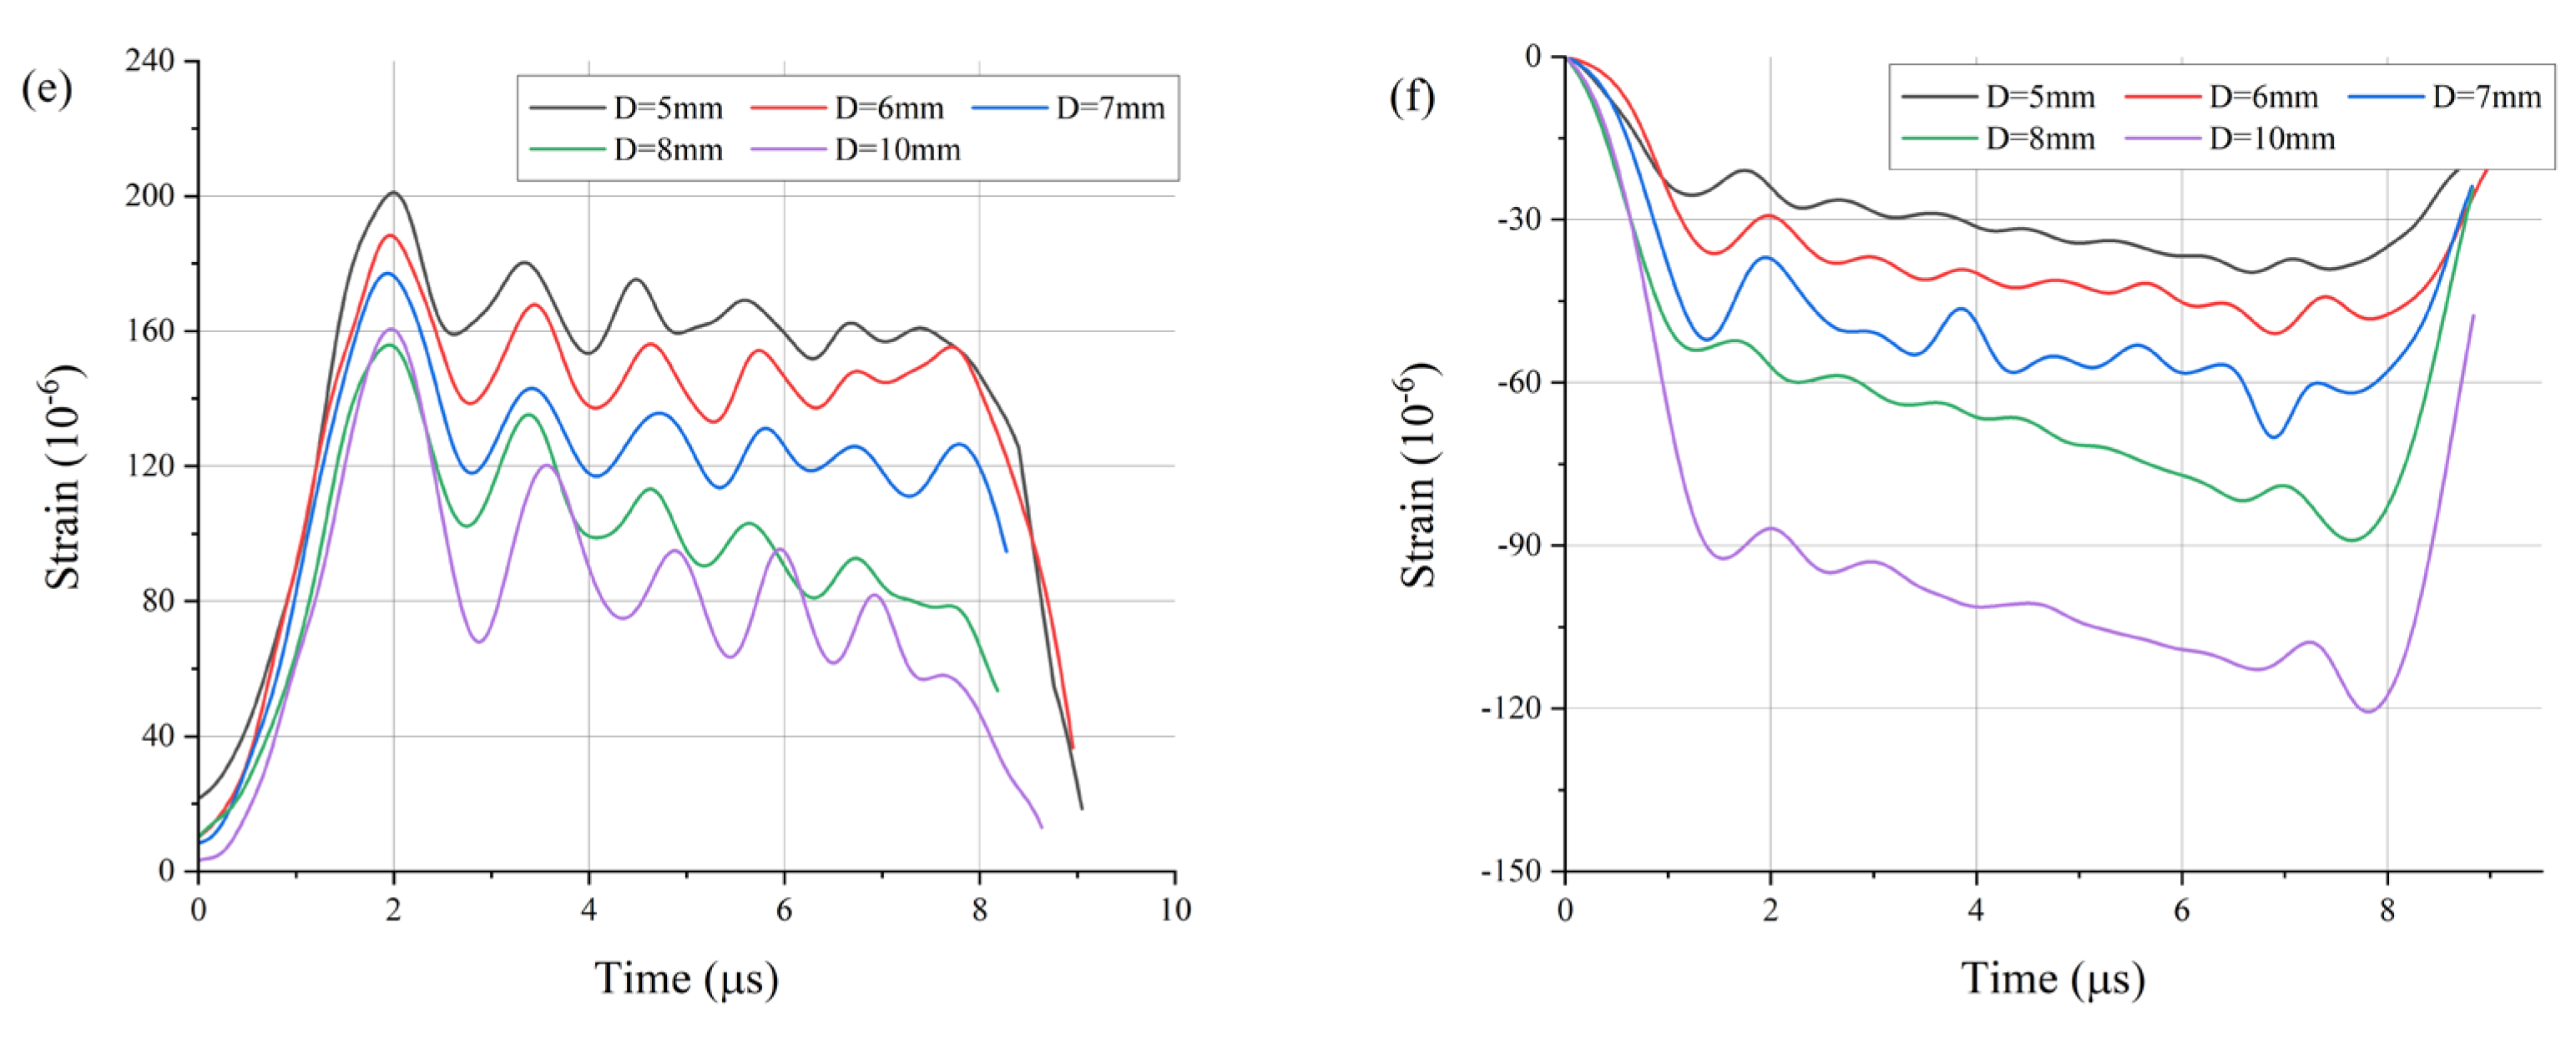
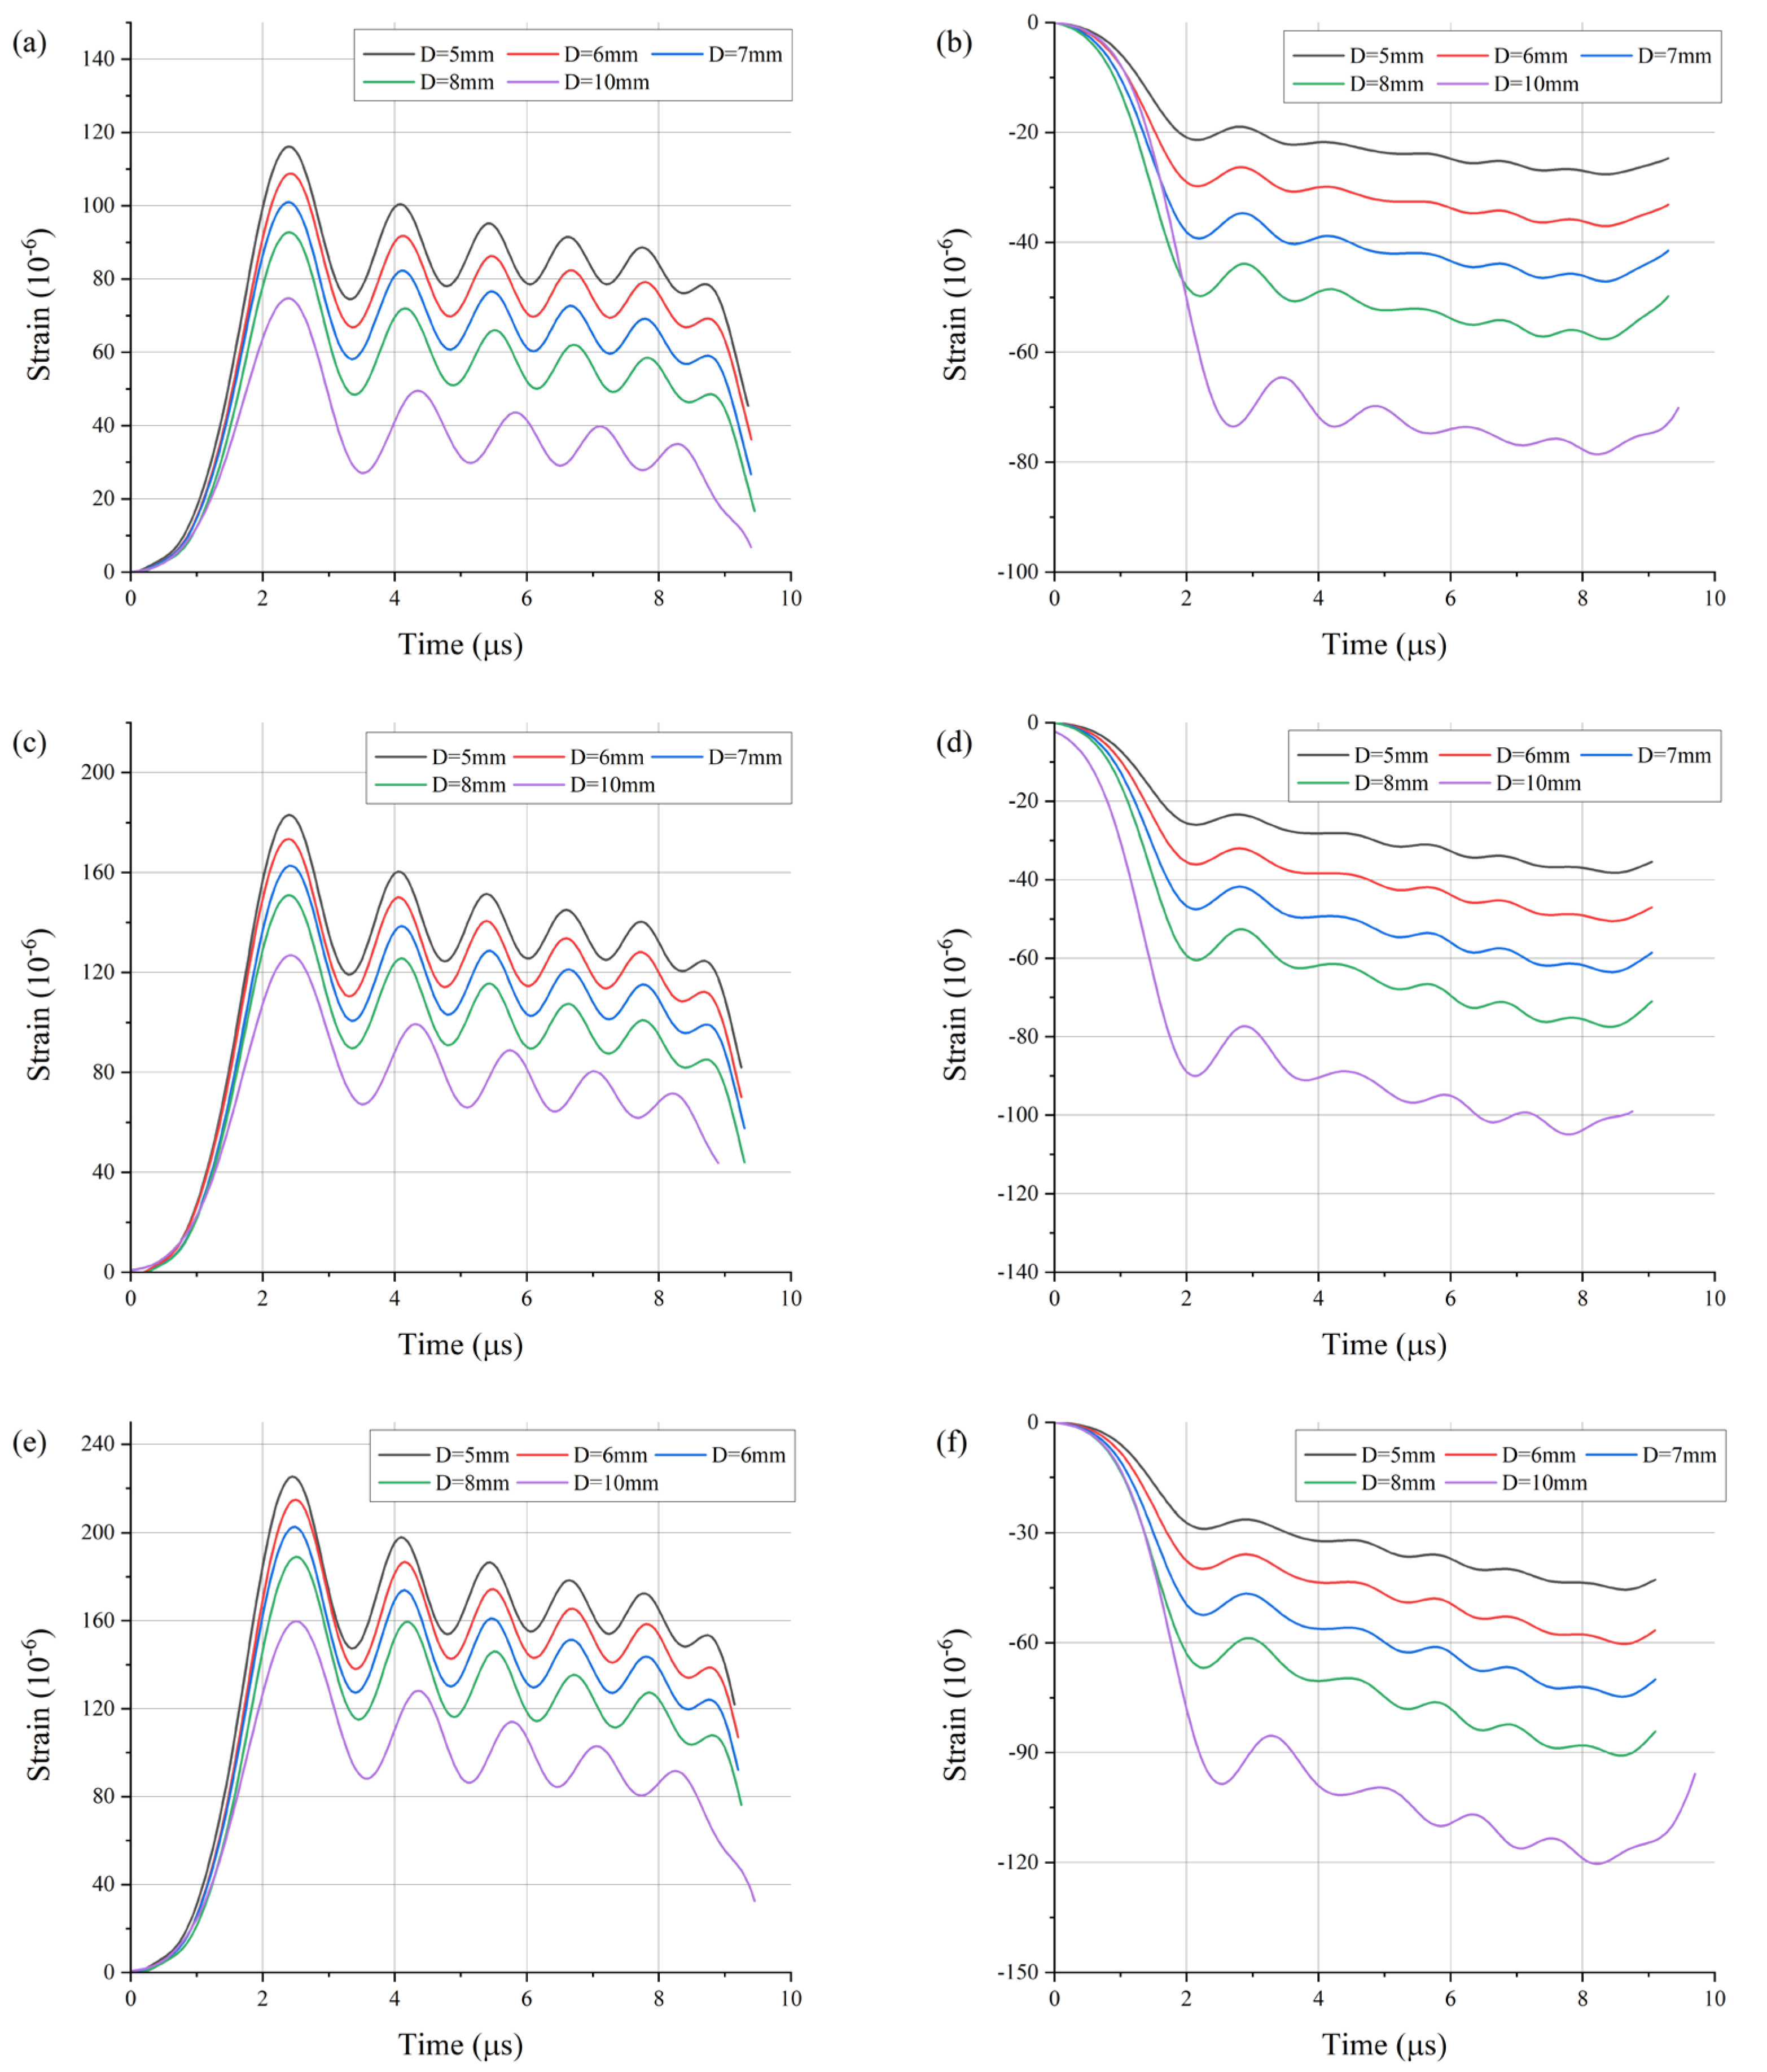
Figure 10 shows reflected and transmitted waves obtained through the FEM. Unlike in the experiment, waves without damage were obtained in the analysis. Numerous variables could occur in the experiment, such as noises, misalignment of the bars and incorrect attachment of strain gauges. The analysis does not have these errors, resulting in a clear waveform.
The shapes of reflected and transmitted pulses were similar to those of the waveforms acquired in the experiment. As with the experimental results, the same tendency was observed, where the reflected ratio increased and the transmitted ratio decreased with decreasing diameter.
For the same thickness, the effect of changing a waveform by varying the diameter can lead to significant expectations depending on the impedance relationship between pressure bars and the specimen. In addition to the cross-sectional area, Young’s modulus and density influence the impedance. To test a steel-based material with a higher Young’s modulus than titanium, a change in the diameter is required as the impedance is also affected by Young’s modulus. When the impedance is increased owing to a high Young’s modulus, and the specimen area remains the same, transmitted pulses may be significantly low to be used in the acquisition of material properties. Therefore, if a test is conducted using the diameters of SHPBs found in each laboratory without considering impedance, it may be difficult to secure valid data.
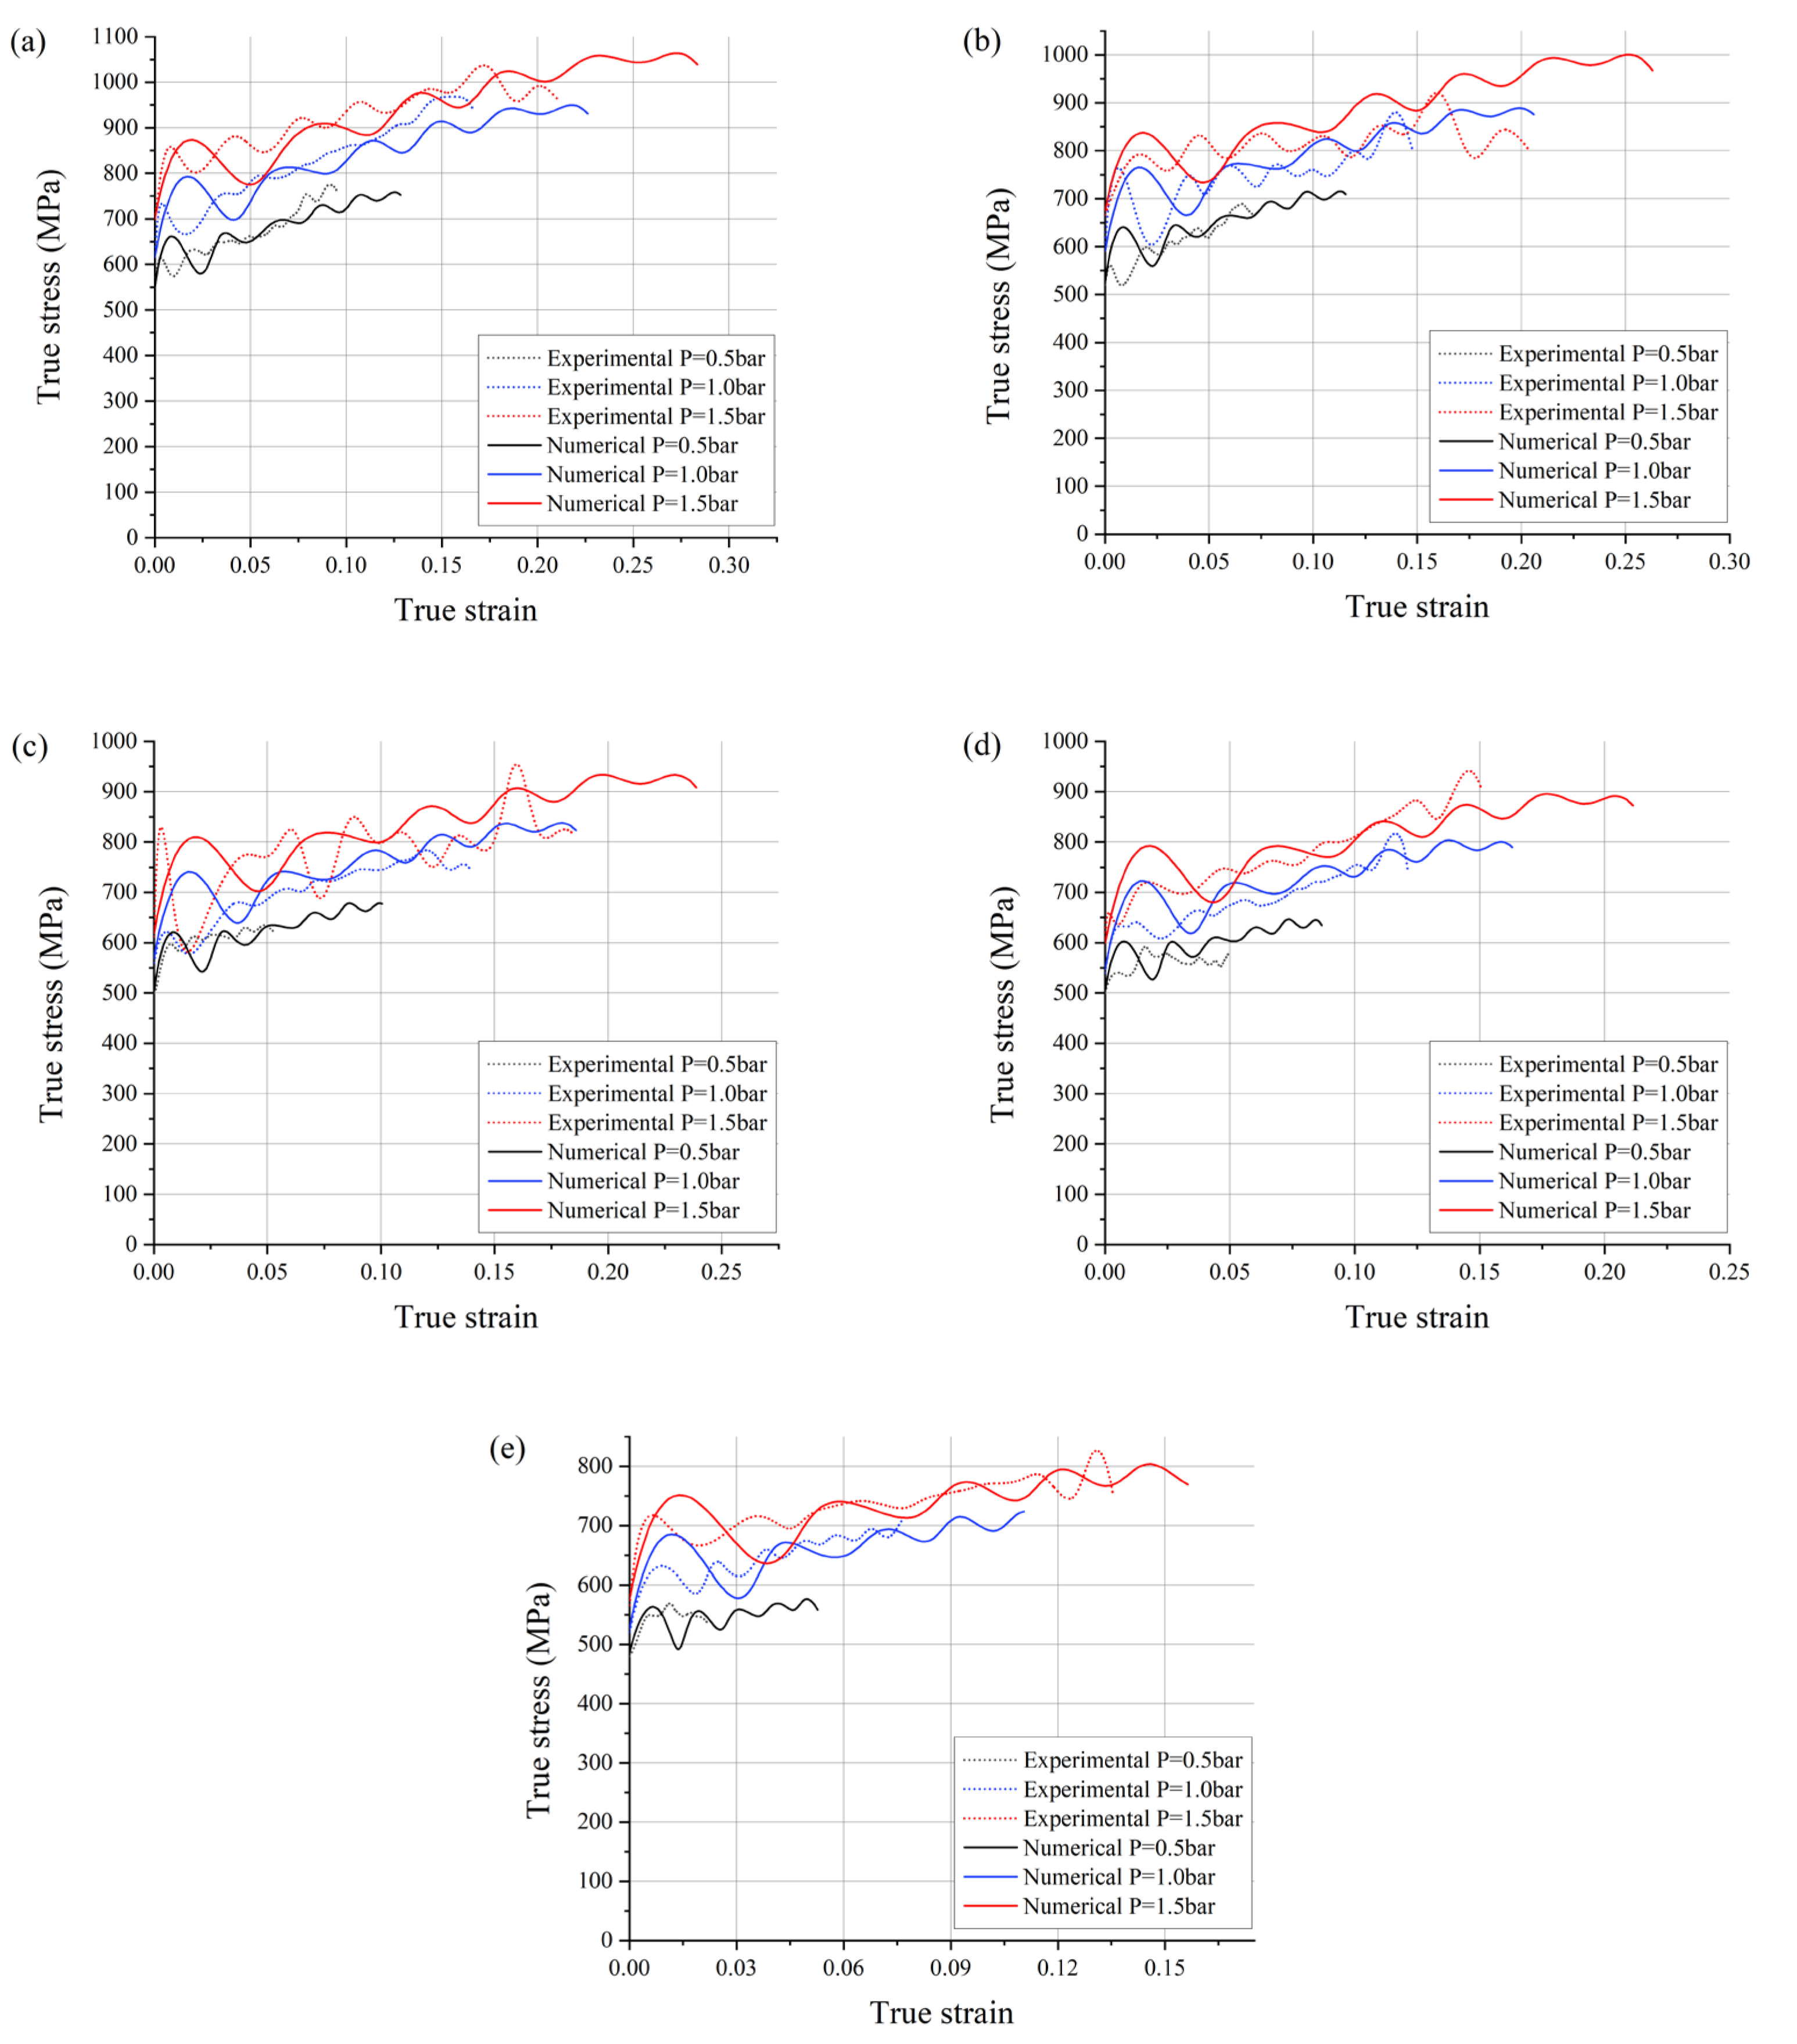
Figure 11 shows a comparison of true stress–true strain curves from the experiment and FEM for each pressure and diameter. The numerical results are in good agreement with the experimental values. Overall, longer strains were obtained from the experiments than from the analysis. It is difficult to obtain a perfect waveform in experiments as many variables can cause errors. Nevertheless, the errors in stress values between the experiment and FEM were low.
For the result of 0.5 bar pressure and 10 mm diameter, the FEM can secure up to 0.05 mm/mm of true strain, but the experiment shows a lower value. Therefore, in the case of the 10 mm-diameter test, obtaining reliable dynamic properties would be difficult, or reproducibility could be poor even if experiments are repeated. The SHPB apparatus used in this study was tested by selecting the initial 10 mm diameter regardless of the material. When a 10 mm diameter was selected for titanium grade 1, it affected the test. Rather, reliable material properties were obtainable as the diameter was decreased. However, this does not imply that titanium grade 1 should not be used on all SHPB apparatuses with a 10 mm diameter. After figuring out the impedance of pressure bars held in each laboratory, the area of the specimen should be decided.

5. Discussion

Previous studies have shown that the diameter and thickness of specimens can affect experimental results. This is because the size of the specimen is related to inertia and friction effects. Consequently, researchers have conducted studies on these factors [34,35,36]. Even at the same strain rate, specimens with a small L/D exhibit higher stress levels than those with a large L/D, primarily due to friction [6]. Friction impedes the specimen from expanding freely and causes the specimen to deform into a barrel-like shape. Because this phenomenon occurs near the surface, a specimen with a small L/D is influenced more. However, it also demonstrates that the error in the S-S curve was negligible when the L/D was approximately 1.0. Rodríguez et al. [37] also showed that an accurate S-S curve is obtainable at an L/D of 0.5 and a diameter of 10–14 mm.
For an ideal SHPB experiment, it is essential to achieve dynamic force equilibrium [38] and maintain a constant strain rate during deformation [39]. Dynamic force equilibrium is achieved as shown in Figure 4. The strain rate is considered constant, except during the initial rise, as small changes in the strain rate of about 10–20 s−1 have no significant effect on the S-S curve. It can be said that friction does not disrupt dynamic force equilibrium or the constancy of the strain rate. However, it could shift the overall stress value up or down.
Meng and Li [6] conducted a numerical study on the relationship between the L/D of the specimen and the inertia effect. They found that specimens with an L/D of 0.3–0.5 provide the best results with frictionless conditions. Ratios higher than this range increase the axial inertia effect, while ratios lower than this range increase both the radial and axial inertia effects. Ren et al. [40] also suggested that the L/D should be between 0.35 and 0.45.
However, there are also conflicting results. Pei et al. [41] numerically investigated the SHPB model without friction and concluded that the L/D of the specimen does not have a significant effect on the stress level of the specimen for the rate-dependent elastic plastic materials. Iwamoto and Yokoyama [42] also confirmed that accurate S-S curves can be obtained for a wide range of L/D ratios, from 0.1 to 2.0, under frictionless conditions without any curve corrections. There are still various conflicting results regarding the relationship between the L/D and the inertia effect.
Therefore, the influences of friction and inertia are considered negligible in this study. Even if they may have caused slight shifts in stress value, the magnitude of this variation is expected to be small, as indicated by previous studies. The results from our experiments revealed no significant difference between the experimental data with friction and the numerical results without friction (Figure 11). This suggests that the effect of friction was minimal. The stress of the specimen decreased as the slenderness ratio decreased (Figure 8). This is because the strain rate was reduced as the specimen diameter decreased. In addition, it shows that the strain rate can be altered by adjusting the specimen diameter, and corresponding S–S curves can be well obtained.

6. Conclusions

Although a test must be performed after an appropriate specimen size is selected for each material to be measured in ASTM standards, specific standards were not set for the SHPB experiment. In this study, the effect of changing only the diameter of the SHPB was investigated without replacing pressure bars in the currently possessed SHPB apparatus. The difference in impedance among pressure bars and specimens affects the acquisition of strain signals. In the SHPB test, the reflected signals increased and the transmitted pulses decreased as the diameter was reduced under the same experimental conditions. In the impedance relationship, it matched the trend of the wave ratio as the area decreased. There was no significant difference between the experimental S-S curves with friction and the numerical S–S curves without friction. Therefore, we concluded that the friction effect is negligible in this study. The results revealed that the area reduction of the specimen under the same conditions made it possible to obtain dynamic compressive properties in a slightly higher strain-rate region, and this was verified by the FEM.
There is a limit to presenting a required diameter for each material. Reflected and transmitted ratio equations can be used to obtain an accurate solution only for the initial stress wave in 1D. In the SHPB test, a specimen was plastically deformed, and an area was changed in real time, such that the ratio continuously changed. Even if a specific area is decided, it might be difficult to acquire a specimen in that shape. However, the effect of diameter on the test was identified through this study. Even if the area changed, the inherent material properties did not change. In addition, it was possible to indirectly determine whether the experiment was possible or not. Therefore, although it is impossible to precisely specify the specimen as in the ASTM standard, we can obtain a recommended area through the apparatus possessed by each laboratory.
Future studies should investigate reflected and transmitted ratios for plastic deformation in 3D.

Author Contributions

Writing—original draft, Y.-B.K., B.P. and J.K.; writing—review and editing, Y.-B.K., B.P. and J.K.; numerical simulations and experiments, Y.-B.K., B.P. and J.K.; supervision, J.K. All authors have read and agreed to the published version of the manuscript.

Funding

This study was supported by the BK21 FOUR (Fostering Outstanding Universities for Research) funded by the Ministry of Education (MOE, Korea), the National Research Foundation of Korea (NRF) grant funded by the Korean government (MSIT) (No. RS-2023-00253461) and the SME Technology Development Support Project grant funded by the Korea Technology & Information Promotion Agency for SMEs (TIPA) through the New Product Development Project(Purchasing Conditions) (No. G21S334512301).

Data Availability Statement

The data presented in this study are available on request to the corresponding author.

Conflicts of Interest

The authors declare no conflict of interest.

References

  1. Khan, A.S.; Suh, Y.S.; Kazmi, R. Quasi-static and dynamic loading responses and constitutive modeling of titanium alloys. Int. J. Plast. 2004, 20, 2233–2248. [Google Scholar] [CrossRef]
  2. Khan, A.S.; Baig, M.; Choi, S.H.; Yang, H.S.; Sun, X. Quasi-static and dynamic responses of advanced high strength steels Experiments and modeling. Int. J. Plast. 2012, 30–31, 1–17. [Google Scholar] [CrossRef]
  3. Huh, H.; Lim, J.H.; Park, S.H. High Speed tensile test of steel sheets for the stress-strain curve at the intermediate strain rate. Int. J. Automot. Technol. 2009, 10, 195–204. [Google Scholar] [CrossRef]
  4. Lu, F.; Lin, Y.; Wang, X.; Lu, L.; Chen, R. A theoretical analysis about the influence of interfacial friction in SHPB tests. Int. J. Impact Eng. 2015, 79, 95–101. [Google Scholar] [CrossRef]
  5. Lifshitz, J.M.; Leber, H. Data processing in the split hopkinson pressure bar tests. Int. J. Impact Eng. 1994, 15, 723–733. [Google Scholar] [CrossRef]
  6. Meng, H.; Li, Q.M. Correlation between the accuracy of a SHPB test and the stress uniformity based on numerical experiments. Int. J. Impact Eng. 2003, 28, 537–555. [Google Scholar] [CrossRef]
  7. Mousawi, M.M.; Reid, S.R.; Deans, W.F. The use of the split Hopkinson pressure bar techniques in high strain rate materials testing. Inst. Mech. Eng. 1997, 211, 273–292. [Google Scholar]
  8. Chen, W.; Song, B. Split Hopkinson (Kolsky) Bar: Design, Testing and Applications; Springer: New York, NY, USA; Heidelberg, Germany, 2011. [Google Scholar]
  9. Nicholas, T. Tensile testing of materials at high rates of strain. Exp. Mech. 1981, 21, 177–185. [Google Scholar] [CrossRef]
  10. Cadoni, E.; Dotta, M.; Forni, D.; Kaufmann, H. Effects of strain rate on mechanical properties in tension of a commercial aluminium alloy used in armour applications. Procedia Struct. Integr. 2016, 2, 986–993. [Google Scholar] [CrossRef]
  11. Xu, W.F.; Huang, X.C.; Hao, Z.M.; Wang, Y.; Xia, Y.M. Effect of the geometric shapes of specimens on impact tensile tests. J. Zhejiang Univ. Sci. A 2010, 11, 817–821. [Google Scholar] [CrossRef]
  12. Naik, N.K.; Perla, Y. Mechanical behavior of acrylic under high strain rate tensile loading. Polym. Test. 2008, 27, 504–512. [Google Scholar] [CrossRef]
  13. Hopkinson, B. A method of measuring the pressure produced in the detonation of high explosives or by the impact of bullets. Philos. Trans. R. Soc. Lond. Ser. A 1914, 213, 437–456. [Google Scholar]
  14. Kolsky, H. An investigation of the mechanical properties of materials at very high rates of loading. Proc. Phys. Soc. Lond. Sect. B 1949, 62, 676–700. [Google Scholar] [CrossRef]
  15. He, A.; Xi, G.; Zhang, H.; Wang, X. A comparative study on Johnson-Cook, modified Johnson-Cook and Arrhenius-type constitutive models to predict the high temperature flow stress in 20CrMo alloy steel. Mater. Des. 2013, 52, 677–685. [Google Scholar] [CrossRef]
  16. Berkovic, L.; Chabotier, A.; Coghe, F.; Rabet, L. Constitutive equations of a ballistic steel alloy as a function of temperature. EPJ Web Conf. 2012, 26, 04017. [Google Scholar] [CrossRef]
  17. Dehgahi, S.; Pirgazi, H.; Sanjari, M.; Seraj, P.; Odeshi, A.; Kestens, L.A.I.; Mohammadi, M. Effect of building direction on high strain-rate compressive behavior of heat-treated LPBF-maraging steels using Split Hopkinson pressure bar apparatus. Mater. Sci. Eng. 2022, 835, 142653. [Google Scholar] [CrossRef]
  18. Li, H.; Li, F.; Zhang, R.; Zhi, X. High strain rate experiments and constitutive model for Q390D steel. J. Constr. Steel Res. 2023, 206, 107933. [Google Scholar] [CrossRef]
  19. Li, M.; Hao, H.; Cui, J.; Hao, Y. Numerical investigation of the failure mechanism of cubic concrete specimens in SHPB tests. Def. Technol. 2022, 18, 1–11. [Google Scholar] [CrossRef]
  20. Shubham; Yerramalli, C.S.; Sumant, C.; Prusty, R.K.; Ray, B.C. Finite element modelling and experimentation of plain weave glass/epoxy composites under high strain-rate compression loading for estimation of Johnson-Cook model parameters. Int. J. Impact Eng. 2022, 167, 104262. [Google Scholar] [CrossRef]
  21. Li, X.; Kim, J.; Roy, A.; Ayvar-Soberanis, S. High temperature and strain-rate response of AA2124-SiC metal matrix composites. Mater. Sci. Eng. A 2022, 856, 144014. [Google Scholar] [CrossRef]
  22. Li, P.; Yuan, K.; Guo, W.; Wang, R.; Chen, L.; Gao, M.; Du, P. Dynamic compressive behavior of a single crystal nickel-base superalloy at ultra-high temperature: Mechanism investigation with a modified electric synchronous SHPB technique. J. Mater. Res. Technol. 2022, 18, 637–657. [Google Scholar] [CrossRef]
  23. Li, X.; Wei, Z.; Wang, X.; Yang, L.; Hao, X.; Wang, M.; Guo, M.; Guo, J. Effect of cryogenic temperatures on the mechanical behavior and deformation mechanism of AISI 316H stainless steel. J. Mater. Res. Technol. 2023, 22, 3375–3386. [Google Scholar] [CrossRef]
  24. Gu, X.; Zhang, Q.; Huang, D.; Yv, Y. Wave dispersion analysis and simulation method for concrete SHPB test in peridynamics. Eng. Fract. Mech. 2016, 160, 124–137. [Google Scholar] [CrossRef]
  25. Cheng, Y.; Huang, J.; Ou, X.; Meng, L.; Yao, X. Dynamic mechanical properties and failure mechanism of magnesium aluminum spinel based on experiments and peridynamic simulations. J. Eur. Ceram. Soc. 2023, 43, 7581–7598. [Google Scholar] [CrossRef]
  26. Kariem, M.A.; Santiago, R.C.; Govender, R.; Shu, D.W.; Ruan, D.; Nurick, G.; Alves, M.; Lu, G.; Langdon, G.S. Round-Robin test of split Hopkinson pressure bar. Int. J. Impact Eng. 2019, 126, 62–75. [Google Scholar] [CrossRef]
  27. Kariem, M.A.; Ruan, D.; Beynon, J.H.; Prabowo, D.A. Mini Round-Robin Test on the Split Hopkinson Pressure Bar. J. Test Eval. 2018, 46, 457–468. [Google Scholar] [CrossRef]
  28. Pankow, M.; Attard, C.; Waas, A.M. Specimen size and shape effect in split Hopkinson pressure bar testing. J. Strain Anal. Eng. Des. 2009, 44, 689–698. [Google Scholar] [CrossRef]
  29. Wang, Q.Z.; Zhang, S.; Xie, H.P. Rock Dynamic Fracture Toughness Tested with Holed-Cracked Flattened Brazilian Discs Diametrically Impacted by SHPB and its Size Effect. Exp. Mech. 2010, 50, 877–885. [Google Scholar] [CrossRef]
  30. Shin, H.H.; Kim, J.B. A Phenomenological Constitutive Equation to Describe Various Flow Stress Behaviors of Materials in Wide Strain Rate and Temperature Regimes. Am. Soc. Mech. Eng. 2010, 132, 021009. [Google Scholar] [CrossRef]
  31. An, W.J.; Woo, M.A.; Noh, H.K.; Kang, B.S.; Kim, J. Design and Fabrication of Split Hopkinson Pressure Bar for Acquisition of Dynamic Material Property of Al6061-T6. J. Korean Soc. Precis. Eng. 2015, 33, 587–594. [Google Scholar] [CrossRef]
  32. Frew, D.J.; Forrestal, M.J.; Chen, W. Pulse Shaping Techniques for Testing Elastic-plastic Materials with a Split Hopkinson Pressure Bar. Exp. Mech. 2005, 45, 186–195. [Google Scholar] [CrossRef]
  33. Chen, W.; Lu, F.; Frew, D.J.; Forrestal, M.J. Dynamic Compression Testing of Soft Materials. J. Appl. Mech. 2002, 69, 214–223. [Google Scholar] [CrossRef]
  34. Othman, R. The Kolsky-Hopkinson Bar Machine: Selected Topics; Springer International Publishing: Berlin/Heidelberg, Germany, 2018. [Google Scholar]
  35. Gorham, D.A. Specimen inertia in high strain-rate compression. J. Phys. Appl. Phys. 1989, 22, 1888–1893. [Google Scholar] [CrossRef]
  36. Hockly, M.; Siviour, C.R. Specimen Inertia in high strain rate tensile testing. EPJ Web Conf. 2015, 94, 01050. [Google Scholar] [CrossRef]
  37. Rodríguez, J.; Cortés, R.; Martínez, M.A.; Sánchez-Gálvez, V.; Navarro, C. Numerical study of the specimen size effect in the split Hopkinson pressure bar tests. J. Mater. Sci. 1995, 30, 4720–4725. [Google Scholar] [CrossRef]
  38. Sharpe, W.N.; Hoge, K.G. Specimen strain measurement in the split-Hopkinson-pressure-bar experiment. Exp. Mech. 1972, 12, 570–574. [Google Scholar] [CrossRef]
  39. Davies, E.D.H.; Hunter, S.C. The dynamic compression testing of solids by the method of the split Hopkinson pressure bar. J. Mech. Phys. Solids 1963, 11, 155–179. [Google Scholar] [CrossRef]
  40. Ren, L.; Yu, X.; He, Y.; Wang, K.; Yao, H. Numerical investigation of lateral inertia effect in dynamic impact testing of UHPC using a Split-Hopkinson pressure bar. Constr. Build. Mater. 2020, 246, 118483. [Google Scholar] [CrossRef]
  41. Pei, P.; Pei, Z.; Tang, Z. Numerical and Theoretical Analysis of the Inertia Effects and Interfacial Friction in SHPB Test Systems. Materials 2020, 13, 4809. [Google Scholar] [CrossRef]
  42. Iwamoto, T.; Yokoyama, T. Effects of radial inertia and end friction in specimen geometry in split Hopkinson pressure bar tests: A computational study. Mech. Mater. 2012, 51, 97–109. [Google Scholar] [CrossRef]
Figure 1. Schematic of the split Hopkinson pressure bar apparatus.
Metals 13 01941 g001
Figure 2. Reflection and transmission of the stress wave through two different cylindrical mediums.
Metals 13 01941 g002
Figure 3. Titanium grade 1 cylindrical specimens with different diameters (5, 6, 7, 8 and 10 mm).
Metals 13 01941 g003
Figure 4. Stress equilibrium check for different diameters and pressures; (a) P = 0.5 bar and D = 0.5 mm, (b) P = 1.0 bar and D = 0.5 mm and (c) P = 1.5 bar and D = 0.5 mm.
Metals 13 01941 g004
Figure 5. Stress on transmission face ( σ T ), smoothed stress on incident face ( σ I + σ R ) and equilibrium factor R t .
Metals 13 01941 g005
Figure 6. Experimental strain for different diameters and pressure; reflected pulses at (a) 0.5, (b) 1.0 and (c) 1.5 bar; and transmitted pulses at (d) 0.5, (e) 1.0 and (f) 1.5 bar.
Metals 13 01941 g006aMetals 13 01941 g006b
Figure 7. Experimental strain rate–true strain curves for different diameters and pressures; (a) 0.5, (b) 1.0 and (c) 1.5 bar.
Metals 13 01941 g007
Figure 8. Comparison of the true stress–true strain curves between experimental values and the S-K model; (a) 0.5, (b) 1.0 and (c) 1.5 bar.
Metals 13 01941 g008
Figure 9. Finite element model of the SHPB test in LS-DYNA.
Metals 13 01941 g009
Figure 10. Numerical strains under different diameters and pressures; reflected pulses at (a) 0.5, (b) 1.0 and (c) 1.5 bar; and transmitted pulses at (d) 0.5, (e) 1.0 and (f) 1.5 bar.
Metals 13 01941 g010
Figure 11. Comparison of the true stress–true strain curves between the experiment and FEM; (a) 5, (b) 6, (c) 7, (d) 8 and (e) 10 mm.
Metals 13 01941 g011
Table 1. Dimensions of the SHPB pressure bars.
Length (mm)Diameter (mm)
Striker bar20020
Incident bar120020
Transmitted bar120020
Table 2. Material properties of SNCM439.
SNCM439
Density7850 kg/m3
Young’s modulus196 GPa
Poisson’s ratio0.3
Yield strength1550 MPa
Table 3. Diameters, thicknesses and slenderness ratios of the specimens.
SpecimenDiameter (mm)Thickness (mm)Slenderness Ratio
Case 1551.0
Case 2650.83
Case 3750.71
Case 4850.63
Case 51050.5
Table 4. Diameters, thicknesses and slenderness ratios of the specimens; (a) P = 0.5, (b) P = 1.0 and (c) P = 1.5 bar.
(a) P = 0.5
Diameter (mm)567810
F e q ( a v e )  (%)±12.0±1.3±0.95±0.98±4.5
(b) P = 1.0
Diameter (mm)567810
F e q ( a v e )  (%)±12.2±0.5±26.8±9.6±6.5
(c) P = 1.5
Diameter (mm)567810
F e q ( a v e )  (%)±6.0±2.4±16.8±4.4±0.29
Table 5. S-K model parameters for titanium grade 1.
A (MPa)B (MPa)CDE
410.157941.60.0140.0000083
Disclaimer/Publisher’s Note: The statements, opinions and data contained in all publications are solely those of the individual author(s) and contributor(s) and not of MDPI and/or the editor(s). MDPI and/or the editor(s) disclaim responsibility for any injury to people or property resulting from any ideas, methods, instructions or products referred to in the content.