Article

Mechanical Properties of Microporous Copper Powder Compacts Produced by Oxide Reduction

School of Engineering, Liberty University, 1971 University Blvd., Lynchburg, VA 24515, USA
*
Author to whom correspondence should be addressed.
Metals 2023, 13(12), 1942; https://doi.org/10.3390/met13121942
Submission received: 1 November 2023 / Revised: 21 November 2023 / Accepted: 24 November 2023 / Published: 27 November 2023
(This article belongs to the Section Powder Metallurgy)

Abstract

:
Powder metallurgy (PM) processes for porous copper and alloys have seen some commercial successes, but PM methods have the disadvantage of relatively low porosity or strength that is compromised by stress-concentrating interparticle bonds. To increase porosity without compromising scalability, a Cu-CuO metal matrix composite powder was utilized to produce additional microscale porosity within the particles by oxide reduction. These Cu-CuO powders were pressed at 1, 2, or 3 GPa, and made porous at 600, 800, or 1000 °C to investigate the effects of pressing and sintering parameters on the overall strength and density. It was found that the formation of porosity is weakly dependent on compaction pressure (maximum 6% difference from 1 GPa to 3 GPa), while the final porosity varied by ~16% overall (~40% for 1 GPa and 600 °C to 24% for 3 GPa and 1000 °C). The strength of the porous Cu was highest after being reduced at 600 °C but also exhibited some flaking at the edges at high strain. The 1 GPa, 600 °C samples have a higher specific strength than wrought Cu annealed at the same temperature, as was demonstrated under uniaxial quasi-static compression as well as split Hopkinson pressure bar impact.

1. Introduction

Porous metals (or metal “foams”) have various applications owing to their various properties, such as electrical/thermal conductivity, good strength, and good ductility, with reduced effective density [1]. Liquid-state processes are the most common, especially for producing porous aluminum [2], but many solid-state processes are available [3]. Porous Cu can be produced through diverse means, including liquid-state gas-eutectic processing [4], electrodeposition [5], powder metallurgy (often as an alloy, such as in SELFOIL® bushings), investment casting (Duocel® foams), and 3D printing [6].
The use of powder metallurgy (PM) to create porous metals is quite simple, as residual porosity is often difficult to eliminate. By intentionally choosing process parameters to increase the residual porosity, porous components can be designed. The total porosity by simple compaction, or even with loose powder sintering [7], is relatively low, so other techniques are often combined with the PM process, such as space holder additions. For instance, carbonate [8], PMMA [9,10], NaCl [11], or other inert particles are compressed along with the Cu powder and later removed by dissolution or vaporization to create macroscale porosity, which allows for much higher porosity to be achieved.
The optimal pore volume and size depend on the application. Very high porosity, especially through space holder or scaffolding methods, tends to produce relatively large pores (millimeter scale) that allow for rapid fluid transport but suffers from low strength. Lower porosity techniques, such as the SELFOIL® bushings need to be stronger to withstand wear and loading more effectively. Some techniques, such as dynamic hydrogen bubble templating [12] or dealloying [13], can even create nanoporous structures, which are desirable for functional applications. Some of the most common applications of porous Cu include heat transfer and energy storage, such as in phase change architectures including heat pipes [14,15]. They can also be used in catalytic applications like CO2 reduction [16] or in battery electrode design [17]. Depending on the pore size and intended particle size, they can also be used for filtration, even being suggested as a durable replacement for N95 respirator applications with inherent antimicrobial properties [6].
A newly developed PM-based method, known as the additive expansion by the reduction of oxides (AERO) process [18], or simply oxide-reduction, may aid in balancing simplicity and porosity. The fundamental difference between this process and other PM processes is that it creates an oxide dispersion-strengthened (ODS) powder in which the oxides are reduced to create pores within each and every particle, not just between them. Furthermore, the process is compatible with other PM processes, such as space holder approaches and even additive manufacturing, such that the remaining solid volume of a porous component could be made porous as well. This also enables a hierarchical porosity to be produced, as the AERO process results in micron to submicron pores, and nanoporous Cu has also been recently reported [19]. The technique has also recently been adapted to provide greater output using planetary milling [20], which has enabled more samples of larger sizes to be produced efficiently. The aim of this study is to determine the mechanical properties of these microporous metals and how they are dictated by the interplay between compaction pressure, sintering/reduction temperature, and total porosity.

2. Materials and Methods

2.1. Sample Processing

High-purity copper (Cu, 99%, <75 μm, Sigma-Aldrich #2007780, Saint Louis, MO, USA) was mechanically mixed with cupric oxide (CuO, 98%, <10 μm, Sigma-Aldrich #208841) to produce a Cu 2 mol% CuO composite using a Fritsch Pulverisette 5/2 planetary mill (Idar-Oberstein, Germany) using a ball-to-powder mass ratio of 5:1. Stearic acid (SA, reagent grade, 95%, Sigma-Aldrich #175366) was added in a 0.035 wt% quantity as a process control agent. A total of 500 mL hardened stainless-steel vials and 9.5 mm (3/8 in) diameter, grade 25, 440C stainless steel ball bearings (Salem Specialty Ball, Canton, CT, USA) were used during milling. Powders were handled and stored in a glove box under an argon (Ar) atmosphere, and milling vials containing the powders and the balls were stored and closed in the Ar atmosphere before milling. Each composition of Cu-CuO was milled at a rotational rate of 300 rpm (10π rad s−1) for 90 min.
A wrought Cu rod (OFHC, McMaster-Carr #8965K82) with a 12.7 mm (1/2 in) diameter was purchased for comparison to the porous Cu. The as-received (AR) wrought Cu was in the H04, full-hard condition according to ASTM B187 [21]. Samples were cut from the rod to approximate the same diameter and height of the porous Cu-CuO pellets (~12.2 × 5.5 mm, diameter × height). Machining marks were removed from the faces by wet grinding with a 600-grit SiC abrasive paper.

2.2. Compacting

Three samples for each condition, 5 g each, were uniaxially compressed at room temperature to 1, 2, or 3 GPa (Carver Inc. Auto Pellet Press Model 4387, Wabash, IN, USA) and held at that pressure for 1 min in a 12 mm diameter cylindrical tungsten carbide die. The punches and die were thoroughly cleaned with ethanol before use to reduce contamination. The mass and dimensions of each compact were obtained to calculate the geometric density before and after the foaming process. The density presented throughout this paper represents the average for a set of at least three samples with errors of plus and minus one standard deviation from the average.

2.3. Reduction/Sintering

Samples were placed in a 50 mm diameter, single-zone tube furnace (Across International STF1200, Livingston, NJ, USA) that was heated to 600, 800, or 1000 °C in a 5% H2 (bal. Ar) atmosphere with a flow rate of 0.4 L min−1. Samples were inserted into the center of the preheated furnace until they reached the desired temperature, and then they were left to anneal and expand for 1 h. The samples were then removed from the furnace and allowed to cool in the same atmosphere. Once cooled, the mass and dimensions of the samples were obtained again to calculate their final density after “foaming”, a term frequently applied to any formation of porosity in metal, though it is most appropriately applied to a gas distributed in a liquid [22]. When made porous, samples will be lighter in mass and larger in volume due to the pore formation process, and the difference in geometric density from theoretical density ( ρ C u = 8.96 g/cm3) was used as the basis for total porosity and change in porosity. Where noted, the wrought Cu was annealed under the same conditions as the Cu-CuO compacts. No volumetric change was observed after annealing.

2.4. Mechanical Testing

To evaluate the effects of compaction pressure and the annealing temperature on structural properties, the 12 mm diameter samples were tested under quasi-static compression using an Instron 5982 load frame (Norwood, MA, USA) following the procedural guidelines of the ASTM E9 standard [23]. The strain rate used for each compression test was approximately 0.04 per minute (0.04 min−1 or 7.14 × 10⁻⁴ s−1). A max force condition of 100 kN was applied throughout experimentation unless the sample failed at a lower force. Samples were tested on hardened and ground steel plates, and a thin layer of graphite lubricant was applied to the plates before each test. Three pellets each of wrought Cu and Cu-CuO (pressed at 1 GPa), all heated to 600 °C, were tested using a split Hopkinson pressure bar (SHPB) system at a strain rate of ~1000 s−1 with a data collection rate of 2 × 10⁵ s−1.

2.5. Characterization

Samples examined microscopically were mounted and wet ground by hand using progressively finer SiC abrasive papers culminating with 1200 grit. Samples were then polished using a 1 µm alumina slurry followed by 90 min of vibratory polishing with 0.04 µm silica, after which samples were cleaned with soap and water and rinsed with ethanol. A Keyence VK-X1000 optical microscope (Itasca, IL, USA) was used to image the sample surface and assess porosity. For higher magnifications, the same samples were observed using secondary electron imaging in a Zeiss Sigma 500VP scanning electron microscope (SEM, Oberkochen, Germany) at a 10 mm working distance using a 30 µm aperture and an accelerating voltage of 10 kV.

3. Results

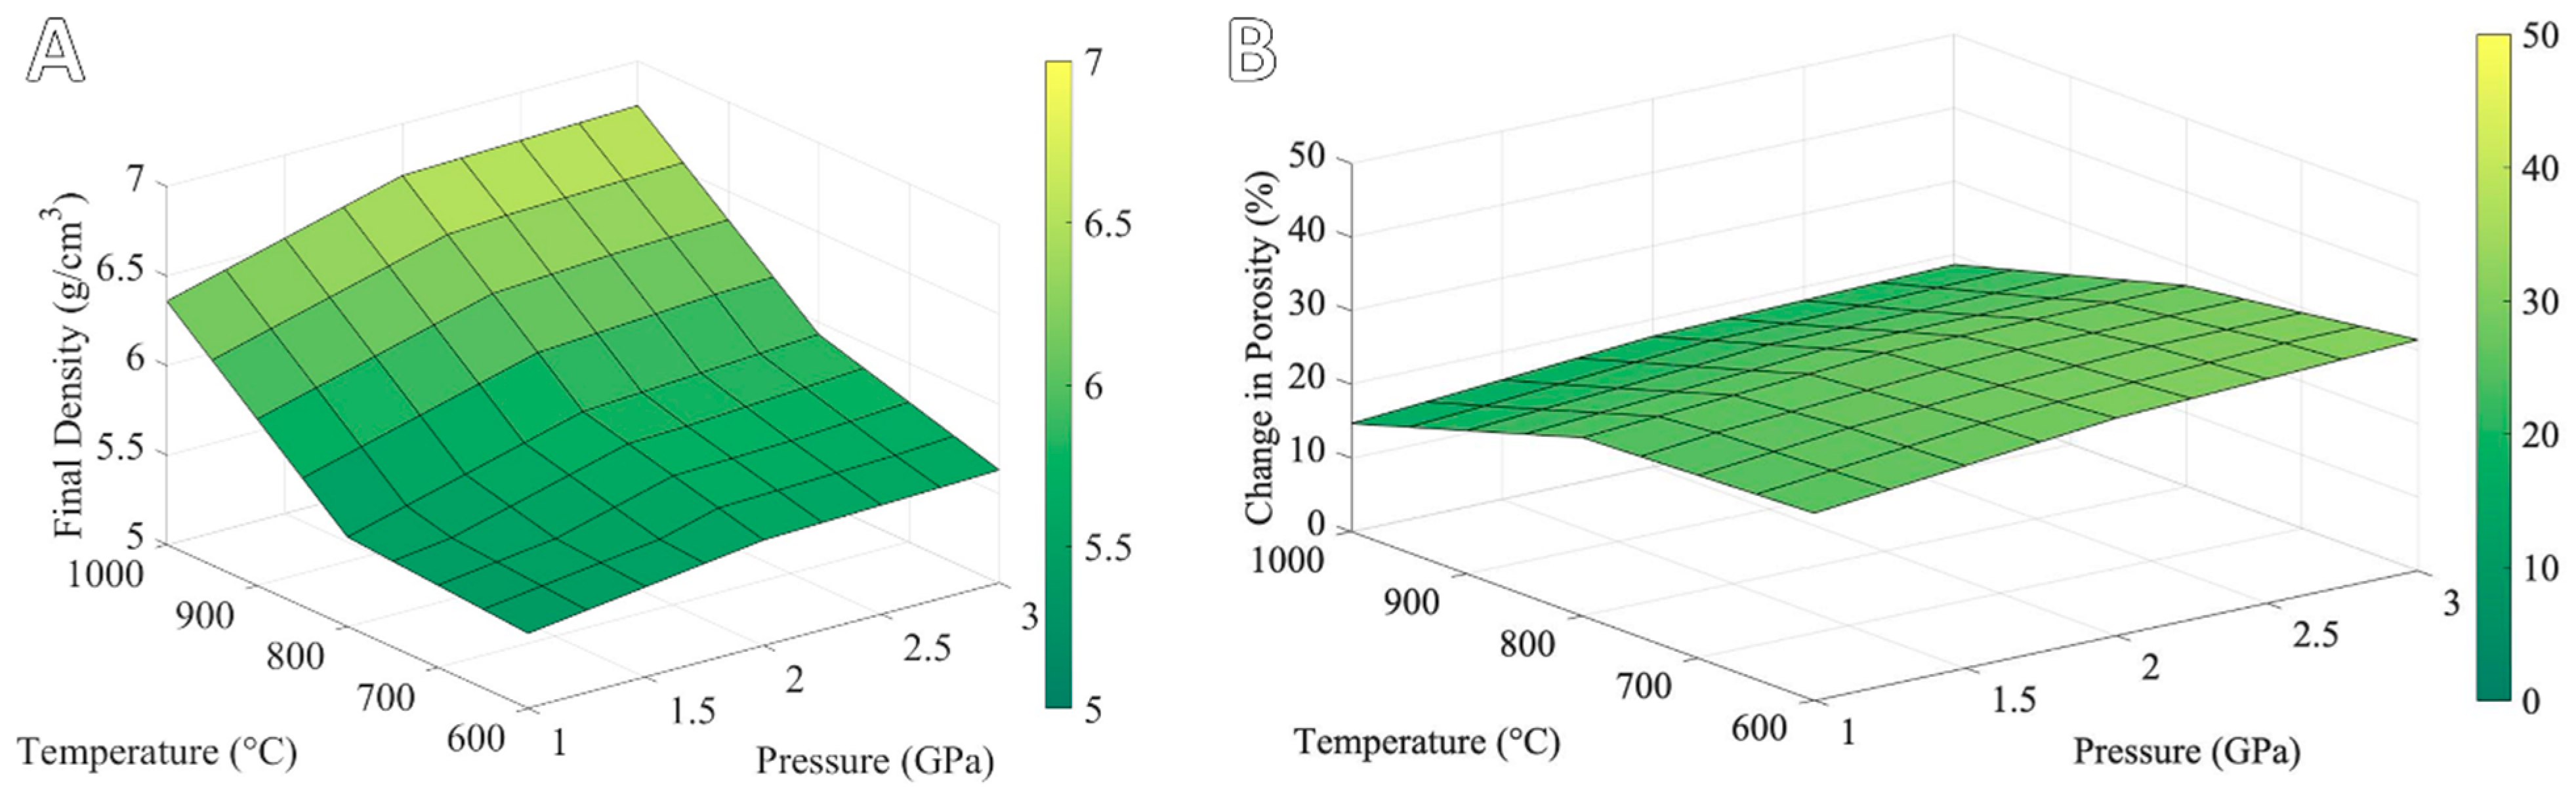
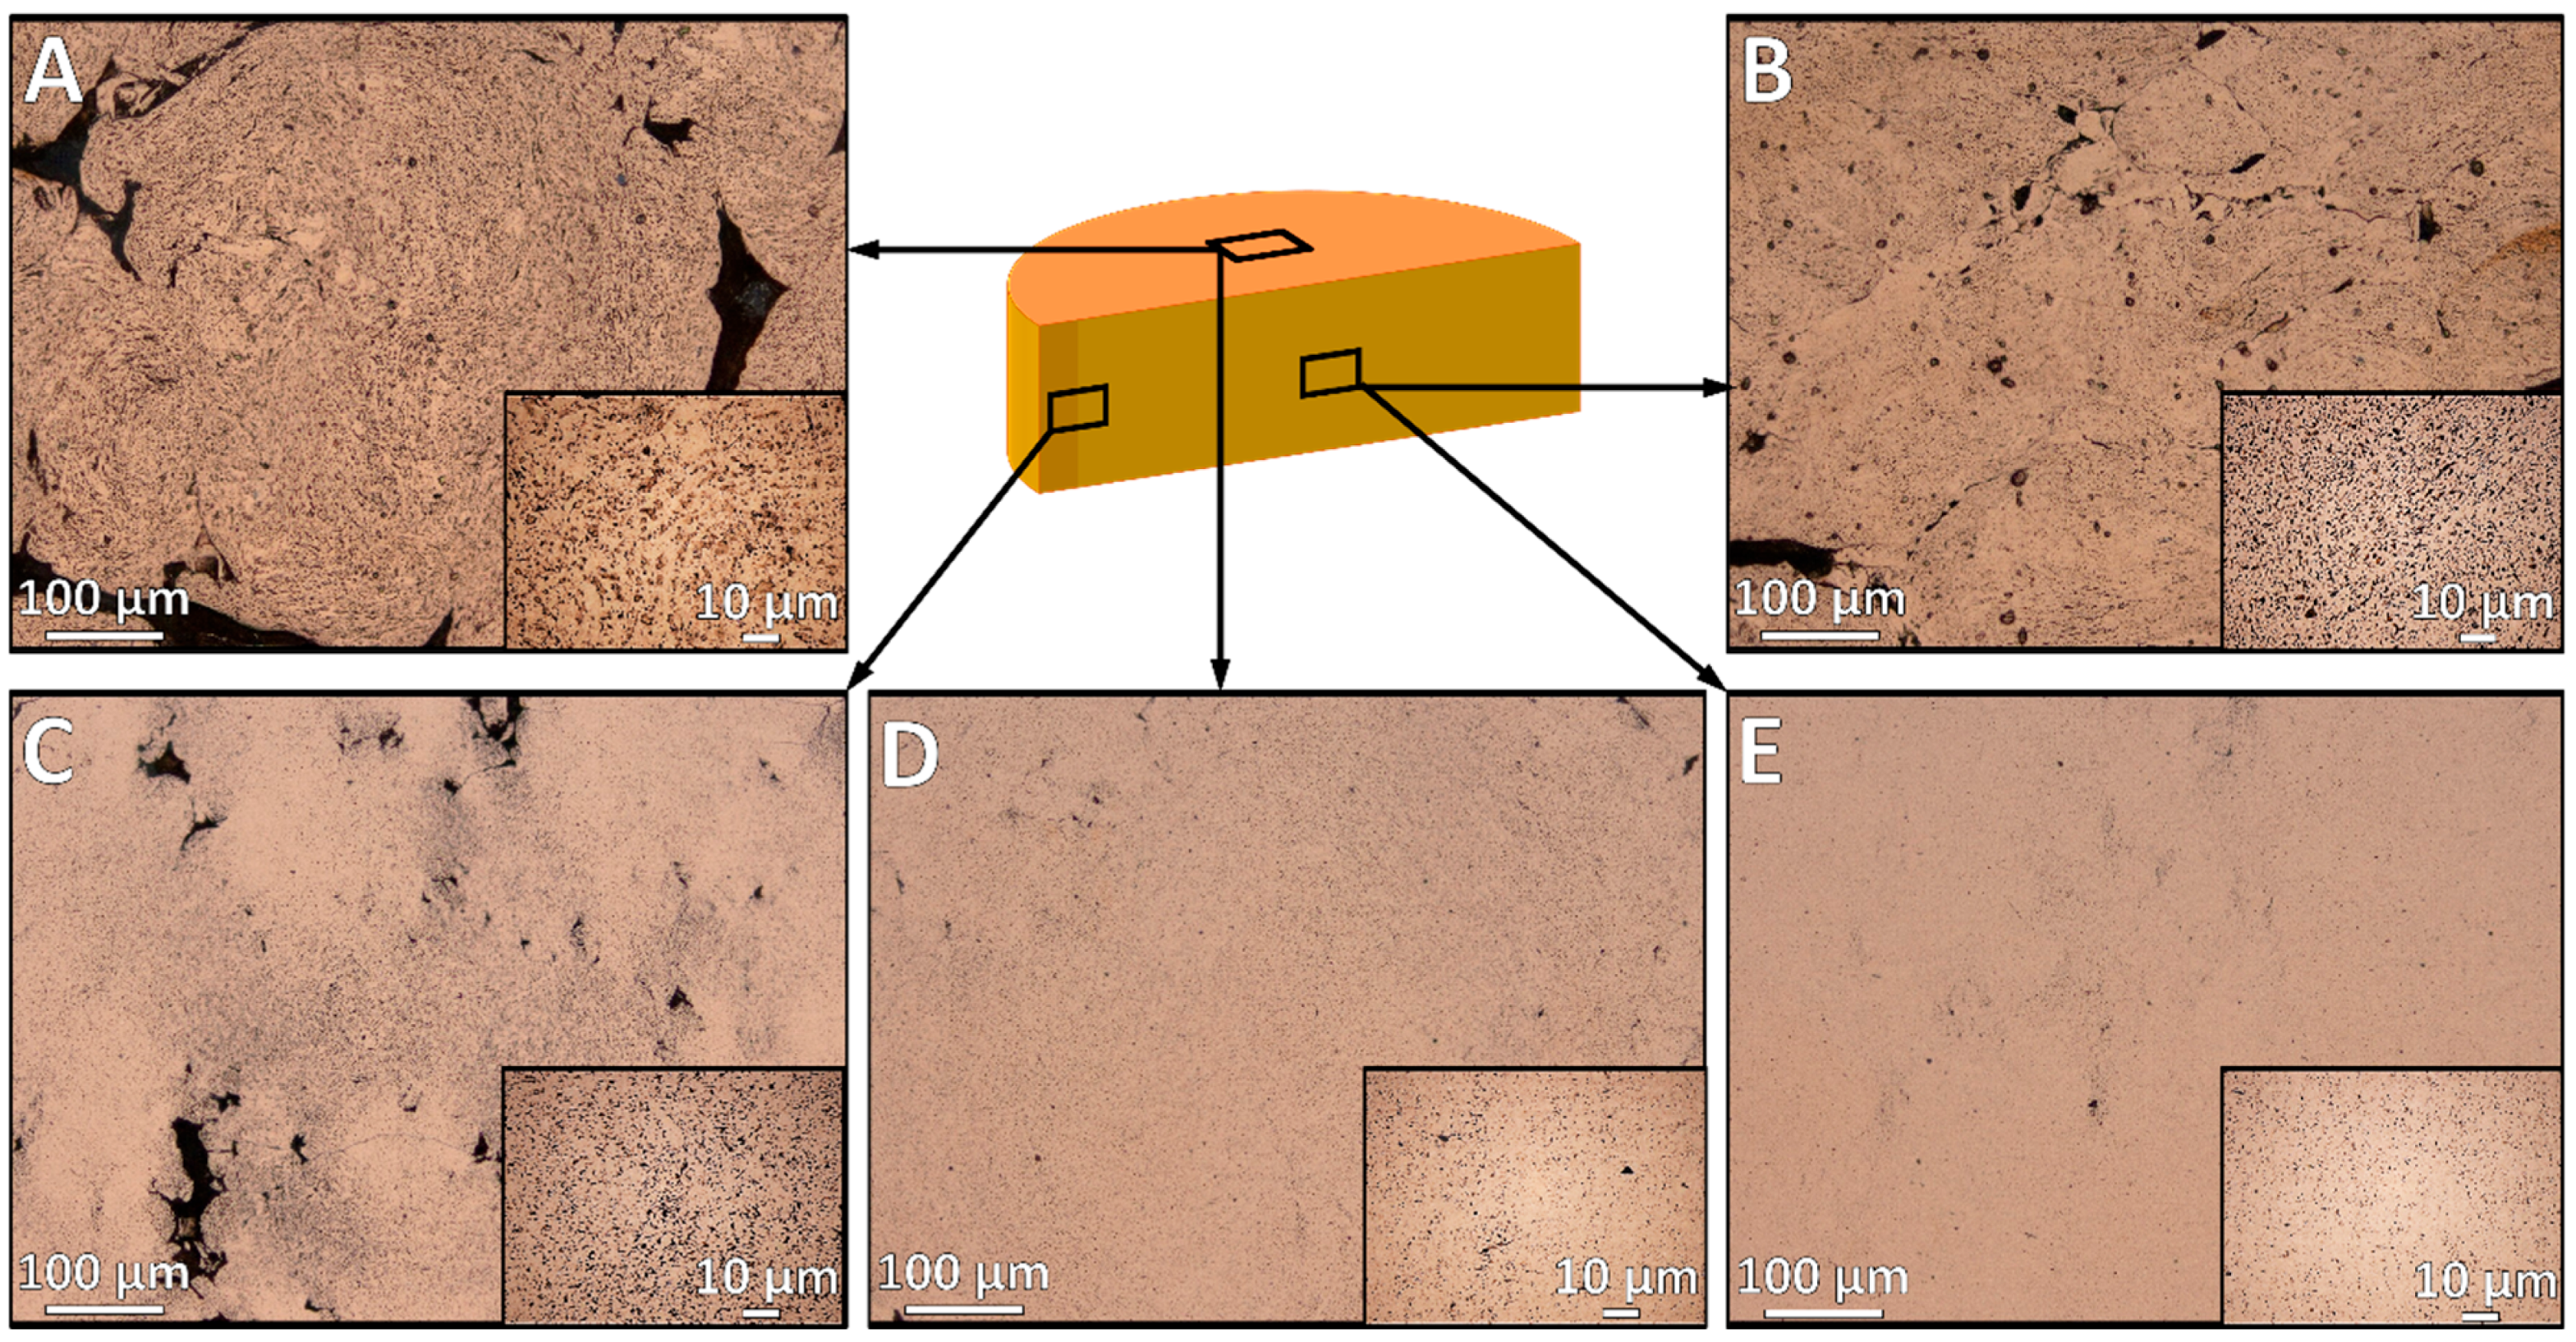
3.1. Effects of Compaction Pressure and Annealing Temperature on Pore Formation

The effects of compaction pressure and annealing temperature on final porosity were evaluated. The results after samples were compacted at various pressures (1, 2, or 3 GPa) and made porous at various temperatures (600, 800, or 1000 °C) are shown in Table 1. It is evident that increasing compaction pressure results in an increasing initial density. The lowest compaction pressure used in this work, 1 GPa, is relatively high compared to many PM processes. As such, binders that are commonly used to improve green strength were not employed here. After 1 GPa pressing, the density is ~7.7 g/cc (86% dense), while after 2 GPa compaction pressure the density reaches ~8.2 g/cc (92% dense). Even after pressing at 3 GPa, the density only reaches ~8.4 g/cc (94% dense).
Figure 1A provides a surface plot of the final density for all compaction and pore-forming conditions. The pressure–density trend before pore formation is clearly reflected in the final density, with higher density being observed after forming pores for samples compacted at higher pressure. The differences are reduced, however. Before pore formation, the 2 and 3 GPa samples are 6% and 8% greater density than the 1 Gpa samples, respectively. After forming pores at 600 °C, they are only 1.9% and 2.3% greater in density than the 1 GPa samples, respectively.
Although there is a modest increase in density due to compaction pressure, the pore-forming temperature has a much stronger influence. At all compaction pressures, the final density increases with increasing pore-forming temperature. This trend is undesirable in a material where porosity is the intended outcome. Indeed, the minimum density occurs at 1 GPa and 600 °C (5.42 g/cc or 39.5% porous) while the maximum occurs at 3 GPa and 1000 °C (6.75 g/cc or 24.1% porous).
The effect of compaction pressure on pore formation is rather modest, as shown in Figure 1B. The difference in expansion due to varying compaction pressure is at most 6.5% (for 600 °C reduction). Importantly, there is a trend upward in pore formation as the compaction pressure increases, even though the final density is higher. At higher pressures, some interparticle porosity may become closed to the surface such that it can cause pressure build-up and expansion under subsequent heating. This is the primary mechanism of gas entrapment, which is often achieved by hot isostatic pressing to intentionally capture gas in interparticle pores [24]. The mechanisms and sources of pore formation will be described in more detail in Section 4.1.

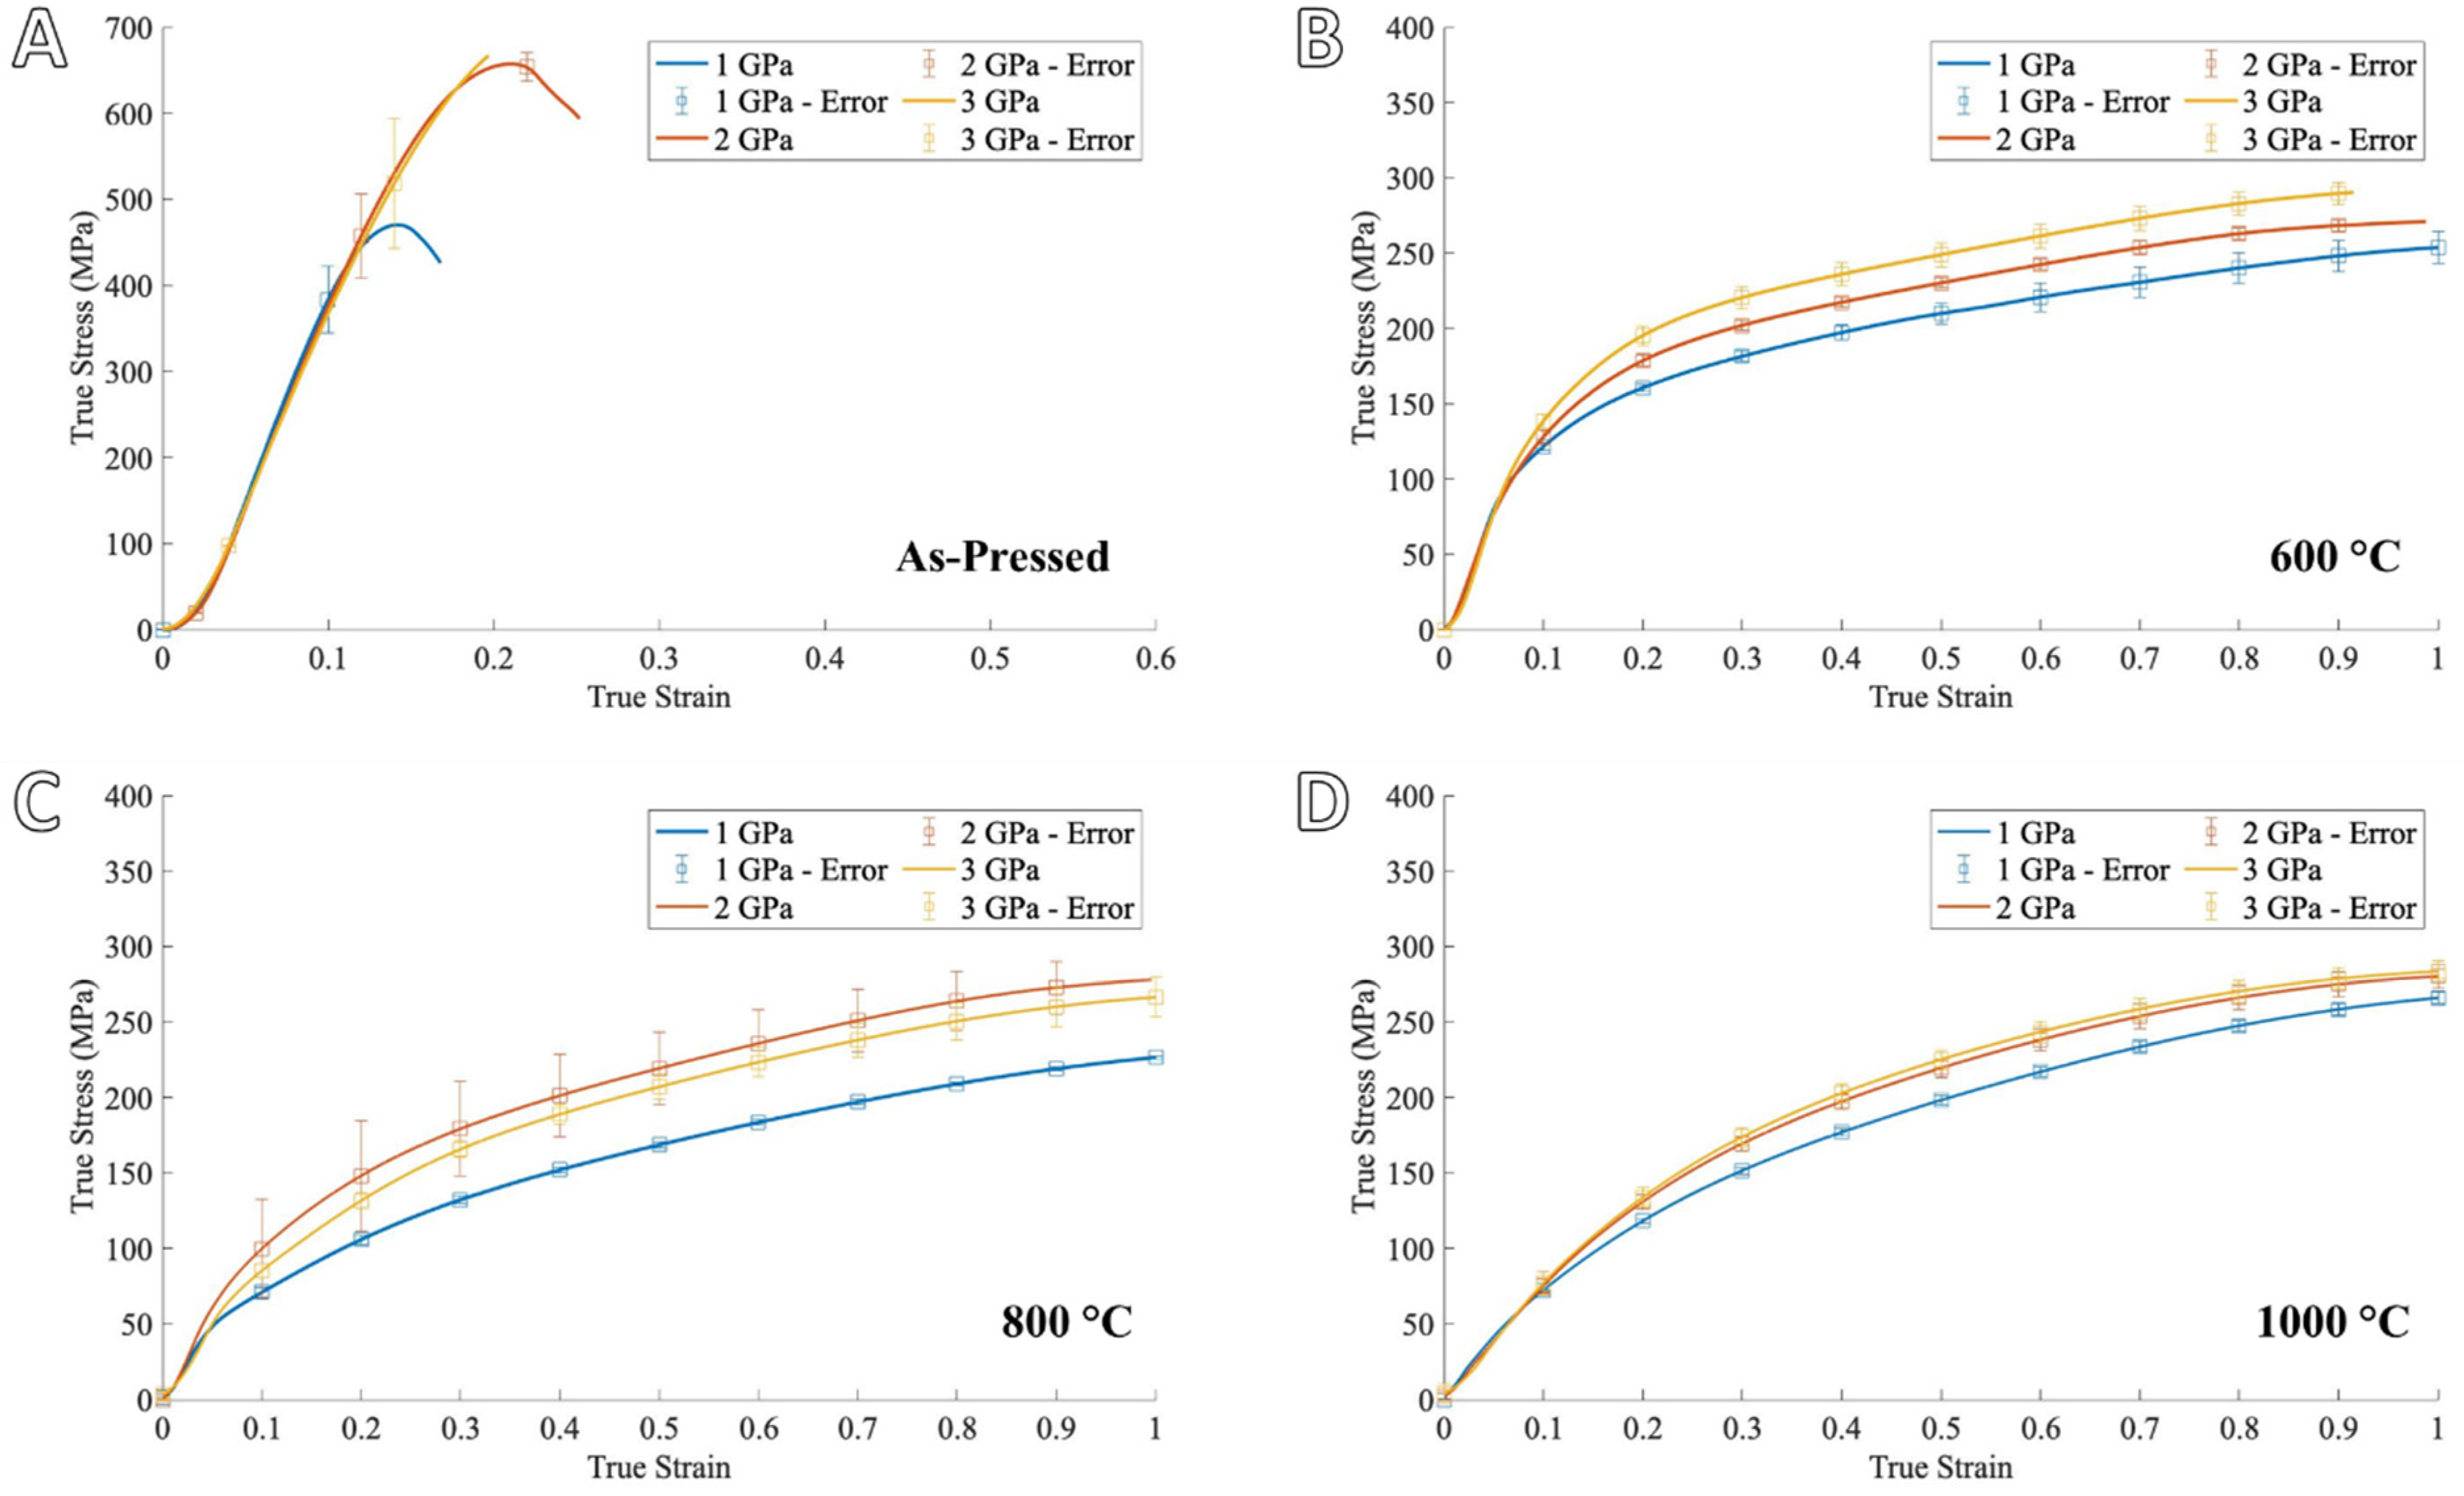
3.2. Processing Effects on Mechanical Properties of Porous Copper

After pressing and forming pores under these conditions, the mechanical properties were evaluated. Figure 2 shows the true stress-strain graphs with varying pressures and varying temperatures. Figure 2A compares the as-pressed Cu-CuO samples. The strength of the samples increases with increasing compaction pressure (i.e., initial density). The samples in the as-pressed condition did flake and crumble for 1 GPa and 2 GPa pressed samples. The 3 GPa samples never reached failure, because, as noted in Section 2.4, all samples were compressed until reaching the load cell maximum of 100 kN at which point they had not yet failed. These large yield strengths, even in an un-sintered condition, can be attributed to the milling process (work-hardening/grain refinement), the high compaction pressure (further work-hardening), and the oxide content (oxide dispersion strengthening) that acts as a precursor for pore formation. Nanostructured alloy processing methods and strengthening mechanisms, such as Hall-Petch grain size strengthening and second-phase dispersion strengthening by dislocation pinning, are discussed in more detail by Kushwaha et al. in their review of the topic [25].
After pore formation at 600 °C, the yield stress drops dramatically but is still above 100 MPa. The drop in strength can be partially attributed to softening from annealing, but pore formation is also an important factor. The compaction pressure does appear to have some effect on the residual strength, as the 1 GPa samples were consistently weaker than the 2 GPa and 3 GPa samples. At 800 °C and 1000 °C, the 2 GPa and 3 GPa samples are relatively close to each other, even within error, though the 2 GPa is slightly higher on average after forming pores at 800 °C, and the 3 GPa is higher after annealing at 1000 °C. In both cases, the differences are considered insignificant, as they are within error of each other. These similarities correspond well with the final densities, which are closer between the 2 and 3 GPa samples than to the 1 GPa samples, which have the lowest density overall. With these observations, it can be said that compaction pressure and reduction temperature each affect the final strength, but temperature is a more important factor in strength as well as the final porosity.
Under the large strains applied in these tests, the samples at 600 °C experienced some flaking of material from the outermost edge of the compact, while the 800 °C and 1000 °C samples were more ductile, only experiencing some edge cracking at 800 °C and no fracturing at all at 1000 °C. It was desirable to balance the porosity of the 600 °C samples with the improved ductility observed at 800 °C, so a two-stage heating process was employed to incorporate each stage of the process (i.e., porosity formed at 600 °C and then softened/further sintered at 800 °C), and the results are shown in Figure 3A. Although the direct benefits of tensile ductility are limited above 600 °C when annealing wrought Cu [26], the enhanced particle sintering at higher temperatures [27] is important to the compact behavior. The two-stage processing results in a slightly enhanced yield strength over the samples heated to 800 °C only, but most of the stress-strain curve is nearly identical. The qualitative post-compression integrity of the 600 °C + 800 °C pellets (Figure 3D) is improved over the 600 °C pellets (Figure 3B) and similar to that of the 800 °C only pellets (Figure 3C). The use of a second heating stage is not of sufficient benefit to justify strength retention or ductility enhancement.

3.3. Mechanical Property Comparison of Porous Cu to Wrought Cu

Having determined the pertinent process parameters to mechanical properties, it was of interest to compare the porous Cu compacts with wrought Cu. The 1 GPa, 600 °C samples were chosen for the comparison since they provide the highest porosity and a 1 GPa compaction pressure is much more comparable to commercial processes than 2 or 3 GPa. The wrought Cu was purchased in the “full hard” (H04) condition and compared as received and after heating to 600 °C. The results are provided in Figure 4.
As shown in Figure 4A, the as-pressed Cu-CuO powder is stronger than the wrought Cu, even though the wrought Cu was in a hardened state. Again, the oxide dispersion strengthening, ball milling, and compaction-based work hardening all contribute to the high strength in the Cu-CuO samples, but the wrought Cu has much greater ductility. Given that the wrought Cu is already work-hardened, the true stress-true strain curve levels out quickly after yielding. When heated to 600 °C, both samples soften significantly, and the porous Cu is weaker than the wrought Cu. It has been reported in prior work [28] that there is a distinct boundary between areas where porosity has formed and the remaining solid volume. The grain size is significantly larger on the porous side of this boundary, but it is still in the micron range even after heating to 600 °C, which will still provide a strength enhancement over coarse-grained wrought Cu.
To isolate the effect of the porosity on strength, the same stress-strain data are plotted for true specific stress, which normalizes the stress using the individual sample densities. Both the as-pressed and porous Cu samples have lower densities than wrought Cu, which increases their specific strength relative to the wrought Cu. Most importantly, the porous Cu actually outperforms the wrought Cu in this case, such that a component of equal weight would be stronger, or a component of the same strength would be lighter.
One of the characteristics most desirable in porous metals is impact energy absorption [29]. To examine the impact behavior of the porous samples, split Hopkinson pressure bar (SHPB) testing was conducted, and the results are provided in Figure 5. As shown in Figure 5A, the porous Cu undergoes a greater amount of strain at lower stress than the wrought Cu heated to 600 °C. Again, when plotted based on initial density (Figure 5B), the porous Cu is actually stronger on a per-mass basis. This strength and energy absorption benefit is consistent with a combination of a stronger matrix alongside the collapse of porosity during deformation. The matrix itself resists yielding better than the bulk of the wrought sample, but due to the pore volume, the localized stress is higher. As expected, the wrought Cu retained its integrity during the test (Figure 5C), but despite being six orders of magnitude higher in strain rate than the quasi-static samples, the porous samples also remained largely intact, with only some slight edge spalling observed in one sample (see Figure 5D).

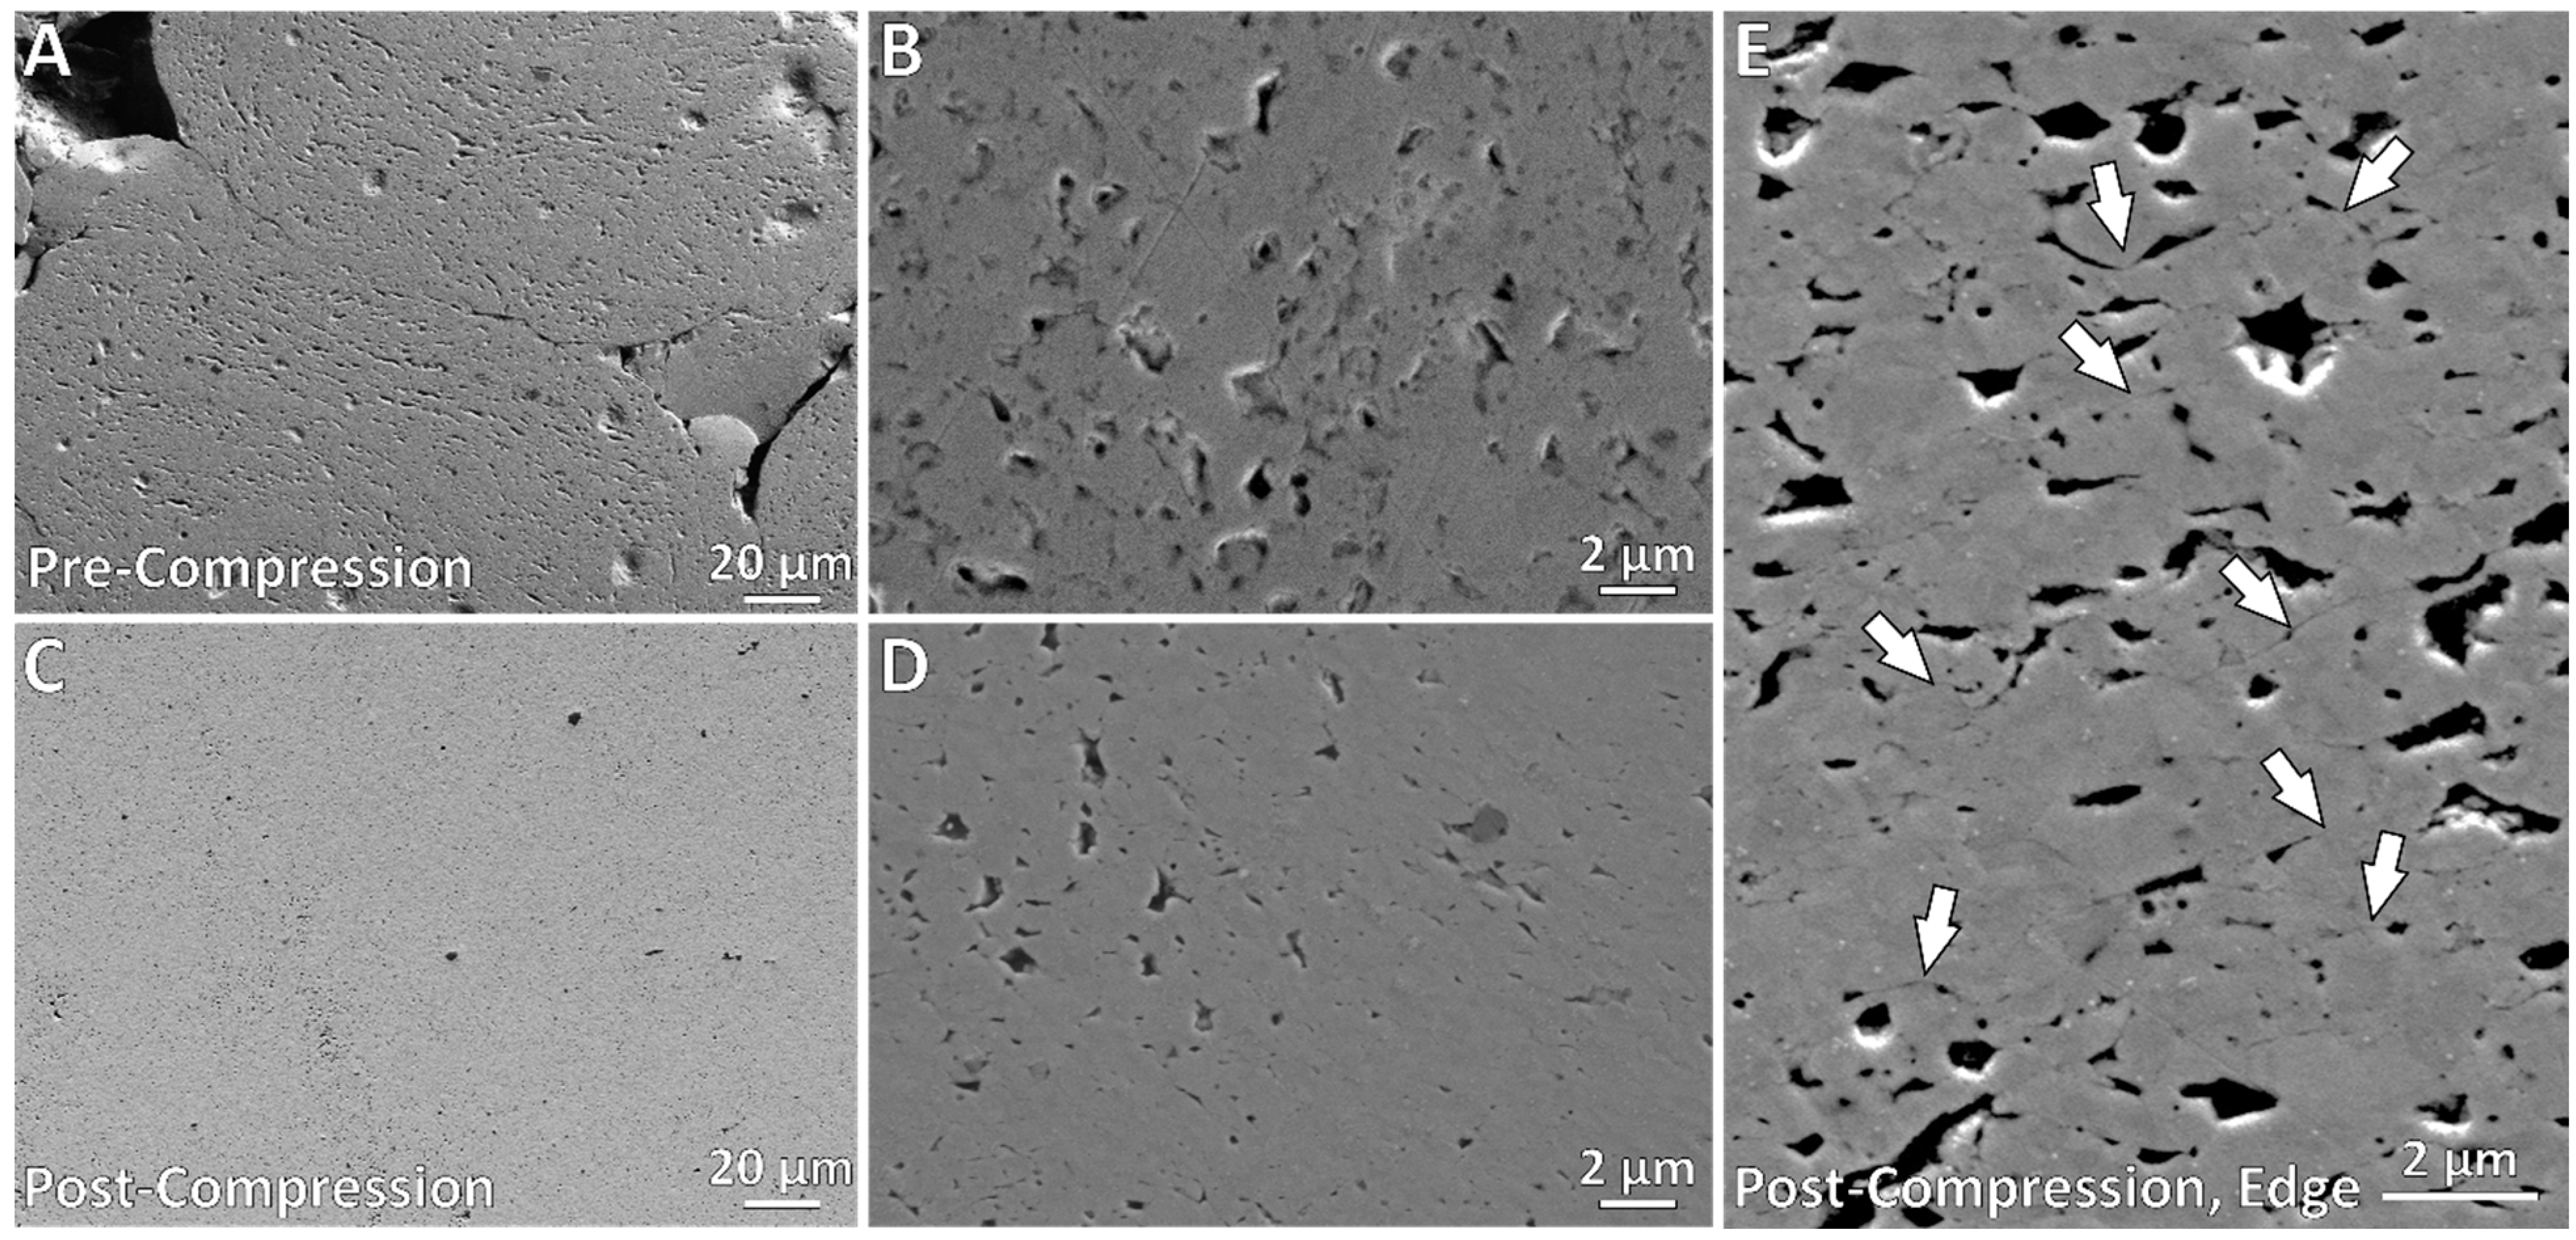
3.4. Pore Characteristics

To examine porosity, the 1 GPa, 600 °C samples were characterized before and after compression testing. Optical microscopy of the top surface (Figure 6A) and cross-section (Figure 6B) of a compact before compression testing reveal ultrafine porosity distributed uniformly throughout each particle of the compact. Some “swirling” of the pores is present, and this has been observed in loose powder as well. It is a result of the milling process and typical for the early stages of ODS alloy formation [30], not principally from the compaction of the powder.
After compression testing, the porosity is noticeably diminished in the planar and cross-sectional surfaces. The large, interparticle porosity is mostly gone in the planar (see Figure 6D) or cross-sectional (see Figure 6E) surfaces, but there is some residual porosity at the circumferential edges (see Figure 6C). There is some barreling of the samples at large strains (see Figure 3B–D, for instance), and this section is not fully consolidated during the testing. Even though compaction is performed at much higher stress, the pores are not eliminated as the powder has a much higher strength (still an ODS composite and hardened from the milling process), and there are die constraint and friction conditions that occur in uniaxial pressing [31] that are not present in the compression testing where the radial stress is minimized at the perimeter [32].
Although a large degree of porosity is closed during compression, very small pores are still distributed throughout the material, and SEM of the cross-section was used to further examine those pores (see Figure 7). Before compression, the porosity often flows with the particle surfaces (Figure 7A,B) and could even be influenced to some degree by the compaction process as the particles deform during pressing. After compression testing, the porosity is mostly closed as viewed in the center of the cross-section (Figure 7C,D). At the edge of the compact (Figure 7E), the compressive stress is not as concentrated due to the “friction hill” effects common at high compressive strains [33]. The pores are not as thoroughly collapsed, and it is observed that the pores progressively collapse throughout the cross-section, often appearing as hairline fissures, until only the smallest or most favorably oriented pores remain. It should be noted that the porosity is highly tortuous, and the pore morphology can change drastically over small distances in the three-dimensional structure. The appearance of pores at the cross-section, then, may not be fully indicative of the original surrounding volume.

4. Discussion

4.1. Process-Porosity Relationships

The type of porous Cu produced by oxide reduction is unique in multiple regards. First, it is formed throughout a solid volume, not from space between particles or by the use of space holders or scaffolding techniques. The process has traditionally been combined with pressed compacts, such that a combination of interparticle and intraparticle porosity exist in the final structure. The effect of processing conditions on pore formation [28], various alloying techniques, and more recently the scale-up of powder production [20] have been studied, but the mechanical properties of these microporous powders have not been examined until now.

4.1.1. Compaction Pressure

Compaction pressure and sintering temperature are critical factors in most PM processes and for the eventual commercialization of any PM powder. The primary challenge of the as-milled powder is that it is an oxide-dispersion strengthened (ODS) alloy, so it requires moderately high pressure to achieve suitable green strength without a binder. For instance, a 97% as-pressed density can be achieved in pure Cu with a compaction pressure of 730 MPa [34], but because of the unique nature of the starting powder in this work, a 1 GPa compaction pressure resulted in only ~86% density. As compaction pressure in Cu powders increases, the particle contact area, hardness, and density also increase, and the post-sintering density scales likewise. Where densification is not desired, such as in the production of porous components, added pressure becomes a liability that must be evaluated for any benefit that it provides to mechanical performance.
The compaction pressure of 1 GPa is used here for convenience since small, simple parts are being made and tungsten carbide tooling is used. In addition to initial hardness, the powder size and morphology also play an important role in compaction [35]. The details of powder size and morphology were recently reported [20], demonstrating that stearic acid and milling time must both be considered to produce a suitable powder yield and pore volume fraction. Despite various tuning parameters to achieve a good green strength, simply increasing compaction pressure provides diminishing returns. This was evidenced by the small density difference between samples pressed at 2 GPa and 3 GPa (2% increase in density). With ball-milled Cu powders, alternative sintering schemes like spark plasma sintering [36] can be used to increase final density and mechanical performance without excessive pressure or long annealing times.
Unlike most PM processes, porous components are not intended to achieve maximum density, so some initial porosity is not problematic so long as it does not degrade the green strength, which is quite high for these samples (refer back to Figure 2A). The fact that the formation of porosity is only weakly affected by the compaction pressure (Figure 1B) further indicates the primary source of porosity is from the interparticle pores created by the oxide-reduction process which can proceed at high initial densities.

4.1.2. Sintering/Reduction Temperature

The temperature is much more important to the overall porosity, which has been observed in prior work of this type. The maximum pore volume is dictated by a combination of the matrix strength and oxide content. Too high of an oxide content and the pores quickly coalesce and percolate, which leads to pressure loss that limits total porosity [24]. At higher temperatures, the rate of this pressure loss will be higher as the matrix is weaker. In addition, the sintering rate will be higher such that some densification will occur.
As demonstrated in Figure 1A, the effective density consistently drops as the temperature is increased. As discussed in detail by Elzey and Wadley [24], the process of solid-state pore formation by gas entrapment is dependent on the pore size, distribution, initial density, and pore pressure, as well as the matrix properties and the temperature used when expanding pores. Since the oxide reduction process is a type of gas entrapment, where pore expansion dictates the final porosity, these variables are important. The challenge is that gas entrapment in its traditional form uses pressurized pores containing Ar. Here, the source of gas pressure is the reduction of oxides, which have independent temperature requirements to the matrix softening temperature. In the Cu-CuO system, CuO has a low enough reduction temperature (~250 °C [37]) that the oxide is readily reduced before the Cu matrix is weakened enough to expand. The ability to produce mechanically robust samples via oxide reduction was recently reported in nanoporous Ni, where a reduced compact of Ni 90 mol% NiO powder was reduced at only 400 °C and still performed similarly to wrought Ni in terms of specific strength [38]. The moisture evolution during heating is thought to enhance surface diffusion and promote sintering at a lower temperature [39]. Therefore, increasing temperature provides a modest improvement in ductility with a significant loss of porosity, and is not preferable for low-density, high-strength, high surface area components.

4.2. Porosity-Property Relationships

Porous metals (or metallic “foams”) are often described by a stress-strain curve comprised of a small elastic region followed by a protracted plateau in the stress during pore collapse and compaction, which then culminates in a steep rise in the stress once the material reaches full density [40,41]. This “typical” stress-strain curve is most accurate in low-density, open-cell metals. The samples here are relatively dense (60% and higher) compared to many porous metals studied for their mechanical properties, especially light metals such as aluminum or magnesium prepared by liquid-state processing [1]. Since it is relatively dense and not particularly strong, Cu is not common in structural porous applications. Pure Cu is also not readily available in many commercial forms, with a low-density reticulated foam being among the most common (e.g., Duocel®).
Chen et al. [42] studied the compressive properties of porous Cu produced by an electrodeposition scaffolding method where polyurethane foam is coated with metal before being removed by heating, leaving behind hollow Cu struts of the same morphology. This allows for very low density to be achieved, and the compression curves display a plateau stress that is noticeably more pronounced for samples that are ~96% porous than for samples that are ~90% porous. It was also observed that smaller pore size resulted in a higher yield strength for similar densities (from 5 pores per inch (PPI) to 30 PPI), but the smallest pore size is ~850 µm across, which is typical for scaffolding and space holder methods but much larger than the pores or even particles used here. The use of a polymer foam precursor requires such large pores to allow metallic particles to reach the interior. This presents a limit to the part thickness and/or minimum pore size that can be produced.
El-Hadek and Kaytbay [43] investigated a powder-processed porous Cu using a carbonate space holder to control porosity. They investigated a wide range of densities from 94% dense (no carbonate, 8.39 g/cc) to 14% dense (1.25 g/cc) with pore sizes of 120–500 µm. Compared to their “solid” Cu, even the next highest density of ~39% (3.46 g/cc) displays negligible yield strength, relatively speaking, and is comparable to the highest porosities. This can be at least partially attributed to the dependence on relatively small sintering necks between matrix particles since a high compaction pressure is not compatible with some space holders.
In work specifically focused on medium to high-density porous Cu, Zhang and Wang [9] used spherical PMMA space holder particles to create porous Cu with densities of ~6% to ~56%. These samples do not display a traditional plateau stress and instead follow a general power law behavior, similar to that of the samples tested here. The samples were heated to a final temperature of 960 °C, and the 30% porous Cu performs similarly to the 1000 °C samples produced in this work (also ~30% porous) up to the maximum strain examined in their work (~0.3 true strain). They also noted smaller interparticle porosity and a significant improvement in strength by using smaller particles (5 µm vs. 45 µm), similar to a Hall-Petch trend [9,10]. Unlike the low-density samples of Hadek and Kaytbay, the walls around the 200–600 µm pores are much smoother and denser, which improves strength at the cost of density. Most of the porosity in the samples produced here is not dictated by particle-particle bonds, and the particles are highly compacted as well, which leads to improvements in mechanical performance.
A significantly different method, known as the Gasar process—a liquid-state gas-eutectic technique [4]—has also been used in copper to create pores aligned to the compression axis. Due to the nature of the axially oriented porosity in these samples, they perform well in compression [44], but they are also highly anisotropic, such that the strength drops with angle of misalignment, eventually reaching a minimum when compressed perpendicular to the axial direction [45]. Anisotropy can be beneficial for applications like fluid flow, but in many other applications, a homogeneous pore distribution, as produced here, will be beneficial.
Impact characteristics of porous metals are of interest for impact-related applications such as crash structures [29] and lightweight armor [46], and the ability to control deformation through graded porosity is also of interest [47]. The literature on high strain rate testing of porous Cu is quite limited. Gasar Cu has been tested under high strain conditions [48], and over a wide range of strain rates, it was found to have impact performance characterized by a strut deformation mode, and the samples exhibited the three-stage compression behavior typical of low-density metallic foams. In work based on powder processing in medium to high-density porous bronze [49], SHPB testing resulted in similar, bi-linear behavior as observed here. The porosities are also similar (20–39%) and the pore size and characteristics are more closely aligned, as it is powder-based, although the preparation of the samples is not described. The general result that the porosity results in a lower yield and larger strain is consistent. The finding here that a powder-based porous sample that has only been heated to 600 °C can sustain high-rate impact is noteworthy.
The ASTM B187 standard for Cu indicates that annealed Cu (O60 condition) should have a minimum yield strength of 55 MPa. The ASM Handbook suggests a 69 MPa minimum [26] and specifies an annealing range of 375–650 °C, such that even the 600 °C samples can be properly considered annealed. As observed in other work on porous Cu produced this way [18], a micron to sub-micron grain size is maintained after annealing, which can at least partly account for the increase in strength through basic Hall-Petch strengthening. This also produces a micron to submicron pore size that is highly uniform and tortuous, not like most space holder or scaffolding techniques. This causes the failure to be uniform, similar to the work of Zhang and Wang [9], but quite different from the reticulated Cu studied by Chen et al. [42] or the Gasar process [44] where cell wall/strut buckling and collapse are a primary failure mode. Although the materials produced in this work do not have an extended plateau region, their strength is comparable to or better than wrought copper under similar processing and generally exceeds that of porous Cu produced by alternative methods. Indeed, this method could be combined with other techniques, such as space holder methods, to increase the overall porosity, introduce hierarchical porosity, and potentially add strength to the cell walls.

5. Conclusions

In this work, a systematic variation in compaction pressure, pore formation, and sintering temperature was used to determine the effect of processing parameters on the overall porosity and compressive properties. The following conclusions can be made:
  • The compaction pressure does not have a strong effect on the formation of porosity, with a maximum of 6% variation across samples pressed at 1, 2, and 3 GPa.
  • Higher compaction pressure results in slightly higher density before (~10%) and after (~4% higher) foaming and should be avoided for the highest porosity.
  • Higher compaction pressure results in a modest increase in compressive strength (~20% or less improvement).
  • Higher foaming temperature results in lower overall porosity and reduced strength (~12% drop in density and ~50% drop in strength)
  • The optimum outcome for the highest porosity and good strength tested here is the 1 GPa and 600 °C condition (~40% porosity and ~75 MPa yield stress).
  • Even at low sintering temperatures and higher porosity, the foamed samples outperformed wrought Cu on a per-mass basis in both quasi-static and SHPB compression (i.e., similar yield strength with 60% density).

Author Contributions

Funding acquisition, M.A.; Investigation, J.T.L.K., E.P. and R.L.; Methodology, J.T.L.K.; Supervision, M.A.; Writing—original draft, J.T.L.K.; Writing—review & editing, M.A. All authors have read and agreed to the published version of the manuscript.

Funding

This work was funded under National Science Foundation grant # 2035473.

Data Availability Statement

The data presented in this study are available on request from the corresponding author. The data are not publicly available due to them being held on a private server.

Acknowledgments

We are grateful for the assistance of Standard Mechanics in conducting Split Hopkinson Pressure Bar testing.

Conflicts of Interest

The authors report there are no competing interest to declare.

References

  1. Banhart, J. Light-Metal Foams—History of Innovation and Technological Challenges. Adv. Eng. Mater. 2013, 15, 82–111. [Google Scholar] [CrossRef]
  2. Banhart, J. Aluminum foams: On the road to real applications. MRS Bull. 2003, 28, 290–295. [Google Scholar] [CrossRef]
  3. Atwater, M.A.; Guevara, L.N.; Darling, K.A.; Tschopp, M.A. Solid State Porous Metal Production: A Review of the Capabilities, Characteristics, and Challenges. Adv. Eng. Mater. 2018, 20, 33. [Google Scholar] [CrossRef]
  4. Shapovalov, V.; Boyko, L. Gasar—A new Class of Porous Materials. Adv. Eng. Mater. 2004, 6, 407–410. [Google Scholar] [CrossRef]
  5. Kim, J.-H.; Kim, R.-H.; Kwon, H.-S. Preparation of copper foam with 3-dimensionally interconnected spherical pore network by electrodeposition. Electrochem. Commun. 2008, 10, 1148–1151. [Google Scholar] [CrossRef]
  6. Acierno, A.; Stevens, E.; Sedlar, T.; Kimes, K.; Chmielus, M.; Svihla, K.; Pilz, S.; Dougherty, P.; Spirka, T.A. Optimizing 3D-Printed, Reusable Metal N95 Filters by 3D Characterization and Modeling. AM&P Tech. Artic. 2021, 179, 23–26. [Google Scholar]
  7. Hoan, T.M.; Toan, N.V.; Hung, N.P.; Trinh, P.V.; Trung, T.B.; Phuong, D.D. Dependence of Particle Size and Geometry of Copper Powder on the Porosity and Capillary Performance of Sintered Porous Copper Wicks for Heat Pipes. Metals 2022, 12, 1716. [Google Scholar] [CrossRef]
  8. Parvanian, A.M.; Saadatfar, M.; Panjepour, M.; Kingston, A.; Sheppard, A.P. The effects of manufacturing parameters on geometrical and mechanical properties of copper foams produced by space holder technique. Mater. Des. 2014, 53, 681–690. [Google Scholar] [CrossRef]
  9. Zhang, E.; Wang, B. On the compressive behaviour of sintered porous coppers with low to medium porosities—Part I: Experimental study. Int. J. Mech. Sci. 2005, 47, 744–756. [Google Scholar] [CrossRef]
  10. Wang, B.; Zhang, E. On the compressive behavior of sintered porous coppers with low-to-medium porosities—Part II: Preparation and microstructure. Int. J. Mech. Sci. 2008, 50, 550–558. [Google Scholar] [CrossRef]
  11. Sharma, V.M.; Racherla, V.; Pal, S.K. Synthesis of open-cell copper foam using friction sintering. Int. J. Adv. Manuf. Technol. 2019, 103, 3163–3174. [Google Scholar] [CrossRef]
  12. Najdovski, I.; O’Mullane, A.P. The effect of electrode material on the electrochemical formation of porous copper surfaces using hydrogen bubble templating. J. Electroanal. Chem. 2014, 722, 95–101. [Google Scholar] [CrossRef]
  13. Zhao, C.; Qi, Z.; Wang, X.; Zhang, Z. Fabrication and characterization of monolithic nanoporous copper through chemical dealloying of Mg–Cu alloys. Corros. Sci. 2009, 51, 2120–2125. [Google Scholar] [CrossRef]
  14. Liu, K.; Yuan, Z.F.; Zhao, H.X.; Shi, C.H.; Zhao, F. Properties and applications of shape-stabilized phase change energy storage materials based on porous material support—A review. Mater. Today Sustain. 2023, 21, 100336. [Google Scholar] [CrossRef]
  15. Hayat, M.A.; Ali, H.M.; Janjua, M.M.; Pao, W.; Li, C.; Alizadeh, M. Phase change material/heat pipe and Copper foam-based heat sinks for thermal management of electronic systems. J. Energy Storage 2020, 32, 101971. [Google Scholar] [CrossRef]
  16. Rudd, J.A.; Hernandez-Aldave, S.; Kazimierska, E.; Hamdy, L.B.; Bain, O.J.; Barron, A.R.; Andreoli, E. Investigation into the Re-Arrangement of Copper Foams Pre-and Post-CO2 Electrocatalysis. Chemistry 2021, 3, 687–703. [Google Scholar] [CrossRef]
  17. Ingber, T.T.; Bela, M.M.; Püttmann, F.; Dohmann, J.F.; Bieker, P.; Börner, M.; Winter, M.; Stan, M.C. Elucidating the lithium deposition behavior in open-porous copper micro-foam negative electrodes for zero-excess lithium metal batteries. J. Mater. Chem. A 2023, 11, 17828–17840. [Google Scholar] [CrossRef]
  18. Atwater, M.A.; Darling, K.A.; Tschopp, M.A. Towards Reaching the Theoretical Limit of Porosity in Solid State Metal Foams: Intraparticle Expansion as a Primary and Additive Means to Create Porosity. Adv. Eng. Mater. 2014, 16, 190–195. [Google Scholar] [CrossRef]
  19. Jung, D.; Boan, B.; Allapatt, N.; Atwater, M. Nanoporous Cu Created by the Reduction of CuO Dispersions. J. Mater. Sci. 2023, 58, 12635–12649. [Google Scholar] [CrossRef]
  20. Tse Lop Kun, J.E.; Rutherford, A.P.; Learn, R.S.; Atwater, M.A. Parametric Study of Planetary Milling to Produce Cu-CuO Powders for Pore Formation by Oxide Reduction. Materials 2023, 16, 5407. [Google Scholar] [CrossRef]
  21. ASTM B187/B187M-20; Standard Specification for Copper, Bus Bar, Rod, and Shapes and General Purpose Rod, Bar, and Shapes. ASTM International: West Conshohocken, PA, USA, 2020; pp. 1–9.
  22. Banhart, J. Manufacture, characterisation and application of cellular metals and metal foams. Prog. Mater Sci. 2001, 46, 559–632. [Google Scholar] [CrossRef]
  23. ASTM. E9 (2019) Standard Test Methods of Compression Testing of Metallic Materials at Room Temperature; ASTM International: West Conshohocken, PA, USA, 2019; p. E9. [Google Scholar]
  24. Elzey, D.M.; Wadley, H.N.G. The Limits Of Solid State Foaming. Acta Mater. 2001, 49, 849–859. [Google Scholar] [CrossRef]
  25. Kushwaha, A.K.; John, M.; Misra, M.; Menezes, P.L. Nanocrystalline Materials: Synthesis, Characterization, Properties, and Applications. Crystals 2021, 11, 1317. [Google Scholar] [CrossRef]
  26. ASM International. Annealing and Recrystallization of Coppers. In ASM Handbook; Totten, G., MacKenzie, D., Eds.; ASM International: Materials Park, OH, USA, 2016; Volume 4, pp. 325–334. [Google Scholar]
  27. Li, P.; Chen, C.-G.; Qin, Q.; Lu, T.-X.; Shao, Y.-R.; Yang, F.; Hao, J.-J.; Guo, Z.-M. Sintering microstructure and properties of copper powder prepared by electrolyzation and atomization. J. Cent. South Univ. 2021, 28, 1966–1977. [Google Scholar] [CrossRef]
  28. Atwater, M.A.; Darling, K.A.; Tschopp, M.A. Solid-State Foaming by Oxide Reduction and Expansion: Tailoring the Foamed Metal Microstructure in the Cu–CuO System with Oxide Content and Annealing Conditions. Adv. Eng. Mater. 2016, 18, 83–95. [Google Scholar] [CrossRef]
  29. Rajak, D.K.; Linul, E. Crushing response of Composite Metallic Foams: Density and High Strain Rate effects. J. Alloys Compd. 2021, 871, 159614. [Google Scholar] [CrossRef]
  30. Suryanarayana, C. Mechanical alloying and milling. Prog. Mater. Sci. 2001, 46, 1–184. [Google Scholar] [CrossRef]
  31. Staf, H.; Larsson, P.-L. Evaluation of an advanced powder-die frictional model. Powder Technol. 2020, 363, 569–574. [Google Scholar] [CrossRef]
  32. Bina, E.P.; Haghighat, H. Limit analysis of plane strain compression of cylindrical billets between flat dies. Int. J. Adv. Manuf. Technol. 2021, 116, 3561–3570. [Google Scholar] [CrossRef]
  33. Meyers, M.; Chawla, K. Mechanical Behavior of Materials, 2nd ed.; Cambridge University Press: New York, NY, USA, 2009; p. 187. [Google Scholar]
  34. Dixit, M.; Srivastava, R. Effect of compaction pressure on microstructure, density and hardness of Copper prepared by Powder Metallurgy route. In IOP Conference Series: Materials Science and Engineering, Proceedings of the International Conference on Mechanical, Materials and Renewable Energy, Sikkim, India, 8–10 December 2017; IOP Publishing Ltd.: Bristol, UK, 2017; p. 012209. [Google Scholar]
  35. Fischmeister, H.F. Powder compaction: Fundamentals and recent developments. Proc. Inst. Mech. Eng. 1982, 196, 105–121. [Google Scholar] [CrossRef]
  36. Abedi, M.; Asadi, A.; Vorotilo, S.; Mukasyan, A.S. A critical review on spark plasma sintering of copper and its alloys. J. Mater. Sci. 2021, 56, 19739–19766. [Google Scholar] [CrossRef]
  37. Rodriguez, J.A.; Kim, J.Y.; Hanson, J.C.; Pérez, M.; Frenkel, A.I. Reduction of CuO in H2: In situ time-resolved XRD studies. Catal. Lett. 2003, 85, 247–254. [Google Scholar] [CrossRef]
  38. Atwater, M.A.; Corcoran, S.G. Using Powder Metallurgy and Oxide Reduction to Produce Eco-Friendly Bulk Nanoporous Nickel. Adv. Eng. Mater. 2023, 25, 2201629. [Google Scholar] [CrossRef]
  39. Taylor, S.L.; Jakus, A.E.; Shah, R.N.; Dunand, D.C. Iron and Nickel Cellular Structures by Sintering of 3D-Printed Oxide or Metallic Particle Inks. Adv. Eng. Mater. 2017, 19, 1600365. [Google Scholar] [CrossRef]
  40. Ashby, M.F. Mechnical properties of cellular solids. Metall. Trans. A 1983, 14A, 1755–1769. [Google Scholar] [CrossRef]
  41. Gibson, L. Mechanical behavior of metallic foams. Annu. Rev. Mater. Sci. 2000, 30, 191–227. [Google Scholar] [CrossRef]
  42. Chen, J.; Li, X.; Li, W.; He, J.; Li, C.; Dai, S.; Chen, J.; Ren, Y. Study on the Compression Properties and Deformation Failure Mechanism of Open-Cell Copper Foam. Adv. Eng. Mater. 2017, 19, 1600861. [Google Scholar] [CrossRef]
  43. El-Hadek, M.A.; Kaytbay, S. Mechanical and physical characterization of copper foam. Int. J. Mech. Mater. Des. 2008, 4, 63–69. [Google Scholar] [CrossRef]
  44. Simone, A.; Gibson, L. The compressive behaviour of porous copper made by the GASAR process. J. Mater. Sci. 1997, 32, 451–457. [Google Scholar] [CrossRef]
  45. Li, Z.; Yang, T.; Jin, Q.; Li, Z.; Jiang, Y.; Zhou, R. Compressive behaviours of lotus-type porous copper fabricated by Gasar process. Procedia Eng. 2012, 31, 337–342. [Google Scholar] [CrossRef]
  46. Marx, J.; Portanova, M.; Rabiei, A. Performance of Composite Metal Foam Armors against Various Threat Sizes. J. Compos. Sci. 2020, 4, 176. [Google Scholar] [CrossRef]
  47. Movahedi, N.; Fiedler, T.; Taşdemirci, A.; Murch, G.E.; Belova, I.V.; Güden, M. Impact loading of functionally graded metal syntactic foams. Mater. Sci. Eng. A 2022, 839, 142831. [Google Scholar] [CrossRef]
  48. Liu, X.-H.; Huang, H.-Y.; Xie, J.-X. Effect of strain rate on the compressive deformation behaviors of lotus-type porous copper. Int. J. Miner. Metall. Mater. 2014, 21, 687–695. [Google Scholar] [CrossRef]
  49. Iqbal, N.; Xue, P.; Liao, H.J.; Wang, B.; Li, Y.L. Material characterization of porous bronze at high strain rates. Mater. Sci. Eng. A 2011, 528, 4408–4412. [Google Scholar] [CrossRef]
Figure 1. Plot of (A) the final density and (B) the change in porosity as functions of compaction pressure and foaming temperature.
Metals 13 01942 g001
Figure 2. True stress-strain graphs for samples (A) as-pressed and reduced at (B) 600 °C, (C) 800 °C, and (D) 1000 °C under 5% H2. Samples were pressed at 1, 2, and 3 GPa for each condition.
Metals 13 01942 g002
Figure 3. (A) True Stress-Strain Graph for samples reduced at 600 °C, 800 °C, and 600–800 °C at 1 GPa. Pellets pressed at 1 GPa and reduced at (B) 600 °C, (C) 800 °C, and (D) 600–800 °C. All pellets were compressed to the load cell maximum of 100 kN.
Metals 13 01942 g003
Figure 4. Quasi-static compression comparison of Cu-CuO compacts as-pressed (AP) and made porous (600 °C), and wrought Cu in the full hard (AR) and 600 °C annealed conditions as (A) true stress—true strain and (B) specific true stress—true strain plots.
Metals 13 01942 g004
Figure 5. Split Hopkinson pressure bar comparison of Cu-CuO compacts pressed at 1 GPa and made porous at 600 °C and wrought Cu in the 600 °C annealed condition as (A) true stress—true strain and (B) specific true stress—true strain. Post-test photographs of (C) the wrought Cu pellets and (D) the porous pellets.
Metals 13 01942 g005
Figure 6. Optical microscopy of the polished surfaces of the Cu pressed at 1 GPa and made porous at 600 °C in (A) planar and (B) cross-sectional orientations. The (C) cross-section near the outer edge, (D) the planar surface, and (E) the cross-section at the center of the sample after compression are also shown.
Metals 13 01942 g006
Figure 7. SEM of the polished cross-sectional surfaces of the Cu pressed at 1 GPa and made porous at 600 °C at (A) 500× magnification and (B) 5000× magnification. The post-compression cross-section at (C) 500× and (D) 5000× are also shown. (E) To emphasize the pore collapse, the post-compression sample was also imaged near the outer circumferential edge where consolidation was not as thorough (white arrows indicate collapsed pores).
Metals 13 01942 g007
Table 1. Density and change in porosity before and after pore formation for varying compaction pressures and temperatures.
Pressure (GPa)Pore Formation
Temperature (°C)
Density, before (g/cm3)Density, after (g/cm3)Change in
Porosity (%)
16007.69 ± 0.025.42 ± 0.0625.40 ± 0.46
8007.67 ± 0.045.50 ± 0.0624.21 ± 0.99
10007.67 ± 0.026.36 ± 0.0514.66 ± 0.44
26008.23 ± 0.015.59 ± 0.0529.52 ± 0.60
8008.26 ± 0.055.85 ± 0.0426.94 ± 0.08
10008.30 ± 0.066.71 ± 0.0517.72 ± 0.20
36008.44 ± 0.025.63 ± 0.0431.92 ± 0.60
8008.38 ± 0.045.93 ± 0.0327.26 ± 0.28
10008.42 ± 0.016.75 ± 0.0718.68 ± 0.82
Disclaimer/Publisher’s Note: The statements, opinions and data contained in all publications are solely those of the individual author(s) and contributor(s) and not of MDPI and/or the editor(s). MDPI and/or the editor(s) disclaim responsibility for any injury to people or property resulting from any ideas, methods, instructions or products referred to in the content.

