Article

Numerical Analysis of Slag–Steel–Air Four-Phase Flow in Steel Continuous Casting Model Using CFD-DBM-VOF Model

1
State Key Laboratory of Mechanical Behavior and System Safety of Traffic Engineering Structures, Shijiazhuang Tiedao University, Shijiazhuang 050043, China
2
Innovation Center for Wind Engineering and Wind Energy Technology of Hebei Province, Shijiazhuang 050043, China
3
School of Civil Engineering, Shijiazhuang Tiedao University, Shijiazhuang 050043, China
4
Shijiazhuang Institute of Architectural Design Co., Ltd., Ministry of Education, Shiiazhuang 050011, China
5
School of Metallurgy, Northeastern University, Shenyang 110819, China
*
Authors to whom correspondence should be addressed.
Metals 2023, 13(12), 1943; https://doi.org/10.3390/met13121943
Submission received: 30 October 2023 / Revised: 20 November 2023 / Accepted: 24 November 2023 / Published: 27 November 2023

Abstract

:
Argon injection is usually applied in the continuous casting mold to prevent submerged entry nozzle (SEN) clogging. However, the stability of the slag–steel interface is affected by the injected gas, even leading to the formation of the slag eye. A computational fluid dynamics–discrete bubble model–volume of fluid (CFD-DBM-VOF) model is established to predict the argon–slag–steel–air four-phase flow in the continuous casting mold. The bubble behavior is treated with the Lagrangian approach considering bubble coalescence and breakup. The movement behavior of the slag–steel interface is analyzed with and without argon blowing, validated with the water model. The results show that the large bubble tends to float up into the slag–steel interface near the SEN with argon injection, resulting in fluctuations in the slag–steel interface near the SEN. The bubble distribution, flow field, fluctuation height of the slag–steel interface and configuration of the slag eye in the mold are analyzed. Furthermore, the effect on the casting speed, gas flow rate and thickness of the slag layer is obtained based on the result. The mathematical prediction results showcase a combination of well-established phenomena and newly generated predictions.

1. Introduction

The continuous casting mold is the final component responsible for controlling the cleanliness of liquid steel and is referred to as the heart of continuous casting equipment [1,2]. Periodically, slag is added to the top surface of the mold, where it sinters and melts to form a protective liquid slag layer, serving the purpose of trapping inclusions. The interface between slag and steel in an argon-blowing crystallizer exhibits a complex four-phase flow behavior involving argon bubble, steel, slag and air [3]. The molten steel in the main stream enters the mold from the submerged nozzle and impacts the narrow surface of the mold at a certain dip angle. It then divides into two circulating flows. Among them, the upward flow of molten steel impacts the protective slag on the upper surface of the mold along the narrow surface, forming the upper rotation zone. The impact of molten steel on the slag layer causes it to be displaced, and in severe cases, it can even expose the liquid steel directly to the air, forming a “slag eye”, which can lead to secondary oxidation and heat loss in the liquid steel. The region of the slag eye is in direct contact with the protective slag, and any changes in this region can affect the melting, heat transfer and lubrication of the mold’s protective slag. To improve the quality of the casting billet, it is crucial to control the formation of exposed slag eyes.
In the continuous casting process, argon gas is commonly injected through the submerged entry nozzle (SEN) to prevent nozzle clogging, facilitate mixing and enhance the flotation of non-metallic inclusions from the molten steel [4]. Injecting argon gas reduces the density of the fluid jet, enhances its buoyancy and causes the jet to curve upward toward the top surface. The characteristics of both the top surface and the upper section of the mold undergo alterations due to changes in argon gas injection. The size distribution of bubbles inside the mold plays a crucial role in this process [5]. Large bubbles tend to float near the SEN, driving the steel to flow upward. Additionally, this effect becomes increasingly pronounced as the size of the bubble increases. Argon gas is introduced into the submerged entry nozzle (SEN) through the porous refractory located at the upper section of the SEN wall, usually with small and average initial bubble size [6]. Additionally, the bubble size distribution is determined by bubble coalescence and breakup. There are many studies on bubble distribution in the mold conducted with water model experiments and numerical simulations [7,8,9]. Kwon et al. [10] used a water model to study the behavior of bubbles in molds and found that the average bubble diameter increases with a decrease in the water flow rate and with an increase in the gas injection rate. Ramos et al. [3] examined bubble breakup and coalescence in the mold. Additionally, they discovered that the presence of bubbles can effectively prevent the formation of eddy currents typically observed in single-phase liquid flow. To simulate the two-phase flow in the continuous casting mold, there are primarily two approaches available: the Eulerian–Eulerian [11,12] method and the Eulerian–Lagrangian method [5]. Liu et al. [7,13] utilized a combination of population balance equations and the Eulerian–Eulerian two-phase model to simulate poly dispersed bubbly flow during the continuous casting process. The multiple size group (MUSIG) model was employed to obtain bubble size distribution. Yang et al. [14] studied bubble distribution and bubble entrapment by the solidification shell in the mold with a Eulerian–Lagrangian model considering bubble coalescence and breakup.
The occurrence of exposed slag eyes in the mold is a widespread phenomenon [15]. Extensive research has been conducted on the formation of exposed slag eyes using both physical [16] and numerical modeling approaches [17,18]. Water model experiments have been extensively employed in physical modeling to investigate the sizes of slag eyes, as well as to develop various dimensionless expressions for quantifying the exposed slag eye areas [19,20]. For numerical modeling, the study of gas–steel–slag three-phase flow and the behavior of the exposed slag eye typically relies on the volume of fluid (VOF) approach [21]. Additionally, the discrete bubbles are treated with the Eulerian [22] or Lagrangian approach [23]. Cloete et al. [24] developed a mathematical model, which utilizes the discrete phase model (DPM) to characterize bubble transport while employing the VOF model to track the fluctuations in the steel–slag interface without taking into account bubble coalescence and breakup. Liu et al. [25] developed the Lagrangian tracking model in conjunction with an Eulerian multi-phase model to forecast the dynamic behavior of argon–steel–slag–air four-phase flow within the continuous casting mold. The Eulerian method is employed to describe the three phases consisting of molten steel, liquid slag and air situated at the top of the liquid slag layer. Additionally, they investigated the effect of casting speed, gas flow rate and slag layer thickness on the results. While previous researchers have conducted extensive investigations into the motion behavior of the slag–steel interface in the argon-blown continuous casting mold, most have not taken into account the interaction between bubbles (coalescence and breakup). However, such bubble interaction plays a crucial role in determining the size distribution of bubbles, which in turn significantly impacts the motion behavior of the slag–steel interface. Therefore, it is crucial to consider the coalescence and breakup of bubbles in the research investigating the behavior of the slag–steel interface.
The purpose of this paper is to investigate the behavior of bubble transport and the slag–steel interface motion in the continuous casting mold. The paper consists of the establishment of a mathematical model, numerical simulation and result analysis. First, a CFD-DBM-VOF model is established with the advanced bubble coalescence and breakup models to predict the argon–slag–steel–air four-phase flow in the continuous casting mold. Next, the bubble transport and the behavior of the slag–steel interface are analyzed, taking into account the effect of casting speed, gas flow rate and the thickness of the slag layer on the results.

2. Mathematical Model

In this work, the steel–slag–gas three-phase flow (CFD-VOF) is simulated using ANSYS Fluent software. The discrete bubble model (DBM) for discrete argon bubbles is implemented in C language. The interaction of bubbles is modeled by means of the hard sphere model. The coupling between the continuous and discrete phases is achieved through user-defined equations (UDFs) in ANSYS Fluent. This approach enables a more precise and detailed simulation and analysis of the behavior of the three-phase flow in the steel–slag–gas–bubble system.

2.1. Liquid Phase Hydrodynamics

Let f denote the continuous phase excluding the discrete argon bubble (including liquid steel, steel slag, air); then, the mass conservation equation and momentum conservation equation of the continuous phase flow are as follows:
α f ρ f t + · ( α f ρ f u ) = 0
t ( α f ρ f u ) + · ( α f ρ f u f u f ) = p + · [ μ eff α f ( u + u T ) ] + α f ρ f g + f σ + f b l
α f represents the volume fraction of the continuous phase. ρ f represents the density of the continuous phase. u represents the average velocity of the continuous phase. p represents the pressure. μ eff is the fluid effective viscosity coefficient, where μ eff = μ + μ t . μ represents the molecular viscosity. μ t represents the turbulent viscosity. f σ represents the surface tension. f b l represents the interaction force between discrete gas bubbles and the continuous phase.
In this study, the RNG k-ε model is employed to simulate turbulent flow.
μ t = C μ ρ k 2 ε
The volume of fluid (VOF) model is a numerical method employed to simulate the behavior between multiple incompatible fluids by solving the momentum equation and tracking the volume fraction of each fluid. The VOF model assumes that the volume fraction of the kth fluid in the studied local control volume is denoted by α (where k = g represents the gas phase; k = l represents the molten steel; and k = s represents the liquid protective slag). Furthermore, it ensures that for each phase in the local control volume of the fluid, the sum of the volume fractions of the fluid phase in each local control volume is satisfied:
f = k n α k = 1
In this paper, the effect of the volume of the argon bubble on the continuous phase is taken into account. Therefore, the volume density of the continuous phase, excluding the occupied volume of the argon bubble, can be expressed as follows:
ρ f = α g ρ g + α l ρ l + α s ρ s
The expression for viscosity is as follows:
μ f = α g μ g + α l μ l + α s μ s
In this paper, the continuum surface force (CSF) model is utilized to account for the influence of interphase surface tension. It is incorporated into the momentum equation as a volume force, and the expression is as follows:
f σ = V σ κ α d V = σ κ k ( α k ) V k
σ is the surface tension coefficient; V k represents the volume of control volume; and κ k denotes the average curvature of the free surface, which is defined as
κ k = ( · n ^ ) = [ · ( α | α | ) ]
n ^ represents the unit vector perpendicular to the surface.

2.2. Bubble Dynamics

2.2.1. Bubble Tracking

A discrete bubble model was established to treat discrete argon bubbles. The bubble motion is obtained by solving Newton’s second law for each individual bubble. The equation of motion for this model is expressed as follows:
f l b = m b d u b d t = F lb D + F lb P + F lb VM + F lb LF + F lb B + F lb G
On the right side of the equation, the terms correspond to different forces. They are the drag force, pressure gradient force, virtual mass force, lift force, buoyancy force and gravity, respectively. The expression is as follows:
F lb D = C D ρ f | u f u b | ( u f u b ) 2 π d b 2 4
F lb P = 1 6 π d b 3 ρ f d u f d t
F lb VM = 1 6 π d b 3 C VM ρ f d d t ( u f u b )
F lb L = 1 6 π d b 3 C L ρ f ( u f u b ) × ( × u f )
F lb B + F lb G = 1 6 π d b 3 ( ρ b ρ f ) g

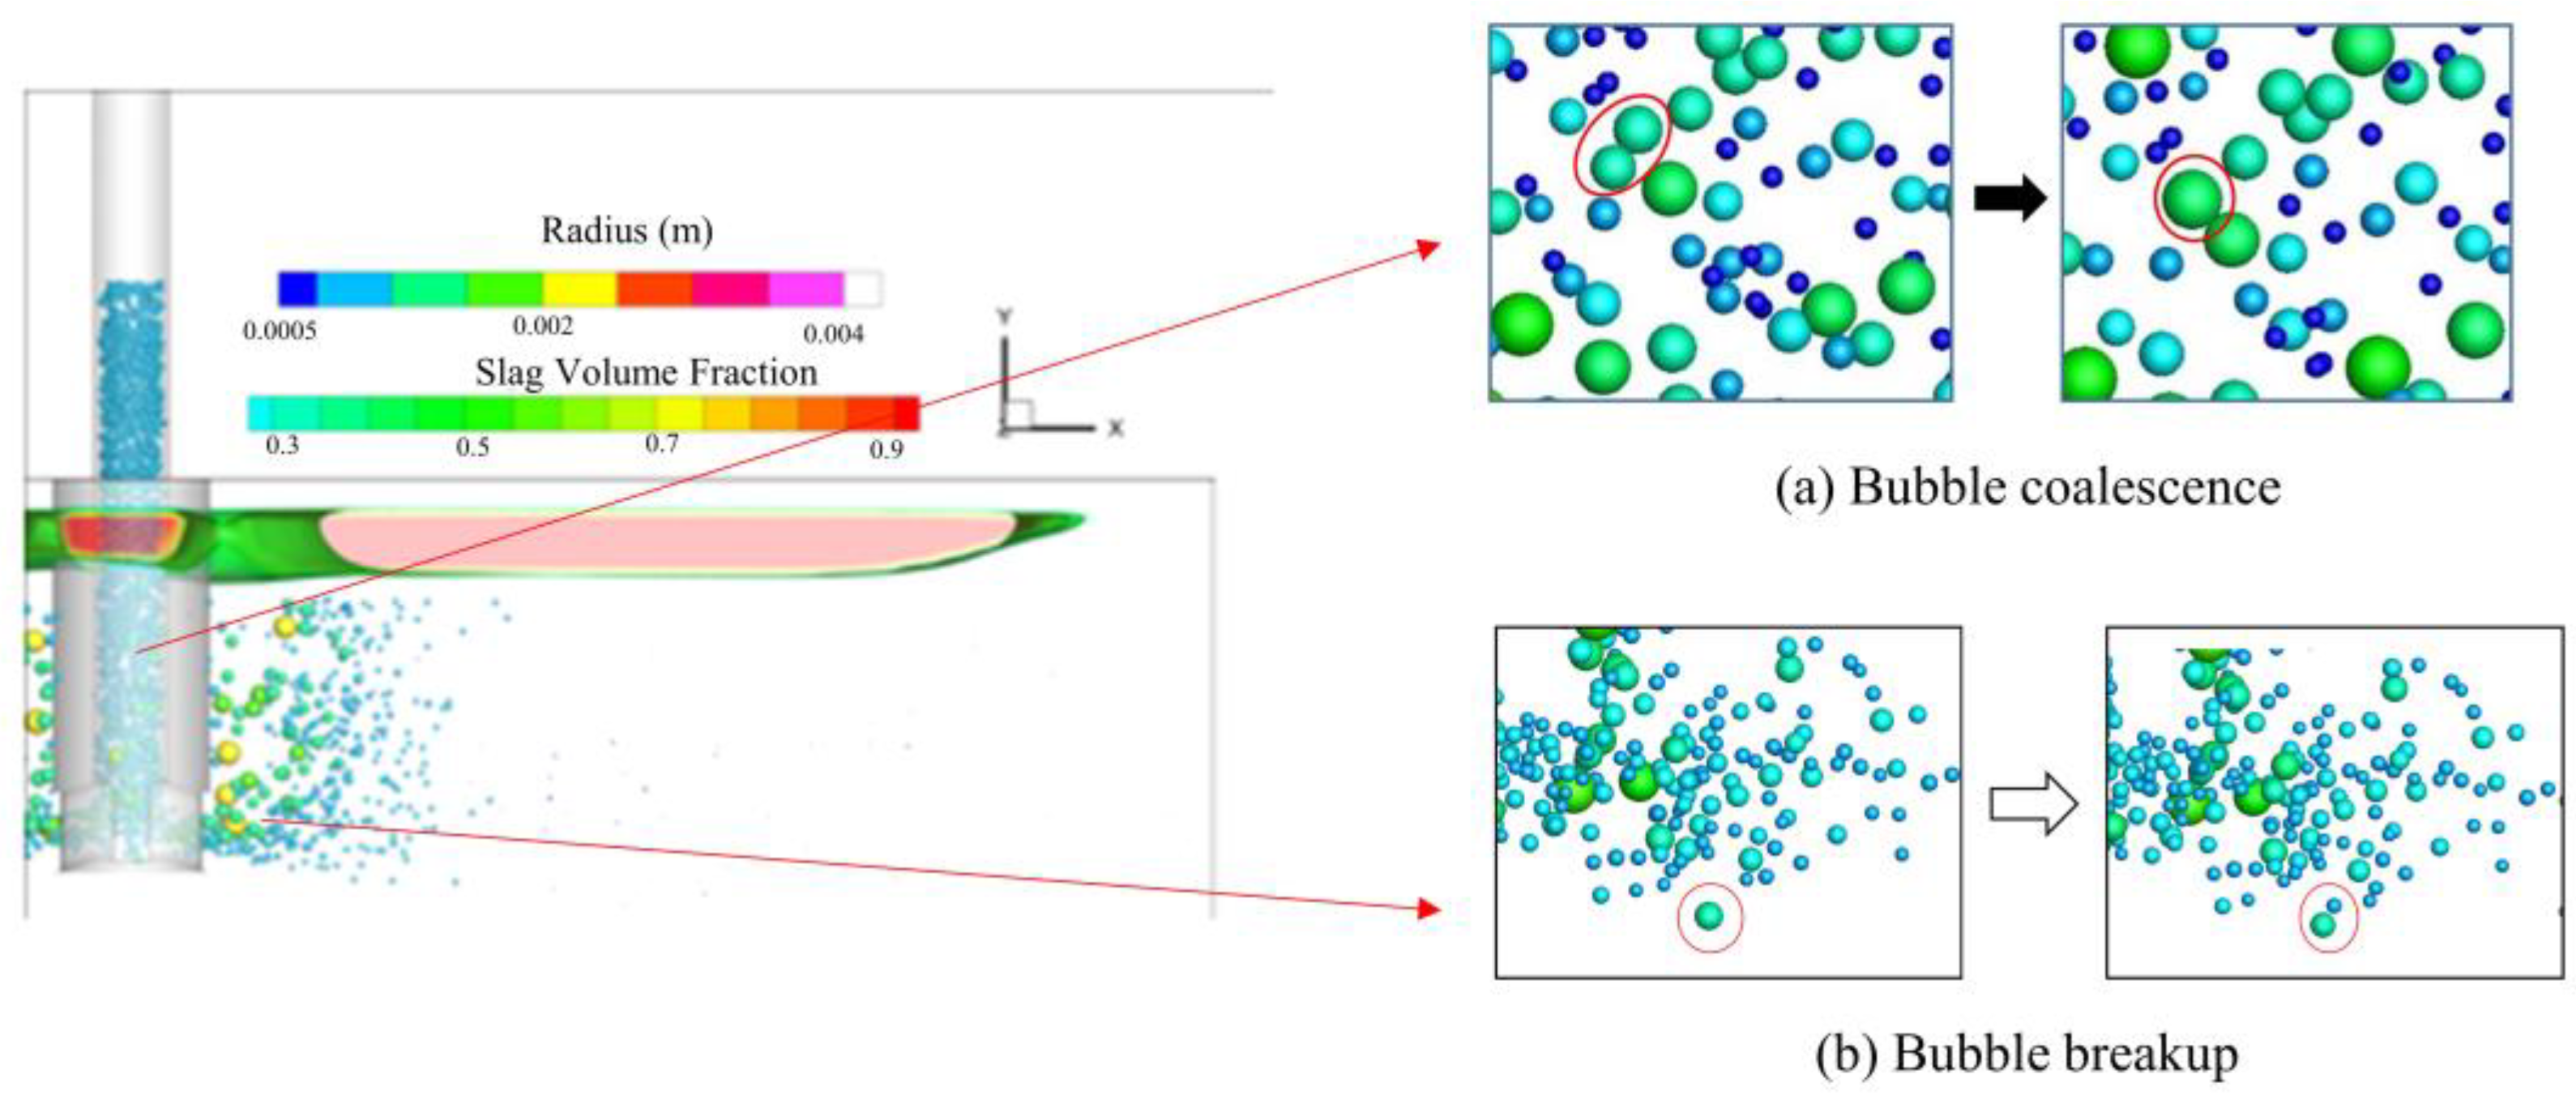
2.2.2. Bubble Coalescence and Breakup Models

The bubble coalescence and breakup model established by Yang et al. [5] was employed in this paper. The hard sphere model was employed to resolve bubble collision. A bubble coalescence model taking into account the size and off-center degree of the bubbles was utilized to determine whether bubble collision leads to coalescence or not. With the equivalent diameter of two colliding bubbles smaller than 2.3 mm, the bubbles will coalesce when W e ( 1 B 2 ) < 0.16 + B / 24 . If the equivalent diameter of two colliding bubbles is larger than 2.3 mm, the two bubbles will coalesce if the relative approach velocity exceeds 0.11 m/s [26].
W e = r e v r 2 ρ l σ
where We is the relative Weber number; re = 2r1r2/(r1 + r2) is the equivalent radius of two interacting bubbles; vr is the relative velocity of bubbles; B is the off-center degree.
The bubble breakup model utilized in this study is based on the model proposed by Yang et al. [9]. In a turbulent two-phase flow, a bubble will undergo breakup and divide into two daughter bubbles if the uneven pressure acting on the bubble surface exceeds the surface force. The breakup of a bubble occurs when it surpasses a maximum stable size [27].
d max = W e crit 3 / 5 σ 3 / 5 ρ l 3 / 5 ε 2 / 5
where W e crit is the critical Weber number for bubble breakup with a value of 0.53; ε represents the turbulent kinetic energy dissipation rate; σ refers to the gas–liquid surface tension. In addition to the bubble breakup criterion, another vital parameter is the volume fraction of the daughter bubble. The volume fraction of the daughter bubble follows a U-shaped distribution pattern, which is well suited for the tanh function in steel continuous casting systems.
f bv = 1 2 [ 1 + tanh ( 14.4 x 7.2 ) ]
where f bv is the volume fraction of the daughter bubble; x is a random variable from 0 to 1.

2.2.3. Simulation Details

To quantitatively validate the mathematical model, a benchmark case is constructed based on the research outlined in a paper by Liu et al. [22]. The computational domain and boundary conditions are illustrated in Figure 1. Considering the complexity of the structure of the submerged nozzle and the need for accurate and stable calculation results, a grid local refinement technique was utilized for the area near the slag–steel interface and the local region of the submerged nozzle. The total numerical grid of the domain is about 300,000 with the grid independence verification. The fluid properties and operating conditions utilized in the water model and numerical simulation are presented in Table 1. The mesh size of the slag–steel interface is extremely small, which can result in significant errors when coupled with the bubbles in the Lagrangian structure. To address this issue, a simulation approach is employed where the bubbles disappear upon contact with the slag–steel interface.

3. Validation

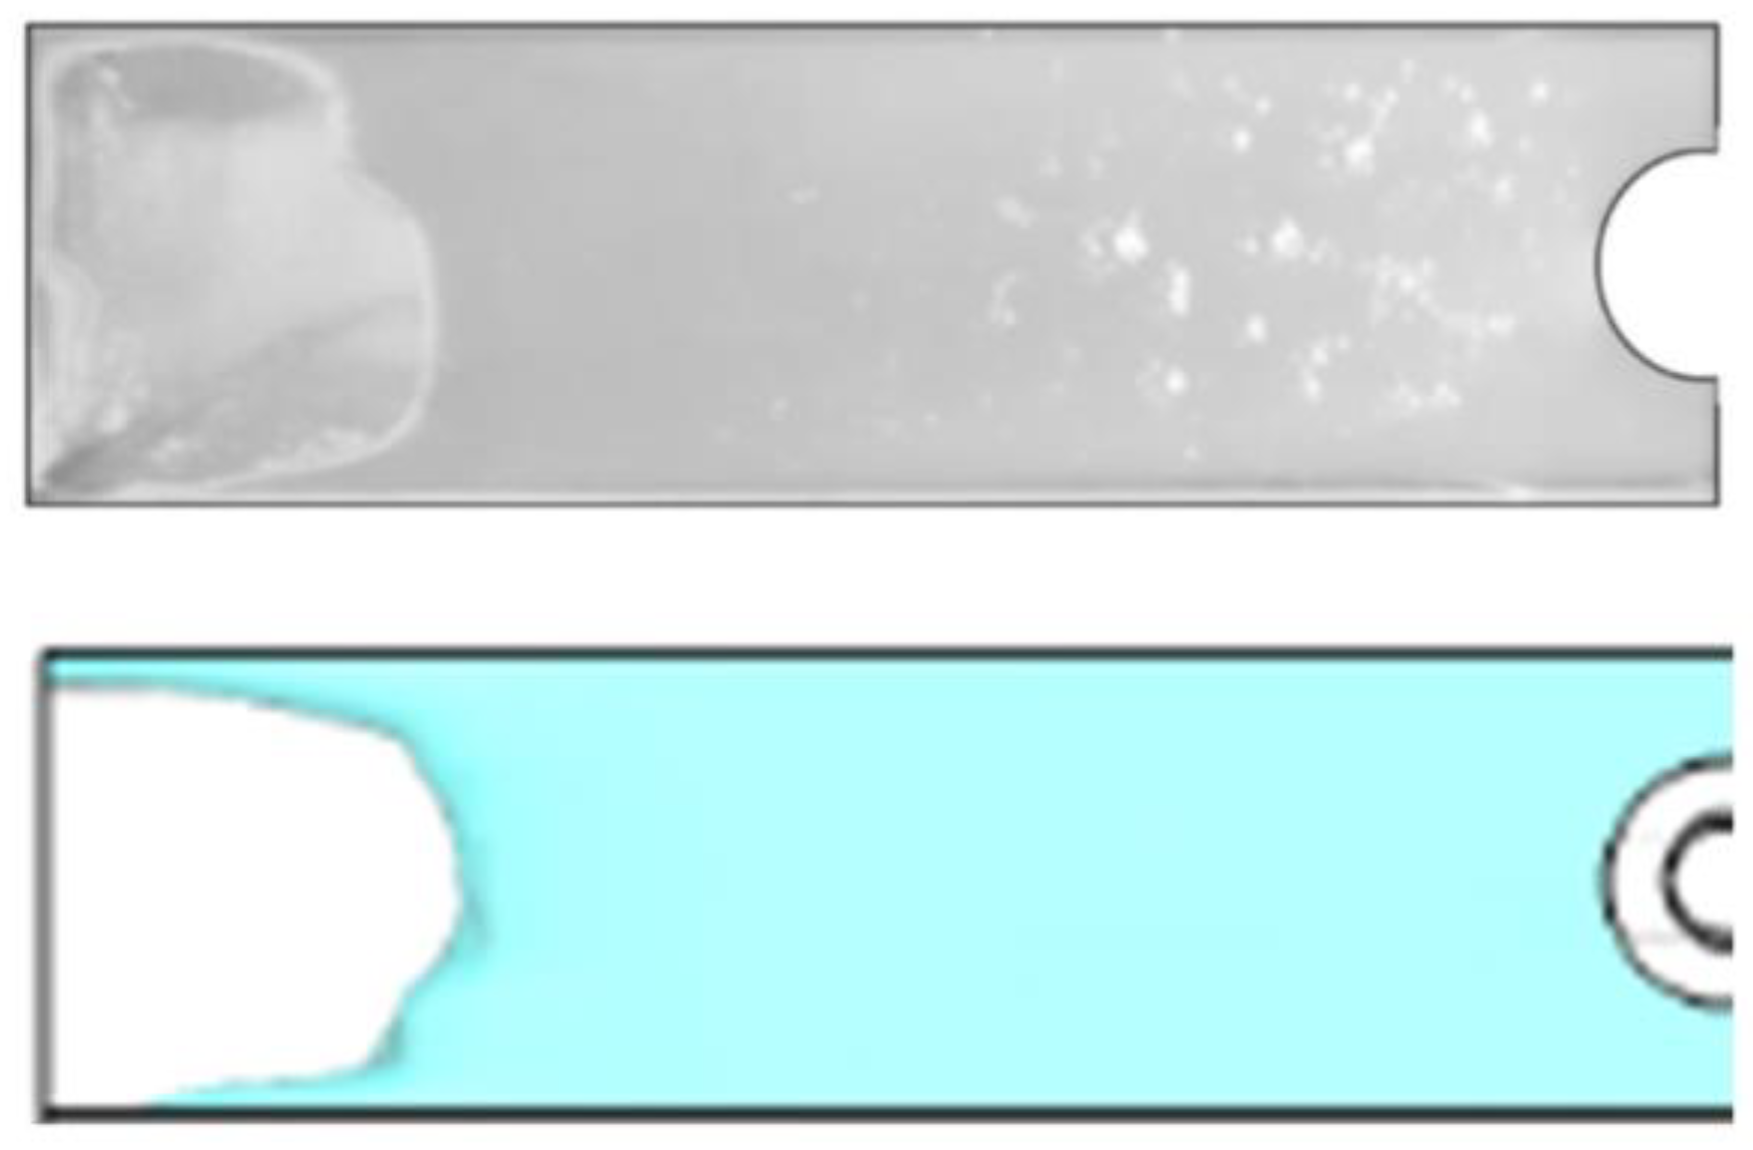
3.1. Movement Behavior of Slag–Steel Interface without Argon Blowing

Figure 2 illustrates the comparison of slag eyes on the top surface of the mold under the conditions of a casting speed of 0.6 m/min and an initial slag layer thickness of 10 mm between the experimental water model and the mathematical simulation. In the figure, it is evident that a slag eye with a semi-arc-shaped edge is formed at the narrow face of the mold. This can be attributed to the impact of the molten steel upon exiting the water outlet, which leads to an upward flow and interaction with the slag layer, ultimately resulting in the formation of slag eyes. The formation of slag eyes is caused by the impact of the shear flow of the flow field in the upper gyration zone on the slag–steel interface. It can be clearly observed in the figure that the position and area of the slag eyes obtained in the experiment match well with those obtained in the simulation, which shows that the model can reliably simulate the molten steel flow field and movement behavior of the slag–steel interface under the condition without argon blowing.

3.2. Bubble Distribution and Movement Behavior of Slag–Steel Interface with Different Argon Blowing Rates

Figure 3 shows the numerical simulation results of the distribution of bubbles and the fluctuation of slag in the mold, which shows a good agreement with the outcomes of the physical experiment obtained by the Liu [22]. From Figure 3, it can be found that the bubbles in the upper part of the SEN are with the a relatively uniform size. And then, some small bubbles coalescence into the large ones, as shown in Figure 3a. The phenomenon of bubble breakup usually occurs near the SEN port, as shown in Figure 3b. From the figure, it can be observed that larger bubbles rise towards the vicinity of the SEN, whereas smaller bubbles are transported to a position further away from the SEN. The slag layer on the narrow surface experiences significant fluctuations, with a thin layer of slag touching the narrow surface that gradually thickens at a distance of one-third from the narrow surface. The bubbles near the SEN drive the steel to flow upward, resulting in an impact on the slag layer near SEN. As depicted in the figure, the slag near the nozzle exhibits substantial fluctuations, which contrasts with condition without argon blowing.
Figure 4 illustrates the distribution of slag eyes at the top of the mold under two conditions of without and with argon blowing. In the figure, it is evident that there is an occurrence of slag eyes near the SEN when argon blowing is introduced, while the area of slag eyes near the narrow surface decreases in comparison to the case without argon blowing. The blowing of argon gas slows down the circulating flow rate in the upper gyratory region, thereby reducing the impact force on the slag layer near the narrow face and resulting in a reduction in the slag eye at the narrow face. Conversely, the upward flow strand driven by large bubbles near the SEN impacts the slag layer, leading to the formation of slag eyes near the SEN. This indicates that argon blowing can reduce the area of the slag eye near the narrow face, but it also causes the formation of the slag eye near the SEN. Figure 4 also demonstrates that the simulation results for the morphology of the slag eye align well with the results obtained from the water model under the condition of argon blowing.

4. Results and Discussion

The casting speed, gas blowing rate and slag layer thickness have an impact on the flow of multi-phase flow and the movement of the slag–steel interface in the mold. Therefore, the effects of various operating parameters on the flow field, bubble distribution and the behavior of slag–steel interface are analyzed in this part.

4.1. Effect of Casting Speed

Casting speed is a vital production index in the continuous casting process, wherein higher casting speed implies enhanced productivity. However, high casting speed often leads to increased slag entrapment and internal defects. In order to study the impact of casting speed on bubble distribution in the mold, three different casting speeds—with all the other process parameters, i.e., an argon blowing rate of 0.8 L/min and slag thickness of 10 mm, kept constant—were simulated.
Figure 5 and Figure 6 illustrate the macroscopic distribution of bubbles, the shape of the slag–steel interface and the molten steel flow field in the mold with three different casting speeds. According to Figure 5, it is observed that the distribution range of bubbles expands as the casting speed increases, while the size of the bubbles decreases with the higher casting speed. This occurrence can be explained by the fact that the critical breakup size of bubbles decreases as a result of the increased turbulence associated with higher casting speeds, resulting in higher generation of small bubbles. Additionally, greater liquid velocity exerts a stronger drag force on bubbles, causing bubbles to be carried to further regions, resulting in a wider distribution range of bubbles. These observations highlight the complex interplay between casting speed, bubble behavior and molten steel flow in the continuous casting process.
As mentioned, more large bubbles are formed with a lower casting speed in the mold. Due to the buoyancy effect, large bubbles rise quickly near the nozzle, resulting in a significant upward flow with a higher rate of molten steel under the lower casting speed, as shown in Figure 6. The high-speed upward flow of liquid steel near the nozzle exerts a greater impact on the slag layer, leading to substantial fluctuations in the slag–steel interface and the formation of significant slag eyes. As the casting speed increases, the distribution of bubbles becomes more dispersed with the reduction in large bubbles. This causes a slower upward flow velocity near the SEN, reducing the impact on the slag layer, resulting in reduced fluctuation in the slag–steel interface. In Figure 6, it is also evident that as the casting speed increases, the vertical upward circulation flow rate of the liquid steel after impacting the narrow side increases. During the subsequent horizontal movement of the liquid steel, the influence of horizontal shear forces gradually intensifies. As a result, the slag layer near the narrow surface is pushed aside and accumulates in the direction of the water outlet, leading to the formation of larger slag holes. It can also be observed in Figure 6 that the presence of slag eyes near the narrow surface causes the upper part of the liquid steel to be at the same elevation as the slag layer. This accumulation of steel slag obstructs the path of the upward circulating flow and restricts its range.
Figure 7 illustrates the fluctuation height of the slag–steel interface in the mold at various casting speeds. As depicted in the figure, an increase in casting speed leads to a higher fluctuation height of the liquid surface near the meniscus, specifically increasing from 0.645 mm at a casting speed of 0.6 m/min to 6.368 mm at 0.7 m/min, and further to 6.657 mm at 0.8 m/min. When the casting speed increases from 0.7 m/min to 0.8 m/min, there is a slight increase in the fluctuation height of the slag–steel interface near the narrow surface. However, near the SEN of the mold, the fluctuation height decreases as the casting speed increases. For instance, it decreases from 12.015 mm at 0.6 m/min at the immersion water nozzle of the mold, then further reduces to 10.221 mm at 0.7 m/min and finally to 8.067 mm at 0.8 m/min. The highest point of the slag–steel interface fluctuation occurs near the submerged nozzle, while the lowest point is distributed from the narrow surface to approximately one-third of the nozzle. The maximum wave height is 12.015 mm, positioned about 20 mm away from the centerline of the water nozzle. Conversely, the lowest height measures −14.017 mm and is situated approximately 177 mm from the centerline of the water nozzle. At this specific location, the slag layer thickness reaches its peak, thereby increasing its vulnerability to slag entrapment caused by the horizontal shear force applied by the liquid steel. When the casting speed is 0.8 m/min, the maximum fluctuation range of the slag–steel interface is 20.032 mm, whereas at a casting speed of 0.6 m/min, the maximum fluctuation range is 18.362 mm. This indicates that, with a constant argon blowing rate, increasing the casting speed can reduce the height of the interface wave near the SEN and gradually decrease the maximum wave height toward the direction of the meniscus.
Figure 8 illustrates the transient slag eye formation on the surface of the mold under various casting speeds. In Figure 8a, it can be observed that compared to the previous condition without argon blowing, the presence of blowing significantly reduces the occurrence of narrow-face slag eye, indicating that argon blowing has an inhibitory effect on these types of slag eye. At lower casting speeds, larger slag eyes tend to form near the SEN, while smaller ones are observed near the narrow surface. As the cast speed decreases, the area of the slag eye near the water nozzle expands, while the area near the narrow surface decreases. It is worth noting that when the casting speed reaches 0.8 m/min, the slag eye near the SEN disappears. This is because the slag eyes near the narrow surface are mainly caused by the upward reflux formed by the impact of the molten steel jet from the submerged nozzle on the narrow face and the impact on the slag layer. As the casting speed increases, the strength of the upward reflux near the narrow face increases, thereby increasing the impact on the slag layer and making the slag eye larger. The area of the slag eye near the nozzle is formed by the flow field impact caused by the upward floating of bubbles. As the casting speed increases, the number of large bubbles decreases, and the distribution of bubbles becomes more dispersed. Consequently, the upward flow driven by bubbles near the nozzle weakens, leading to a reduction in the area of slag eye.

4.2. Effect of Gas Flow Rate

The gas flow rate plays a significant role in the continuous casting process. A low gas flow rate may not effectively protect against SEN clogging caused by inclusions, while a high gas flow rate can lead to slag entrapment and product defects. To investigate the effect of the gas flow rate, three different argon volume fractions were simulated while keeping other process parameters unchanged (casting speed of 0.8 m/min and slag thickness of 10 mm).
Figure 9 and Figure 10 display the flow field of molten steel, the bubble distribution and the shape of the slag–steel interface in the mold with different gas flow rates. The observations in Figure 9 indicate that changes in the gas flow rate have little effect on the distribution range of bubbles in the mold with the same casting speed. However, it is evident that the number and size of bubbles increase as the gas flow rate increases. With the increase in argon blowing volume, there is an overall increase in the number of bubbles in the mold. The higher concentration of bubbles leads to a greater probability of bubble collision, resulting in a large number of coalescences of smaller bubbles into larger ones. Larger bubbles quickly ascend once out of the water nozzle. The upward movement of liquid steel near the nozzle is driven by more and larger bubbles, resulting in a stronger upward flow of the liquid steel.
In Figure 10, it is evident that an increase in the amount of argon blowing leads to a more pronounced and stranger vertical upward flow field near the water nozzle, which has a greater impact on the slag layer near the nozzle, resulting in intensified fluctuations in the slag–steel interface. In Figure 10, it can be observed that at a gas flow rate of 0.5 L/min, the slag layer near the SEN exhibits minimal fluctuations, and there are no obvious slag eyes. However, when the air volume is increased to 1.1 L/min, the slag layer near the SEN experiences violent fluctuations, and the slag layer becomes exposed. Furthermore, Figure 10 illustrates that as the air volume increases, the jet flushing onto the narrow plane becomes noticeably elevated. Based on the above analysis, it is clear that the introduction of argon gas into the mold causes significant changes in the flow state and distribution characteristics of the molten steel. At the same casting speed, selecting the appropriate amount of argon blowing has a significant impact on controlling the steel flow pattern and the interface between slag and metal in the mold. When the casting speed remains constant, selecting an appropriate amount of argon blowing becomes crucial for determining the flow pattern of molten steel and the behavior of the slag–steel interface in the mold.
Figure 11 illustrates the impact of gas flow rates on the configuration of the slag–steel interface in the mold. As depicted in the figure, as the gas flow rate increases from 0.5 L/min to 1.1 L/min, the wave height near the SEN rises from 2.776 mm to 7.957 mm and then increases further to 12.254 mm. This indicates that argon blowing has a significant effect on the wave height at the slag–steel interface near the SEN. In the figure, it is evident that there are two peaks in wave height near the SEN and the narrow surface. The peak near the water nozzle is a result of the impact from the steel liquid driven by bubbles, whereas the peak near the narrow surface is caused by the upper vortex flow field. When the argon blowing rate is low, the wave height near the narrow surface surpasses the peak near the nozzle. However, as the argon blowing rate increases, this situation undergoes a change. This is attributed to the fact that an increase in the gas flow rate exerts a more substantial influence on the slag–steel interface near the nozzle compared to that near the narrow face. The lowest point of the interface is primarily situated approximately one-third of the distance from the narrow surface toward the SEN, unchanged regardless of variations in the gas flow rate. Furthermore, it can be found that the fluctuation range of the interface (i.e., the difference between the highest and lowest points) expands as the gas flow rate increases, from 14.576 mm at a gas flow rate of 0.5 L/min to 22.132 mm at a gas flow rate of 1.1 L/min.
Figure 12 depicts the transient slag eye formation on the upper surface of the mold with various gas flow rates. Part of the steel liquid flows upward near the SEN with low momentum, which is insufficient to rupture the slag layer, leading to the absence of slag eyes near the SEN. However, with an increase in the gas flow rate, a greater number of bubbles rise to the upper surface near the SEN, resulting in a significant momentum increase on the slag-impact surface. As a result, the cluster of bubbles will exert sufficient force to break open the slag layer and form exposed slag eye, as illustrated in Figure 12b,c. As the argon flow rate increases, the area of exposed slag eyes near the SEN expands, while there is no notable alteration in the area of slag holes near the narrow surfaces. This indicates that argon blowing has a relatively small impact on the outflow nozzle jet.

4.3. Effect of Slag Layer Thickness

Figure 13 and Figure 14 display the flow field of molten steel, the bubble distribution and the shape of the slag–steel interface in the mold with different slag layer thicknesses of 5 mm, 10 mm and 15 mm, respectively. Given the consistent gas flow rate and casting speed in the three operating conditions, Figure 13 reveals an almost negligible variation in the macroscopic distribution of bubbles. However, owing to the lower resistance of a thinner slag layer against the impact of molten steel, a notable level of slag layer exposure is observed near the nozzle and narrow surface when the slag layer thickness measures 5 mm. With the increase in the thickness of the slag layer, the resistance of the slag layer to the impact of molten steel also increases, resulting in a decrease in the degree of bare leakage through the slag layer. It is important to note that with the same gas flow rate, the driving force of the molten steel near the nozzle remains unchanged. Consequently, the thickness of the slag layer does not have any effect on the flow field near the nozzle. However, variations in the thickness of the slag layer can result in a difference in the length of exposed slag layer near the narrow surface. This disparity can lead to some variations in the range of the circulating flow field within the upper vortex zone.
Figure 15 illustrates the effect of slag layer thickness on the shape of the slag–steel interface. The figure clearly demonstrates that the thickness of the slag layer significantly influences the shape of the slag–steel interface. In all three slag thickness scenarios, the apex of the slag–steel interface within the mold appears near the SEN. The maximum wave height increases as the slag layer thickness increases, but the distance between the maximum wave height and the water inlet is almost unaffected by the liquid film thickness. The peak of the wave height increases with liquid film thickness. In the figure, it can be found that the lowest point of the slag–steel interface is close to the narrow face. Additionally, as the slag layer thickness increases, the lowest point of the slag–steel interface transitions from the nozzle toward the narrow face of the mold. Because the lowest point of the slag–steel interface appears at the edge of the slag eye near the narrow face, and as the slag layer thickness increases, the resistance of the slag layer to the flow field impact intensifies, resulting in a reduction in the area of the slag eye and a decrease in the distance between the edge of the slag eye and the narrow surface, which is reflected in Figure 13.
Figure 16 demonstrates that the thickness of the slag layer indeed has a notable influence on the size of the exposed slag hole on the top surface of the mold. When the thickness of the slag layer is 5 mm, the resistance of the slag layer to the impact of steel liquid is relatively weak, allowing the direct jet to penetrate the slag layer from the upper part near the water inlet and narrow surface, resulting in two enormous exposed slag eyes. When the slag layer thickness reaches 15 mm, the turbulent energy at the slag–steel interface is not sufficient to break the slag layer. In this case, the slag layer on the narrow surface is well covered, and the slag layer near the water nozzle only produces minor fluctuations.

5. Conclusions

The CFD-DBM-VOF model was established to simulate the transport of the argon–steel–slag–air four-phase flow in the argon-blowing continuous casting mold. The discrete bubble model was used to deal with the discrete bubble, considering bubble coalescence and breakup in a Lagrangian approach. The fluctuation in the steel–slag–air interface was simulated with the help of the VOF method. Quantitative research was conducted on the effects of operating parameters, such as casting speed, argon blowing rate and slag layer thickness, on bubble distribution, flow field, steel–slag–air interface shape and slag eye morphology in the mold. The conclusions are as follows:
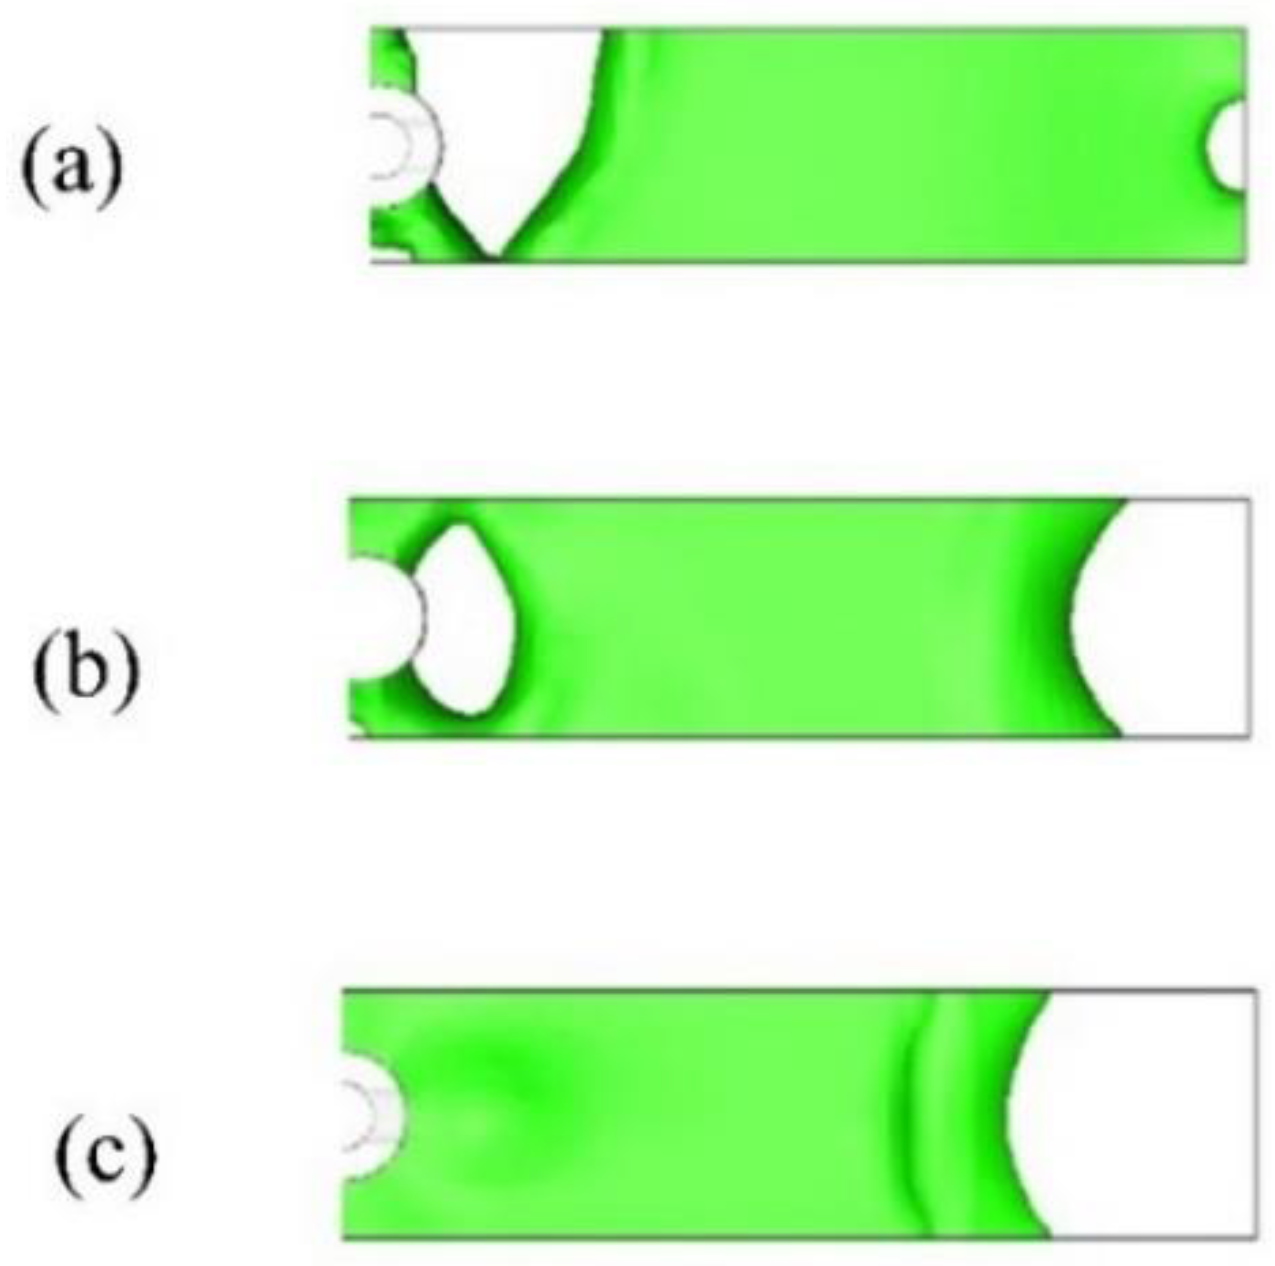
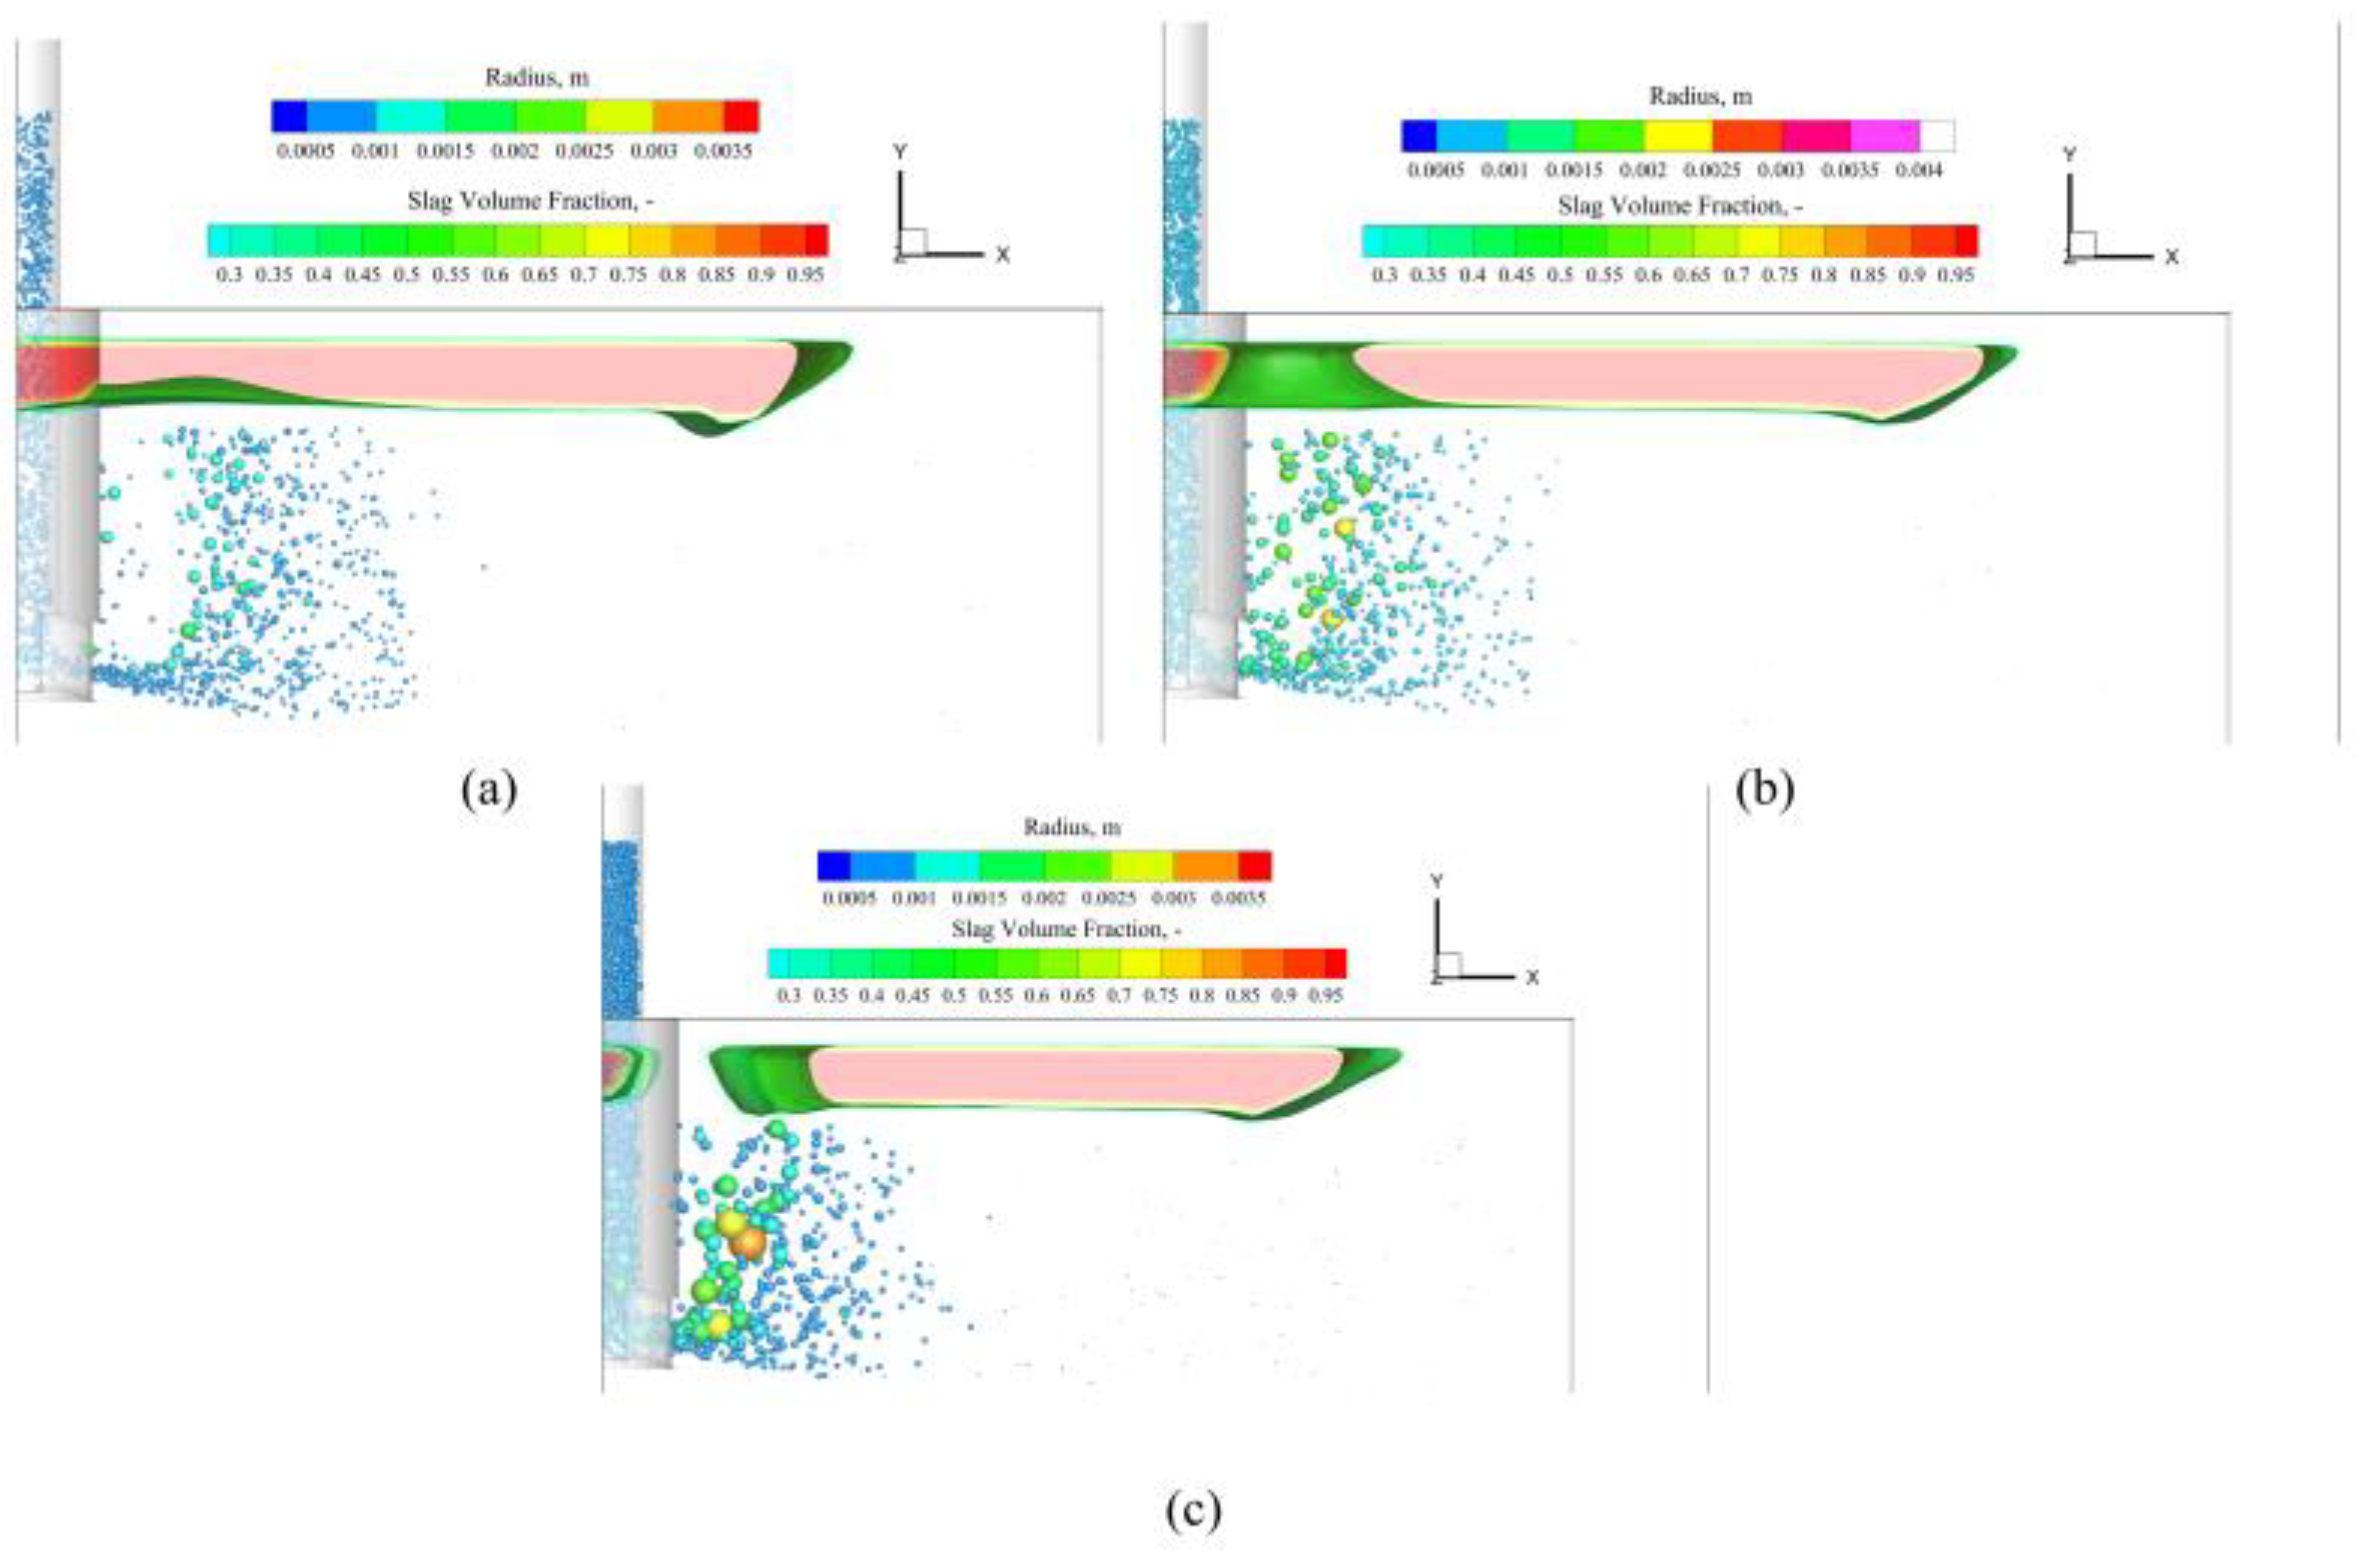
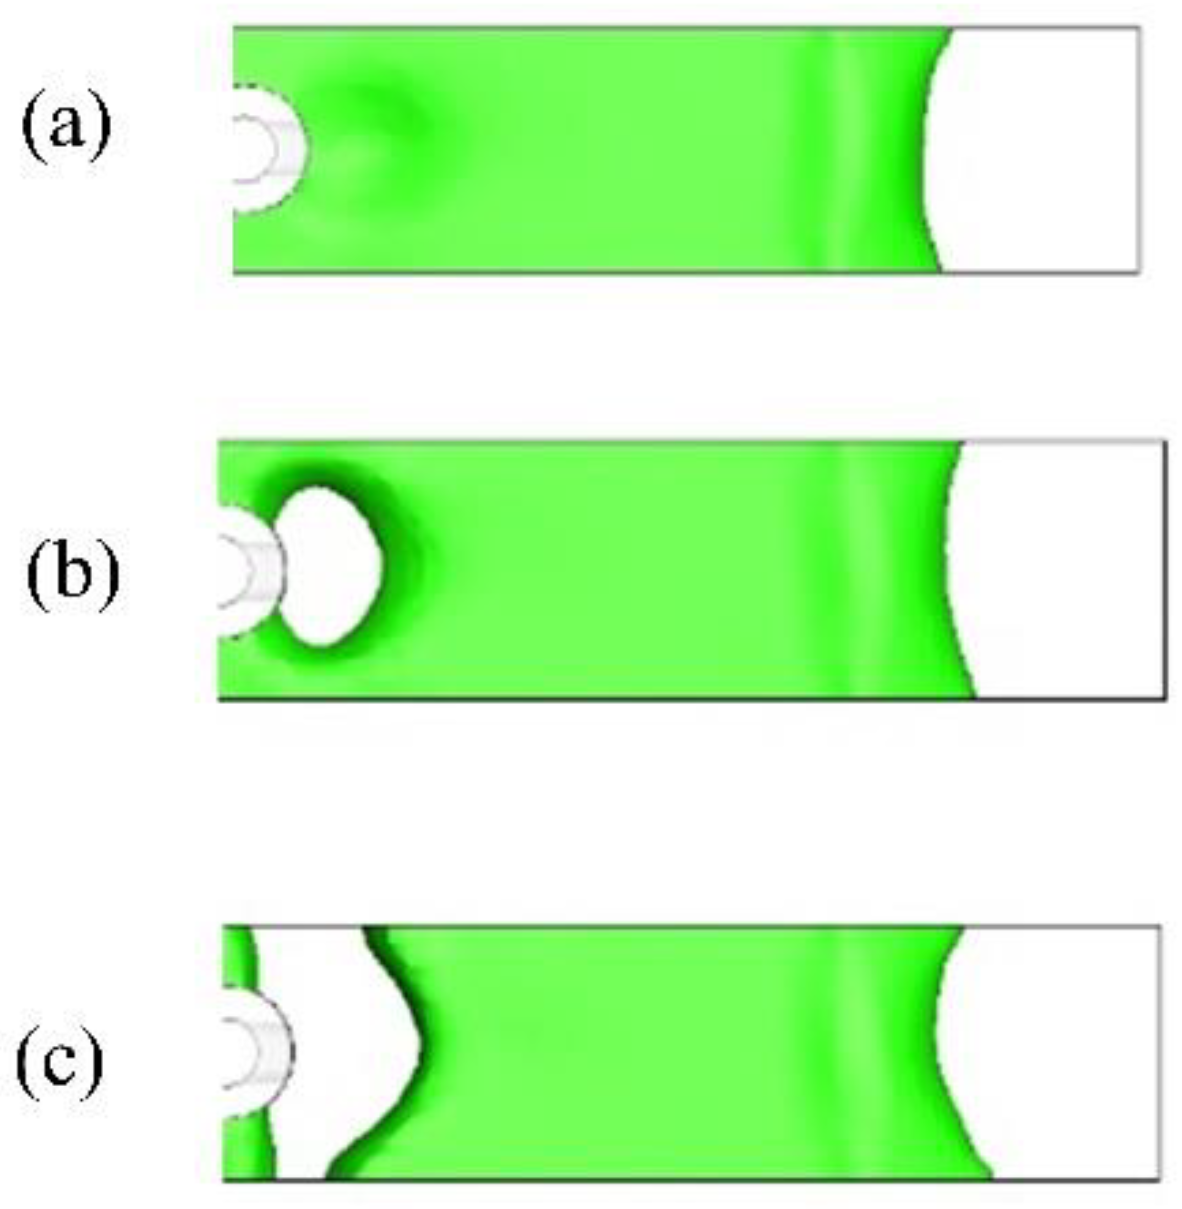
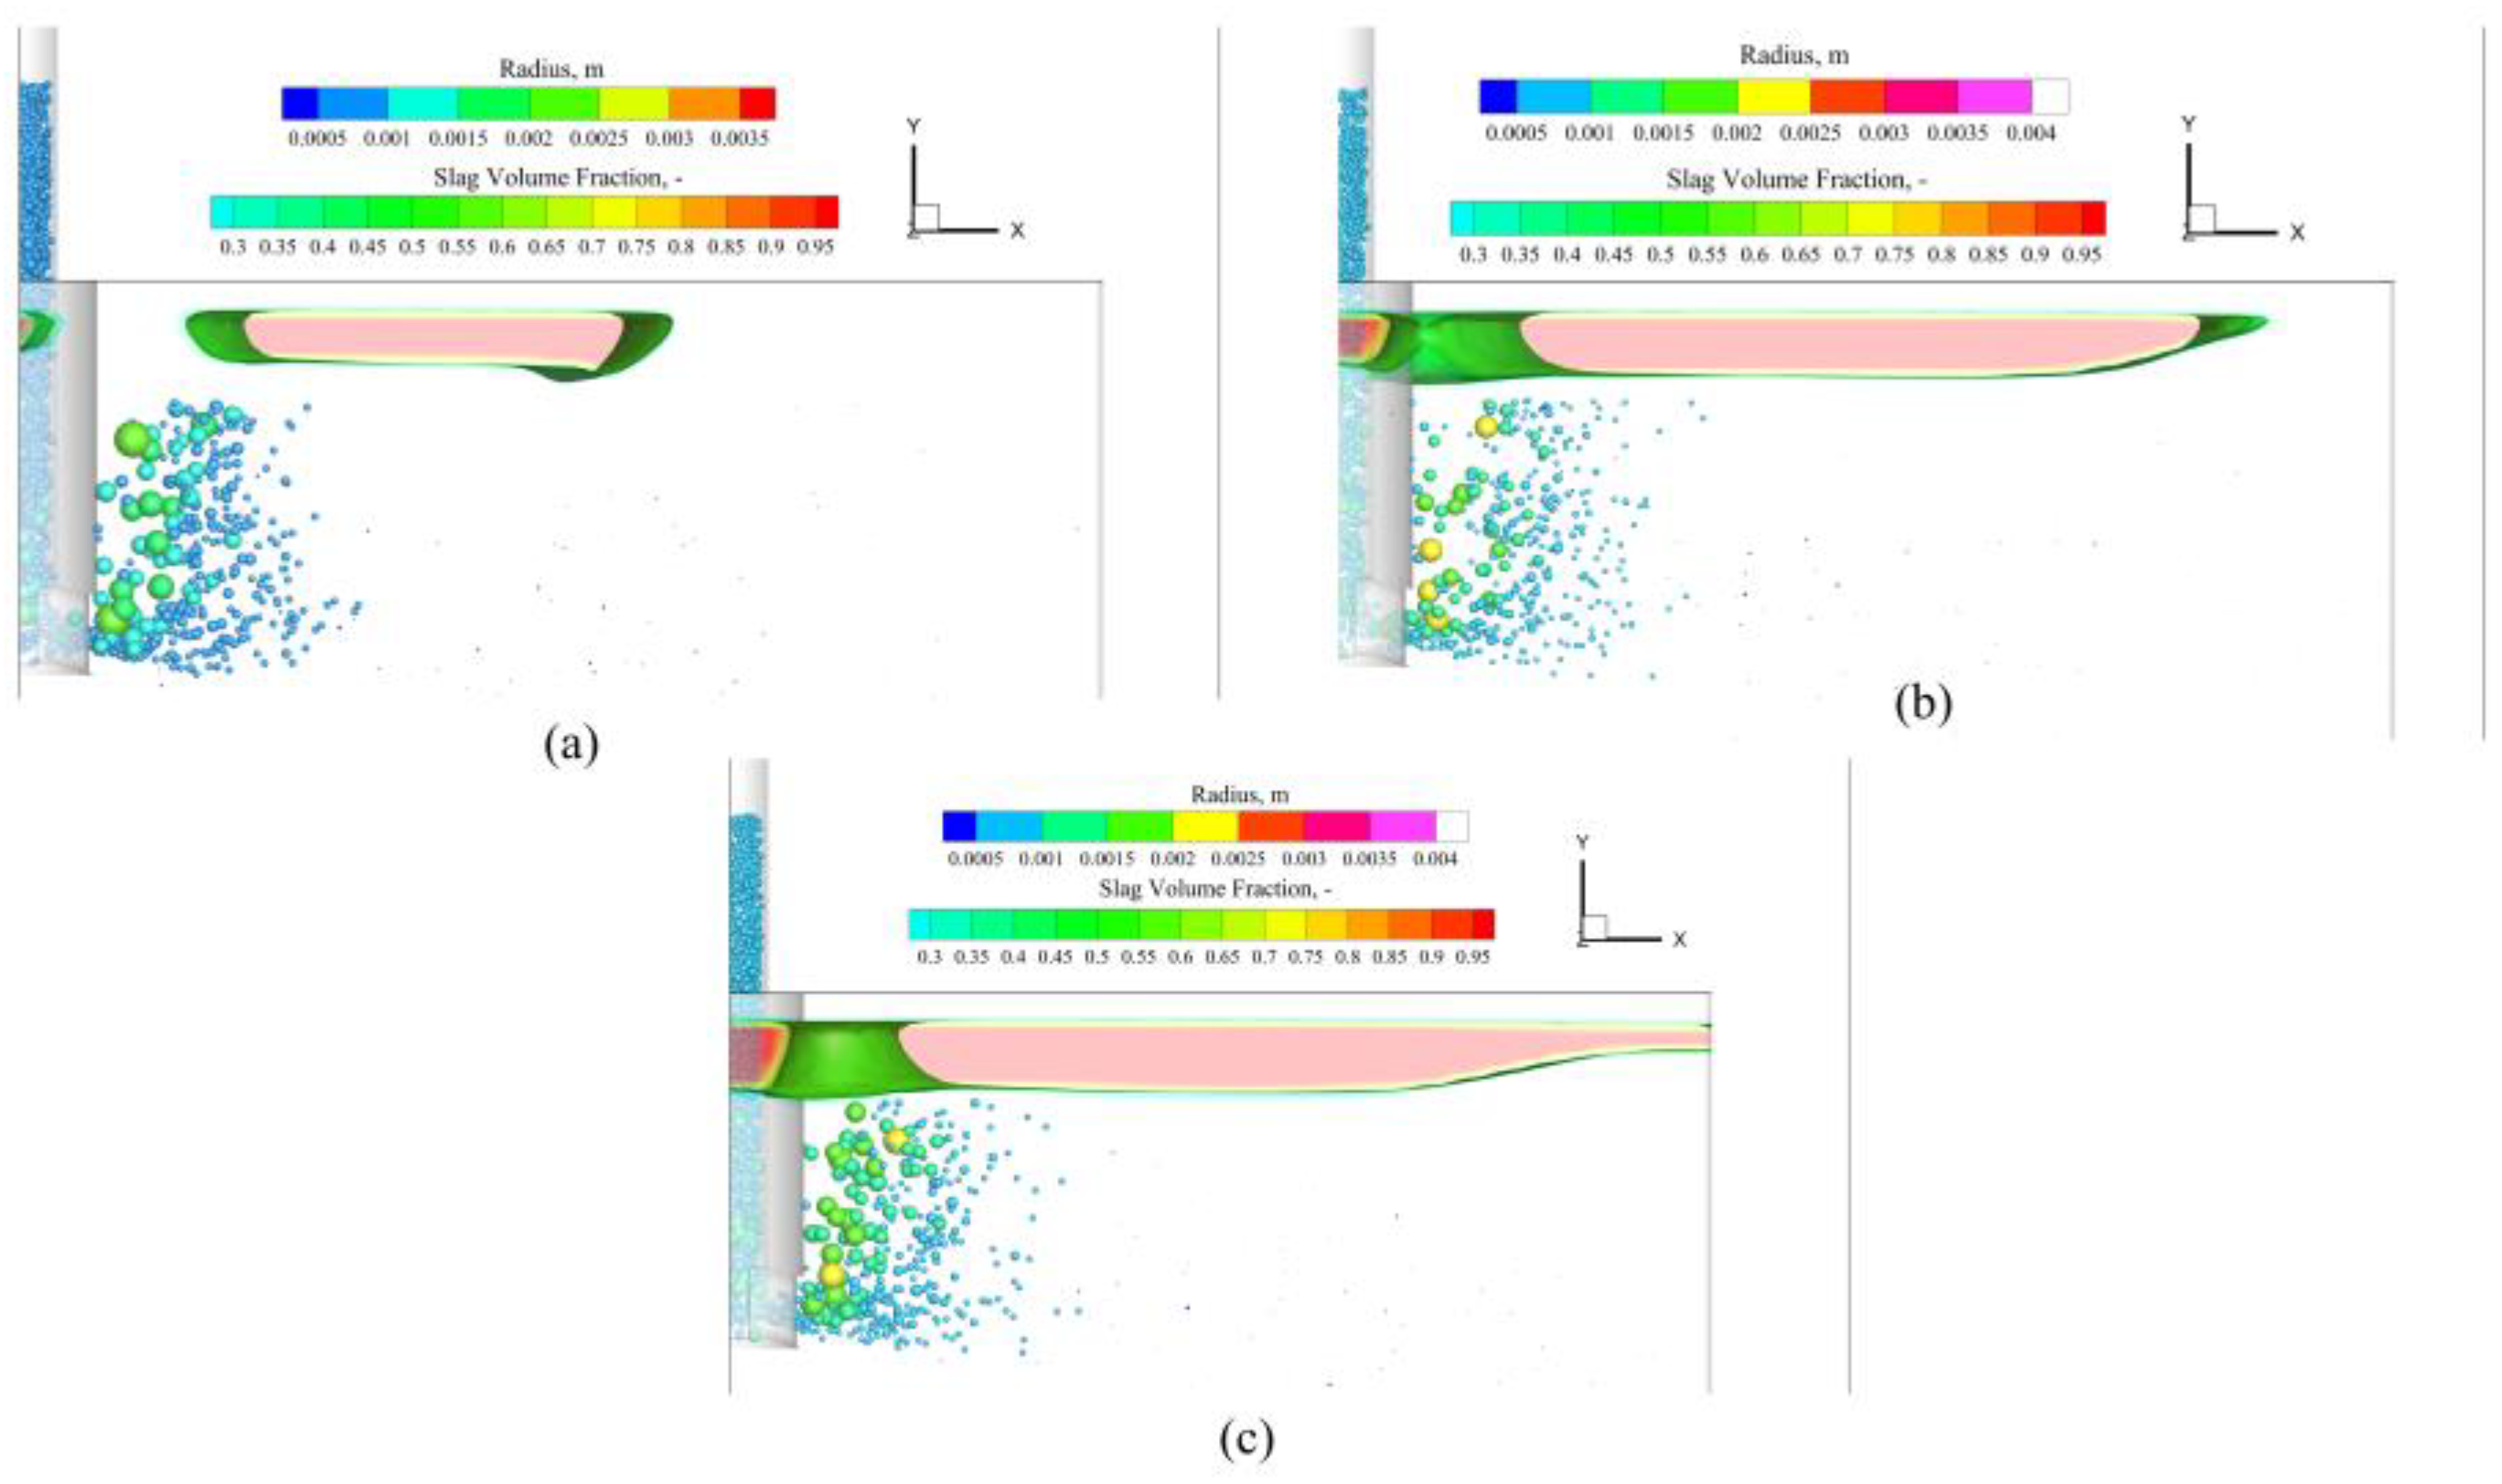
  • Under the condition of no argon blowing, the slag eye on the surface of the mold is positioned near the narrow surface. Under the condition of argon blowing, large bubbles float up to the top surface near the SEN, while small bubbles show up in a location far from the SEN, and slag eyes will emerge in close proximity to both the narrow face and the SEN.
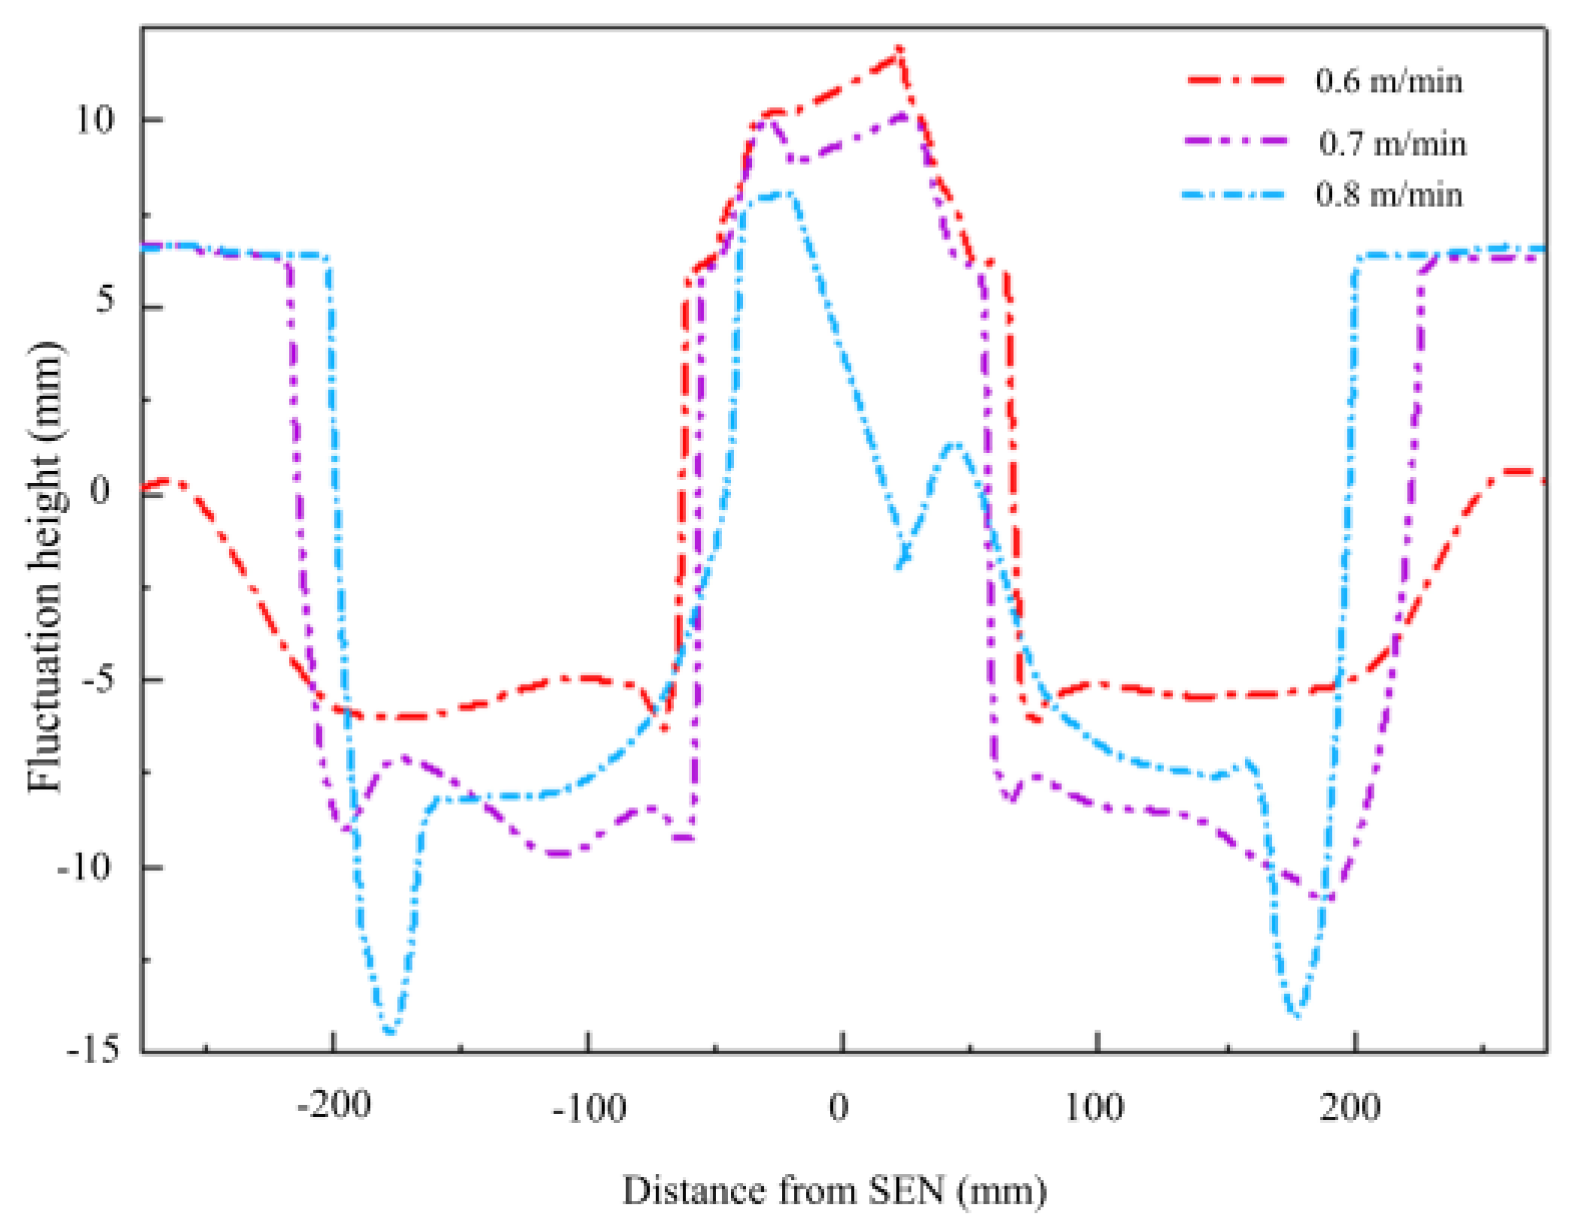
  • Under the condition of argon blowing, with the increase in casting speed, the distribution range of bubbles in the mold is wider, with a decrease in the size of bubbles. Additionally, the wave height of the liquid level increases at the narrow surface, whereas the wave height near the water inlet decreases, with the highest point shifting toward the narrow surface. Furthermore, as the casting speed increases, the area of slag eyes near the narrow face continues to expand, while the area of slag eyes near the SEN decreases, with an overall increase in the total area of slag eyes.
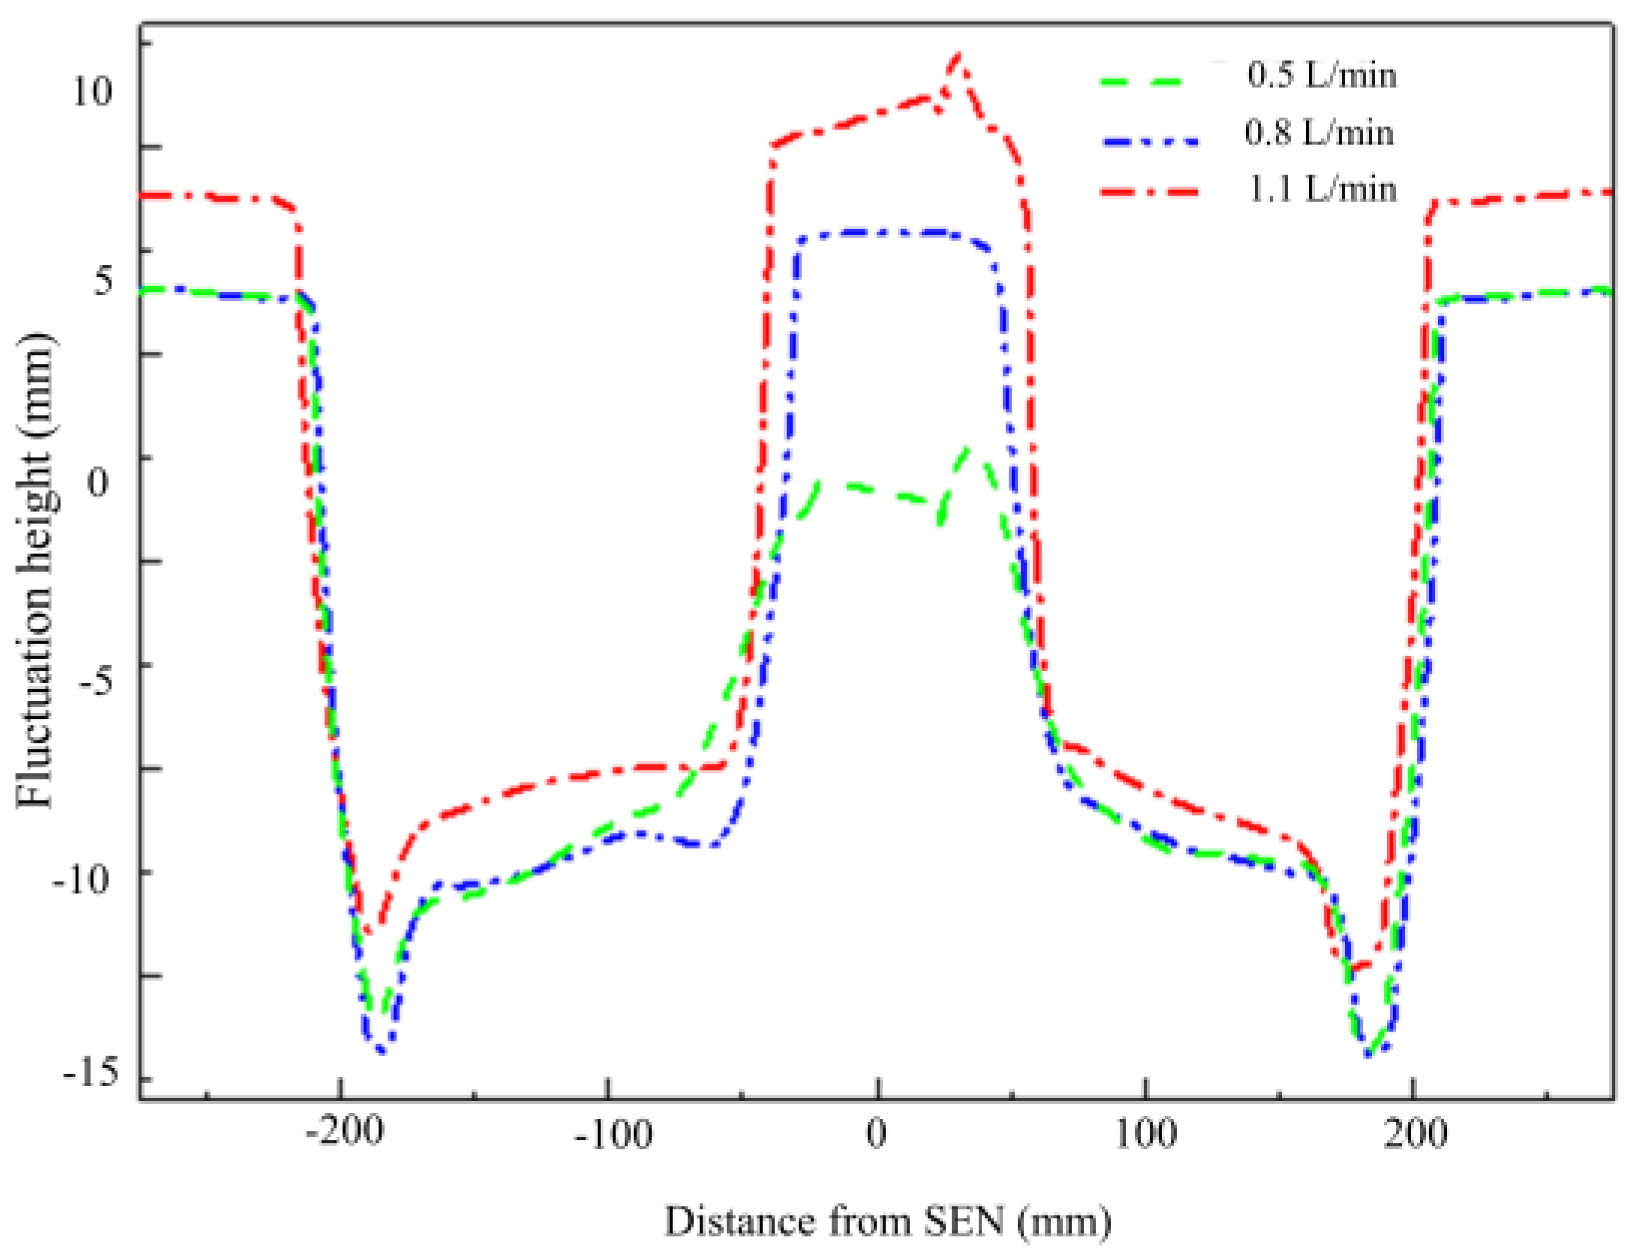
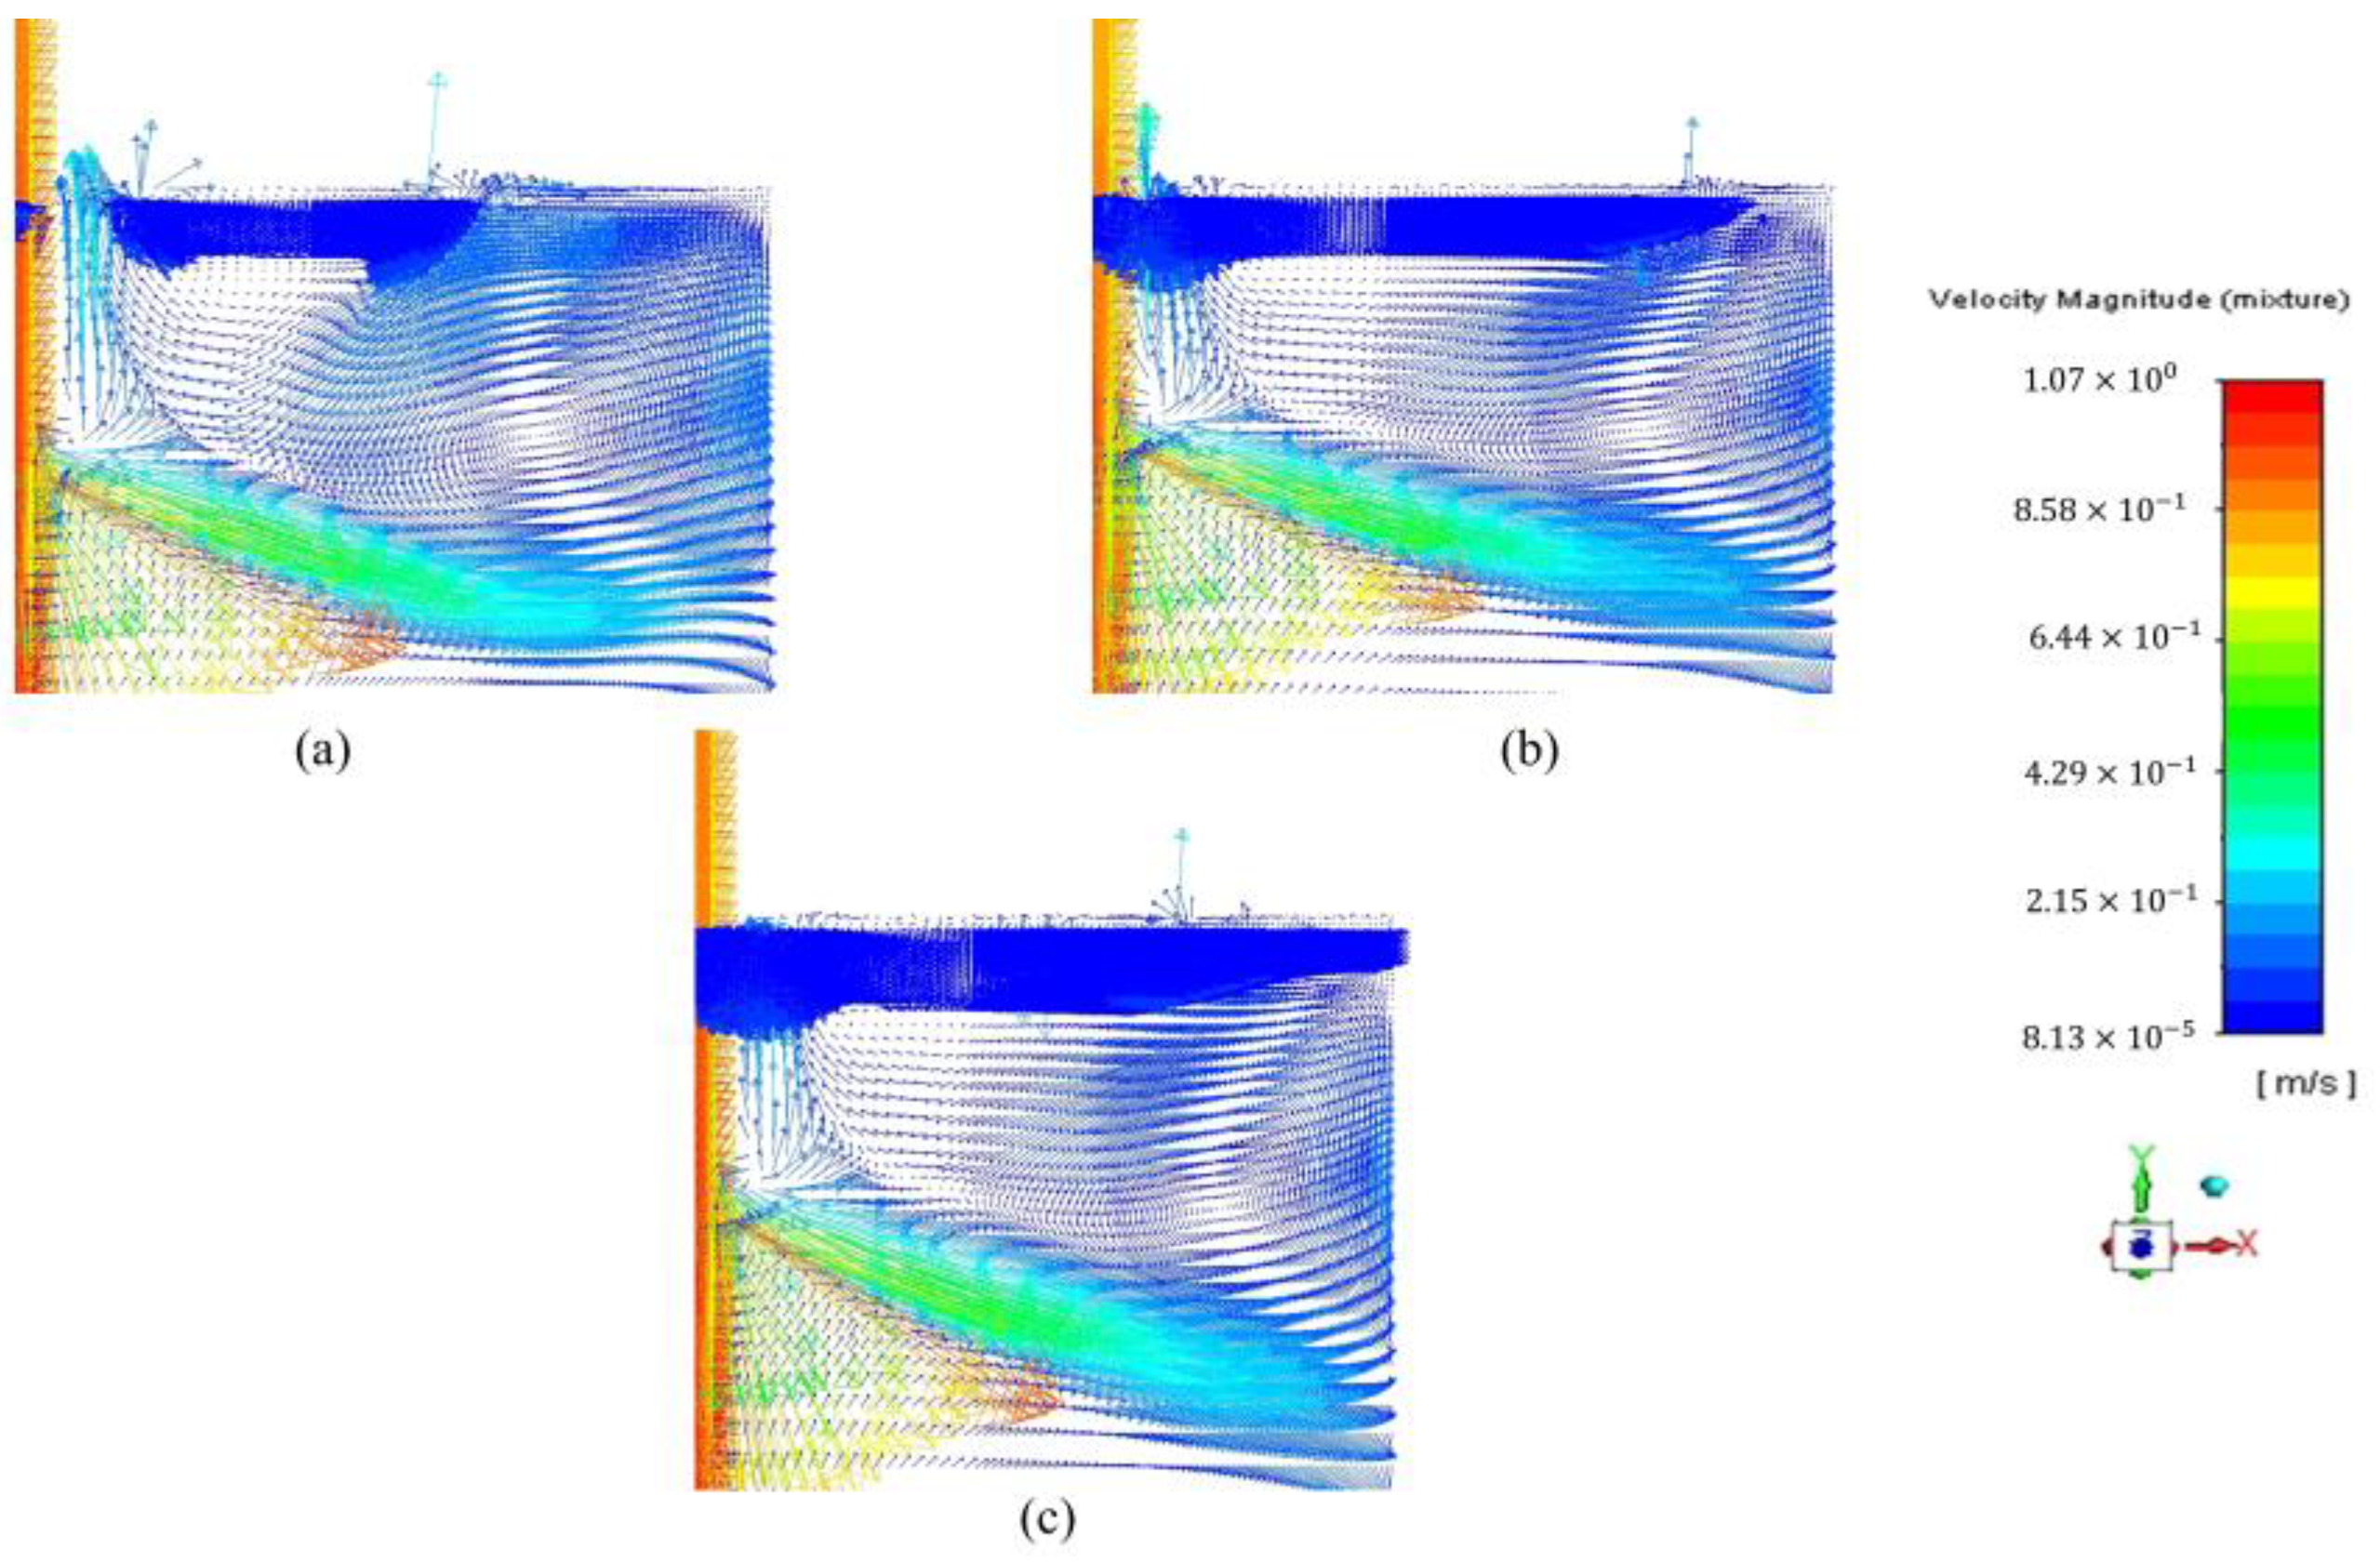
  • Under the condition of argon blowing, with the increase in the gas flow rate, the size and number of argon bubbles near the SEN significantly increase, resulting in a stronger upward flow near the nozzle. Additionally, with an increase in the gas flow rate, the wave height of the liquid level increases significantly near both the nozzle and the narrow face, along with a more pronounced increase in wave height near the SEN. Furthermore, with the increase in the gas flow rate, the area of slag eyes near the narrow face continues to decrease, while the area of slag eyes near the SEN continues to increase, with a continuous increase in the total area of slag eyes.
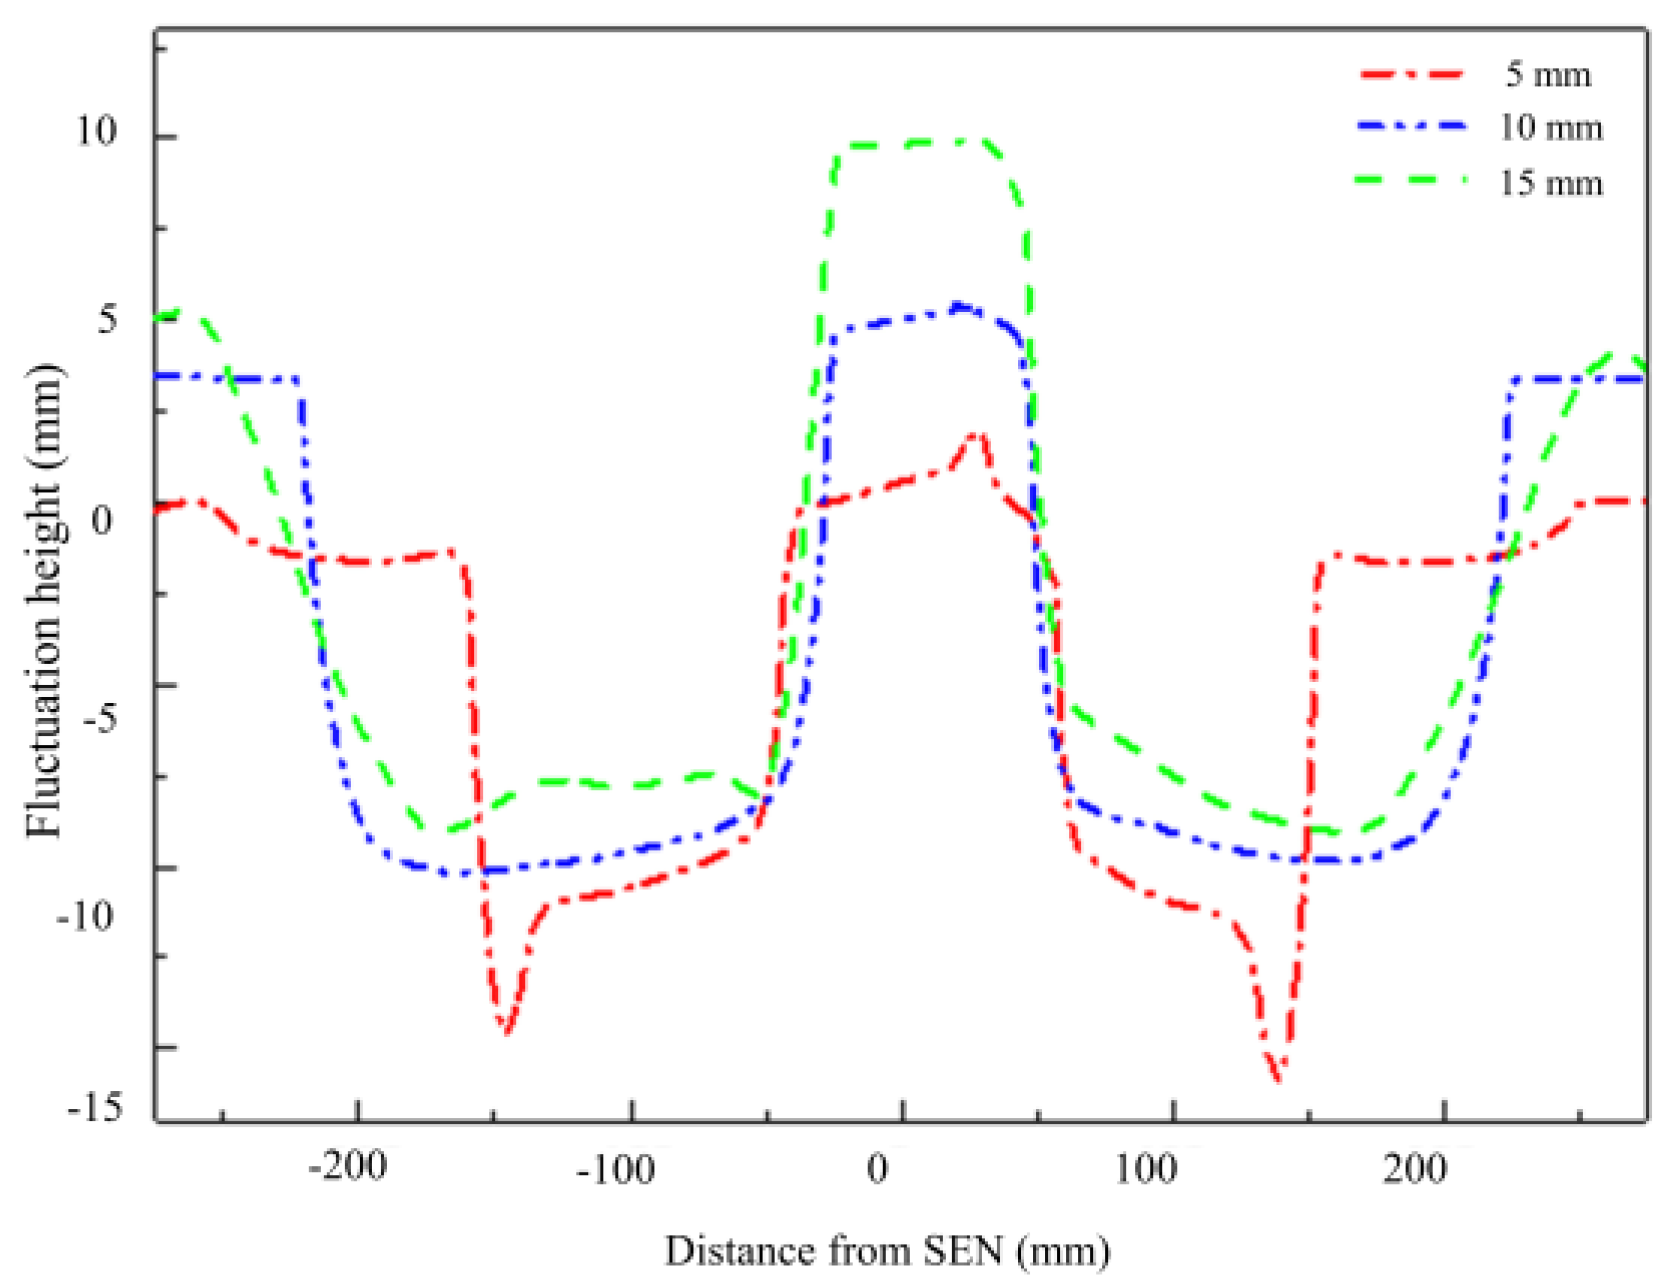
  • Under the condition of argon blowing, with the increase in slag thickness, there are no significant changes in bubble distribution. Additionally, with the increase in slag thickness, the wave height of the liquid level near the water nozzle and narrow surface decreases to varying degrees. Furthermore, with the increase in slag thickness, the area of the slag eyes near the narrow face and the SEN consistently decreases.

Author Contributions

Z.L., X.B. and W.Y. conceived and designed the study; P.H., L.C., T.L. and N.Z. performed the numerical simulation; all authors discussed the results; W.Y. wrote the paper; Q.L., Z.L. and X.B. edited the manuscript. All authors have read and agreed to the published version of the manuscript.

Funding

This work was financially supported by the Youth Program of Natural Science Foundation of Hebei Provincial Department of Education (QN2023093); the Innovation research group project of Natural Science Foundation of Hebei Province of China (E2022210078); the Central Leading Local Science and Technology Development Fund Project (Grant No. 236Z5410G); and the High-end Talents Project of Hebei Province of China (Grant No. [2019] 63).

Data Availability Statement

The data presented in this study are available in the article.

Acknowledgments

The authors wish to express thanks to Weiqiang Liu for the academic communication.

Conflicts of Interest

Author X.B. was employed by the company Shijiazhuang Institute of Architectural Design Co., Ltd. The remaining authors declare that the research was conducted in the absence of any commercial or financial relationships that could be construed as a potential conflict of interest.

References

  1. Thomas, B.G.; Mika, L.; Najjar, F. Simulation of fluid flow inside a continuous slab-casting machine. Metall. Trans. B 1990, 21, 387–400. [Google Scholar] [CrossRef]
  2. Bai, H.; Thomas, B.G. Turbulent flow of liquid steel and argon bubbles in slide-gate tundish nozzles: Part I. Model development and validation. Metall. Mater. Trans. B-Process Metall. Mater. Process. Sci. 2001, 32, 253–267. [Google Scholar] [CrossRef]
  3. Ramos-Banderas, A.; Morales, R.D.; Sánchez-Pérez, R.; García-Demedices, L.; Solorio-Diaz, G. Dynamics of two-phase downwards flows in submerged entry nozzles and its influence on the two-phase flow in the mold. Int. J. Multiph. Flow 2005, 31, 643–665. [Google Scholar] [CrossRef]
  4. Ramos-Banderas, A.; Sánchez-Pérez, R.; Demedices-Garcia, L.; Palafox-Ramos, J.; Diaz-Cruz, M.; Morales, R. Mathematical simulation and physical modeling of unsteady fluid flows in a water model of a slab mold. Metall. Mater. Trans. B 2004, 35, 449–460. [Google Scholar] [CrossRef]
  5. Yang, W.; Luo, Z.; Gu, Y.; Liu, Z.; Zou, Z. Simulation of bubbles behavior in steel continuous casting mold using an Euler-Lagrange framework with modified bubble coalescence and breakup models. Powder Technol. 2020, 361, 769–781. [Google Scholar] [CrossRef]
  6. Lee, G.G.; Thomas, B.G.; Kim, S.H. Effect of refractory properties on initial bubble formation in continuous-casting nozzles. Met. Mater. Int. 2010, 16, 501–506. [Google Scholar] [CrossRef]
  7. Liu, Z.; Li, L.; Qi, F.; Li, B.; Jiang, M.; Tsukihashi, F. Population balance modeling of polydispersed bubbly flow in continuous-casting using Multiple-Size-Group approach. Metall. Mater. Trans. B 2014, 46, 406–420. [Google Scholar] [CrossRef]
  8. Liu, Z.; Zhang, L.; Zhou, H.; Chen, W. Study on the spatial distribution of argon bubbles in a steel slab continuous casting strand. Steel Res. Int. 2021, 93, 2100413. [Google Scholar] [CrossRef]
  9. Yang, W.; Luo, Z.; Gu, Y.; Liu, Z.; Zou, Z. Numerical analysis of effect of operation conditions on bubble distribution in steel continuous casting mold with advanced bubble break-up and coalescence models. ISIJ Int. 2020, 60, 2234–2245. [Google Scholar] [CrossRef]
  10. Kwon, Y.; Zhang, J.; Lee, H.G. Water model and CFD studies of bubble dispersion and inclusions removal in continuous casting mold of steel. ISIJ Int. 2006, 46, 257–266. [Google Scholar] [CrossRef]
  11. Liu, Z.; Li, B. Large-Eddy simulation of transient horizontal gas–liquid flow in continuous casting using dynamic subgrid-scale model. Metall. Mater. Trans. B 2017, 48, 1833–1849. [Google Scholar] [CrossRef]
  12. Liu, Z.; Li, B.; Jiang, M. Transient asymmetric flow and bubble transpor inside a slab continuous-casting mold. Metall. Mater. Trans. B 2013, 45, 675–697. [Google Scholar] [CrossRef]
  13. Liu, Z.; Qi, F.; Li, B.; Jiang, M. Multiple size group modeling of polydispersed bubbly flow in the mold: An analysis of turbulence and interfacial force models. Metall. Mater. Trans. B 2014, 46, 933–952. [Google Scholar] [CrossRef]
  14. Yang, W.; Luo, Z.; Zou, Z.; Zhao, C.; You, Y. Modelling and analysis of bubble entrapment by solidification shell in steel continuous casting considering bubble interaction with a coupled CFD-DBM approach. Powder Technol. 2021, 390, 387–400. [Google Scholar] [CrossRef]
  15. Gupta, D.; Lahiri, A. Water-modeling study of the surface disturbances in continuous slab caster. Metall. Mater. Trans. B 1994, 25, 227–233. [Google Scholar] [CrossRef]
  16. Tanaka, H.; Kuwatori, H.; Nisihara, R. Analysis of continuous casting powder entrapping phenomena by water-model experiments. Tetsu-Hagané 1992, 78, 761–766. [Google Scholar] [CrossRef]
  17. Llanos, C.A.; Garcia, S.; Ramos-Banderas, J.A.; Barreto, J.D.J.; Solorio, G. Multiphase modeling of the fluidynamics of bottom argon bubbling during ladle operations. ISIJ Int. 2010, 50, 396–402. [Google Scholar] [CrossRef]
  18. Liu, H.; Qi, Z.; Xu, M. Numerical simulation of fluid flow and interfacial behavior in three-phase argon-stirred ladles with one plug and dual plugs. Steel Res. Int. 2011, 82, 440–458. [Google Scholar] [CrossRef]
  19. Krishnapisharody, K.; Irons, G. A model for slag eyes in steel refining ladles covered with thick slag. Metall. Mater. Trans. B 2015, 46, 191–198. [Google Scholar] [CrossRef]
  20. Iguchi, M.; Miyamoto, K.-I.; Yamashita, S.; Iguchi, D.; Zeze, M. Spout eye area in ladle refining process. ISIJ Int. 2004, 44, 636–638. [Google Scholar] [CrossRef]
  21. Li, B.; Yin, H.; Zhou, C.Q.; Tsukihashi, F. Modeling of three-phase flows and behavior of slag/steel interface in an argon gas stirred ladle. ISIJ Int. 2008, 48, 1704–1711. [Google Scholar] [CrossRef]
  22. Liu, Z.; Li, B.; Vakhrushev, A.; Wu, M.; Ludwig, A. Physical and numerical modeling of exposed slag eye in continuous casting mold using Euler–Euler approach. Steel Res. Int. 2018, 90, 1800117. [Google Scholar] [CrossRef]
  23. Miki, Y.; Takeuchi, S. Internal defects of continuous casting slabs caused by asymmetric unbalanced steel flow in mold. ISIJ Int. 2003, 43, 1548–1555. [Google Scholar] [CrossRef]
  24. Cloete, S.W.; Eksteen, J.J.; Bradshaw, S.M. A numerical modelling investigation into design variables influencing mixing efficiency in full scale gas stirred ladles. Miner. Eng. 2013, 46, 16–24. [Google Scholar] [CrossRef]
  25. Liu, Z.; Sun, Z.; Li, B. Modeling of quasi-four-phase flow in continuous casting mold using hybrid Eulerian and Lagrangian approach. Metall. Mater. Trans. B 2016, 48, 1248–1267. [Google Scholar] [CrossRef]
  26. Yang, W.; Luo, Z.; Lai, Q.; Zou, Z. Study on bubble coalescence and bouncing behaviors upon off-center collision in quiescent water. Exp. Therm. Fluid Sci. 2019, 104, 199–208. [Google Scholar] [CrossRef]
  27. Sevik, M.; Park, S.H. The splitting of drops and bubbles by turbulent fluid flow. J. Fluids Eng. 1973, 95, 53–60. [Google Scholar] [CrossRef]
Figure 1. Schematic diagram of the mold with boundary conditions.
Metals 13 01943 g001
Figure 2. Comparison of transient exposed slag eyes between numerical simulation and water model with casting speed of 0.6 m/min and an initial slag layer thickness of 10 mm.
Metals 13 01943 g002
Figure 3. Bubble distribution and slag layer fluctuation in the mold with the numerical simulation, (a) Bubble coalescence; (b) bubble breakup.
Metals 13 01943 g003
Figure 4. Instantaneous comparison of slag eye distribution in the mold. (a) Numerical simulation without gas blowing, (b) numerical simulation with gas blowing, (c) water model with gas blowing.
Metals 13 01943 g004
Figure 5. Bubble distribution and the slag–steel interface shape in the mold under different casting speeds. (a) 0.6 m/min, (b) 0.7 m/min, (c) 0.8 m/min.
Metals 13 01943 g005
Figure 6. Flow field in the mold and the shape of the slag–steel interface under different casting speeds. (a) 0.6 m/min, (b) 0.7 m/min, (c) 0.8 m/min.
Metals 13 01943 g006
Figure 7. Effect of casting speed on the shape of the slag–steel interface.
Metals 13 01943 g007
Figure 8. Transient slag eye on the top surface of the mold under different casting speeds. (a) 0.6 m/min, (b) 0.7 m/min, (c) 0.8 m/min.
Metals 13 01943 g008
Figure 9. Bubble distribution and the slag–steel interface shape in the mold under different argon blowing rates. (a) 0.5 L/min, (b) 0.8 L/min, (c) 1.1 L/min.
Metals 13 01943 g009
Figure 10. Flow field in the mold and the shape of the slag–steel interface under different argon blowing conditions. (a) 0.5 L/min, (b) 0.8 L/min, (c) 1.1 L/min.
Metals 13 01943 g010
Figure 11. Effect of the argon blowing rate on the shape of the slag–steel interface.
Metals 13 01943 g011
Figure 12. Transient slag eyes on the top surface of the mold under different argon blowing rates. (a) 0.5 L/min, (b) 0.8 L/min, (c) 1.1 L/min.
Metals 13 01943 g012
Figure 13. Bubble distribution and the slag–steel interface shape in the mold with different slag thicknesses. (a) 5 mm, (b) 10 mm, (c) 15 mm.
Metals 13 01943 g013
Figure 14. Molten steel flow field and the slag–steel interface shape in the mold with different slag thicknesses. (a) 5 mm, (b) 10 mm, (c) 15 mm.
Metals 13 01943 g014
Figure 15. Effect of slag layer thickness on the shape of slag–steel interface.
Metals 13 01943 g015
Figure 16. Transient slag eye situation on the top surface of the mold with different slag thicknesses. (a) 5 mm, (b) 10 mm, (c) 15 mm.
Metals 13 01943 g016
Table 1. Geometry parameters and operation conditions.
ParameterWater ModelSteel Caster
SEN port diameter20 mm80 mm
Nozzle port angle15° down15° down
Submergence depth of SEN75 mm300
Slab width × thickness 550 × 75 mm2200 × 300 mm
Slab length900 mmOpen bottom
Liquid density1000 kg·m−37020 kg·m−3
Liquid viscosity0.001 kg·m−3·s−10.0056 kg·m−3·s−1
Slag density900 kg·m−32600 kg·m−3
Slag viscosity0.042 kg·m−3·s−10.09 kg·m−3·s−1
Gas density1.2 kg·m−30.56 kg·m−3
Gas viscosity1.82 × 10−5 kg·m−3·s−17.42 × 10⁻⁵ kg·m−3·s−1
Disclaimer/Publisher’s Note: The statements, opinions and data contained in all publications are solely those of the individual author(s) and contributor(s) and not of MDPI and/or the editor(s). MDPI and/or the editor(s) disclaim responsibility for any injury to people or property resulting from any ideas, methods, instructions or products referred to in the content.

