Article

Designing Quaternary and Quinary Refractory-Based High-Entropy Alloys: Statistical Analysis of Their Lattice Distortion, Mechanical, and Thermal Properties

1
Department of Physics and Astronomy, University of Missouri-Kansas City, Kansas City, MO 64110, USA
2
Department of Sciences, College of Basic Education, Al Muthanna University, Samawah 66001, Iraq
*
Author to whom correspondence should be addressed.
Metals 2023, 13(12), 1953; https://doi.org/10.3390/met13121953
Submission received: 1 November 2023 / Revised: 24 November 2023 / Accepted: 26 November 2023 / Published: 29 November 2023
(This article belongs to the Special Issue Feature Papers in Entropic Alloys and Meta-Metals)

Abstract

:
The rapid evolution in materials science has resulted in a significant interest in high-entropy alloys (HEAs) for their unique properties. This study focuses on understanding both quaternary and quinary body-centered cubic (BCC) of 12 refractory-based HEAs, and on analysis of their electronic structures, lattice distortions, mechanical, and thermal properties. A comprehensive assessment is undertaken by means of density functional theory (DFT)-based first principles calculations. It is well known that multiple constituents lead to notable lattice distortions, especially in quinary HEAs. This distortion, in turn, has significant implications on the electronic structure that ultimately affect mechanical and thermal behaviors of these alloys such as ductility, lattice thermal conductivity, and toughness. Our in-depth analysis of their electronic structures revealed the role of valence electron concentration and its correlation with bond order and mechanical properties. Local lattice distortion (LD) was investigated for these 12 HEA models. M1 (WTiVZrHf), M7 (TiZrHfW), and M12 (TiZrHfVNb) have the highest LD whereas the models M3 (MoTaTiV), M5 (WTaCrV), M6 (MoNbTaW), and M9 (NbTaTiV) have the less LD. Furthermore, we investigated the thermal properties focusing on Debye temperature (ΘD), thermal conductivity (κ), Grüneisen parameter (γα), and dominant phonon wavelength (λdom). The NbTaTiV(M9) and TiVNbHf(M10) models have significantly reduced lattice thermal conductivities (κL). This reduction is due to the mass increase and strain fluctuations, which in turn signify lattice distortion. The findings not only provide an understanding of these promising materials but also offer guidance for the design of next-generation HEAs with properties tailored for potential specific applications.

1. Introduction

High-entropy alloys (HEAs) and high-entropy metal alloys (HEMAs) were explored for the first time in 2004 [1,2]. These materials have high configuration entropy (CE) gained by increasing the number of constituting elements (n) with n ≥ 5 [1]. Certain proportions of five or more principal elements (either equimolar or non-equimolar) are mixed to form a single-phase high-entropy alloy (HEA) solid solution. This solid solution is stabilized by a high CE of mixing [3]. The entropy of mixing (S) is expressed as: S = k B ln ω = R ln n , where kB is the Boltzmann constant, ω is the number of ways of mixing, R is the gas constant, and n is the number of elements within the HEA [4]. Materials are considered low-entropy when ΔSmix is less than 0.69 R, medium-entropy when ΔSmix is between 0.69 R and 1.59 R, and high-entropy when ΔSmix is larger than 1.60 R [5]. HEAs come with very unique effects such as significant lattice distortion and the cocktail effect [6,7] which result in some unique properties such as high hardness, high resistance to corrosion, high thermoelectric (TE) performance [8,9], oxidation resistance [10], magnetic properties [11], and improved radiation performance [12,13,14,15]. The significant lattice distortion in HEAs results from the mismatch of mass, size, and bond state of different elements or ions in the structure of the HEA.
HEAs consisting of a high number of metallic elements (five or more) tend to form simple phases without complex intermetallic phases. In the early days of the HEAs, forming a single-phase solid solution was determined by empirical rules originating from Hume–Rothery rules. These rules rely on several factors, such as electronegativity, crystal structure of solutes, elemental atomic radii, and difference in valency [16]. Cantor et al. [2] found that forming a single-phase solid solution is controlled by CE. In Cantor’s work, the researchers equally distributed transitional metal elements of different lattices—Ni face-centered cubic (FCC), Fe body-centered cubic (BCC), Co hexagonal closed packed (HCP), Cr (BCC), and Mn (BCC)—in a single-phase solid solution. Other researchers [6,17] confirmed that forming a single-phase solid solution of FCC or BCC or HCP structures is controlled by a high CE. The microstructural properties of single-phase HEAs have been extensively studied to reach a clear understanding of these properties. A study [18] proposed that the phase of the solid solution could be determined by the following factors: mixing entropy, atomic sizes, and mixing enthalpy, which is given by Δ H m i x = i = 1 , i j n 4 Δ H i j m i x c i c j , where Δ H i j m i x , c denote the mixing enthalpy of a binary alloy consisting of the ith and jth elements and composition of the alloying element, respectively [19]. The valence electron count (VEC) could be the key factor to differentiate between the BCC and FCC phases in HEAs [20]. Another study showed that a FCC single phase of three (NiFeCo, NiCoCr, and NiCoMn), four (NiFeCoCr, NiFeCoMn, and NiCoCrMn), and five (NiFeCoCrMn and NiFeCoCrPd) alloys can be formed by adding the Pd element into Cantor alloys [21].
There has been extensive research on refractory-based HEAs in recent years. WTaMoNb and WTaMoNbV as refractory element-based alloys with single-phase BCC lattices were synthesized for the first time in 2010 by Senkov et al. [22]. Many experimental studies have been conducted since then, such as TiZrHfNbTa [23,24], NbZrTiCrMo0.5Ta0.5 [25], CrNbTiVZr [26,27], and TiZrNbMoVx (x = 0–1.5) [28]. Ab initio molecular dynamics (AIMD) simulation was used to study the phase stability of HfNbTaTiZr HEA [29]. The ab initio method combined with virtual crystal approximation (VCA) was used to predict the tensile strength and shear strength of TiVNbMo HEA [30]. They found that alloying does not result in a remarkable change in tensile strength and shear strength of TiVNbMo. The microstructure and mechanical properties of TiZrHfNbV and TiZrHfNbCr HEAs were investigated using X-ray diffractometry and scanning electron microscopy (SEM) [31] The SEM study showed that strength and hardness were enhanced for these HEAs. The phase stability of MoNbTaW HEA was tested by using first principles calculations [32]. The distribution of interatomic distances and the lattice distortion (LD) in BCC MoNbTaVW HEA and its five sub-quaternary systems at different temperatures were studied by Toda et al. [33] Experimental (including X-ray diffraction and SEM) and computational study was carried out to investigate the microstructure and thermodynamic properties of BCC HfNbTaTiVZr HEA [34]. The effect of alloying on the elastic properties of ZrNbHf, ZrVTiNb, ZrVNbHf, and ZrVTiNbHf refractory-based HEAs was investigated via ab initio calculations by Li et al. [35]. A theoretical study was carried out to investigate the B2-ordering impacts on the thermodynamic properties of BCC NbMoTaW [36]. Elastic properties of TiZrVNb, TiZrNbMo, and TiZrVNbMo HEAs were investigated by using ab initio calculation combined with a special quasi-random structure (SQS) approach and coherent potential approximation (CPA) [37]. Hybrid Monte Carlo/molecular dynamics simulation was carried out to study the elastic properties and LD of NbTiVZr, CrMoNbV, HfNbTaZr, and MoNbTaW [38]. A theoretical study [39] showed that the effect of local lattice distortion is larger in refractory HEAs than in 3d transition metal HEAs. Another theoretical study [40] was carried out to investigate the elastic and thermal properties of single-phase ternary and quaternary Al-Ti-V-Cr-Nb-Mo refractory-based HEAs.
Thermoelectric (TE) devices can directly convert heat into electricity under a temperature gradient. One of the promising green solutions to mitigate the energy and environmental crisis is TE technology [41]. Figure of merit (ZT) determines the performance of TE devices. ZT is defined as ZT = S2σT/κ, where σ is the electrical conductivity, S is the Seebeck coefficient, T is the absolute temperature, and κ is the thermal conductivity. The considerable mass difference in HEAs causes chemical disorder, which results in significant phonon scattering and reduces κ. In addition, the distinct chemical environments in HEAs can produce force constant variations that modify the phonon spectral distribution, where the phonon dispersion can be expressed as [42]:
ω = 2 F M sin π 2 k k c
where F, M, k, and kc are the force constant, atomic mass, wave vector, and cut-off wave vector, respectively. The speed of phonons ( ω ) can be changed by changes in these parameters. Large M and small F (weak chemical bonds) indicate low ω and low lattice thermal conductivity (κL). The variations in mass and force constant induce phonon-scattering processes, which are used to enhance the TE performance of HEAs. Thus, HEAs are good candidates for TE applications [43,44] and heat shield materials [45]. Studies on using chemical disorder to induce phonon scattering in HEAs are so far lacking. Some previous studies addressing phonon scattering in disordered alloys were limited to binaries [46,47,48,49,50,51]. The manipulation of mass and force constant in HEAs to induce phonon scattering and reduce κL is not yet fully explored.
Ab initio calculation is an effective tool that has been widely used in studying HEAs to understand and enrich their systems. Several random solid solution model (RSSM) approaches are used to simulate the solid solution phases [52], such as special quasi-random structure (SQS) [53], supercell (SC) method [54], coherent potential approximation (CPA) [55], and virtual crystal approximation (VCA) [56]. HEAs have very high chemical disorder, which requires using large supercells when using the SC method.
In most cases of HEAs, the theory of formation of HEAs is related to understanding the nature of metallic bonding. The metallic bonding nature of HEAs has not yet been fully investigated. Unlike covalent and ionic bonding, where the bond length (BL) can be explicitly defined as the separation distance between two atoms forming the bond, metallic bonding involves multiple atoms [57].
It is well known that for metallic glasses (MGs), all atoms with a certain distance of separation contribute to metallic bonding, which makes the expression of BL ambiguous. Consequently, multiple pairs of atoms may share the same separation distance for a specific bond strength or bond order (BO), and vice versa. However, our concept of total bond order density (TBOD) [58], a quantum mechanical metric, which takes into account the entire BO of the system, can avoid the usage of a pure geometric parameter describing the structure of HEAs.
In this work, we extensively study the effect of composition on the electronic structure, interatomic bonding, lattice distortion, micro-mechanical, and thermal properties of 12 BCC refractory-based HEAs, listed in Table 1 with more information about their lattice parameters and their components. These 12 models mainly consist of refractory elements (Zr, Nb, Mo, Hf, Ta, W) with three 3d transition metals (Ti, V, Cr). Two DFT-based packages are used to perform the calculations. Due to the larger number of components and chemical disorder of the present refractory based HEAs, the supercell approach to model these systems becomes a very cumbersome but very efficient method. These 12 models are single-phase BCC supercells of 500 atoms each. The solvent and solute of these HEAs are indistinguishable, setting them apart from traditional solid solutions. The mechanical properties in the small deformation region described by the elastic constants and polycrystalline elastic moduli are discussed in detail. The effects of 3d transition metal alloying on the electronic structures and mechanical and thermal properties of the 12 BCC refractory-based HEAs are investigated. The correlation between total bond order density (TBOD), effective charge (Q*) of every atom in each model, and the calculated mechanical parameters are discussed in detail. Moreover, interatomic bonding and local lattice distortion (LD) are discussed.

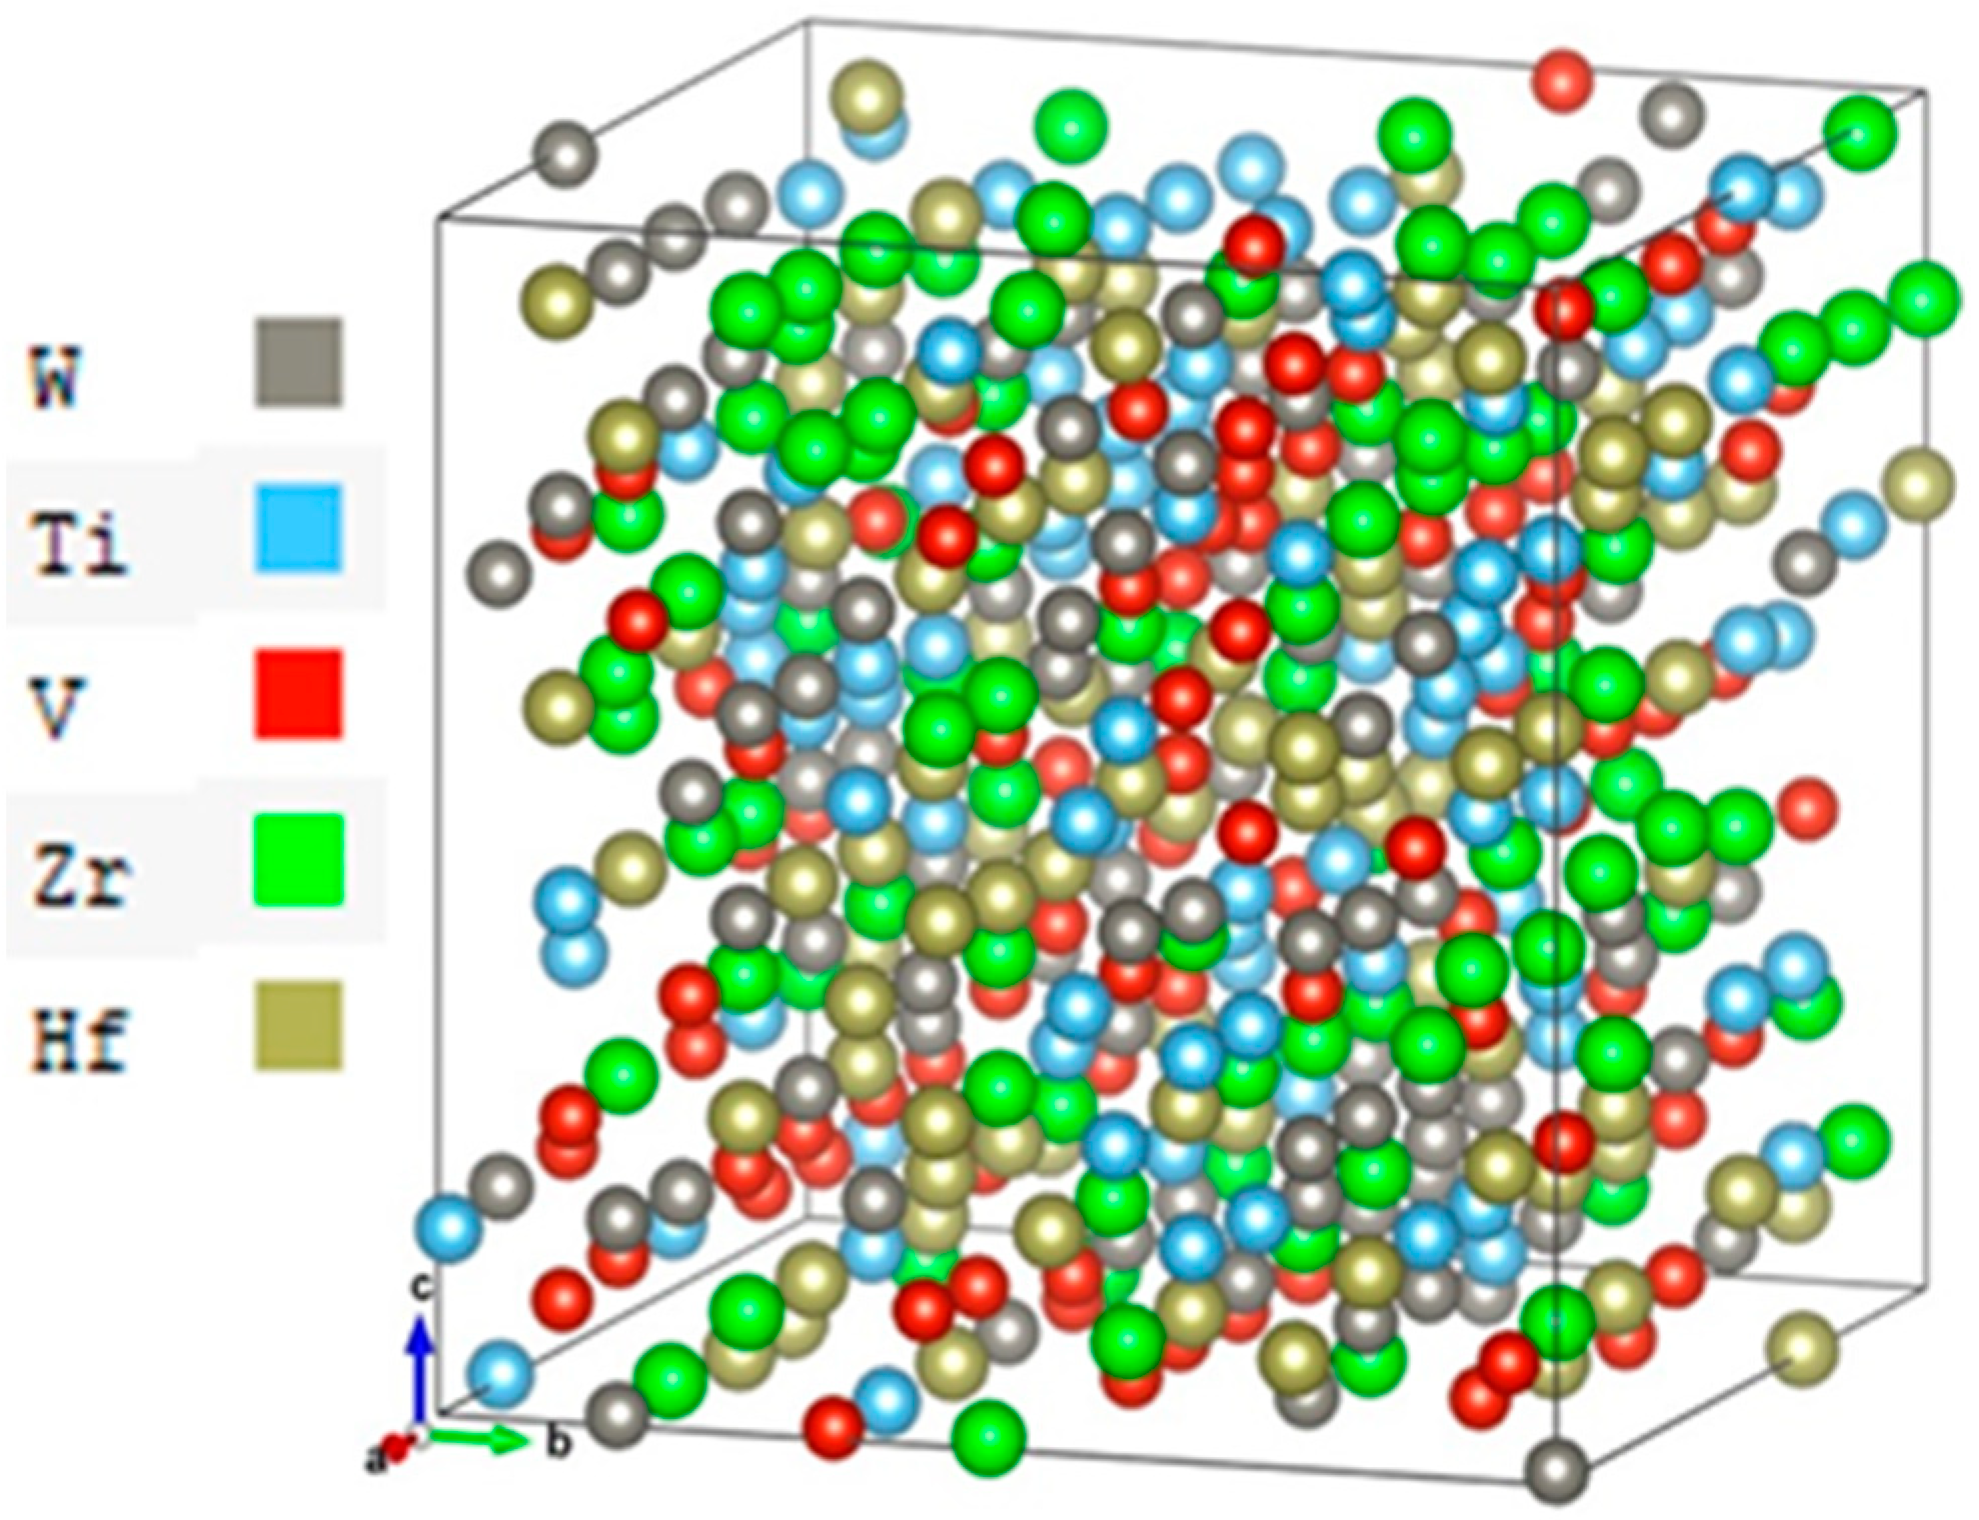
2. Computational Modeling and Method

This section delves into the modeling and computational packages employed in this study. Following that, the results and discussion section covers electronic structure, interatomic bonding, lattice distortion, mechanical properties, and thermal properties. This is subsequently followed by the conclusion.

2.1. Optimization and Mechanical Properties

The HEA structure was initially modeled using a Ni BCC unit cell with a space group number of 229. Subsequently, the HEA structure underwent random doping with transition elements (Ti, V, Cr, Zr, Nb, Mo, Hf, Ta, and W), and our in-house Python code was employed to compute the lattice constants while considering the randomly doped atoms within their respective cell. To introduce a disordered local environment, 5 × 5 × 5 supercells of BCC were constructed, resulting in random solid solution HEAs with a total of 500 atoms, as shown in Figure 1. Each of these 12 HEA models was then optimized using Vienna ab initio simulation package (VASP) [59]. In VASP, we used projector augmented wave (PAW-PBE) including generalized gradient approximation (GGA) for exchange correlation potential. A kinetic energy cutoff of 500 eV was selected for plane wave expansion, with an electronic convergence criterion set at 1.0 × 10⁻⁵ eV, and the force convergence set at −1.0 × 10⁻³ eV/Å for ionic relaxation.
The VASP-relaxed structures were also used for elastic tensor calculations based on the stress–strain response scheme [60]. The elastic coefficient C i j matrix is calculated by solving the linear equation:
σ i = j = 1 C i j ϵ j
where i and j are 1, 2 … 6. σ i was obtained by applying a strain ϵ j   of +0.50% and −0.50% to the equilibrium large supercell. The bulk modulus (K), shear modulus (G), Young’s modulus (E), and Poisson’s ratio (η) were calculated based on the Voigt–Reuss–Hill (VRH) approximation for poly-crystals [61,62,63] from the calculated C i j values.

2.2. Electronic Structure

The orthogonalized linear combination of atomic orbital (OLCAO) method [64,65] was utilized for the electronic structure and bonding analysis, with the VASP optimized structure serving as the input. The OLCAO package is an all-electron method and employs Gaussian type orbitals to construct atomic orbitals within the basis expansion of the Bloch function. This approach is based on local density approximation within density functional theory. OLCAO calculates parameters of bond order (BO) and effective charge ( Q * ) based on Mulliken’s scheme [66]. BO, synonymous with the strength of the bond, is the overlap population ρ α , β   between pairs of atoms ( α ,   β ) separated by a distance—bond length.
ρ α β = n ,   o c c i , j C i α * n C j β n S i α ,   j β
Q α * = i , j , β n , o c c C i α * n C j β   n S i α , j β  
where n, i, j, C j β n , and S i α ,   j β are the band index, orbital quantum number, eigenvector coefficient, and overlap matrix, respectively. Following the effective charge, we also calculated the partial charge (PC) of each atom in all models. PC ( Δ Q * ) is the deviation of Q α *   from their neutral charge Q α 0 .
Summation of all BO in the model resulted in the total bond order (TBO). TBO, normalized by the volume of the model, resulted in total bond order density (TBOD). TBOD is the effective quantum mechanical metric that quantifies the cohesiveness of the alloy. OLCAO has been successful for DFT calculations of both crystalline [67,68,69] and non-crystalline materials [65,70], as well as complex bio-molecular systems [71,72].

3. Results and Discussion

3.1. Electronic Structure

The 12 BCC HEA models were created with an equal percentage of components that caused short-range order in the sites of the supercell. This causes deformation due to the new local chemical environment of the components. This deformation influences the properties of the material at the atomic level, including electronic structure and interatomic bonding. The optimized structure parameters along with first and second nearest neighbors are listed in Table 1. Although the 5d elements are heavier and contain more protons, which makes the atoms larger, it is hard to tell whether this makes the volume of the supercell larger, due to severe lattice distortion in BCC HEAs (see Section 3.2).
The stability of the material is explicitly associated with the electronic structure. The electronic structure contains density of states (DOS) and partial and effective charges. Figure 2 demonstrates the total density of states of the 12 BCC HEAs investigated. The DOS predominantly originated from the 3d orbitals in Ti, V, and Cr, the 4d orbitals in Zr, Nb, and Mo, and the 5d orbitals in Hf, Ta, and W. Figure 2 shows the DOS of the 12 BCC HEAs, in which M9 (M5) is the highest (lowest) at Fermi energy (EF). None of the investigated DOS is minimum at EF. By comparison, in the case of FCC, the minimum can be seen at EF, which means that FCC HEAs are more stable and less deformed [73]. Detailed total and partial DOS of the 12 models are shown in Figure S1 in Supplementary Materials (SM). Notably, the 5d elements had lower DOS at EF. For instance, M5, M6, and M7 are 4-component models, containing, e.g., W; and thus, this influences a lower total DOS for the models. Although M1 and M2 contain W and their total DOS are also low compared to the non-W models, it is not as low as M5 and M6 (see Figure S1). This is due to the higher number of components in their structure. Moreover, the partial DOS of elements contributing to the 12 models almost have same trend regardless of their different local chemical environments in the supercell. On the other hand, the partial DOS of 3d elements are usually higher, which is consistent with FCC HEAs such as the Cantor alloy [2,74].
Another essential factor of electronic structure is effective charge of the components in the HEAs. The quantum mechanical metric of effective charge Q * fulfills the inadequacy of valence election concentration (VEC) theory. VEC values are based on the pure, isolated environments of the components. The VEC of transition metals within a solid solution model often deviates from the number of electrons in the d orbital of HEAs due to the unique local environment of each component.
The calculated Q * of the HEAs are listed in Table 2. The average Q * of each HEA is obtained by using Q a v * = c i Q i * , where c i is the composition of the components. Although the Q * differs from the VEC, their averages are the same (see Table 2). The highest Q a v * are in M5 and M6, and the lowest Q a v * is in M12. Q a v * is extremely important for designing HEAs because it is positively correlated with bulk modulus (K) and negatively correlated with total energy, as shown in Figure 3a,b, respectively.
In addition to effective charge, partial charge is equally important for transition metals in HEAs, which is the deviation of Q * from VEC. This difference creates a charge transfer between the neighboring atoms in the supercell. The value of PC reveals the electronic structure and interatomic bonding alteration. The calculated partial charge (PC) distribution for each of the 12 BCC HEA models is shown in Figure S2. PC values of the components in the 12 HEAs are listed in Table 2. From Figure 4 it can be seen that Zr, Nb, Hf and Ta are electropositive, whereas Cr and Mo are electronegative in all 12 BCC HEAs. It is well known that some transition metals can be both electropositive and electronegative, depending on the local chemical environment they are contributing to. Although Ti and V are electronegative in almost all cases, Ti (V) is electropositive in M3 (M3 and M5). This could be due to the electronegativity of Mo in M3, which is a 4d element with a larger number of atoms. Furthermore, in the case of M5, Cr exhibits the highest electronegative value. Additionally, the electronegativity (or electropositivity) of element W varies in M1, M2 and M7 (M5 and M6), depending on the other components present within the structure.

3.2. Interatomic Bonding and Lattice Distortion

Identifying the strength of a pair of atoms reveals better insight into the chemical properties of HEAs. Bonding in HEAs results from sharing the valence electrons in neighboring atoms, and the distance between atoms is the so-called interatomic distance. The bond order (BO) versus bond length (BL) for the 12 HEA models are shown in Figure S3 (M1–M12) with their discussion in the SM. Among the 12 HEAs, M9 and M10 exhibit greater dispersion (see Figure S3), while M5 and M6 display lower dispersion. The increased dispersion in M9 and M10 is indicative of more substantial lattice distortion. M5 and M6 notably exhibit a clear separation between two regions, corresponding to the first and second nearest neighbors (NN), which aligns with the expected behavior in a BCC structure. In general, the 1NN always dominates the contribution in bonding because it has a shorter interatomic distance (ID).
To attain deeper knowledge, we obtained the total bond order density (TBOD) as described in Section 2.2. TBOD can be further decomposed into partial BOD (PBOD), identifying the contributions from various types of bonds. Figure 5 shows the PBOD of the 12 BCC HEAs. More detailed pie charts for every HEA model are shown in Figure S4.
Among all 12 BCC models, Mo–Ta in M6 has the highest contributions of 15.9% as depicted in Figure S4, and bonds such as Hf–Hf and Zr–Zr have the lowest contributions. Bond pairs that consist of 5d elements exhibit higher PBOD, primarily attributed to the greater number of electrons in 5d orbitals compared to the 3d and 4d orbitals.
Another key point in HEAs is lattice distortion (LD), which can be obtained by interatomic bonding analysis. To investigate LD in HEAs, we employed atomic pair distribution analysis of interatomic distances (ID) utilizing a bimodal Gaussian distribution, as depicted in Figure 6. As is widely known, BCC structures consist of NN and SNN, as illustrated by the dual peaks in Figure 6. We calculated the averaged NN and SNN distances as shown in Table 1. To conduct a more detailed analysis of these two peaks, we determined their respective full width at half maximum (FWHM) values, as presented in Figure 6. The model with prominent peaks shows BCC structure integrity, whereas the pair distribution between the peaks denotes structural distortion or LD. Specifically, M1, M7, and M12 display a higher degree of LD. On the other hand, model M6 does not exhibit any LD, and models M3, M5, and M9 show lower LD.

3.3. Mechanical Properties

Since the discovery of HEAs, their elastic moduli have been the main focus in industries due to their superior properties. HEAs are very complex and expensive, and accurate computational study is needed to help researchers. We used the stress vs. strain approach [75] to find the elastic coefficients C i j . The mechanical properties such as bulk modulus (K), shear modulus (G), and Young’s modulus (E) were derived from the C i j . Table 3 lists C 11 , C 12 and C 44 , and the calculated mechanical properties. The elastic constants C11, C22, and C33 are strongly correlated with unidirectional compression along the principal x, y, and z directions [76] and have the same value in cubic structures. Synonymously, C11, C22, and C33 can describe the resistance of a material against the deformation along the [100], [010], and [001] directions, respectively. C44 measures the resistance against shear deformation in the (100) plane. A large value of C11 indicates incompressibility under uniaxial stress along the x-axis. The C11 of M5 and M6 are much larger than the C11 of all remaining models, indicating that M5 and M6 are much less compressible under uniaxial stress along the x, y, and z directions. It also means that the bonding strength in M5 and M6 along the x, y, and z axes is much stronger than the bonding strength in all remaining models. The C44 of M5 and M6 are larger than the C44 of all remaining models. Larger C11 and stronger bonding characteristics can result in higher values of K, G, and E. Larger C11 and C44 also indicate higher transverse (shear) velocity (vs) and longitudinal sound velocity (vl). The pure elements W and Ta have much larger densities and higher melting temperatures than the other elements in these 12 models. Thus, alloying with W and Ta in M5 and M6 results in harder materials for many mechanical applications. However, this also results in higher lattice thermal conductivity, which makes M5 and M6 much less applicable as TE materials. On the other hand, the pure elements Ti, V, and Zr have the lowest density among the studied elements. Thus, alloying with Ti and V in M10 and M11, and Ti, Vi, and Zr in M12, may result in softer materials with smaller C11 and K for TE applications. A low value of C44 indicates high shearability. Due to having the lowest C44 value, M9 and M10 have the highest shearability among all solid solutions. The results in Figure 7a show the model M6 has the highest values for K, G, and E, while M9 exhibits the lowest values for both G and E. However, M12 has the lowest K value among the models. It should be noted that the G and E have the same trend from M6 (highest) to M9 (lowest). It can be observed that the model consisting of Ta has higher bulk modulus, especially the models with 4 components, because their number of atoms in the 4-element model is 125 atoms each. By contrast, models containing Hf possess lower bulk modulus. Vickers hardness (Hv) was calculated using the formula of Tian et al. [77]:
H V = 0.92 G K 1.137 G 0.708  
Among the 12 BCC models, M6 holds the highest H V followed by M5, while M9 exhibits the lowest H V .
The ratio of shear modulus to bulk modulus (G/K) is called Pugh’s modulus ratio [78,79]. It is one of the useful parameters that determines the brittle and ductile behaviors of materials. The G/K ratios for the 12 BCC HEAs solid solution models are listed in Table 3. According to Pugh’s criterion, materials with G/K larger than 0.571 tend to be brittle and those less than 0.571 tend to be ductile [79,80]. All 12 BCC HEAs are ductile materials. The mechanical stability of a cubic structure involves the following criteria: C44 > 0, C11 > |C12|, and C11 + 2C12 > 0 [81]. From Table 3, the calculated elastic constants satisfy these criteria, thus these alloys are expected to be mechanically stable. Frantsevich’s rule of Poisson’s ratio [82] is used to characterize material’s brittleness or ductility. It suggests that if Poisson’s ratio (η) is less than 0.26, the material tends to be brittle, otherwise it is ductile in nature. From Table 3, we notice that all refractory-based HEAs under study have an η much higher than 0.26. Hence, these HEAs are ductile and both Frantsevich’s rule and Pugh’s criterion are equivalent for these HEAs. Cauchy pressure (CP), which is given by: (C12 − C44) [83], can be used to characterize materials’ bonding nature. Generally speaking, a positive value of CP indicates metallic bonding dominating, while a negative value of CP suggests that the material is dominated by covalent bonding. The calculated positive values of CP in Table 3 show that these HEAs have a metallic character. M3, M5, M6, and M9 have the highest metallic bonding character, which may indicate that alloying with Ta increases the metallic character of the bonding. The Zener ratio (AZ = 2C44/(C11 − C12)) determines the elastic anisotropy of materials [40]. AZ is a unity for isotropic materials. From Table 3, we notice that these refractory-based HEAs are elastically anisotropic. We can associate the electronic structure and chemical properties with the mechanical properties. For instance, the correlation between TBOD and bulk modulus (see Figure 7b) does not exhibit a perfect linear relationship but does display a closer-to-linear nature, with the exception of a few outliers (M5 and M6). This observation suggests the potential future prediction of bulk modulus based on TBOD. Another example is effective charge versus bulk modulus, with their coefficient of determination (R2) equaling 0.97, as shown in Figure 3a. The figure illustrates that an increase in V E C a v within the model leads to an increase in the elastic moduli, particularly the bulk modulus. These insights offer valuable guidance for the design of HEAs.

3.4. Thermal Properties

The strength of bonding can be determined by the Debye temperature (ΘD), which originates from the theory of thermal vibration of atoms. ΘD is an important parameter for high temperature applications and correlates strongly to thermal conductivity (κ). Lower ΘD indicates softer materials with lower melting temperatures (Tmelt), while higher ΘD indicates harder materials with stronger interatomic bonds and higher Tmelt [84,85]. ΘD is calculated here using Anderson’s method, shown in Equation (S1) in the SM. Average sound velocity (vm), transverse (shear) velocity (vs), and longitudinal sound velocity (vl) are calculated using the equations shown in Equations (S2)–(S4) respectively. The calculated density(ρ), νs, νl, νm, and ΘD for the 12 BCC HEAs are listed in Table 4 and plotted in Figure 8a–c. Figure 8a shows that M5 and M6 have the highest densities, while M12 has the lowest density. M1, M7, M9, M10, M11, and M12 have the lowest ΘD and νs while M3, M5, and M6 have the highest ΘD and νs. This indicates that alloying with Ti, V, and Hf may suppress transverse phonon velocity and ΘD in HEAs, while alloying with W, Mo, Cr, and Ta may increase transverse phonon velocity and ΘD. As individual elements, Ti, Hf, and Zr have the smallest lattice thermal conductivity(κL) [86], whereas W, Mo, and Ta, Nb, and Cr have the largest κL at room temperature [86], among the elements constituting these 12 HEAs. This indicates that the κL value of the individual elements constituting these 12 HEAs also counts in determining the value of κL for refractory-based HEA models. For example, M6 has the largest κL because it consists of W, Mo, Nb, and Ta, alongside M5, which contains the three elements W, Ta, and Cr. It is important to identify the thermal limits or melting temperature (Tmelt) of a material. Low Tmelt indicates lower ΘD and higher thermal expansion. Tmelt is calculated using Equation (S5). Models M1, M7, M9, M10, M11, and M12 also have the lowest Tmelt, while M3, M5, and M6 have the highest Tmelt among the models. This indicates that alloying with Ta increases Tmelt and makes the alloys much harder. Significantly dampened transverse phonon modes (νs) would strengthen the scattering of phonons [87], which in turn results in reduced lattice thermal conductivity(κL).
The heat transfer performance at high temperatures can be measured by thermal conductivity (κ) [88]. Minimum thermal conductivity (κmin) and lattice thermal conductivity (κL) at 300 K are estimated using Clarke’s model [89], Cahill’s model [90], Slack’s model, and mixed model [91]. κmin and κL were calculated using Equations (S6)–(S8) and (S10) and are listed in Table 5. κL for the 12 BCC HEAs is also shown in Figure 8d. M5 and M6 have the largest values of κL while M9 and M10 have the smallest κL. Phonon velocities or sound velocities and κL are correlated through Equation (6) [92]:
κ i j = α C α τ α v i v j
where C α ,   τ α , and υ are the heat capacity, phonon scattering time or relaxation time, and phonon velocity, respectively. i ,   j refer to the principal axes of the chosen coordinate system. Clearly, reducing κL requires suppressing sound velocity, particularly shear velocity (vs). vs and vl are directly correlated to the shear elastic constant (C44), C11, and density (ρ) by Equations (7) and (8) below [93]:
v s = C 44 ρ  
v l = C 11 ρ  
In Table 3, it is evident that HEAs M9 and M10 exhibit the smallest C44 values, resulting in higher shear elastic strains. This observation clarifies their lower κL values when compared to other models.
The Grüneisen parameter ( γ α ) [94] can offer a wealth of insights into the interatomic interactions and bond anharmonicity of materials. A large γα indicates strong anharmonic vibrations, which also indicate higher phonon scattering and thus low κL (depressed and temperature-independent lattice thermal conductivity). Element substitution in HEAs creates disorder, leading to weak displacements of the atoms and bonds resulting in higher bond anharmonicity and higher γα. Sound or phonon velocity and the strength of interatomic interactions are positively correlated. Weaker interatomic interactions between atoms indicate a lower sound velocity and thus larger γα [95]. In summary, alloying induces internal strain fields, which reduces the speed of sound.
In HEAs, the internal strains can change the speed of sound, which results in higher phonon scattering and lower κL. This can be fully understood by following formula [96], which correlates the phonon frequency (ω), Grüneisen parameter tensor (γij), and strain tensor (εij):
ω = ω 0 1 γ i j ε i j
where ω 0 is the phonon frequency at zero strain. Increasing γ or inducing high field strain (ε) reduces phonon frequency and increases phonon scattering, and thus reduces κL. In this study, γα is calculated using Equation (S11). The calculated γα for the 12 BCC HEA models are summarized in Table 5 and Figure 9. The four-component alloys M9 and M10 have the largest γα (weaker chemical bonds) and thus the lowest κL (see Figure 8d), which indicates strong anharmonic vibrations due to higher mass and force constant. The four-component alloys M5, M6, and M7 have the lowest γα and largest κL (see Figure 8d), which indicates weak anharmonic vibrations that result from the lower mass and force constant.
The tendency of material to change its shape, volume, and density in response to a change in temperature is described by the thermal expansion coefficient (α). The greater a material’s α , the more it expands in response to heating. α is estimated from Equation (S12) in SM. The calculated α for the 12 refractory-based BCC HEAs is listed in Table 5, which shows that M5 and M6 have the highest α values, whereas M9 and M10 have the lowest α values. Lattice vibrations (phonons) in materials have a huge impact in several physical properties such as electrical conductivity, thermo-power, and thermal conductivity. To identify the maximum energy of phonons at a certain temperature, it is important to calculate the dominant phonon wavelength (λdom). λdom is defined as the wavelength at which the phonon energy distribution curve strikes its maximum value. λdom and mean free path (MFP) are positively correlated and both play a significant role in controlling κL. MFP is the average distance that a phonon travels between two successive inelastic collisions. Shortening MFP increases inelastic collisions between phonons, which means increasing the scattering of phonons and reducing κL [97]. This requires shifting the heat phonon spectra towards shorter wavelengths (smaller λdom). λdom can be roughly estimated at 300 K by using Equation (S13). The calculated λdom for the 12 BCC refractory-based HEAs are shown in Table S5. M5 and M6 have the largest λdom, whereas M9 and M10 have the smallest λdom among the HEAs.

4. Conclusions

The electronic structure, bonding, lattice distortion, elastic, and thermal properties of 12 BCC refractory-based HEAs—WTiVZrHf(M1), HfMoTiWZr(M2), MoTaTiV(M3), MoTaTiVZr(M4), WTaCrV(M5), MoNbTaW(M6), TiZrHfW(M7), TiZrNbMoTa(M8), NbTaTiV(M9), TiVNbHf(M10), Ti0.38V0.15Nb0.23Hf0.24(M11), and TiZrHfVNb(M12)—were investigated using first-principles calculations. The random solid solution model (RSSM) was used for alloying these solid solutions with large supercells of 500 atoms. We highlight the significance of TBOD as a valuable parameter in understanding the bonding of HEAs. Our calculations showed that TBOD is positively correlated with the mechanical properties, especially with bulk modulus. The average partial charge Q a v * is positively correlated with the bulk modulus, which is a new important finding from our current calculations. This feature of these refractory-based HEAs can be used to design new HEAs. Based on our calculations, all these 12 HEA models are mechanically stable. M3, M5 and M6 have the largest density and largest Young’s, bulk and shear moduli, while M9 and M10 have the lowest Young’s and shear moduli. Alloying with both W and Ta elements in M5 and M6 or both Mo and Ta in M3 results in very large elastic constants (C11 and C44) compared with other models, indicating higher hardness with higher fracture toughness and melting temperature. This feature can be useful for many mechanical and high temperature applications. Also, due to the high strength and ductility of M3, M5, and M6, they can be used as joint surrogate metals instead of the traditional stainless steels and titanium alloys, especially because they consist of refractory elements that are mostly non-toxic and hypoallergenic. However, this in turn results in high sound velocities or high phonon speeds, indicating larger lattice thermal conductivity. This feature makes the M5 and M6 models less applicable for TE applications. Considering that Ta has a higher density than Hf, and Mo has a higher density than V (see Figure 8a), replacing Hf in M10 with Ta in M9 and replacing V in M1 with Mo in M2 leads to a significant increase in the values of C11 and bulk modulus. Compared to M1, a significant reduction in the values of C11 and bulk modulus of M12 is observed when W is replaced with Nb, since W has a much higher density than Nb (see Figure 8a). M9 and M10 have the smallest vs, vm, ΘD, and κL, whereas M5 and M6 have the largest vs, vm, ΘD, and κL. M9 and M10 have the largest γα and thus the highest anharmonic vibrations. Thus, M9 and M10 are more suitable for TE applications. It is difficult to determine the main factor that caused the significant reduction in κL in M9 and M10. In general, the models from M9 to M12 have smaller κL than the other models. All these models (from M9 to M12) contain the elements Ti and V, which are the lightest of the remaining elements. This can cause a larger mismatch between size and mass, which may lead to larger lattice distortion in these models and thus smaller κL. These 12 HE models were investigated for their local lattice distortion (LD). M1, M7, and M12 have the highest LD while models M3, M5, M6, and M9 have the lowest LD. It is known that alloying with heavy elements, such as W and Ta in M5 and M6, may result in high LD. However, with the lower LD of M5 and M6, we conclude that heavy elements are not the only factor making the lattice more distorted. LD is correlated with lattice thermal conductivity (κL). A high LD indicates higher phonon scattering and thus low κL, while a small LD indicates higher κL. This correlation is revealed for most models, whereas it is not clear for the model M9. The higher LD and lower κL that some of these HE models have may not make them perfect for TE applications, since they are all metals with a zero energy band gap that indicates a very small Seebeck coefficient. Thus, more research work is required for enhancing the value of Seebeck coefficient and figure of merit. The promising current results encourage and inspire us to continue research in this direction for more complex and interesting high-entropy materials. Our DFT calculations could be improved by using better options, such as using either hybrid potential or Becke–Johnson potential. Overall, we believe our results can facilitate the design of new high-entropy materials with wider applications.

Supplementary Materials

The following supporting information can be downloaded at: https://www.mdpi.com/article/10.3390/met13121953/s1. Figure S1. Calculated total density of states (TDOS) and partial density of states (PDOS) of the 12 bcc HEAs models; Figure S2. Calculated partial charge (PC) distribution of the 12 bcc HEAs models; Figure S3. Calculated bond order (BO) versus bond length (BL) of the 12 bcc HEAs models; Figure S4. The pie charts that show the percentages of different bonding types of the 12 bcc HEAs models. Refs. [98,99,100,101,102,103,104,105,106,107,108,109,110,111] are cited in supplementary materials.

Author Contributions

Conceptualization, W.-Y.C.; calculation, S.S.; writing—original draft preparation, S.H. and P.A.; writing—review and editing, P.A., S.H., S.S. and W.-Y.C.; supervision, W.-Y.C. All authors have read and agreed to the published version of the manuscript.

Funding

This research did not receive any specific grant from funding agencies in the public, commercial, or not-for-profit sectors.

Data Availability Statement

The data presented in this study are available on request from the corresponding author. The data are not publicly available due to privacy.

Acknowledgments

This research used the resources of the National Energy Research Scientific Computing Center supported by DOE under Contract No. DE-AC03-76SF00098 and the Research Computing Support Services (RCSS) of the University of Missouri System.

Conflicts of Interest

The authors declare no conflict of interest.

References

  1. Yeh, J.W.; Chen, S.K.; Lin, S.J.; Gan, J.Y.; Chin, T.S.; Shun, T.T.; Tsau, C.H.; Chang, S.Y. Nanostructured High-Entropy Alloys with Multiple Principal Elements: Novel Alloy Design Concepts and Outcomes. Adv. Eng. Mater. 2004, 6, 299–303. [Google Scholar] [CrossRef]
  2. Cantor, B.; Chang, I.T.H.; Knight, P.; Vincent, A.J.B. Microstructural Development in Equiatomic Multicomponent Alloys. Mater. Sci. Eng. A 2004, 375–377, 213–218. [Google Scholar] [CrossRef]
  3. Yeh, J.W.; Chen, Y.L.; Lin, S.J.; Chen, S.K. High-Entropy Alloys—A New Era of Exploitation. Mater. Sci. Forum 2007, 560, 1–9. [Google Scholar] [CrossRef]
  4. Zhu, H.; Zhao, T.; Zhang, B.; An, Z.; Mao, S.; Wang, G.; Han, X.; Lu, X.; Zhang, J.; Zhou, X. Entropy Engineered Cubic N-Type AgBiSe2 Alloy with High Thermoelectric Performance in Fully Extended Operating Temperature Range. Adv. Energy Mater. 2021, 11, 2003304. [Google Scholar] [CrossRef]
  5. Sun, L.; Cava, R.J. High-Entropy Alloy Superconductors: Status, Opportunities, and Challenges. Phys. Rev. Mater. 2019, 3, 090301. [Google Scholar] [CrossRef]
  6. Yeh, J.W. Alloy Design Strategies and Future Trends in High-Entropy Alloys. JOM 2013, 65, 1759–1771. [Google Scholar] [CrossRef]
  7. Dąbrowa, J.; Zajusz, M.; Kucza, W.; Cieślak, G.; Berent, K.; Czeppe, T.; Kulik, T.; Danielewski, M. Demystifying the Sluggish Diffusion Effect in High Entropy Alloys. J. Alloys Compd. 2019, 783, 193–207. [Google Scholar] [CrossRef]
  8. Jiang, B.; Yu, Y.; Cui, J.; Liu, X.; Xie, L.; Liao, J.; Zhang, Q.; Huang, Y.; Ning, S.; Jia, B.; et al. High-Entropy-Stabilized Chalcogenides with High Thermoelectric Performance. Science 2021, 371, 830–834. [Google Scholar] [CrossRef]
  9. Jiang, B.; Wang, W.; Liu, S.; Wang, Y.; Wang, C.; Chen, Y.; Xie, L.; Huang, M.; He, J. High Figure-of-Merit and Power Generation in High-Entropy GeTe-Based Thermoelectrics. Science 2022, 377, 208–213. [Google Scholar] [CrossRef]
  10. Waseem, O.A.; Ryu, H.J. Combinatorial Synthesis and Analysis of AlxTayVz-Cr20Mo20Nb20Ti20Zr10 and Al10CrMoxNbTiZr10 Refractory High-Entropy Alloys: Oxidation Behavior. J. Alloys Compd. 2020, 828, 154427. [Google Scholar] [CrossRef]
  11. Chen, C.; Zhang, H.; Fan, Y.; Zhang, W.; Wei, R.; Wang, T.; Zhang, T.; Li, F. A Novel Ultrafine-Grained High Entropy Alloy with Excellent Combination of Mechanical and Soft Magnetic Properties. J. Magn. Magn. Mater. 2020, 502, 166513. [Google Scholar] [CrossRef]
  12. Granberg, F.; Nordlund, K.; Ullah, M.W.; Jin, K.; Lu, C.; Bei, H.; Wang, L.M.; Djurabekova, F.; Weber, W.J.; Zhang, Y. Mechanism of Radiation Damage Reduction in Equiatomic Multicomponent Single Phase Alloys. Phys. Rev. Lett. 2016, 116, 135504. [Google Scholar] [CrossRef] [PubMed]
  13. Zhang, Y.; Egami, T.; Weber, W.J. Dissipation of Radiation Energy in Concentrated Solid-Solution Alloys: Unique Defect Properties and Microstructural Evolution. MRS Bull. 2019, 44, 798–811. [Google Scholar] [CrossRef]
  14. Zhang, Y.; Stocks, G.M.; Jin, K.; Lu, C.; Bei, H.; Sales, B.C.; Wang, L.; Béland, L.K.; Stoller, R.E.; Samolyuk, G.D.; et al. Influence of Chemical Disorder on Energy Dissipation and Defect Evolution in Concentrated Solid Solution Alloys. Nat. Commun. 2015, 6, 8736. [Google Scholar] [CrossRef] [PubMed]
  15. Lu, C.; Niu, L.; Chen, N.; Jin, K.; Yang, T.; Xiu, P.; Zhang, Y.; Gao, F.; Bei, H.; Shi, S.; et al. Enhancing Radiation Tolerance by Controlling Defect Mobility and Migration Pathways in Multicomponent Single-Phase Alloys. Nat. Commun. 2016, 7, 13564. [Google Scholar] [CrossRef]
  16. Ikeda, Y.; Grabowski, B.; Körmann, F. Ab Initio Phase Stabilities and Mechanical Properties of Multicomponent Alloys: A Comprehensive Review for High Entropy Alloys and Compositionally Complex Alloys. Mater. Charact. 2019, 147, 464–511. [Google Scholar] [CrossRef]
  17. El-Atwani, O.; Li, N.; Li, M.; Devaraj, A.; Baldwin, J.K.S.; Schneider, M.M.; Sobieraj, D.; Wróbel, J.S.; Nguyen-Manh, D.; Maloy, S.A.; et al. Outstanding Radiation Resistance of Tungsten-Based High-Entropy Alloys. Sci. Adv. 2019, 5, eaav2002. [Google Scholar] [CrossRef]
  18. Zhang, Y.; Zhou, Y.J.; Lin, J.P.; Chen, G.L.; Liaw, P.K. Solid-Solution Phase Formation Rules for Multi-Component Alloys. Adv. Eng. Mater. 2008, 10, 534–538. [Google Scholar] [CrossRef]
  19. Takeuchi, A.; Inoue, A. Quantitative Evaluation of Critical Cooling Rate for Metallic Glasses. Mater. Sci. Eng. A 2001, 304–306, 446–451. [Google Scholar] [CrossRef]
  20. Guo, S.; Ng, C.; Lu, J.; Liu, C.T. Effect of Valence Electron Concentration on Stability of Fcc or Bcc Phase in High Entropy Alloys. J. Appl. Phys. 2011, 109, 103505. [Google Scholar] [CrossRef]
  21. Wu, Z.; Bei, H.; Otto, F.; Pharr, G.M.; George, E.P. Recovery, Recrystallization, Grain Growth and Phase Stability of a Family of FCC-Structured Multi-Component Equiatomic Solid Solution Alloys. Intermetallics 2014, 46, 131–140. [Google Scholar] [CrossRef]
  22. Senkov, O.N.; Wilks, G.B.; Miracle, D.B.; Chuang, C.P.; Liaw, P.K. Refractory High-Entropy Alloys. Intermetallics 2010, 18, 1758–1765. [Google Scholar] [CrossRef]
  23. Senkov, O.N.; Scott, J.M.; Senkova, S.V.; Miracle, D.B.; Woodward, C.F. Microstructure and Room Temperature Properties of a High-Entropy TaNbHfZrTi Alloy. J. Alloys Compd. 2011, 509, 6043–6048. [Google Scholar] [CrossRef]
  24. Senkov, O.N.; Scott, J.M.; Senkova, S.V.; Meisenkothen, F.; Miracle, D.B.; Woodward, C.F. Microstructure and Elevated Temperature Properties of a Refractory TaNbHfZrTi Alloy. J. Mater. Sci. 2012, 47, 4062–4074. [Google Scholar] [CrossRef]
  25. Senkov, O.N.; Woodward, C.F. Microstructure and properties of a refractory NbCrMo0.5Ta0.5TiZr alloy. Mater. Sci. Eng. A 2011, 529, 311–320. [Google Scholar] [CrossRef]
  26. Senkov, O.N.; Senkova, S.V.; Woodward, C.; Miracle, D.B. Low-Density, Refractory Multi-Principal Element Alloys of the Cr-Nb-Ti-V-Zr System: Microstructure and Phase Analysis. Acta Mater. 2013, 61, 1545–1557. [Google Scholar] [CrossRef]
  27. Senkov, O.N.; Senkova, S.V.; Miracle, D.B.; Woodward, C. Mechanical Properties of Low-Density, Refractory Multi-Principal Element Alloys of the Cr-Nb-Ti-V-Zr System. Mater. Sci. Eng. A 2013, 565, 51–62. [Google Scholar] [CrossRef]
  28. Zhang, Y.; Yang, X.; Liaw, P.K. Alloy Design and Properties Optimization of High-Entropy Alloys. Jom 2012, 64, 830–838. [Google Scholar] [CrossRef]
  29. Gao, M.C.; Alman, D.E. Searching for Next Single-Phase High-Entropy Alloy Compositions. Entropy 2013, 15, 4504–4519. [Google Scholar] [CrossRef]
  30. Tian, F.; Wang, D.; Shen, J.; Wang, Y. An Ab Initio Investgation of Ideal Tensile and Shear Strength of TiVNbMo High-Entropy Alloy. Mater. Lett. 2016, 166, 271–275. [Google Scholar] [CrossRef]
  31. Fazakas, E.; Zadorozhnyy, V.; Varga, L.K.; Inoue, A.; Louzguine-Luzgin, D.V.; Tian, F.; Vitos, L. Experimental and Theoretical Study of Ti20Zr20Hf 20Nb20X20 (X = v or Cr) Refractory High-Entropy Alloys. Int. J. Refract. Met. Hard Mater. 2014, 47, 131–138. [Google Scholar] [CrossRef]
  32. Huhn, W. Thermodynamics from First Principles: Prediction of Phase Diagrams and Materials Properties Using Density Functional Theory. Ph.D. Thesis, Carnegie Mellon University, Pittsburgh, PA, USA, 2014. [Google Scholar]
  33. Toda-Caraballo, I.; Wróbel, J.S.; Dudarev, S.L.; Nguyen-Manh, D.; Rivera-Díaz-Del-Castillo, P.E.J. Interatomic Spacing Distribution in Multicomponent Alloys. Acta Mater. 2015, 97, 156–169. [Google Scholar] [CrossRef]
  34. Gao, M.C.; Zhang, B.; Yang, S.; Guo, S.M. Senary Refractory High-Entropy Alloy HfNbTaTiVZr. Metall. Mater. Trans. A Phys. Metall. Mater. Sci. 2016, 47, 3333–3345. [Google Scholar] [CrossRef]
  35. Li, X.; Tian, F.; Schönecker, S.; Zhao, J.; Vitos, L. Ab Initio-Predicted Micro-Mechanical Performance of Refractory High-Entropy Alloys. Sci. Rep. 2015, 5, 12334. [Google Scholar] [CrossRef] [PubMed]
  36. Körmann, F.; Sluiter, M.H.F. Interplay between Lattice Distortions, Vibrations and Phase Stability in NbMoTaW High Entropy Alloys. Entropy 2016, 18, 403. [Google Scholar] [CrossRef]
  37. Tian, L.Y.; Wang, G.; Harris, J.S.; Irving, D.L.; Zhao, J.; Vitos, L. Alloying Effect on the Elastic Properties of Refractory High-Entropy Alloys. Mater. Des. 2017, 114, 243–252. [Google Scholar] [CrossRef]
  38. Feng, B.; Widom, M. Elastic Stability and Lattice Distortion of Refractory High Entropy Alloys. Mater. Chem. Phys. 2018, 210, 309–314. [Google Scholar] [CrossRef]
  39. Song, H.; Tian, F.; Hu, Q.M.; Vitos, L.; Wang, Y.; Shen, J.; Chen, N. Local Lattice Distortion in High-Entropy Alloys. Phys. Rev. Mater. 2017, 1, 023404. [Google Scholar] [CrossRef]
  40. Ge, H.; Tian, F.; Wang, Y. Elastic and Thermal Properties of Refractory High-Entropy Alloys from First-Principles Calculations. Comput. Mater. Sci. 2017, 128, 185–190. [Google Scholar] [CrossRef]
  41. He, J.; Tritt, T.M. Advances in Thermoelectric Materials Research: Looking Back and Moving Forward. Science 2017, 357, eaak9997. [Google Scholar] [CrossRef]
  42. Wu, Y.; Chen, Z.; Nan, P.; Chen, L.; Wu, Y.; Chen, Z.; Nan, P.; Xiong, F.; Lin, S.; Zhang, X.; et al. Lattice Strain Advances Thermoelectrics Lattice Strain Advances Thermoelectrics. Joule 2019, 3, 1276–1288. [Google Scholar] [CrossRef]
  43. Shafeie, S.; Guo, S.; Hu, Q.; Fahlquist, H.; Erhart, P.; Palmqvist, A. High-Entropy Alloys as High-Temperature Thermoelectric Materials. J. Appl. Phys. 2015, 118, 184905. [Google Scholar] [CrossRef]
  44. Fan, Z.; Wang, H.; Wu, Y.; Liu, X.J.; Lu, Z.P. Thermoelectric High-Entropy Alloys with Low Lattice Thermal Conductivity. RSC Adv. 2016, 6, 52164–52170. [Google Scholar] [CrossRef]
  45. Lee, J.I.; Oh, H.S.; Park, E.S. Manipulation of σy/κ Ratio in Single Phase FCC Solid-Solutions. Appl. Phys. Lett. 2016, 109, 061906. [Google Scholar] [CrossRef]
  46. Dutta, B.; Ghosh, S. Vibrational Properties of NixPt1−x Alloys: An Understanding from Ab Initio Calculations. J. Appl. Phys. 2011, 109, 053714. [Google Scholar] [CrossRef]
  47. Grånäs, O.; Dutta, B.; Ghosh, S.; Sanyal, B. A New First Principles Approach to Calculate Phonon Spectra of Disordered Alloys. J. Phys. Condens. Matter 2012, 24, 015402. [Google Scholar] [CrossRef] [PubMed]
  48. Dutta, B.; Bisht, K.; Ghosh, S. Ab Initio Calculation of Phonon Dispersions in Size-Mismatched Disordered Alloys. Phys. Rev. B-Condens. Matter Mater. Phys. 2010, 82, 134207. [Google Scholar] [CrossRef]
  49. Alam, A.; Ghosh, S.; Mookerjee, A. Phonons in Disordered Alloys: Comparison between Augmented-Space-Based Approximations for Configuration Averaging to Integration from First Principles. Phys. Rev. B-Condens. Matter Mater. Phys. 2007, 75, 134202. [Google Scholar] [CrossRef]
  50. Chouhan, R.K.; Alam, A.; Ghosh, S.; Mookerjee, A. Interplay of Force Constants in the Lattice Dynamics of Disordered Alloys: An Ab Initio Study. Phys. Rev. B-Condens. Matter Mater. Phys. 2014, 89, 060201. [Google Scholar] [CrossRef]
  51. Wang, Y.; Zacherl, C.L.; Shang, S.; Chen, L.Q.; Liu, Z.K. Phonon Dispersions in Random Alloys: A Method Based on Special Quasi-Random Structure Force Constants. J. Phys. Condens. Matter 2011, 23, 485403. [Google Scholar] [CrossRef]
  52. Tian, F. A Review of Solid-Solution Models of High-Entropy Alloys Based on Ab Initio Calculations. Front. Mater. 2017, 4, 36. [Google Scholar] [CrossRef]
  53. Zunger, A.; Wei, S.H.; Ferreira, L.G.; Bernard, J.E. Special Quasirandom Structures. Phys. Rev. Lett. 1990, 65, 353. [Google Scholar] [CrossRef]
  54. King, D.J.M.; Burr, P.A.; Obbard, E.G.; Middleburgh, S.C. DFT Study of the Hexagonal High-Entropy Alloy Fission Product System. J. Nucl. Mater. 2017, 488, 70–74. [Google Scholar] [CrossRef]
  55. Soven, P. Coherent-Potential Model of Substitutional Disordered Alloys. Phys. Rev. 1967, 156, 809–813. [Google Scholar] [CrossRef]
  56. Bellaiche, L.; Vanderbilt, D. Virtual Crystal Approximation Revisited: Application to Dielectric and Piezoelectric Properties of Perovskites. Phys. Rev. B-Condens. Matter Mater. Phys. 2000, 61, 7877–7882. [Google Scholar] [CrossRef]
  57. Ching, W.Y.; San, S.; Brechtl, J.; Sakidja, R.; Zhang, M.; Liaw, P.K. Fundamental Electronic Structure and Multiatomic Bonding in 13 Biocompatible High-Entropy Alloys. npj Comput. Mater. 2020, 6, 45. [Google Scholar] [CrossRef]
  58. Dharmawardhana, C.C.; Misra, A.; Ching, W.Y. Quantum Mechanical Metric for Internal Cohesion in Cement Crystals. Sci. Rep. 2014, 4, 7332. [Google Scholar] [CrossRef] [PubMed]
  59. Kresse, G. Efficient Iterative Schemes for Ab Initio Total-Energy Calculations Using a Plane-Wave Basis Se. Phys. Rev. B 1996, 54, 11169. [Google Scholar] [CrossRef] [PubMed]
  60. Kresse, G. Ab Initio Molecular Dynamics for Liquid Metals. Phys. Rev. B 1993, 47, 558. [Google Scholar] [CrossRef]
  61. Reuss, A. Berechnung Der Fließgrenze von Mischkristallen Auf Grund Der Plastizitätsbedingung Für Einkristalle. ZAMM-J. Appl. Math. Mech./Zeitschrift für Angewandte Mathematik und Mechanik 1929, 9, 49–58. [Google Scholar] [CrossRef]
  62. Hill, R. The Elastic Behaviour of a Crystalline Aggregate. Proc. Phys. Soc. 1952, 65, 349. [Google Scholar] [CrossRef]
  63. Bao, L.; Kong, Z.; Qu, D.; Duan, Y. Revealing the Elastic Properties and Anisotropies of Mg2X(X = Si, Ge and Sn) with Different Structures from a First-Principles Calculation. Mater. Today Commun. 2020, 24, 101337. [Google Scholar] [CrossRef]
  64. Mo, Y.; Rulis, P.; Ching, W.Y. Electronic Structure and Optical Conductivities of 20 MAX-Phase Compounds. Phys. Rev. B-Condens. Matter Mater. Phys. 2012, 86, 165122. [Google Scholar] [CrossRef]
  65. Ching, W.Y.; Yoshiya, M.; Adhikari, P.; Rulis, P.; Ikuhara, Y.; Tanaka, I. First-Principles Study in an Inter-Granular Glassy Film Model of Silicon Nitride. J. Am. Ceram. Soc. 2018, 101, 2673–2688. [Google Scholar] [CrossRef]
  66. Mulliken, R.S. Electronic Population Analysis on LCAO-MO Molecular Wave Functions. I. J. Chem. Phys. 1955, 23, 1833–1840. [Google Scholar] [CrossRef]
  67. Hasan, S.; Adhikari, P.; Baral, K.; Ching, W.Y. Conspicuous Interatomic Bonding in Chalcogenide Crystals and Implications on Electronic, Optical, and Elastic Properties. AIP Adv. 2020, 10, 075216. [Google Scholar] [CrossRef]
  68. Hasan, S.; Baral, K.; Li, N.; Ching, W.Y. Structural and Physical Properties of 99 Complex Bulk Chalcogenides Crystals Using First-Principles Calculations. Sci. Rep. 2021, 11, 9921. [Google Scholar] [CrossRef] [PubMed]
  69. Hasan, S.; Rulis, P.; Ching, W. First-Principles Calculations of the Structural, Electronic, Optical, and Mechanical Properties of 21 Pyrophosphate Crystals. Crystals 2022, 12, 1139. [Google Scholar] [CrossRef]
  70. Hunca, B.; Dharmawardhana, C.; Sakidja, R.; Ching, W.Y. Ab Initio Calculations of Thermomechanical Properties and Electronic Structure of Vitreloy Zr41.2Ti13.8Cu12.5Ni10Be22.5. Phys. Rev. B 2016, 94, 144207. [Google Scholar] [CrossRef]
  71. Poudel, L.; Twarock, R.; Steinmetz, N.F.; Podgornik, R.; Ching, W.Y. Impact of Hydrogen Bonding in the Binding Site between Capsid Protein and MS2 Bacteriophage SsRNA. J. Phys. Chem. B 2017, 121, 6321–6330. [Google Scholar] [CrossRef]
  72. Adhikari, P.; Li, N.; Shin, M.; Steinmetz, N.F.; Twarock, R.; Podgornik, R.; Ching, W.Y. Intra- And Intermolecular Atomic-Scale Interactions in the Receptor Binding Domain of SARS-CoV-2 Spike Protein: Implication for ACE2 Receptor Binding. Phys. Chem. Chem. Phys. 2020, 22, 18272–18283. [Google Scholar] [CrossRef] [PubMed]
  73. San, S.; Tong, Y.; Bei, H.; Kombaiah, B.; Zhang, Y.; Ching, W.Y. First-Principles Calculation of Lattice Distortions in Four Single Phase High Entropy Alloys with Experimental Validation. Mater. Des. 2021, 209, 110071. [Google Scholar] [CrossRef]
  74. Bérardan, D.; Franger, S.; Dragoe, D.; Meena, A.K.; Dragoe, N. Colossal Dielectric Constant in High Entropy Oxides. Phys. Status Solidi-Rapid Res. Lett. 2016, 10, 328–333. [Google Scholar] [CrossRef]
  75. Yao, H.; Ouyang, L.; Ching, W.Y. Ab Initio Calculation of Elastic Constants of Ceramic Crystals. J. Am. Ceram. Soc. 2007, 90, 3194–3204. [Google Scholar] [CrossRef]
  76. Deng, H. Theoretical Prediction of the Structural, Electronic, Mechanical and Thermodynamic Properties of the Binary α-As2Te3 and β-As2Te3. J. Alloys Compd. 2015, 656, 695–701. [Google Scholar] [CrossRef]
  77. Tian, Y.; Xu, B.; Zhao, Z. Microscopic Theory of Hardness and Design of Novel Superhard Crystals. Int. J. Refract. Met. Hard Mater. 2012, 33, 93–106. [Google Scholar] [CrossRef]
  78. Pugh, S.F. Relations between the Elastic Moduli and the Plastic Properties of Polycrystalline Pure Metals. Lond. Edinb. Dublin Philos. Mag. J. Sci. 1954, 45, 823–843. [Google Scholar] [CrossRef]
  79. Ali, M.A.; Hossain, M.A.; Rayhan, M.A.; Hossain, M.M.; Uddin, M.M.; Roknuzzaman, M.; Ostrikov, K.; Islam, A.K.; Naqib, S.H. First-Principles Study of Elastic, Electronic, Optical and Thermoelectric Properties of Newly Synthesized K2Cu2GeS4 Chalcogenide. J. Alloys Compd. 2019, 781, 37–46. [Google Scholar] [CrossRef]
  80. Heciri, D.; Belkhir, H.; Belghit, R.; Bouhafs, B.; Khenata, R.; Ahmed, R.; Bouhemadou, A.; Ouahrani, T.; Wang, X.; Bin Omran, S. Insight into the Structural, Elastic and Electronic Properties of Tetragonal Inter-Alkali Metal Chalcogenides CsNaX (X = S, Se, and Te) from First-Principles Calculations. Mater. Chem. Phys. 2019, 221, 125–137. [Google Scholar] [CrossRef]
  81. Mouhat, F.; Coudert, F.X. Necessary and Sufficient Elastic Stability Conditions in Various Crystal Systems. Phys. Rev. B-Condens. Matter Mater. Phys. 2014, 90, 224104. [Google Scholar] [CrossRef]
  82. Thakur, V.; Pagare, G. Theoretical Calculations of Elastic, Mechanical and Thermal Properties of REPt3 (RE = Sc, Y and Lu) Intermetallic Compounds Based on DFT. Indian J. Phys. 2018, 92, 1503–1513. [Google Scholar] [CrossRef]
  83. Yang, Y.; Wang, W.; Gan, G.-Y.; Shi, X.-F.; Tang, B.-Y. Structural, Mechanical and Electronic Properties of (TaNbHfTiZr)C High Entropy Carbide under Pressure: Ab Initio Investigation. Phys. B Phys. Condens. Matter 2018, 550, 163–170. [Google Scholar] [CrossRef]
  84. Yang, A.; Bao, L.; Peng, M.; Duan, Y. Explorations of Elastic Anisotropies and Thermal Properties of the Hexagonal TMSi2 (TM = Cr, Mo, W) Silicides from First-Principles Calculations. Mater. Today Commun. 2021, 27, 102474. [Google Scholar] [CrossRef]
  85. Ma, H.; Zhang, X.; Wang, F. First-Principles Study of the Lattice Vibration, Elastic Anisotropy and Thermodynamical Properties of Tantalum Silicide with the Different Crystal Structures. Vacuum 2021, 191, 110410. [Google Scholar] [CrossRef]
  86. Senkov, O.N.; Miracle, D.B.; Chaput, K.J.; Couzinie, J.P. Development and Exploration of Refractory High Entropy Alloys—A Review. J. Mater. Res. 2018, 33, 3092–3128. [Google Scholar] [CrossRef]
  87. Li, X.Y.; Zhang, H.P.; Lan, S.; Abernathy, D.L.; Otomo, T.; Wang, F.W.; Ren, Y.; Li, M.Z.; Wang, X.L. Observation of High-Frequency Transverse Phonons in Metallic Glasses. Phys. Rev. Lett. 2020, 124, 225902. [Google Scholar] [CrossRef] [PubMed]
  88. Shen, Y.; Clarke, D.R.; Fuierer, P.A. Anisotropic Thermal Conductivity of the Aurivillus Phase, Bismuth Titanate (Bi4Ti3O12): A Natural Nanostructured Superlattice. Appl. Phys. Lett. 2008, 93, 102907. [Google Scholar] [CrossRef]
  89. Clarke, D.R. Materials Selections Guidelines for Low Thermal Conductivity Thermal Barrier Coatings. Surf. Coatings Technol. [CrossRef]
  90. Cahill, D.G.; Watson, S.K.; Pohl, R.O. Lower Limit to the Thermal Conductivity of Disordered Crystals. Phys. Rev. B 1992, 46, 6131–6140. [Google Scholar] [CrossRef]
  91. Morelli, D.T.; Slack, G.A. High Lattice Thermal Conductivity Solids. In High Thermal Conductivity Materials; Springer: New York, NY, USA, 2006; pp. 37–68. [Google Scholar] [CrossRef]
  92. Murphy, K.F. Strain Effects on Thermal Conductivity of Nanostructured Silicon by Raman Piezothermography. Doctoral Dissertation, University of Pennsylvania, Philadelphia, PA, USA, 2014. [Google Scholar]
  93. Bhowmick, S. Effect of Strain on the Thermal Conductivity of Solids. J. Chem. Phys. 2006, 125, 164513. [Google Scholar] [CrossRef]
  94. Knura, R.; Parashchuk, T. Origins of Low Lattice Thermal Conductivity of Pb1 − x Snx Te Alloys for Thermoelectric Applications. Dalton Trans. 2021, 50, 4323–4334. [Google Scholar] [CrossRef]
  95. Jia, T.; Chen, G.; Zhang, Y. Lattice Thermal Conductivity Evaluated Using Elastic Properties. Phys. Rev. B 2017, 95, 155206. [Google Scholar] [CrossRef]
  96. Brugger, K. Generalized Griineisen Parameters in the Anisotropic Debye Model. Phys. Rev. 1965, 137, A1826. [Google Scholar] [CrossRef]
  97. Malhotra, A.; Maldovan, M. Impact of Phonon Surface Scattering on Thermal Energy Distribution of Si and SiGe Nanowires. Sci. Rep. 2016, 6, 25818. [Google Scholar] [CrossRef] [PubMed]
  98. Jiang, S.; Shao, L.; Fan, T.W.; Duan, J.M.; Chen, X.T.; Tang, B.Y. Elastic and thermodynamic properties of high entropy carbide (HfTaZrTi)C and (HfTaZrNb)C from ab initio investigation. Ceram. Int. 2020, 46, 15104–15112. [Google Scholar] [CrossRef]
  99. Boudiaf, K.; Bouhemadou, A.; Boudrifa, O.; Haddadi, K.; Saoud, F.S.; Khenata, R.; Al-Douri, Y.; Bin-Omran, S.; Ghebouli, M.A. Structural, Elastic, Electronic and Optical Properties of LaOAgS-Type Silver Fluoride Chalcogenides: First-Principles Study. J. Electron. Mater. 2017, 46, 4539–4556. [Google Scholar] [CrossRef]
  100. Guo, F.; Zhou, X.; Li, G.; Huang, X.; Xue, L.; Liu, D.; Jiang, D. Structural, mechanical, electronic and thermodynamic properties of cubic TiC compounds under different pressures: A first-principles study. Solid State Commun. 2020, 311, 113856. [Google Scholar] [CrossRef]
  101. Anderson, O.L. A simplified method for calculating the Debye temperature from elastic constants. J. Phys. Chem. Solids 1963, 24, 909–917. [Google Scholar] [CrossRef]
  102. Wachter, P.; Filzmoser, M.; Rebizant, J. Electronic and elastic properties of the light actinide tellurides. Phys. B Condens. Matter 2001, 293, 199–223. [Google Scholar] [CrossRef]
  103. Fine, M.E.; Brown, L.D.; Marcus, H.L. Elastic constants versus melting temperature in metals. Scr. Metall. 1984, 18, 951–956. [Google Scholar] [CrossRef]
  104. Benkaddour, K.; Chahed, A.; Amar, A.; Rozale, H.; Lakdja, A.; Benhelal, O.; Sayede, A. First-principles study of structural, elastic, thermodynamic, electronic and magnetic properties for the quaternary Heusler alloys CoRuFeZ (Z = Si, Ge, Sn). J. Alloys Compd. 2016, 687, 211–220. [Google Scholar] [CrossRef]
  105. Liu, S.Y.; Zhang, S.; Liu, S.; Li, D.J.; Li, Y.; Wang, S. Phase stability, mechanical properties and melting points of high-entropy quaternary metal carbides from first-principles. J. Eur. Ceram. Soc. 2021, 41, 267–6274. [Google Scholar] [CrossRef]
  106. Clarke, D.R.; Levi, C.G. Materials design for the next generation thermal barrier coatings. Annu. Rev. Mater. Res. 2003, 33, 383–417. [Google Scholar] [CrossRef]
  107. Cahill, D.G.; Ford, W.K.; Goodson, K.E.; Mahan, G.D.; Majumdar, A.; Maris, H.J.; Merlin, R.; Phillpot, S.R. Nanoscale thermal transport. J. Appl. Phys. 2003, 93, 793–818. [Google Scholar] [CrossRef]
  108. Morelli, D.T.; Heremans, J.P. Thermal conductivity of germanium, silicon, and carbon nitrides. Appl. Phys. Lett. 2002, 81, 5126–5128. [Google Scholar] [CrossRef]
  109. Toberer, E.S.; Zevalkink, A.; Snyder, G.J. Phonon engineering through crystal chemistry. J. Mater. Chem. 2011, 21, 15843–15852. [Google Scholar] [CrossRef]
  110. Arab, F.; Sahraoui, F.A.; Haddadi, K.; Bouhemadou, A.; Louail, L. Phase stability, mechanical and thermodynamic properties of orthorhombic and trigonal MgSiN 2: An ab initio study. Phase Transitions 2016, 89, 480–513. [Google Scholar] [CrossRef]
  111. Naher, M.I.; Afzal, M.A.; Naqib, S.H. A comprehensive DFT based insights into the physical properties of tetragonal superconducting Mo5PB2. Results Phys. 2021, 28, 104612. [Google Scholar] [CrossRef]
Figure 1. Ball and stick structure of WTiVZrHf (M1) solid solution.
Metals 13 01953 g001
Figure 2. Calculated total density of states (TDOS) for the 12-BCC HEAs.
Metals 13 01953 g002
Figure 3. (a) Calculated Q_av^* versus bulk modulus K, (b) Q_av^* versus total electronic energy for the 12 BCC HEAs investigated. The dashed lines denote linear fit.
Metals 13 01953 g003
Figure 4. Calculated partial charge (PC) distribution for the 12 BCC HEAs.
Metals 13 01953 g004
Figure 5. The distribution of the partial bond order density (PBOD) for the 12 BCC HEAs.
Metals 13 01953 g005
Figure 6. Lattice distortion (LD) for the 12 BCC HEA models. FWHM of the Gaussian curve fitted to the histogram distribution of the bimodal peaks. The two peaks denote the NN and SNN.
Metals 13 01953 g006
Figure 7. (a) The distribution of Young’s modulus (E), bulk modulus (K), and shear modulus (G) for the 12 BCC HEAs. (b) Illustrates the relationship between total bond order density (TBOD) and the bulk modulus (K) for the same set of 12 BCC HEAs.
Metals 13 01953 g007
Figure 8. (a) The theoretical density (ρ), (b) longitudinal νl, transverse νs, and average sound velocities νm, (c) Debye temperature (ΘD), (d) thermal conductivities (κ) at 300 K for each model of the 12 BCC HEAs investigated.
Metals 13 01953 g008
Figure 9. Calculated acoustic Grüneisen constant for the 12-BCC investigated HEAs.
Metals 13 01953 g009
Table 1. The optimized structure parameters along with first and second nearest neighbors of the 12 BCC HEA models.
Modelsa(Å)b(Å)c(Å) α β γ Vol (Å3)NN (Å)SNN (Å)
M1WTiVZrHf 119.87119.91519.79490.32790.32989.8857832.8082.8673.310
M2HfMoTiWZr 119.9119.98719.88990.17490.23289.9457914.6252.8763.321
M3MoTaTiV 219.01519.01518.98889.92890.1490.0566865.2452.7433.168
M4MoTaTiVZr 119.58919.50719.48790.16490.35589.9437446.1292.8193.255
M5WTaCrV 218.5318.54218.54389.7489.82389.9036370.8882.6763.09
M6MoNbTaW 219.38719.38819.38889.99790.06589.9017287.2752.7423.878
M7TiZrHfW 220.25220.33820.26990.12990.06790.1758348.2262.9283.381
M8 TiZrNbMoTa 1 19.84419.85719.87589.90389.91890.1037831.8772.8663.31
M9NbTaTiV 219.28819.32519.29090.06090.05890.167189.9582.7863.217
M10TiVNbHf 219.71119.7219.62889.84389.58390.2687628.5822.8413.281
M11Ti0.38V0.15Nb0.23Hf0.24 2 19.82119.78819.79290.0689.94190.297762.6762.8583.300
M12TiZrHfVNb 1 20.13620.11320.01489.9490.01189.8698105.8732.8993.348
1 5-component model; 2 4-component model. NN and SNN stand for average distances of nearest neighbors (NN) and second nearest neighbors (SNN).
Table 2. List of partial charge (PC) and effective charge (Q*) for each atom in the 12 BCC HEA models.
Models M1M2M3M4M5M6M7M8M9M10M11M12VEC
TiPC−0.26−0.160.07−0.03----−0.32−0.09−0.12−0.26−0.24−0.314
Q*4.264.163.934.03----4.324.094.124.264.244.31
VPC−0.24--0.01−0.060.08------−0.12−0.25−0.23−0.285
Q*5.24--4.995.064.92------5.125.255.235.28
CrPC--------−0.71--------------6
Q*--------6.71--------------
ZrPC0.240.31 0.38----0.190.32------0.184
Q*3.763.69 3.62----3.813.68------3.82
NbPC----------0.32--0.210.220.090.090.025
Q*----------4.68--4.794.784.914.914.98
MoPC--−0.55−0.31−0.41 −0.43--−0.46--------6
Q*--6.556.316.41 6.43--6.46--------
HfPC0.450.53--------0.41----0.410.440.394
Q*3.553.47--------3.59----3.593.563.61
TaPC----0.230.120.350.08--0.020.03------5
Q*----4.774.884.654.92--4.984.97------
WPC−0.2−0.12----0.280.02−0.28----------6
Q*6.26.12----5.725.986.28----------
Q a v * or V E C a v 4.64.85.04.85.55.54.54.84.754.54.54.4
Table 3. The calculated elastic coefficients (C11, C12, C44), Young’s modulus (E), bulk modulus (K), shear modulus (G), Vicker’s hardness (HV), Poisson’s ratio (η), Pugh’s ratio (G/K), Cauchy pressure (CP), total bond order density (TBOD), and Zener ratio (AZ) for the 12 BCC HEAs.
ModelC11C12C44KGEHvCP: C12–C44ηG/KTBODAZ
M1170.71107.0437.11128.2434.8695.882.5969.930.3750.2720.0411.166
M2201.82114.1938.84143.3740.73111.633.0475.350.3700.2840.0420.887
M3258.38139.1131.43178.4640.72113.512.37107.670.3940.2280.0550.527
M4201.89116.3632.02144.8435.9299.532.3884.340.3860.2480.0470.749
M5376.99159.0948.63230.4767.53184.574.50110.470.3670.2930.0570.446
M6389.28159.9449.61234.9469.88190.734.69110.330.3650.2970.0510.433
M7164.35102.7244.12123.2238.20103.883.2058.600.3600.3100.0381.432
M8201.18118.7533.52146.2136.38100.772.4185.230.3850.2490.0420.813
M9200.66136.4624.30157.8327.1577.031.29112.160.4190.1720.0480.757
M10165.92110.5428.56128.9928.1778.781.7381.980.3980.2180.0401.031
M11159.86105.7932.62123.8130.2483.892.0773.170.3870.2440.0401.207
M12151.2399.4830.62116.7228.6179.342.0068.860.3870.2450.0361.183
Table 4. The theoretical density (ρ), calculated sound velocity (longitudinal νl, transverse νs, and average νm), Debye temperature (ΘD), and melting temperature (Tmelt) of 12 BCC HEAs.
Modelρ (Kg/m3)νl (m/s)νs (m/s)νm (m/s)ΘD (K)Tmelt (K)
M111,709.543862.681725.291946.48231.601561.88
M212,533.183971.511802.802032.49241.001745.76
M311,358.894526.661893.262141.44266.252080.01
M410,412.464302.301857.342098.35253.921746.15
M515,238.364586.222105.192372.21302.382781.03
M615,769.334561.452105.102371.51289.052853.66
M712,466.753737.641750.561970.71229.561524.32
M810,790.154247.931836.062074.22246.821741.94
M910,758.124246.851588.551802.85220.721738.88
M1010,071.864066.471672.391892.72227.191533.59
M119629.904128.411772.072002.46238.981497.77
M129453.014047.571739.701965.78231.231446.77
Table 5. Calculated minimum thermal conductivities (κmin) (W⋅m−1·K−1) at 300 K, lattice thermal conductivities (κL) (W⋅m−1·K−1) at 300 K, and Grüneisen parameter (γa), thermal expansion coefficient (α), and dominant phonon wavelength (λdom) at 300 K for each model of the 12 BCC HEAs investigated.
ModelClarke Model
κmin (W·m−1·K−1)
Cahill Model
κmin (W·m−1·K−1)
Slack Model
κL (W·m−1·K−1)
Mixed Model
κL (W·m−1·K−1)
γαα (×10−5)λdom (Å)
M10.548970.496590.693310.737102.3614.590.815
M20.568620.509620.881630.914132.3113.930.851
M30.662200.622940.764010.793562.5563.930.897
M40.613510.566180.709410.753642.4644.450.879
M50.766280.682461.756681.636482.2762.370.994
M60.700120.621661.843461.767632.2602.290.993
M70.530750.467440.871950.912172.2134.190.825
M80.586360.540740.712120.761332.4604.400.869
M90.543510.549050.344870.411322.8605.890.755
M100.546060.519040.450640.513102.6045.680.793
M110.569660.527520.562400.621152.4815.290.839
M120.543280.502710.523960.588082.4775.590.823
Disclaimer/Publisher’s Note: The statements, opinions and data contained in all publications are solely those of the individual author(s) and contributor(s) and not of MDPI and/or the editor(s). MDPI and/or the editor(s) disclaim responsibility for any injury to people or property resulting from any ideas, methods, instructions or products referred to in the content.

