
Parametric Investigation of the Effects of Electrical Discharge Machining on Plain D2 Steel


Abstract
:1. Introduction
2. Materials and Methods
2.1. Materials
2.2. Methods
Design of Experiments and Research Methodology
3. Results and Discussion
3.1. Taguchi Procedure
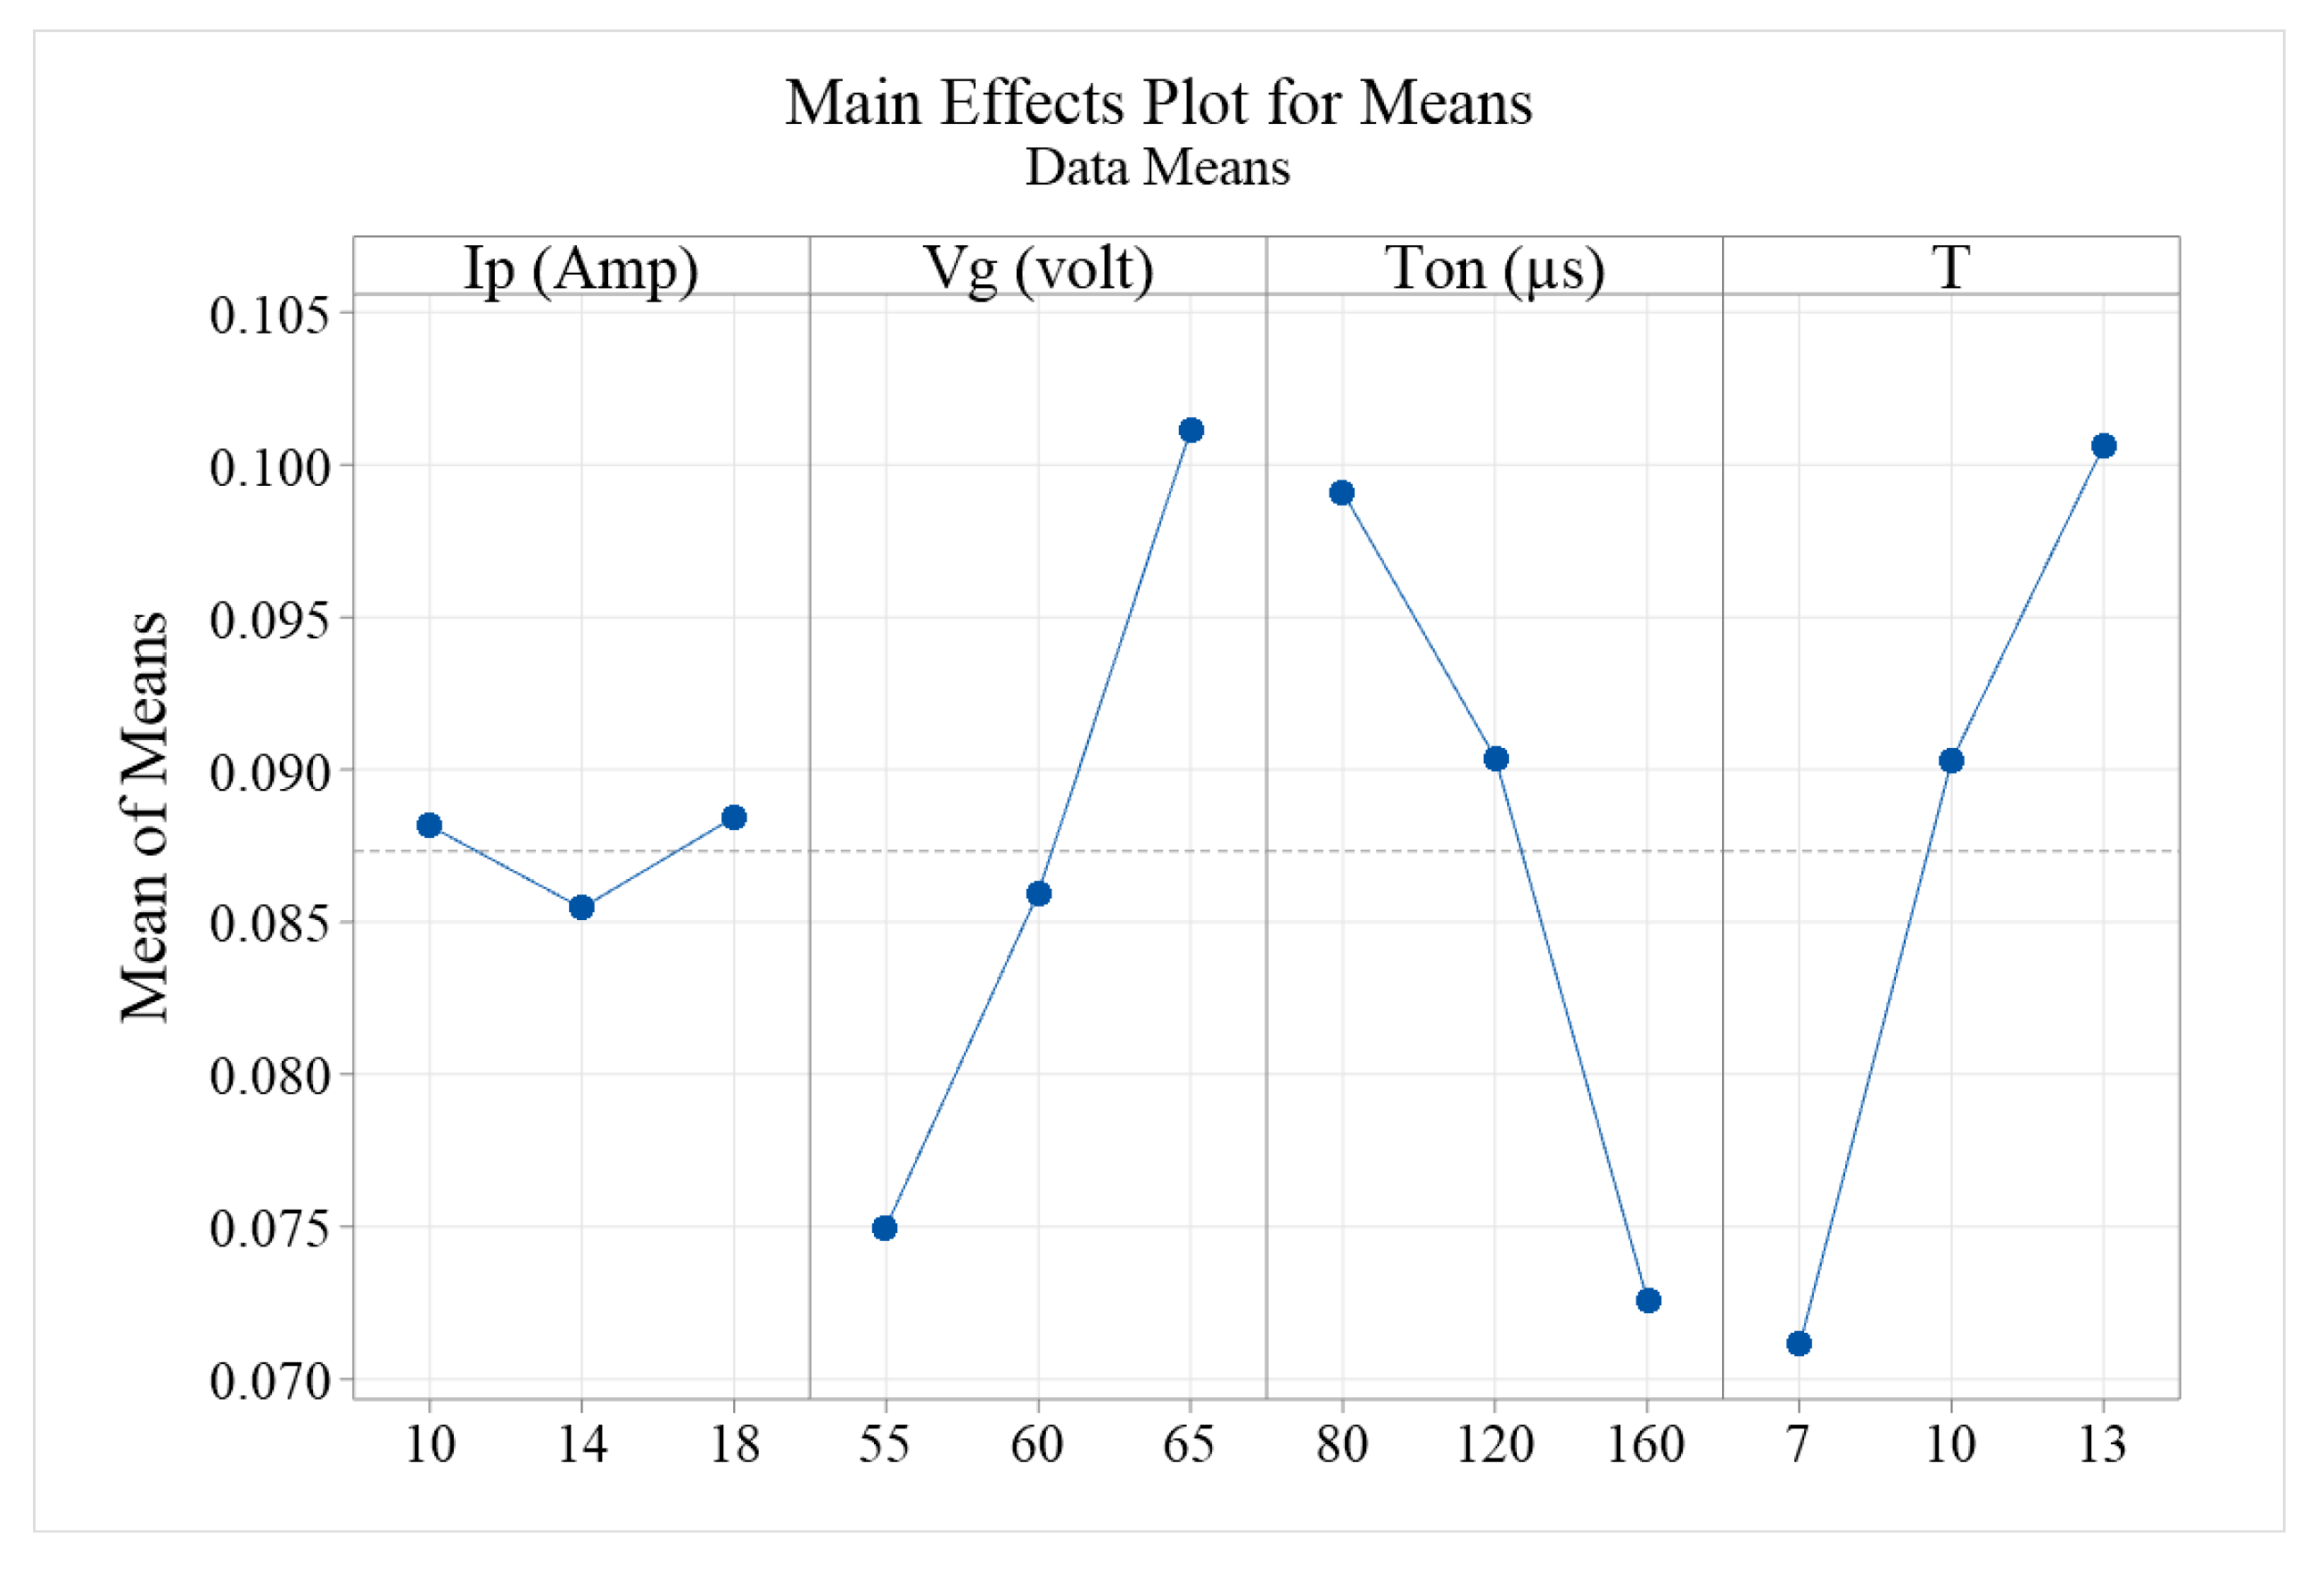
3.2. Effects of the EDM Parameters on MRR
- Varying the Ip (Amp) led to a change in MRR. The delta value associated with Ip was found to be 0.00297, placing it at rank 4 in terms of its significance on the MRR.
- Altering the Vg (volt) demonstrated a clear impact on the MRR. With a delta value of 0.02615, Vg ranks third in terms of its influence on MRR.
- Ton (μs), the on-time duration of the pulse, was also instrumental. Its change led to a delta value of 0.02652, making it the second most significant parameter affecting MRR.
- The parameter T emerged as the most critical, with the highest delta value of 0.02945, ranking it first in significance.
3.3. Effects of the EDM Parameters on EWR
- Ip (Amp): Representing the current pulse, this parameter has a prominent influence on EWR. Based on the provided response table, Ip exhibits a delta value of 0.001534. The rank associated with Ip is 2, signifying that it is the second most influential parameter on EWR. When EDM is employed on AISI D2 steel, an increase in Ip generally leads to an accelerated wear rate of the electrode [61], attributed to the enhanced energy of each spark due to the heightened current.
- Vg (volt): This parameter, symbolizing the gap voltage between the tool and workpiece, has the most profound impact on EWR. With a delta value of 0.004705, Vg is ranked first in its influence on EWR. The relationship between Vg and EWR is intricate; a precise voltage is pivotal for maintaining tool wear at an optimal level. Elevated voltages can lead to intense spark energies, causing faster wear, whereas too low voltages might not facilitate the desired material removal, causing longer machine running times and subsequently more tool wear.
- Ton (μs): Denoting the on-time duration of the pulse, this parameter also showcases an influence on EWR. A delta value of 0.000537 places Ton in the third rank. When Ton is increased, there is an extended duration of spark activity, which might result in a higher wear rate. This is due to the extended time the spark interacts with both the workpiece and the tool electrode, enhancing material and tool wear, respectively [62].
- T: The duty cycle parameter, T, exhibits the least influence on EWR among the considered parameters. Its delta value stands at 0.000140, ranking it fourth. While T significantly impacts MRR, its influence on EWR is subdued. This underscores the fact that while longer duty cycles can result in enhanced material removal, they do not necessarily correlate to a proportionate increase in electrode wear [63].

- Ip (Amp) vs. Vg (volt): As Vg increases, the removal rate (EWR) for different levels of Ip shows varying behavior. Specifically, at an Ip of 10 Amps, there is a slight increase in EWR as Vg increases. However, at higher Ip levels (14 and 18 Amps), there is a decline in EWR with increasing Vg.
- Ip (Amp) vs. Ton (μs): The interaction between Ip and Ton indicates that for a constant Ip of 10 Amps, EWR slightly decreases as Ton increases. However, at Ip levels of 14 and 18 Amps, the EWR experiences a noticeable increase initially and then drops as Ton continues to increase.
- Ip (Amp) vs. T: The EWR displays a complex interaction pattern between Ip and T. For the lowest Ip of 10 Amps, the EWR initially increases and then dips as T rises. For the higher Ip levels (14 and 18 Amps), the EWR shows contrasting trends, increasing for Ip of 14 Amps and decreasing for Ip of 18 Amps with rising T.
- Vg (volt) vs. Ton (μs): For a constant Vg of 55 volts, the EWR increases as Ton rises. However, at Vg levels of 60 and 65 volts, the EWR decreases with increasing Ton.
- Vg (volt) vs. T: The interaction between Vg and T demonstrates varying behavior for different Vg levels. Notably, for a Vg of 55 volts, the EWR shows a minor decline as T increases, but at Vg levels of 60 and 65 volts, the EWR increases with rising T.
- Ton (μs) vs. T: For a constant Ton of 80 μs, there is a slight increase in EWR as T increases. At higher Ton values (120 and 160 μs), the EWR showcases opposing trends: a decrease for Ton of 120 μs and an increase for Ton of 160 μs with rising T.

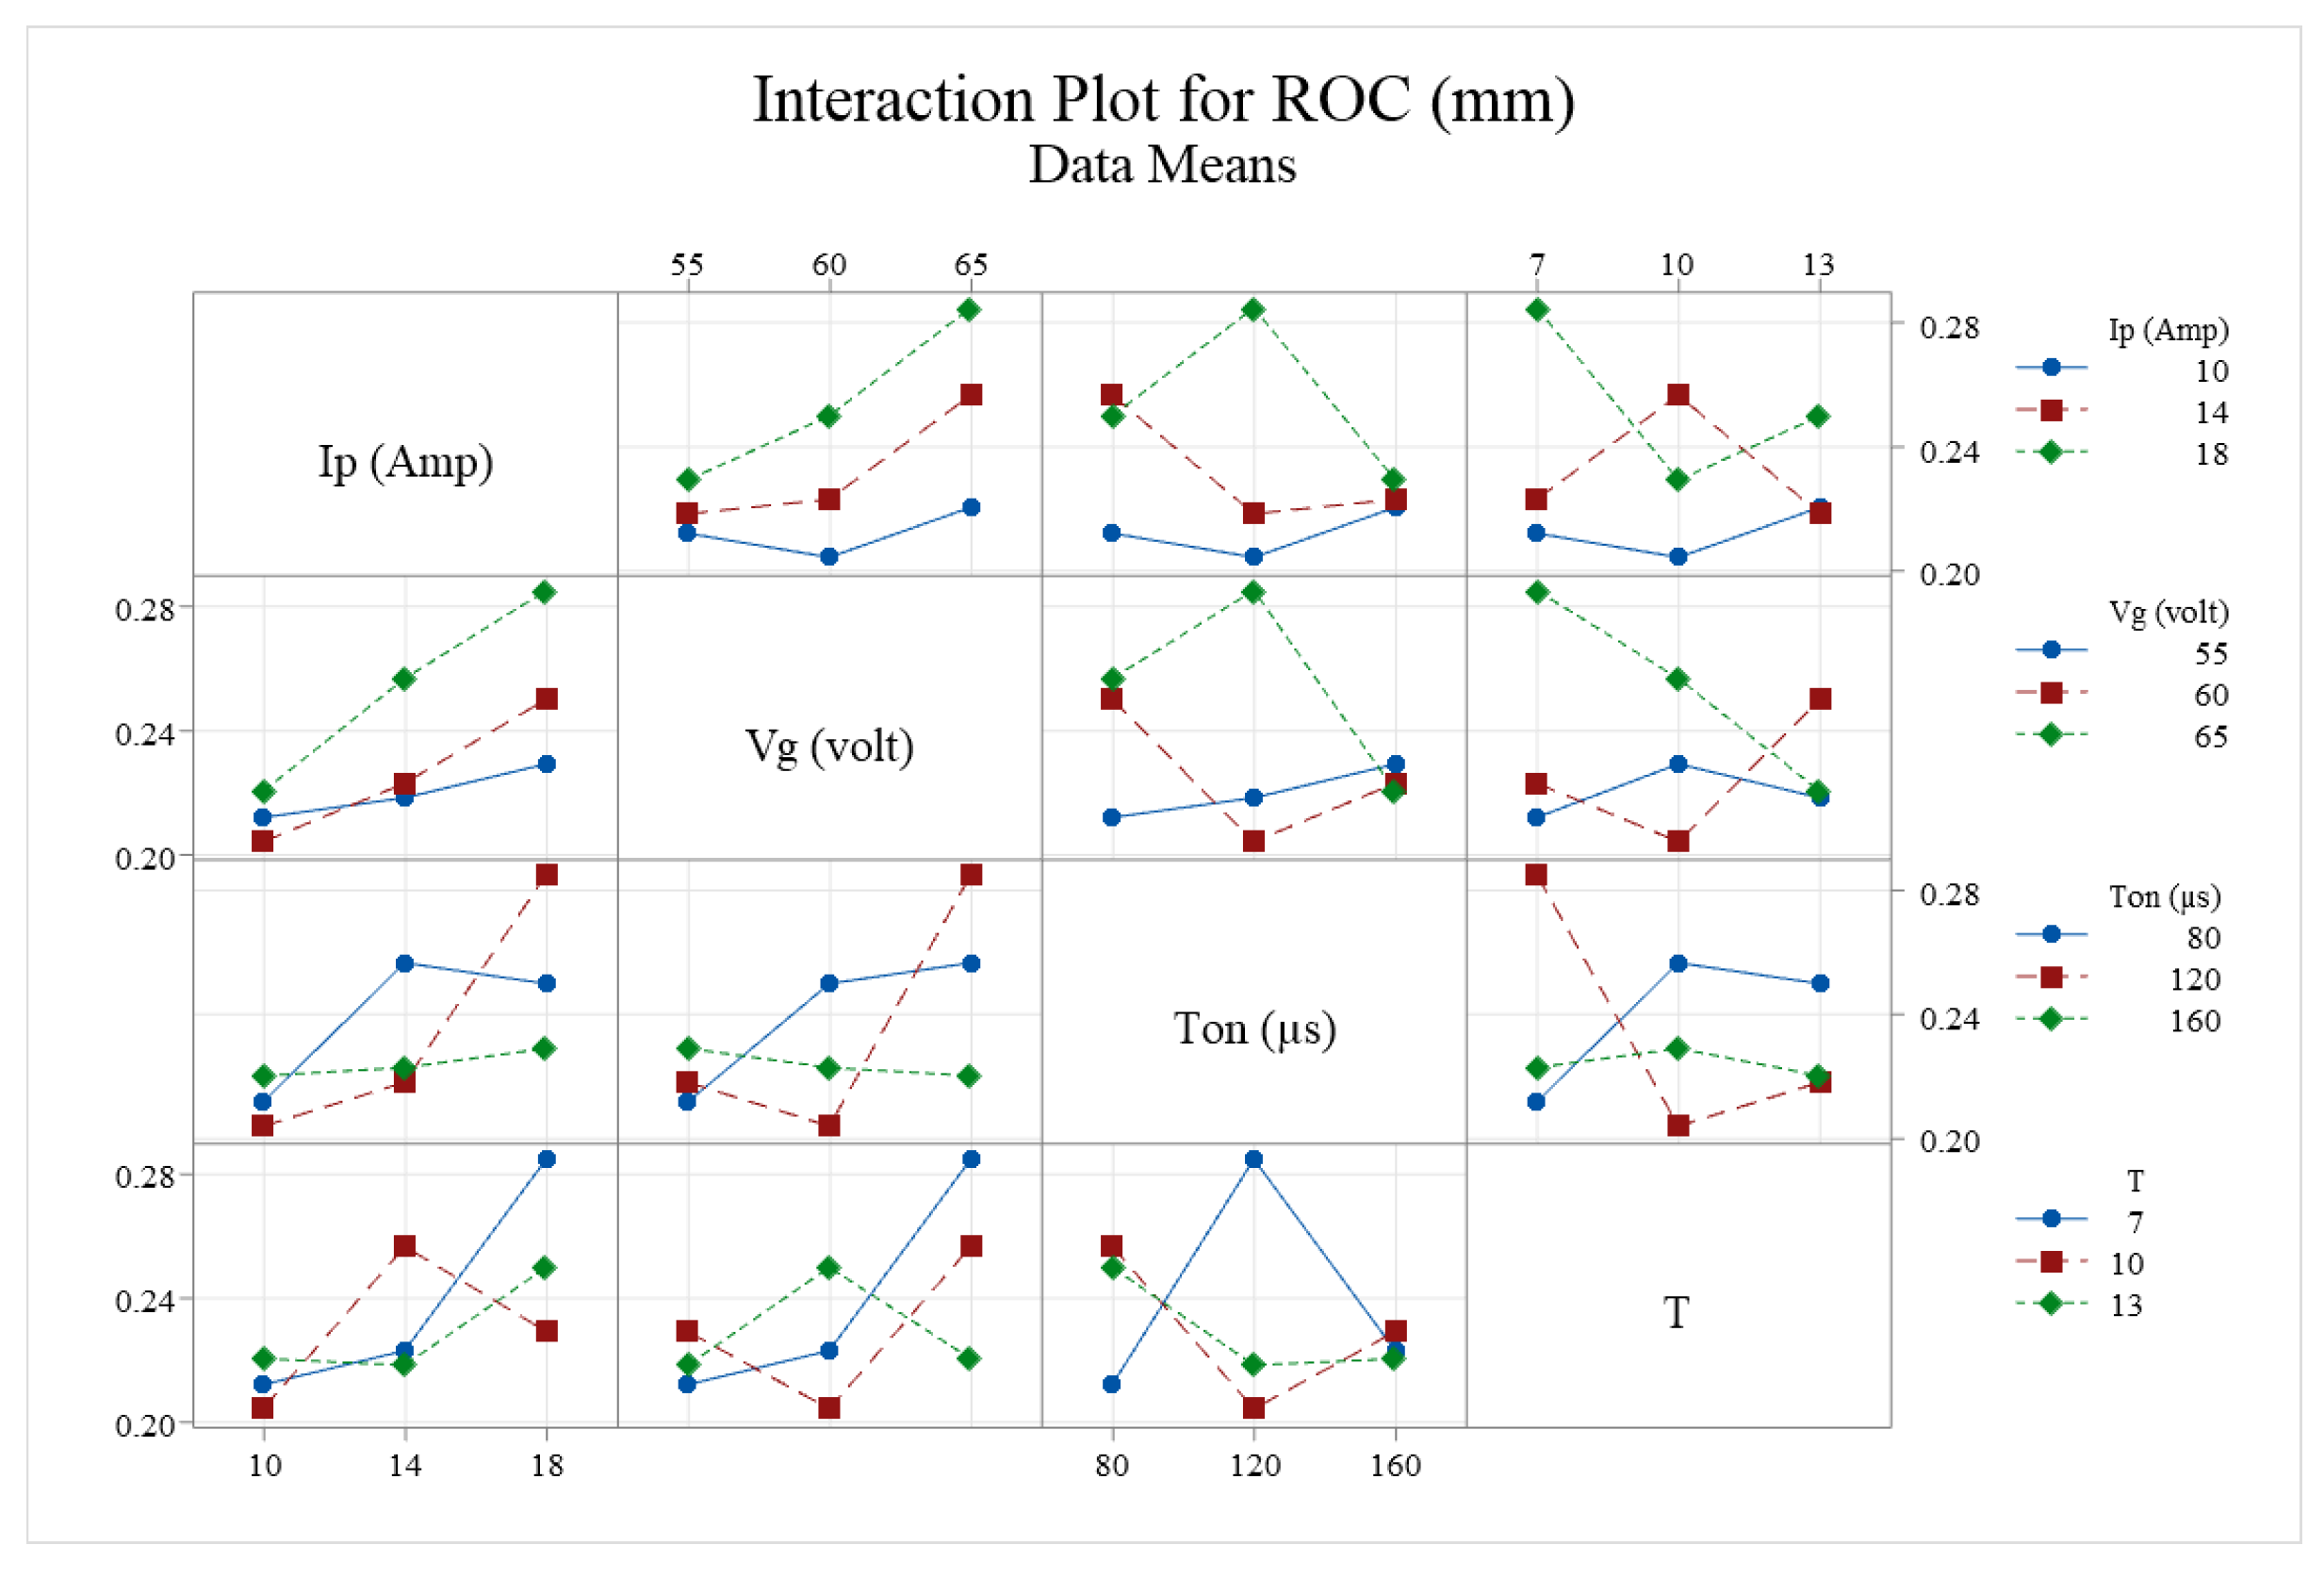
3.4. Effects of the EDM Parameters on ROC
- Ip (Amp): The current pulse, symbolized by this parameter, exhibits a paramount effect on ROC. As per the data table, the delta value of Ip is 0.0425. With a ranking of 1, Ip stands out as the most influential parameter on ROC. Increasing Ip, particularly for materials like D2 steel, enhances the rate of cut, likely due to the amplified energy of each spark ensuing from an elevated current [65].
- Vg (volt): Indicating the gap voltage between the electrode and the workpiece, this parameter is of significant importance to ROC. With its delta value recorded at 0.0342, Vg holds the second rank in terms of influence on ROC. Elevated Vg levels can bolster the spark energies, potentially leading to a more rapid material removal rate.
- Ton (μs): Representing the on-time of each pulse, Ton too influences ROC. The delta value for Ton stands at 0.0154, placing it at the third rank. A lengthened Ton can augment spark interaction duration, possibly resulting in a heightened ROC, due to the extended interaction between the spark and the workpiece.
- T: This duty cycle parameter appears to have the least direct influence on ROC amongst the parameters considered. With a delta value of 0.0104, T is ranked fourth. A longer duty cycle might facilitate enhanced material removal without necessarily having a direct proportionate effect on the ROC.
- Ip (Amp) vs. Vg (volt): With increasing Vg, the ROC for various levels of Ip demonstrates distinct behavior. At an Ip level of 10 Amps, a rise in Vg corresponds to an incremental ROC. However, at elevated Ip levels (14 and 18 Amps), an increase in Vg results in a decline in ROC.
- Ip (Amp) vs. Ton (μs): The interplay between Ip and Ton suggests that for an Ip of 10 Amps, ROC slightly dips with increasing Ton. In contrast, at Ip levels of 14 and 18 Amps, ROC initially escalates and subsequently reduces as Ton continues to rise.
- Ip (Amp) vs. T: ROC showcases an intricate interaction pattern between Ip and T. At the lowest Ip level of 10 Amps, ROC first ascends and then recedes as T augments. At more elevated Ip levels (14 and 18 Amps), ROC presents diverging tendencies—rising for an Ip of 14 Amps and dwindling for an Ip of 18 Amps as T surges.
- Vg (volt) vs. Ton (μs): For a consistent Vg of 55 volts, ROC surges as Ton swells. Nonetheless, at Vg values of 60 and 65 volts, ROC declines with increasing Ton.
- Vg (volt) vs. T: The interrelation between Vg and T displays variable dynamics for different Vg values. Notably, at a Vg of 55 volts, ROC marginally reduces as T augments, but at Vg measurements of 60 and 65 volts, ROC advances with an upswing in T.
- Ton (μs) vs. T: At a stable Ton of 80 μs, there is a subtle elevation in ROC as T rises. At more considerable Ton measurements (120 and 160 μs), ROC reveals contradictory trends: a decline for Ton of 120 μs and an upturn for Ton of 160 μs with an escalation in T.

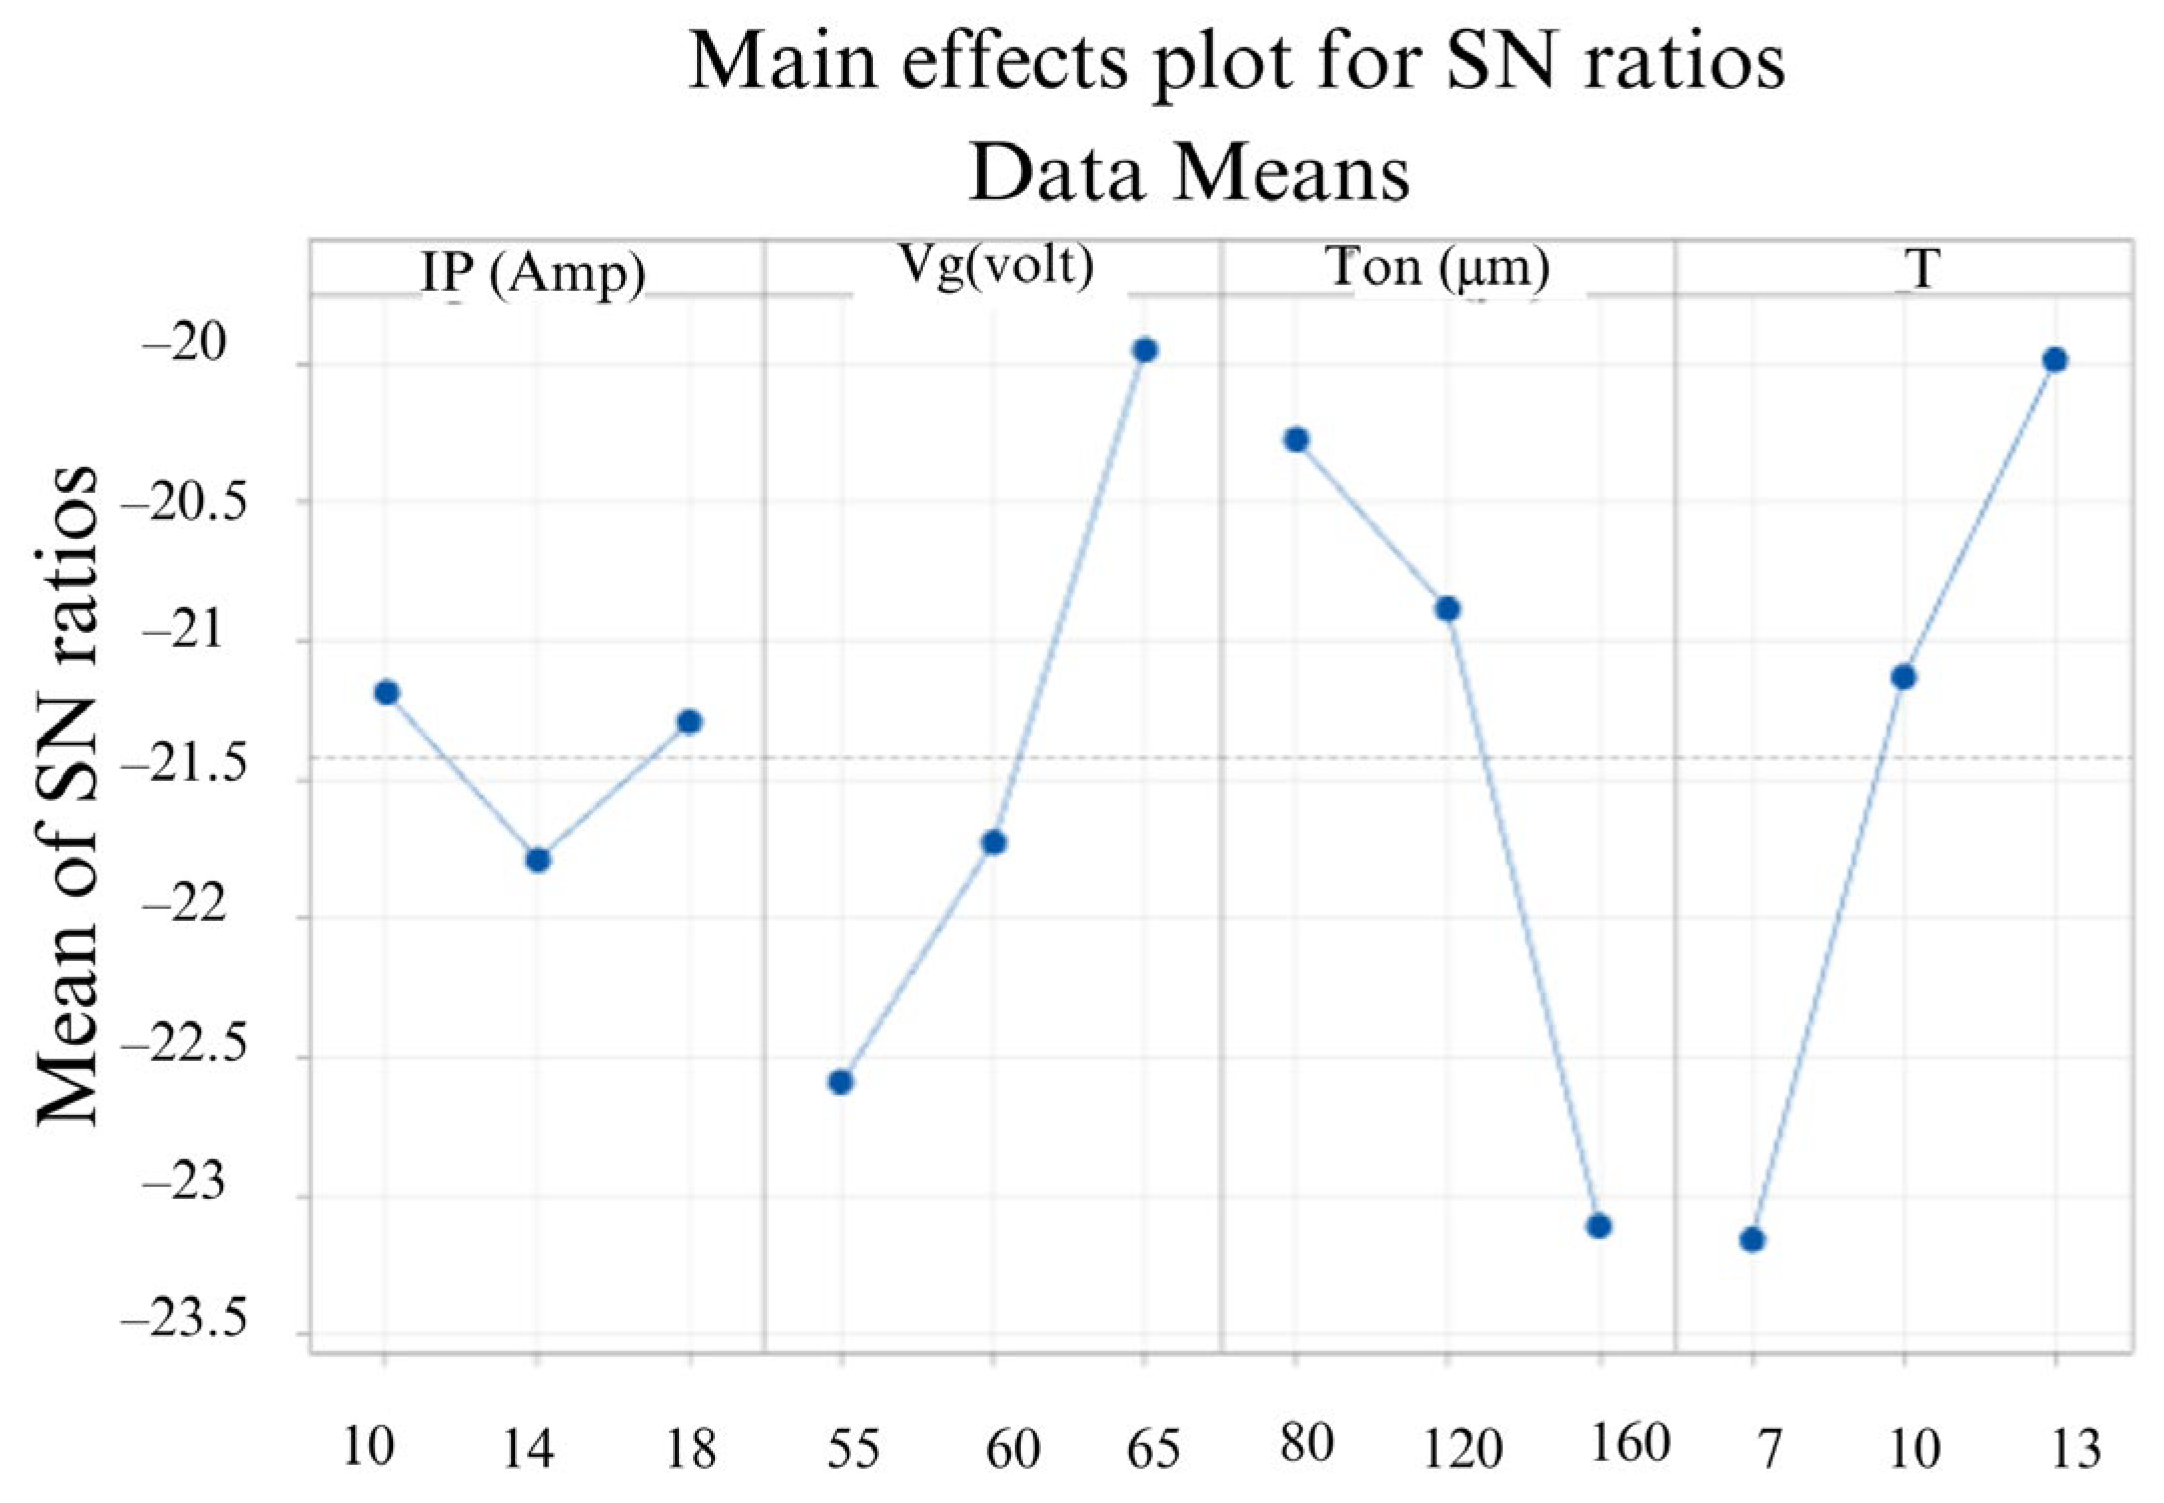
3.5. Optimal Parameters for MRR, EWR, and ROC Selection
- Ip (Amp): The signal-to-noise ratio for this parameter shows a moderate change across the levels. The highest mean S/N ratio appears at the 18 Amp setting.
- Vg (volt): The mean S/N ratio demonstrates a substantial increase as the Vg (volt) value rises, indicating its importance in the EDM process.
- Ton (μs): This parameter exhibits a prominent dip around 120 μs before rising sharply again, suggesting that there might be specific optimal regions around 80 μs and 160 μs.
- T: The trend for T is upward, indicating that a higher setting for T results in a superior S/N ratio.
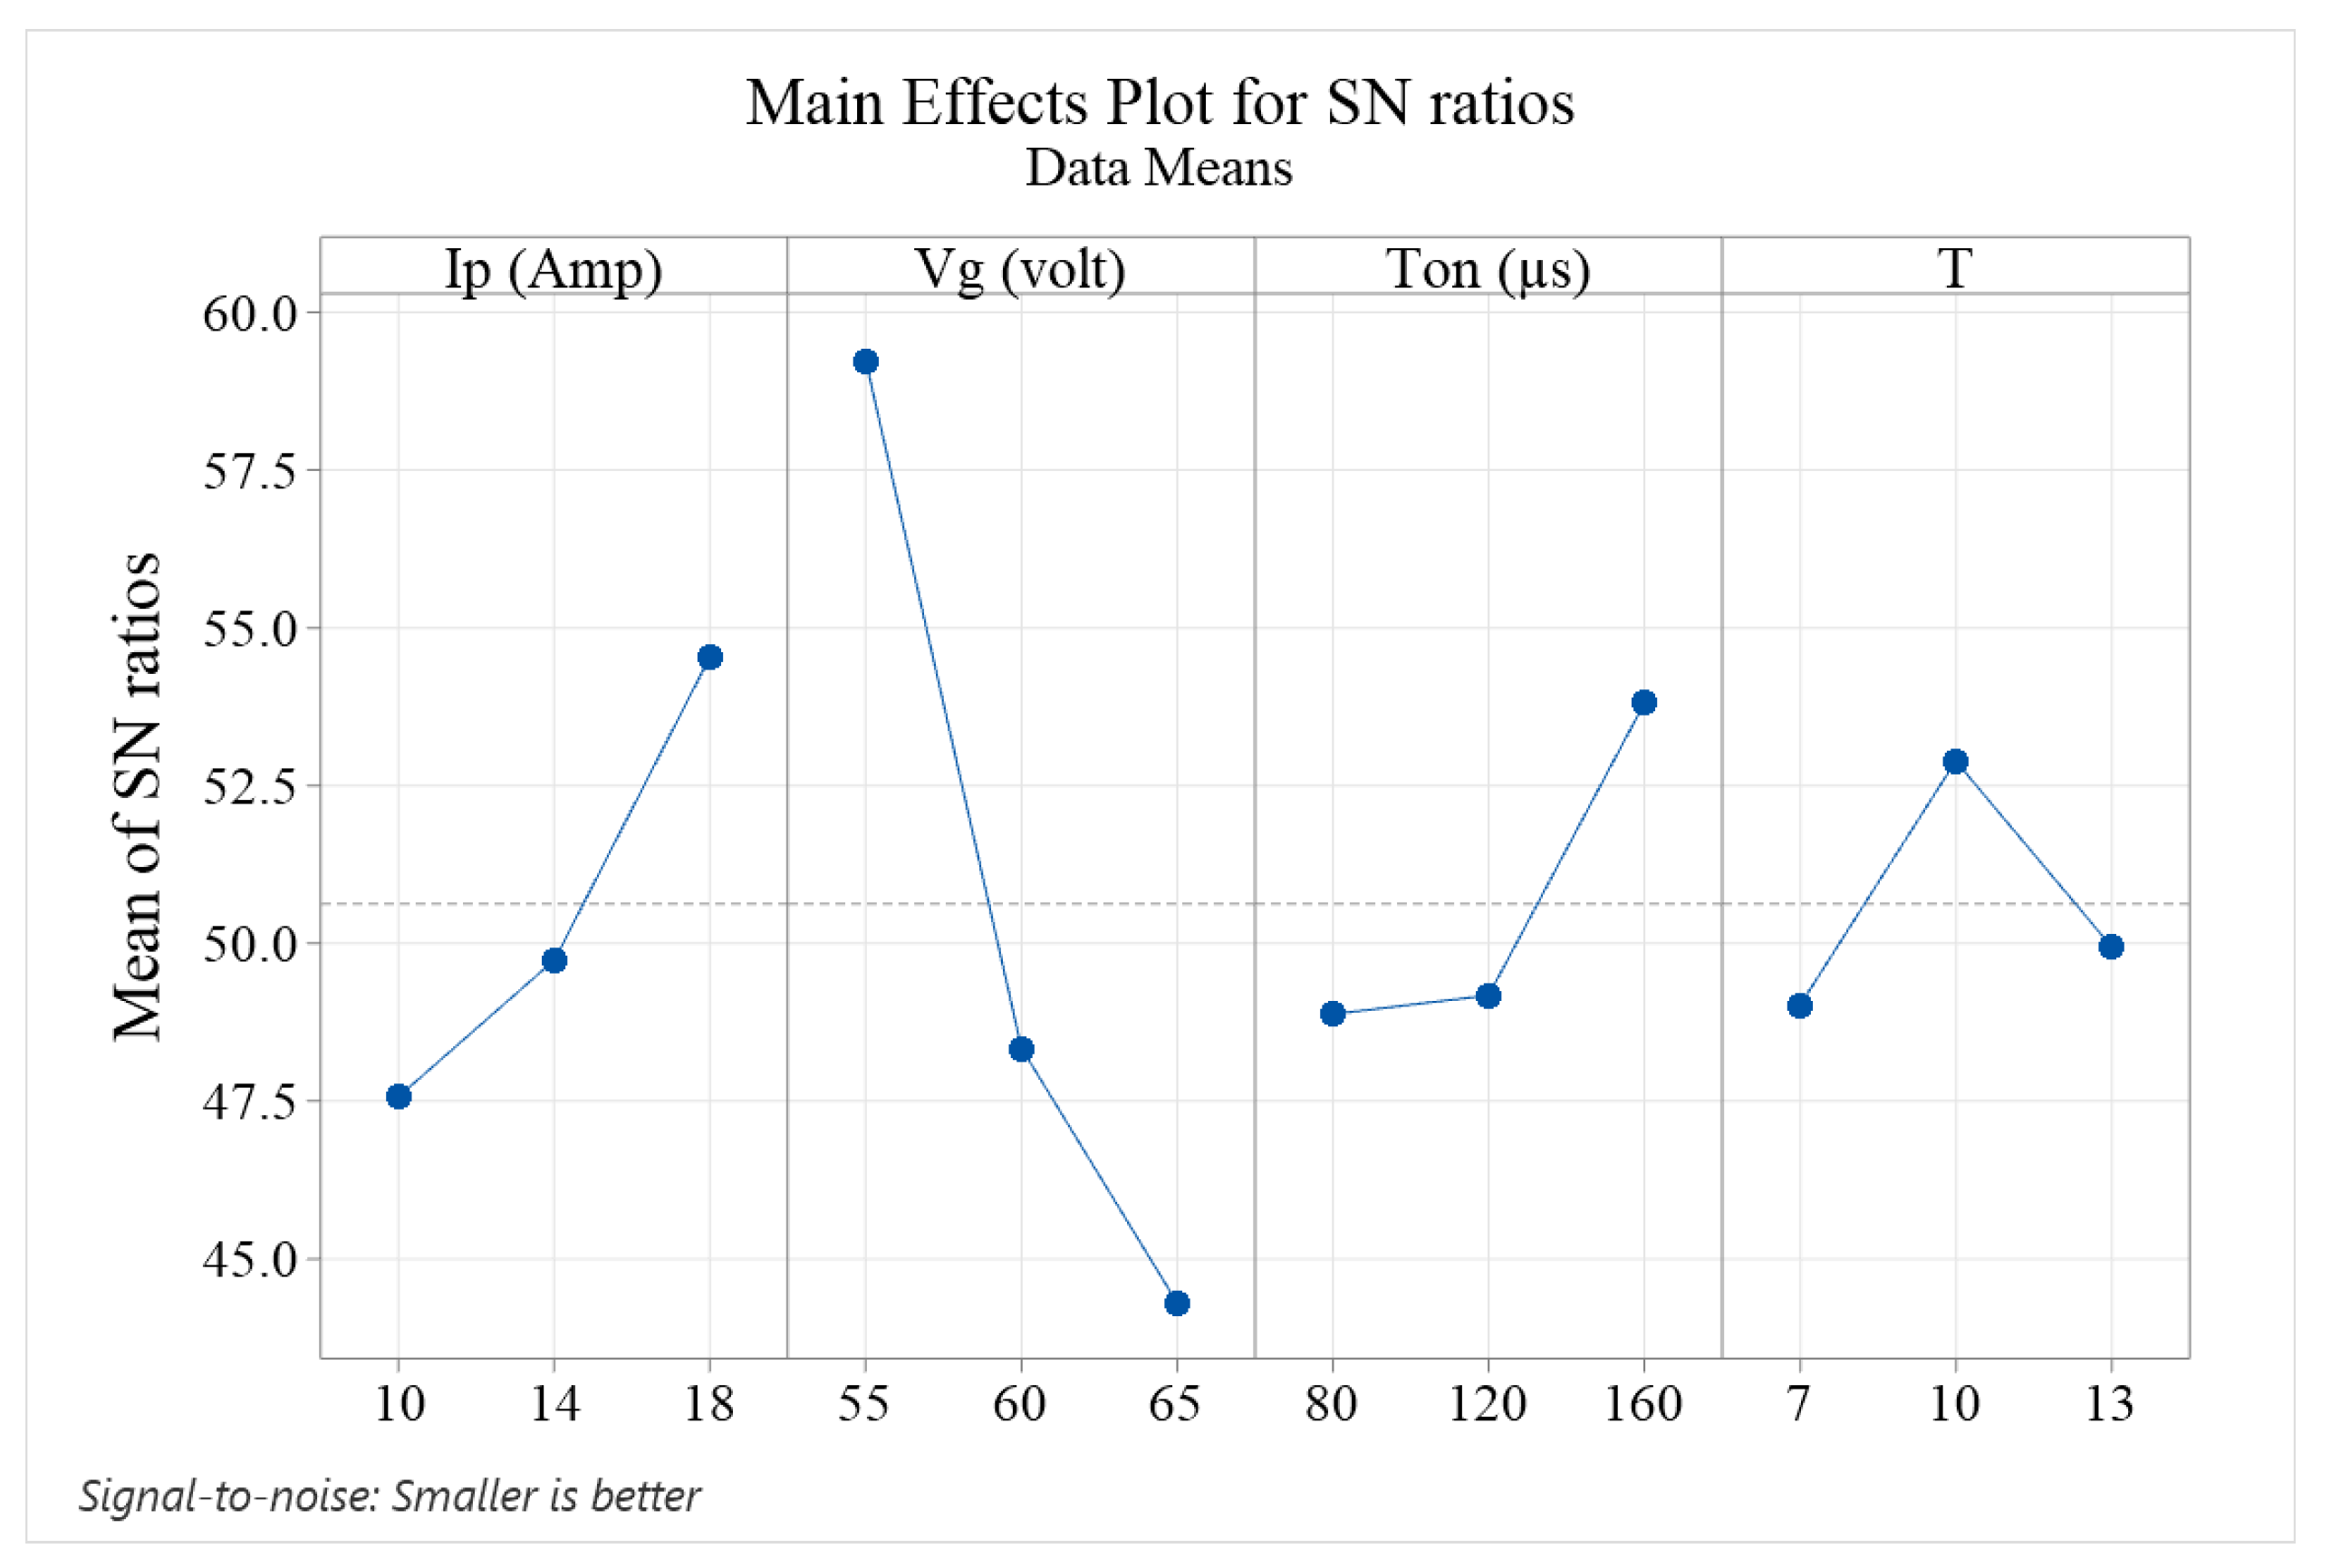
- The parameter Ip (Amp) shows a decreasing trend in the S/N ratio as the current increases. From the response table, the delta value for Ip (Amp) is given as 1.56, making it the most influential parameter. Thus, it is ranked first in terms of its impact on the S/N ratio.
- The next parameter, Vg (volt), also exhibits a decreasing trend in its S/N ratio as the voltage increases. The response table corroborates this by providing a delta value of 1.21 for Vg (volt), ranking it as the second most influential parameter.
- Ton (μs) shows an initially decreasing S/N ratio, but there is an increase observed at the third data point. With a delta value of 0.55 from the response table, it is ranked third.
- Lastly, T maintains a relatively stable S/N ratio across the range. It has the smallest delta value of 0.33, ranking it fourth in terms of impact on the S/N ratio.

3.6. Validation Test
- = total S/N ratio;
- = mean S/N ratio (at optimum point);
- x = input number of EDM parameters.
- MRR (g/min): At the optimal EDM conditions, the S/N ratio improved by 4.02 dB when compared to initial parameter values. The verification experiments demonstrate that MRR reduced by 29.13% under Taguchi’s predicted optimal conditions compared to the baseline parameters.
- EWR (g/min): The S/N ratio showed an improvement of 10.35 dB under optimal EDM conditions. Furthermore, the EWR was reduced by 33.33% under the optimal conditions in comparison to the preliminary settings.
- ROC (mm): The improvement in the S/N ratio for ROC was 2.20 dB under the optimal EDM conditions. ROC increased by 28.57% when comparing the baseline parameters to Taguchi’s predicted ideal conditions.
3.7. Comparison of Current Findings with the Published Work

| Citation | Machining Type: Micro (mic)/Macro (mac) | Hole Type: Blind (Hb) or Through (Ht) | Electrode Type: Copper (Cu), Graphite (C), Tungsten Carbide (WC), Aluminum (Al), and Brass (Br) | Machining Diameter (mm) | Penetration Limit (mm) |
|---|---|---|---|---|---|
| [68] | Mac | Hb | Cu and C | 9.95 | 1.0 |
| [69] | Mac | Hb | Cu | 4.40 | 1.0 |
| [70] | Mac | Hb | Cu | 7.79 | 1.0 |
| [71] | Mac | Hb | Cu | 1.99 | 1.0 |
| [72] | Mac | Ht | Cu | 5.86 | 5.0 |
| [73] | Mac | Ht | C | 5.97 | 1.80 |
| [74] | Mac | Ht | Cu and C | 5.55 | 1.80 |
| [75] | Mic | Hb | WC | 0.49 | 0.20 |
| [76] | Mic | Hb | WC | 0.10 | 1.20 |
| [77] | Mac | Ht | Cu | 7.89 | 6.0 |
| [78] | Mac | Hb | Copper (Cu), Aluminum (Al), Graphite (C), and Brass (Br), | 15 | 1 |
| [79] | Mic | Hb | Cu | 0.49 | 0.250 |
| Current work | Mac | Ht | Cu | 9.89 | 7.0 |
4. ANOVA for MRR, EWR, and ROC
5. Mathematical Modeling
6. Conclusions and Future Directions
- A meticulous examination of the effects of various EDM parameters on material removal rate (MRR), electrode wear rate (EWR), and radial overcut (ROC) was conducted. Notably, the duty cycle (T) was identified as the most critical parameter, significantly influencing MRR, as indicated by the highest delta value of 0.02945.
- The pulse duration (Ton) emerged as the second most significant factor, with a delta value of 0.02652, affecting MRR. This highlights the importance of the on-time duration of the pulse in the EDM process.
- Gap voltage (Vg) also showed a considerable impact on MRR, evidenced by a delta value of 0.02615, ranking third in terms of its influence.
- Peak current (Ip), with a delta value of 0.00297, demonstrated a notable but lesser influence on MRR, placing it fourth in significance.
- Based on these findings, predictive models have been developed to determine the ideal EDM conditions. These models are instrumental in forecasting optimal machining scenarios, thereby reducing the necessity for extensive preliminary testing.
- The insights from this study provide a solid foundation for future academic research and practical implementation in the field of EDM. They offer valuable guidance for refining EDM operations, particularly in terms of efficiency, reduced electrode wear, and improved accuracy. Such advancements could translate into economic efficiencies and elevated manufacturing standards.
- The statistical treatment of our findings not only substantiates the influence of parameters like duty cycle and pulse duration on machining attributes but also aids in the development of predictive models. These models are vital for forecasting optimal machining conditions, thereby reducing the need for extensive preliminary testing.
Future Recommendations
- It was discovered that the output responses are contradictory. Thus, it is suggested that future work focus on mathematical modeling using optimization and neural network-based numerical models. Furthermore, more thorough research is needed to fully understand the microstructural analysis of AISI D2 steel in EDM.
- Further exploration of variables related to AISI D2 steel in the EDM operation is recommended, culminating in the formulation of comprehensive industrial blueprints.
- Scrutinize the physical attributes of D2 metal under diverse EDM configurations.
- Delve deeper into enhancement techniques to amplify machining efficacy, potentially amalgamating approaches like the response surface methodology.
Author Contributions
Funding
Data Availability Statement
Acknowledgments
Conflicts of Interest
Appendix A
| Level | Ip (Amp) | Vg (volt) | Ton (μs) | T |
|---|---|---|---|---|
| 1 | −21.19 | −22.59 | −20.27 | −23.15 |
| 2 | −21.78 | −21.73 | −20.88 | −21.13 |
| 3 | −21.29 | −19.95 | −23.11 | −19.99 |
| Delta | 0.60 | 2.64 | 2.83 | 3.16 |
| Rank | 4 | 3 | 2 | 1 |
| Level | Ip (Amp) | Vg (volt) | Ton (μs) | T |
|---|---|---|---|---|
| 1 | 47.58 | 59.22 | 48.88 | 49.03 |
| 2 | 49.74 | 48.34 | 49.18 | 52.89 |
| 3 | 54.55 | 44.31 | 53.81 | 49.95 |
| Delta | 6.96 | 14.91 | 4.92 | 3.87 |
| Rank | 2 | 1 | 3 | 4 |
| Level | Ip (Amp) | Vg (volt) | Ton (μs) | T |
|---|---|---|---|---|
| 1 | 13.47 | 13.16 | 12.44 | 12.47 |
| 2 | 12.69 | 12.96 | 12.64 | 12.80 |
| 3 | 11.91 | 11.95 | 12.99 | 12.80 |
| Delta | 1.56 | 1.21 | 0.55 | 0.33 |
| Rank | 1 | 2 | 3 | 4 |
| Preliminary Parameters | Optimum Parameters | |||
|---|---|---|---|---|
| Predicted | Experimental | Predicted | Experimental | |
| Level | Ip-S2 Vg-S2 Ton-S2 T-S2 | Ip-S2 Vg-S2 Ton-S2 T-S2 | Ip-S1 Vg-S3 Ton-S1 T-S3 | Ip-S1 Vg-S3 Ton-S1 T-S3 |
| MRR (g/min) | 0.09 | 0.127 | ||
| S/N ratio (dB) MRR (g/min) | −21.25 | −21.26 | −17.22 | −17.24 |
| S/N ratio (dB) improvement for MRR (g/min) | 4.02 | |||
| % increment in MRR (g/min) | 29.13 | |||
| Preliminary Parameters | Optimum Parameters | |||
|---|---|---|---|---|
| Predicted | Experimental | Predicted | Experimental | |
| Level | Ip-S2 Vg-S2 Ton-S2 T-S2 | Ip-S2 Vg-S2 Ton-S2 T-S2 | Ip-S1 Vg-S3 Ton-S1 T-S1 | Ip-S1 Vg-S3 Ton-S1 T-S1 |
| EWR (g/min) | 0.004 | 0.006 | ||
| S/N ratio (dB) for EWR (g/min) | 48.273 | 48.29 | 37.92 | 37.94 |
| S/N ratio (dB) improvement for EWR (g/min) | 10.35 | |||
| % Reduction in EWR (g/min) | 33.33 | |||
| Preliminary Parameters | Optimum Parameters | |||
|---|---|---|---|---|
| Predicted | Experimented | Predicted | Experiment | |
| Level | Ip-S2 Vg-S2 Ton-S2 T-S2 | Ip-S2 Vg-S2 Ton-S2 T-S2 | Ip-S3 Vg-S3 Ton-S1 T-S1 | Ip-S3 Vg-S3 Ton-S1 T-S1 |
| ROC (mm) | 0.224 | 0.288 | ||
| S/N ratio (dB) for ROC (mm) | 13.01 | 13.03 | 10.78 | 10.83 |
| S/N ratio (dB) improvement for ROC (mm) | 2.20 | |||
| % reduction in ROC (mm) | 28.57 | |||
References
- Karmiris-Obratański, P.; Zagórski, K.; Papazoglou, E.L.; Markopoulos, A.P. Surface Texture and Integrity of Electrical Discharged Machined Titanium Alloy. Int. J. Adv. Manuf. Technol. 2021, 115, 733–747. [Google Scholar] [CrossRef]
- Tian, H.; Wang, K.; Shui, Z.; Ali Raza, M.; Xiao, H.; Que, M.; Zhu, L.; Chen, X. Enhanced CO2 Electroreduction on Co Active Site of Cobalt Phthalocyanine by Electronic Effect. Mater. Lett. 2022, 310, 131482. [Google Scholar] [CrossRef]
- Ablyaz, T.R.; Shlykov, E.S.; Muratov, K.R. Improving the Efficiency of Electrical Discharge Machining of Special-Purpose Products with Composite Electrode Tools. Materials 2021, 14, 6105. [Google Scholar] [CrossRef] [PubMed]
- Rehan, M.; Khan, S.A.; Naveed, R.; Usman, M.; Anwar, S.; AlFaify, A.Y.; Pruncu, C.I.; Lamberti, L. Experimental Investigation of the Influence of Wire Offset and Composition on Complex Profile WEDM of Ti6Al4V Using Trim-Pass Strategy. Int. J. Adv. Manuf. Technol. 2023, 127, 1209–1224. [Google Scholar] [CrossRef]
- Liao, D.; Zhu, S.-P.; Keshtegar, B.; Qian, G.; Wang, Q. Probabilistic Framework for Fatigue Life Assessment of Notched Components under Size Effects. Int. J. Mech. Sci. 2020, 181, 105685. [Google Scholar] [CrossRef]
- Niu, X.; Zhu, S.-P.; He, J.-C.; Liao, D.; Correia, J.A.F.O.; Berto, F.; Wang, Q. Defect Tolerant Fatigue Assessment of AM Materials: Size Effect and Probabilistic Prospects. Int. J. Fatigue 2022, 160, 106884. [Google Scholar] [CrossRef]
- Babu, N.B.K.; Ramesh, T.; Muthukumaran, S. Physical, Tribological and Viscoelastic Behavior of Machining Wear Debris Powder Reinforced Epoxy Composites. J. Clean. Prod. 2020, 272, 122786. [Google Scholar] [CrossRef]
- Raza, M.A.; Cai, W.; Tian, H.; Que, M.; Zhu, L.; Chen, X. Hierarchical Flower-like Ternary Composite of NiFeCr/PCN/CeO2 towards Efficient Photocatalytic Reduction of CO2. J. Phys. Chem. Solids 2022, 171, 111027. [Google Scholar] [CrossRef]
- Senthilkumar, C.; Nandakumar, C. Optimization of Wire Electro Discharge Machining Parameters Using Principal Component Analysis. Int. J. Syst. Assur. Eng. Manag. 2023, 14, 1040–1048. [Google Scholar] [CrossRef]
- Zhang, Z.; Chen, J.; Wang, J.; Han, Y.; Yu, Z.; Wang, Q.; Zhang, P.; Yang, S. Effects of Solder Thickness on Interface Behavior and Nanoindentation Characteristics in Cu/Sn/Cu Microbumps. Weld. World 2022, 66, 973–983. [Google Scholar] [CrossRef]
- Guo, K.; Gou, G.; Lv, H.; Shan, M. Jointing of CFRP/5083 Aluminum Alloy by Induction Brazing: Processing, Connecting Mechanism, and Fatigue Performance. Coatings 2022, 12, 1559. [Google Scholar] [CrossRef]
- Bose, S.; Nandi, T. Experimental Investigation of WEDM on Titanium Hybrid Composite Reinforced with Boron Powder: A Novel Approach. Eur. Phys. J. Plus 2020, 135, 914. [Google Scholar] [CrossRef]
- Al-Amin, M.; Abdul-Rani, A.M.; Danish, M.; Thompson, H.M.; Aliyu, A.A.A.; Hastuty, S.; Zohura, F.T.; Bryant, M.G.; Rubaiee, S.; Rao, T.V.V.L.N. Assessment of PM-EDM Cycle Factors Influence on Machining Responses and Surface Properties of Biomaterials: A Comprehensive Review. Precis. Eng.-J. Int. Soc. Precis. Eng. Nanotechnol. 2020, 66, 531–549. [Google Scholar] [CrossRef]
- Rashid, M.A.N.; Saleh, T.; Noor, W.I.; Ali, M.S.M. Effect of Laser Parameters on Sequential Laser Beam Micromachining and Micro Electro-Discharge Machining. Int. J. Adv. Manuf. Technol. 2021, 114, 709–723. [Google Scholar] [CrossRef]
- Pragadish, N.; Kaliappan, S.; Subramanian, M.; Natrayan, L.; Prakash, K.S.; Subbiah, R.; Kumar, T.C.A. Optimization of Cardanol Oil Dielectric-Activated EDM Process Parameters in Machining of Silicon Steel. Biomass Convers. Biorefin. 2022, 13, 14087–14096. [Google Scholar] [CrossRef]
- Fu, Z.H.; Yang, B.J.; Shan, M.L.; Li, T.; Zhu, Z.Y.; Ma, C.P.; Zhang, X.; Gou, G.Q.; Wang, Z.R.; Gao, W. Hydrogen Embrittlement Behavior of SUS301L-MT Stainless Steel Laser-Arc Hybrid Welded Joint Localized Zones. Corros. Sci. 2020, 164, 108337. [Google Scholar] [CrossRef]
- Zhu, Z.Y.; Liu, Y.L.; Gou, G.Q.; Gao, W.; Chen, J. Effect of Heat Input on Interfacial Characterization of the Butter Joint of Hot-Rolling CP-Ti/Q235 Bimetallic Sheets by Laser+ CMT. Sci. Rep. 2021, 11, 10020. [Google Scholar] [CrossRef] [PubMed]
- Gao, Q.; Ding, Z.; Liao, W.-H. Effective Elastic Properties of Irregular Auxetic Structures. Compos. Struct. 2022, 287, 115269. [Google Scholar] [CrossRef]
- Asif, N.; Saleem, M.Q.; Farooq, M.U. Performance Evaluation of Surfactant Mixed Dielectric and Process Optimization for Electrical Discharge Machining of Titanium Alloy Ti6Al4V. CIRP J. Manuf. Sci. Technol. 2023, 43, 42–56. [Google Scholar] [CrossRef]
- Singh, R.; Yadav, V.K.; Dvivedi, A.; Kumar, P. Evaluating the Feasibility of Using Biodegradable Castor Oil as a Dielectric Medium during Micro-Electrical Discharge Machining of Inconel 718. J. Mater. Eng. Perform. 2023, 32, 6465–6477. [Google Scholar] [CrossRef]
- Suresh, K.; Karuppasamy, K.; Palani, S.; Krishnan, S.S.J.; Maridurai, T. Effect of Silane Treated Wheat Husk Biosilica (WHB) Deionized Water Dielectric on EDM Drilling of Ti-6Al-4 V Alloy. Silicon 2022, 14, 9143–9151. [Google Scholar] [CrossRef]
- Dutta, S.; Singh, A.K.; Paul, B.; Paswan, M.K. Machining of Shape-Memory Alloys Using Electrical Discharge Machining with an Elaborate Study of Optimization Approaches: A Review. J. Braz. Soc. Mech. Sci. Eng. 2022, 44, 557. [Google Scholar] [CrossRef]
- Arif, U.; Khan, I.A.; Hassan, F. Green and Sustainable Electric Discharge Machining: A Review. Adv. Mater. Process. Technol. 2022, 1–75. [Google Scholar] [CrossRef]
- Jadam, T.; Datta, S. Machinability of Ti-5Al-2.5Sn for Electro-Discharge Machining: An Experimental Investigation. Sadhana-Acad. Proc. Eng. Sci. 2020, 45, 238. [Google Scholar] [CrossRef]
- Thejasree, P.; Natarajan, M. Applications of Hybrid Artificial Intelligence Tool in Wire Electro Discharge Machining of 7075 Aluminium Alloy. Int. J. Interact. Des. Manuf.—IJIDEM 2023, 1–12. [Google Scholar] [CrossRef]
- Shastri, A.S.; Nargundkar, A.; Kulkarni, A.J.; Sharma, K.K. Multi-Cohort Intelligence Algorithm for Solving Advanced Manufacturing Process Problems. Neural Comput. Appl. 2020, 32, 15055–15075. [Google Scholar] [CrossRef]
- Zhu, Q.; Chen, J.; Gou, G.; Chen, H.; Li, P. Ameliorated Longitudinal Critically Refracted—Attenuation Velocity Method for Welding Residual Stress Measurement. J. Mater. Process. Technol. 2017, 246, 267–275. [Google Scholar] [CrossRef]
- Chen, Y.; Sun, S.; Zhang, T.; Zhou, X.; Li, S. Effects of Post-Weld Heat Treatment on the Microstructure and Mechanical Properties of Laser-Welded NiTi/304SS Joint with Ni Filler. Mater. Sci. Eng. A 2020, 771, 138545. [Google Scholar] [CrossRef]
- Yu, H.; Zhang, J.; Fang, M.; Ma, T.; Wang, B.; Zhang, Z.; Hu, Z.; Li, H.; Cao, X.; Ding, C. Bio-Inspired Strip-Shaped Composite Composed of Glass Fabric and Waste Selvedge from A. Pernyi Silk for Lightweight and High-Impact Applications. Compos. Part A Appl. Sci. Manuf. 2023, 174, 107715. [Google Scholar] [CrossRef]
- Al-Amin, M.; Rani, A.M.A.; Aliyu, A.A.A.; Razak, M.A.A.; Hastuty, S.; Bryant, M.G. Powder Mixed-EDM for Potential Biomedical Applications: A Critical Review. Mater. Manuf. Process. 2020, 35, 1789–1811. [Google Scholar] [CrossRef]
- Xing, Q.; Yao, Z.; Zhang, Q. Effects of Processing Parameters on Processing Performances of Ultrasonic Vibration-Assisted Micro-EDM. Int. J. Adv. Manuf. Technol. 2021, 112, 71–86. [Google Scholar] [CrossRef]
- Phate, M.; Toney, S.; Phate, V. Modelling and Investigating the Impact of EDM Parameters on Surface Roughness in EDM of Al/Cu/Ni Alloy. Aust. J. Mech. Eng. 2022, 20, 1226–1239. [Google Scholar] [CrossRef]
- Papazoglou, E.L.; Karmiris-Obratański, P.; Karkalos, N.E.; Thangaraj, M.; Markopoulos, A.P. Theoretical and Experimental Analysis of Plasma Radius Expansion Model in EDM: A Comprehensive Study. Int. J. Adv. Manuf. Technol. 2023, 126, 2429–2444. [Google Scholar] [CrossRef]
- Bayki, S.; Mujumdar, S. A 1D Model for Prediction of Dry Electrical Discharge Machining (Dry-EDM) Plasma Characteristics. J. Manuf. Process. 2023, 102, 417–428. [Google Scholar] [CrossRef]
- Liu, C.; Li, Q.; Yang, X. Analysis of Arc Plasma Characteristics and Energy Distribution in EDM Based on Two-Temperature Model. Precis. Eng. 2023, 83, 204–215. [Google Scholar] [CrossRef]
- Nagaraju, N.; Surya Prakash, R.; Venkata Ajay Kumar, G.; Ujwala, N.G. Optimization of Electrical Discharge Machining Process Parameters for 17-7 PH Stainless Steel by Using Taguchi Technique. Mater. Today Proc. 2020, 24, 1541–1551. [Google Scholar] [CrossRef]
- Sahoo, R.; Singh, N.K.; Bajpai, V. Approach towards Green Manufacturing in Maglev EDM Using Different Biodegradable Dielectrics at Variable Discharge Conditions. J. Clean. Prod. 2023, 430, 139623. [Google Scholar] [CrossRef]
- Liu, L.; Thangaraj, M.; Karmiris-Obratański, P.; Zhou, Y.; Annamalai, R.; Machnik, R.; Elsheikh, A.; Markopoulos, A.P. Optimization of Wire EDM Process Parameters on Cutting Inconel 718 Alloy with Zinc-Diffused Coating Brass Wire Electrode Using Taguchi-DEAR Technique. Coatings 2022, 12, 1612. [Google Scholar] [CrossRef]
- Ishfaq, K.; Sana, M.; Ashraf, W.M.; Dua, V. Sustainable EDM of Inconel 600 in Cu-Mixed Biodegradable Dielectrics: Modelling and Optimizing the Process by Artificial Neural Network for Supporting Net-Zero from Industry. J. Clean. Prod. 2023, 421, 138388. [Google Scholar] [CrossRef]
- Sharma, V.; Sabiruddin, K. A Comparative Study of Sand-Blasted and Electro-Discharge-Machined Surfaces of Steel Substrates. Sadhana-Acad. Proc. Eng. Sci. 2020, 45, 50. [Google Scholar] [CrossRef]
- Yang, C.; Yin, C.; Wu, Y.; Zhou, Q.; Liu, X. Atomic Insights into the Deformation Mechanism of an Amorphous Wrapped Nanolamellar Heterostructure and Its Effect on Self-Lubrication. J. Mater. Res. Technol. 2023, 26, 4206–4218. [Google Scholar] [CrossRef]
- Jiang, Y.L.; Fang, J.X.; Ma, G.Z.; Tian, H.L.; Zhang, D.B.; Cao, Y. Microstructure and Properties of an As-Deposited and Post Treated High Strength Carbide-Free Bainite Steel Fabricated via Laser Powder Deposition. Mater. Sci. Eng. A 2021, 824, 141791. [Google Scholar] [CrossRef]
- Hu, J.; Yang, K.; Wang, Q.; Zhao, Q.C.; Jiang, Y.H.; Liu, Y.J. Ultra-Long Life Fatigue Behavior of a High-Entropy Alloy. Int. J. Fatigue 2023, 178, 108013. [Google Scholar] [CrossRef]
- Sahu, A.K.; Mahapatra, S.S.; Bhoi, N.K.; Singh, H.; Leite, M.; Goel, S. Experimental Investigation on Microwave Sintered Composite Tool for Electro-Discharge Machining of Titanium Alloy. J. Mater. Eng. Perform. 2022, 31, 5026–5041. [Google Scholar] [CrossRef]
- Selvarajan, L.; Venkataramanan, K. Surface Morphology and Drilled Hole Accuracy of Conductive Ceramic Composites Si3N4-TiN and MoSi2-SiC on EDMed Surfaces. Wear 2023, 530–531, 204973. [Google Scholar] [CrossRef]
- Kuang, W.; Wang, H.; Li, X.; Zhang, J.; Zhou, Q.; Zhao, Y. Application of the Thermodynamic Extremal Principle to Diffusion-Controlled Phase Transformations in Fe-CX Alloys: Modeling and Applications. Acta Mater. 2018, 159, 16–30. [Google Scholar] [CrossRef]
- Papazoglou, E.L.; Karmiris-Obratański, P.; Leszczyńska-Madej, B.; Markopoulos, A.P. A Study on Electrical Discharge Machining of Titanium Grade2 with Experimental and Theoretical Analysis. Sci. Rep. 2021, 11, 8971. [Google Scholar] [CrossRef]
- Taguchi, G.; Chowdhury, S.; Wu, Y. Taguchi’s Quality Engineering Handbook; Taylor & Francis: Boca Raton, FL, USA, 2007. [Google Scholar]
- Kechagias, J.D.; Zaoutsos, S.P. Optimising Fused Filament Fabrication Surface Roughness for a Dental Implant. Mater. Manuf. Process. 2023, 38, 954–959. [Google Scholar] [CrossRef]
- Ilani, M.A.; Khoshnevisan, M. Powder Mixed-Electrical Discharge Machining (EDM) with the Electrode Is Made by Fused Deposition Modeling (FDM) at Ti-6Al-4V Machining Procedure. Multiscale Multidiscip. Model. Exp. Des. 2020, 3, 173–186. [Google Scholar] [CrossRef]
- Bhiradi, I.; Hiremath, S.S. Energy Efficient and Cost Effective Method for Generation of In-Situ Silver Nanofluids: Formation, Morphology and Thermal Properties. Adv. Powder Technol. 2020, 31, 4031–4044. [Google Scholar] [CrossRef]
- Zhou, C.; Ren, Z.; Lin, Y.; Huang, Z.; Shi, L.; Yang, Y.; Mo, J. Hysteresis Dynamic Model of Metal Rubber Based on Higher-Order Nonlinear Friction (HNF). Mech. Syst. Signal Process. 2023, 189, 110117. [Google Scholar] [CrossRef]
- Zeng, L.; Lv, T.; Chen, H.; Ma, T.; Fang, Z.; Shi, J. Flow Accelerated Corrosion of X65 Steel Gradual Contraction Pipe in High CO2 Partial Pressure Environments. Arab. J. Chem. 2023, 16, 104935. [Google Scholar] [CrossRef]
- Yang, Z.; Tang, B.; Qiu, Y.; Wu, J.; Wei, W.; Huang, X.; Luo, X.; Wu, G. Measurement of Transient Temperature Using Laser-Induced Breakdown Spectroscopy (LIBS) with the Surface Temperature Effect. J. Anal. At. Spectrom. 2023, 38, 1952–1961. [Google Scholar] [CrossRef]
- Niamat, M.; Sarfraz, S.; Ahmad, W.; Shehab, E.; Salonitis, K. Parametric Modelling and Multi-Objective Optimization of Electro Discharge Machining Process Parameters for Sustainable Production. Energies 2020, 13, 38. [Google Scholar] [CrossRef]
- Yavari, S.; Modabberifar, M.; Sheykholeslami, M.R. An Experimental Investigation of Electro Discharge Machining Parameters Effects on Ferromagnetic Properties of Extra-Low-Carbon Steel. J. Magn. Magn. Mater. 2022, 549, 169041. [Google Scholar] [CrossRef]
- Wasif, M.; Khan, Y.A.; Zulqarnain, A.; Iqbal, S.A. Analysis and Optimization of Wire Electro-Discharge Machining Process Parameters for the Efficient Cutting of Aluminum 5454 Alloy. Alex. Eng. J. 2022, 61, 6191–6203. [Google Scholar] [CrossRef]
- Jahare, M.H.; Idris, M.H.; Hassim, M.H. Effect of WEDM Parameters on Material Removal Rate and Kerf’s Width of Cobalt Chromium Molybdenum Using Full Factorials Design. Adv. Mater. Process. Technol. 2022, 8, 550–563. [Google Scholar] [CrossRef]
- Mushtaq, R.T.; Iqbal, A.; Wang, Y.; Khan, A.M.; Abu Bakar, M.S. Parametric Optimization of 3D Printing Process Hybridized with Laser-Polished PETG Polymer. Polym. Test. 2023, 125, 108129. [Google Scholar] [CrossRef]
- Mushtaq, R.T.; Wang, Y.; Rehman, M.; Khan, A.M.; Bao, C.; Sharma, S.; Eldin, S.M.; Abbas, M. Investigation of the Mechanical Properties, Surface Quality, and Energy Efficiency of a Fused Filament Fabrication for PA6. Rev. Adv. Mater. 2023, 62, 20220332. [Google Scholar] [CrossRef]
- Bhiradi, I.; Raju, L.; Hiremath, S.S. Adaptive Neuro-Fuzzy Inference System (ANFIS): Modelling, Analysis, and Optimisation of Process Parameters in the Micro-EDM Process. Adv. Mater. Process. Technol. 2020, 6, 133–145. [Google Scholar] [CrossRef]
- Cakiroglu, R. Analysis of EDM Machining Parameters for Keyway on Ti-6Al-4V Alloy and Modelling by Artificial Neural Network and Regression Analysis Methods. Sadhana-Acad. Proc. Eng. Sci. 2022, 47, 150. [Google Scholar] [CrossRef]
- Priyadarshini, M.; Vishwanatha, H.M.; Biswas, C.K.; Singhal, P.; Buddhi, D.; Behera, A. Effect of Grey Relational Optimization of Process Parameters on Surface and Tribological Characteristics of Annealed AISI P20 Tool Steel Machined Using Wire EDM. Int. J. Interact. Des. Manuf.—IJIDEM 2022, 1–10. [Google Scholar] [CrossRef]
- Singh, R.; Hussain, S.A.I.; Dash, A.; Rai, R.N. Modelling and Optimizing Performance Parameters in the Wire-Electro Discharge Machining of Al5083/B4C Composite by Multi-Objective Response Surface Methodology. J. Braz. Soc. Mech. Sci. Eng. 2020, 42, 344. [Google Scholar] [CrossRef]
- Majumdar, S.; Bhoi, N.K.; Singh, H. Graphene Nano-Powder Mixed Electric Discharge Machining of Inconel 625 Alloy: Optimization of Process Parameters for Material Removal Rate. Int. J. Interact. Des. Manuf.—IJIDEM 2022, 17, 2341–2347. [Google Scholar] [CrossRef]
- Bose, S.; Nandi, T. Measurement of Performance Parameters and Improvement in Optimized Solution of WEDM on a Novel Titanium Hybrid Composite. Measurement 2021, 171, 108811. [Google Scholar] [CrossRef]
- Sivaiah, P.; Chakradhar, D. Modeling and Optimization of Sustainable Manufacturing Process in Machining of 17-4 PH Stainless Steel. Measurement 2019, 134, 142–152. [Google Scholar] [CrossRef]
- Lau, W.S.; Wang, M.; Lee, W.B. Electrical Discharge Machining of Carbon Fibre Composite Materials. Int. J. Mach. Tools Manuf. 1990, 30, 297–308. [Google Scholar] [CrossRef]
- Gourgouletis, K.; Vaxevanidis, N.M.; Galanis, N.I.; Manolakos, D.E. Electrical Discharge Drilling of Carbon Fibre Reinforced Composite Materials. Int. J. Mach. Mach. Mater. 2011, 10, 187–201. [Google Scholar] [CrossRef]
- Habib, S.; Okada, A. Study on the Movement of Wire Electrode during Fine Wire Electrical Discharge Machining Process. J. Mater. Process. Technol. 2016, 227, 147–152. [Google Scholar] [CrossRef]
- Lodhi, B.K.; Verma, D.; Shukla, R. Optimization of Machining Parameters in EDM of CFRP Composite Using Taguchi Technique. Int. J. Mech. Eng. Technol. 2014, 5, 70–77. [Google Scholar]
- Maegawa, S.; Morikawa, Y.; Hayakawa, S.; Itoigawa, F.; Nakamura, T. A Novel Cutting Concept of CFRP Composites for Extending the Life of Tool. Key Eng. Mater. 2015, 656–657, 198–203. [Google Scholar] [CrossRef]
- Sheikh-Ahmad, J.Y. Hole Quality and Damage in Drilling Carbon/Epoxy Composites by Electrical Discharge Machining. Mater. Manuf. Process. 2016, 31, 941–950. [Google Scholar] [CrossRef]
- Sheikh-Ahmad, J.Y.; Shinde, S.R. Machinability of Carbon/Epoxy Composites by Electrical Discharge Machining. Int. J. Mach. Mach. Mater. 2016, 18, 3–17. [Google Scholar] [CrossRef]
- Teicher, U.; Müller, S.; Münzner, J.; Nestler, A. Micro-EDM of Carbon Fibre-Reinforced Plastics. Procedia Cirp 2013, 6, 320–325. [Google Scholar] [CrossRef]
- Kumar, R.; Agrawal, P.K.; Singh, I. Fabrication of Micro Holes in CFRP Laminates Using EDM. J. Manuf. Process. 2018, 31, 859–866. [Google Scholar] [CrossRef]
- Hassan, A.; He, Y.L.; Rehman, M.; Ishfaq, K.; Zahoor, S.; Hussain, M.Z.; Siddique, F.; Wang, D.C. Machinability Investigation in Electric Discharge Machining of Carbon Fiber Reinforced Composites for Aerospace applications. Polym. Compos. 2022, 43, 7773–7788. [Google Scholar] [CrossRef]
- Farooq, M.U.; Anwar, S.; Ali, M.A.; Hassan, A.; Mushtaq, R.T. Exploring Wide-Parametric Range for Tool Electrode Selection Based on Surface Characterization and Machining Rate Employing Powder-Mixed Electric Discharge Machining Process for Ti6Al4V ELI. Int. J. Adv. Manuf. Technol. 2023, 129, 2823–2841. [Google Scholar] [CrossRef]
- Park, S.; Kim, G.; Lee, W.; Min, B.-K.; Lee, S.-W.; Kim, T.-G. Microhole machining on precision cfrp components using electrical discharging machining. In Proceedings of the 20th International Conference on Composite Materials (ICCM 2015), Copenhagen, Denmark, 19–24 July 2015. [Google Scholar]
- Mushtaq, R.T.; Iqbal, A.; Wang, Y.; Cheok, Q.; Abbas, S. Parametric Effects of Fused Filament Fabrication Approach on Surface Roughness of Acrylonitrile Butadiene Styrene and Nylon-6 Polymer. Materials 2022, 15, 5206. [Google Scholar] [CrossRef]
- Wu, D.Z.; Wei, Y.P.; Terpenny, J. Predictive Modelling of Surface Roughness in Fused Deposition Modelling Using Data Fusion. Int. J. Prod. Res. 2019, 57, 3992–4006. [Google Scholar] [CrossRef]
- Mushtaq, R.T.; Iqbal, A.; Wang, Y.; Khan, A.M.; Petra, M.I. Advancing PLA 3D Printing with Laser Polishing: Improving Mechanical Strength, Sustainability, and Surface Quality. Crystals 2023, 13, 626. [Google Scholar] [CrossRef]
- Mushtaq, R.T.; Wang, Y.; Khan, A.M.; Rehman, M.; Li, X.; Sharma, S. A Post-Processing Laser Polishing Method to Improve Process Performance of 3D Printed New Industrial Nylon-6 Polymer. J. Manuf. Process. 2023, 101, 546–560. [Google Scholar] [CrossRef]
- Khan, M.S.; Mishra, S.B. Minimizing Surface Roughness of ABS-FDM Build Parts: An Experimental Approach. Mater. Today Proc. 2019, 26, 1557–1566. [Google Scholar] [CrossRef]
- Mohamed, O.A.; Masood, S.H.; Bhowmik, J.L. Experimental Investigation for Dynamic Stiffness and Dimensional Accuracy of FDM Manufactured Part Using IV-Optimal Response Surface Design. Rapid Prototyp. J. 2017, 23, 736–749. [Google Scholar] [CrossRef]


| Elements | Weight (%) |
|---|---|
| Carbon | 1.4–1.6 |
| Chromium | 11–12 |
| Molybdenum | 0.70–1.20 |
| Manganese | 0.6 |
| Silicon | 0.6 |
| Phosphorus | 0.030 |
| Sulfur | 0.030 |
| Properties | Values |
|---|---|
| Rockwell Hardness, C (AISI D2 Steel) | 58–62 HRC |
| Strength (AISI D2 Steel) | 600–700 MPa |
| Yield Strength (AISI D2 Steel) | 400 MPa |
| Elastic Modulus (AISI D2 Steel) | 190–210 GPa |
| Specific Gravity (AISI D2 Steel) | 7.87 |
| Density (AISI D2 Steel) | 7700 kg/m3 |
| Electrical Resistivity (AISI D2 Steel) | 54.8 μOhm-cm at 21 °C |
| Elongation at Break (AISI D2 Steel) | 4–10% |
| Poisson Ratio (AISI D2 Steel) | 0.27–0.30 |
| Machinability (AISI D2 Steel) | Fair to Poor |
| Melting Point (AISI D2 Steel) | 1510 °C |
| Forging (AISI D2 Steel) | 1050 °C–900 °C |
| Annealing (AISI D2 Steel) | 850 °C |
| Rockwell Hardness, B (Copper tool) | 45 HRB |
| Tensile Strength (Copper tool) | 210–345 MPa |
| Yield Strength (Copper tool) | 115–125 MPa |
| Elastic Modulus (Copper tool) | 117 GPa |
| Specific Gravity (Copper tool) | 8.96 |
| Electrical Resistivity (Copper tool) | 1.70 × 10⁶ Ω cm at 20 °C |
| Elongation at Break (Copper tool) | 40% |
| Poisson Ratio (Copper tool) | 0.20–0.30 |
| Machinability (Copper tool) | Excellent |
| Heat of Fusion (Copper tool) | 204.8 J/g |
| Heat of Vaporization (Copper tool) | 5234 J/g |
| Specific Heat Capacity (Copper tool) | 0.385 J/g-°C |
| Ip (A) | Vg (V) | Ton (μs) | T (%) | MRR (g/min) | EWR (g/min) | ROC (mm) |
|---|---|---|---|---|---|---|
| 10 | 55 | 80 | 7 | 0.0713 | 0.00228 | 0.212 |
| 10 | 60 | 120 | 10 | 0.0927 | 0.00494 | 0.2042 |
| 10 | 65 | 160 | 13 | 0.10039 | 0.006471 | 0.2204 |
| 14 | 55 | 120 | 13 | 0.089356 | 0.001544 | 0.2183 |
| 14 | 60 | 160 | 7 | 0.05306 | 0.0035294 | 0.223 |
| 14 | 65 | 80 | 10 | 0.113906 | 0.00634 | 0.2567 |
| 18 | 55 | 160 | 10 | 0.0642 | 0.0003718 | 0.2292 |
| 18 | 60 | 80 | 13 | 0.112 | 0.0032158 | 0.25 |
| 18 | 65 | 120 | 7 | 0.089022 | 0.0055 | 0.285 |
| Scheme | DF | Seq SS | Contribution | Adj SS | Adj MS | F-Value | p-Value | Residuals | SD |
|---|---|---|---|---|---|---|---|---|---|
| Regression | 4 | 0.003382 | 96.98% | 0.003382 | 0.000846 | 32.13 | 0.003 | −0.0013423 | −0.55508 |
| Ip (Amp) | 1 | 0.000000 | 0.00% | 0.000000 | 0.000000 | 0.00 | 0.950 | 0.0055127 | 1.26450 |
| Vg (volt) | 1 | 0.001026 | 29.42% | 0.001026 | 0.001026 | 38.99 | 0.003 | −0.0013423 | −0.55508 |
| Ton (μs) | 1 | 0.001055 | 30.25% | 0.001055 | 0.001055 | 40.08 | 0.003 | 0.0003797 | 0.09930 |
| T | 1 | 0.001301 | 37.31% | 0.001301 | 0.001301 | 49.45 | 0.002 | −0.0062793 | −1.64226 |
| Error | 4 | 0.000105 | 3.02% | 0.000105 | 0.000026 | 0.0002437 | 0.06373 | ||
| Total | 8 | 0.003488 | 100.00% | 0.0030717 | 0.96018 |
| Source | DF | Seq SS | Contribution | Adj SS | Adj MS | F-Value | p-Value | Residuals | SD |
|---|---|---|---|---|---|---|---|---|---|
| Regression | 4 | 0.000037 | 99.34% | 0.000037 | 0.000009 | 150.78 | 0.000 | −0.0001908 | −1.63239 |
| Ip (Amp) | 1 | 0.000004 | 9.46% | 0.000004 | 0.000004 | 57.42 | 0.002 | 0.0003737 | 1.77286 |
| Vg (volt) | 1 | 0.000033 | 88.92% | 0.000033 | 0.000033 | 539.88 | 0.000 | −0.0001908 | −1.63239 |
| Ton (μs) | 1 | 0.000000 | 0.96% | 0.000000 | 0.000000 | 5.80 | 0.074 | 0.0001105 | 0.59789 |
| T | 1 | 0.000000 | 0.00% | 0.000000 | 0.000000 | 0.02 | 0.903 | −0.0000389 | −0.21032 |
| Error | 4 | 0.000000 | 0.66% | 0.000000 | 0.000000 | −0.0000556 | −0.30066 | ||
| Total | 8 | 0.000037 | 100.00% | −0.0000636 | −0.41130 |
| Source | DF | Seq SS | Contribution | Adj SS | Adj MS | F-Value | p-Value | Residuals | SD |
|---|---|---|---|---|---|---|---|---|---|
| Regression | 4 | 0.004986 | 93.82% | 0.004986 | 0.001246 | 15.18 | 0.011 | 0.0042667 | 0.99877 |
| Ip (Amp) | 1 | 0.002714 | 51.07% | 0.002714 | 0.002714 | 33.04 | 0.005 | −0.0077333 | −1.00415 |
| Vg (volt) | 1 | 0.001754 | 33.02% | 0.001754 | 0.001754 | 21.36 | 0.010 | 0.0042667 | 0.99877 |
| Ton (μs) | 1 | 0.000354 | 6.67% | 0.000354 | 0.000354 | 4.31 | 0.106 | 0.0074167 | 1.09803 |
| T | 1 | 0.000163 | 3.07% | 0.000163 | 0.000163 | 1.99 | 0.231 | −0.0077333 | −1.14491 |
| Error | 4 | 0.000328 | 6.18% | 0.000328 | 0.000082 | - | - | −0.0012833 | −0.19000 |
| Total | 8 | 0.005314 | 100.00% | - | - | - | - | −0.0004833 | −0.08553 |
| Run | Experimented | Predicted | Percentage Difference | ||||||
|---|---|---|---|---|---|---|---|---|---|
| - | MRR | EWR | ROC | MRR | EWR | ROC | MRR | EWR | ROC |
| 6 | 0.113906 | 0.00634 | 0.2567 | 0.114 | 0.0064 | 0.258 | 0.08 | 0.95 | 0.51 |
| 9 | 0.089022 | 0.0055 | 0.285 | 0.086 | 0.00540 | 0.277 | 3.39 | 1.82 | 2.81 |
Disclaimer/Publisher’s Note: The statements, opinions and data contained in all publications are solely those of the individual author(s) and contributor(s) and not of MDPI and/or the editor(s). MDPI and/or the editor(s) disclaim responsibility for any injury to people or property resulting from any ideas, methods, instructions or products referred to in the content. |
© 2023 by the authors. Licensee MDPI, Basel, Switzerland. This article is an open access article distributed under the terms and conditions of the Creative Commons Attribution (CC BY) license (https://creativecommons.org/licenses/by/4.0/).
Share and Cite
Hassan, A.; Mushtaq, R.T.; Mashood Khan, A.; Anwar, S. Parametric Investigation of the Effects of Electrical Discharge Machining on Plain D2 Steel. Metals 2023, 13, 1964. https://doi.org/10.3390/met13121964
Hassan A, Mushtaq RT, Mashood Khan A, Anwar S. Parametric Investigation of the Effects of Electrical Discharge Machining on Plain D2 Steel. Metals. 2023; 13(12):1964. https://doi.org/10.3390/met13121964
Chicago/Turabian StyleHassan, Abual, Ray Tahir Mushtaq, Aqib Mashood Khan, and Saqib Anwar. 2023. "Parametric Investigation of the Effects of Electrical Discharge Machining on Plain D2 Steel" Metals 13, no. 12: 1964. https://doi.org/10.3390/met13121964
APA StyleHassan, A., Mushtaq, R. T., Mashood Khan, A., & Anwar, S. (2023). Parametric Investigation of the Effects of Electrical Discharge Machining on Plain D2 Steel. Metals, 13(12), 1964. https://doi.org/10.3390/met13121964