Article

Influence of Typical Technological Parameters on the Forming Quality of TA1 in Selective Laser Melting

1
School of Automation, Southeast University, Nanjing 210096, China
2
Shenzhen Research Institute, Southeast University, Shenzhen 518000, China
*
Author to whom correspondence should be addressed.
Metals 2023, 13(12), 1971; https://doi.org/10.3390/met13121971
Submission received: 10 October 2023 / Revised: 28 November 2023 / Accepted: 30 November 2023 / Published: 3 December 2023
(This article belongs to the Special Issue Advances in Selective Laser Melting of Light Alloys)

Abstract

:
As an emerging additive manufacturing technology with potential, selective laser melting (SLM) technology is one of the current mainstream additive manufacturing processes. Many complex conditions affect the quality of the SLM products, such as extremely short forming time, rapidly changing forming environment, and micron-level melting area. Numerical simulation and a printing experiment were used to study the influence of typical technological parameters on the forming quality of SLM products, where TA1 was used as the printing material. The typical technological parameters mainly considered laser power, laser scanning speed, hatch spacing, and laser energy density. Simulation analysis was based on the maximum temperature and the size of the molten pool, and the printing experiment was focused on the parameter design methods for typical processes and the forming quality of printed products. The results show the following: (1) An increase in laser power and laser energy density can significantly improve the forming quality. However, excessive input energy will lead to poor surface quality; (2) Scanning speed and hatch spacing need to be selected according to the size of the molten pool, which mainly influences the lap rate of the molten pool. The results of this study may provide some guidance for parameter setting and forming quality optimization in SLM manufacturing process.

1. Introduction

SLM technology uses a laser as a heat source and metal powder as a raw material, and can achieve a complex product structure. Compared with traditional processing methods, SLM technology has a higher material utilization rate, which greatly reduces the complexity of the manufacturing process and also has better processing accuracy [1,2]. It has been widely applied in aerospace, deep sea exploration, medical equipment and other frontier fields [3,4,5].
SLM technology has brought rapid prototyping solutions, but it still faces many technical challenges. Because of the fast laser scanning speed, the short existence time of molten pools, and high heating and cooling rates during the forming process, SLM products are prone to defects such as cracks, pores, and poor surface quality [6]. SLM forming quality is affected by powder characteristics and laser characteristics, wherein powder characteristics are fixed, and laser characteristics can be regulated in real time. Laser characteristics mainly include laser power, laser scanning speed, hatch spacing, and laser energy density [7], which are defined as typical technological parameters. Studying the influence of these adjustable typical technological parameters on product printing quality is of great significance to help optimize printing parameters and improve product quality. Surface roughness and internal porosity are used as key values to characterize the quality of SLM products.
Han et al. [8] studied the forming process and surface forming quality of titanium alloy 3D printing based on the basic parameters of the single-melt-channel test, which found that the use of high power, low scanning line spacing. and appropriately reducing the exposure time can effectively improve the surface forming quality. An et al. [9] studied the influence of technological parameters on the density and roughness of cobalt–chromium alloys, which showed that the thickness of the powder coating is the most important factor affecting the density of SLM moldings. Wang et al. [10] studied the influence of linear energy density on the defects of 316L stainless steel in selective laser melting. The research showed that when the linear energy density is high, crack defects and bubbles are reduced. Larimian et al. [11] focused on the effects of various typical technological parameters on the densification, microstructure, and mechanical properties of the materials. They concluded that samples fabricated with alternate hatches and a single pass of a laser beam exhibited the highest densification and most refined microstructure. Slama et al. [12] analyzed molten pool size and built a numerical model based on the finite element method (FEM) to predict the occurrence of porosity defects such as insufficient fusion (LOF), pellet formation, and keyholes. The study quantifies the effects of technological parameters such as laser power, scanning speed, and layer thickness and their interactions. In the field of numerical simulation of SLM technology, there have been many achievements. Qu et al. [13] used the discrete element method to build a powder bed, simulated the evolution of the molten pool during the printing process using the numerical simulation method, and restored the splash phenomenon. It was found that with the increase in power, the depth and width of the molten pool are enlarged and the laser scanning speed is increased.
The studies mentioned above have already achieved some results in terms of the forming quality and parameter influence of SLM technology. In this study, a more complete experimental design and comparative analysis were carried out on the basis of reference to these research works. Through the method of combining numerical simulation and a printing experiment, the influencing factors of forming quality can be analyzed more comprehensively from mechanism to macro. As shown in Figure 1, this study explores the influence of typical technological parameters on the SLM forming quality through numerical simulation and printing experiments. In the numerical simulation part, the influence of technological parameters on the SLM process is mainly discussed based on the molten pool. The model and process of simulation experiment were designed and implemented independently. In the printing experiment, the influence of technological parameters on product quality was discussed by means of industrial CT and an ultra-depth microscope.

2. Materials and Methods

2.1. Printing Material

TA1 standard powder (BLT Inc, Xi’an, CN), was used as the SLM molding material. It has certain mechanical properties, good biocompatibility, and excellent corrosion resistance, meaning it has broad application prospects in chemical, shipbuilding, medical and other fields [14,15]. The composition of the TA1 material is listed in Table 1. The data type in Table 1 is percentage by weight (wt%).
The particle diameter distribution table of TA1 material used in this study is given in Table 2. The particle size distribution method is a statistical method. In the particle size distribution method, three special percentages, namely D10, D50 and D90, are usually selected as characteristics.
(1).
D10: Its physical significance is that 10% of the particles are smaller than the corresponding size. It is usually used to indicate the particle size index of the fine end of the powder.
(2).
D50: Its physical significance is that 50% of the particles are smaller than the corresponding size, which is known as median diameter or median particle size. It is a typical index for evaluating powder particle size in powder production and application, and it is usually used to represent the average particle size of the powder.
(3).
D90: Its physical significance is that 90% of the particles are smaller than the corresponding size. It is usually used to indicate the particle size index of the coarse end of the powder.
These three percentages are percentage by volume. Take the first line in Table 2 as an example, which corresponds to a value of 20.2. This means that the proportion of particles with a diameter less than 20.2 µm in powder materials is 10%.
The physical and thermal properties of the TA1 material involved in the numerical simulation part are shown in Table 3.

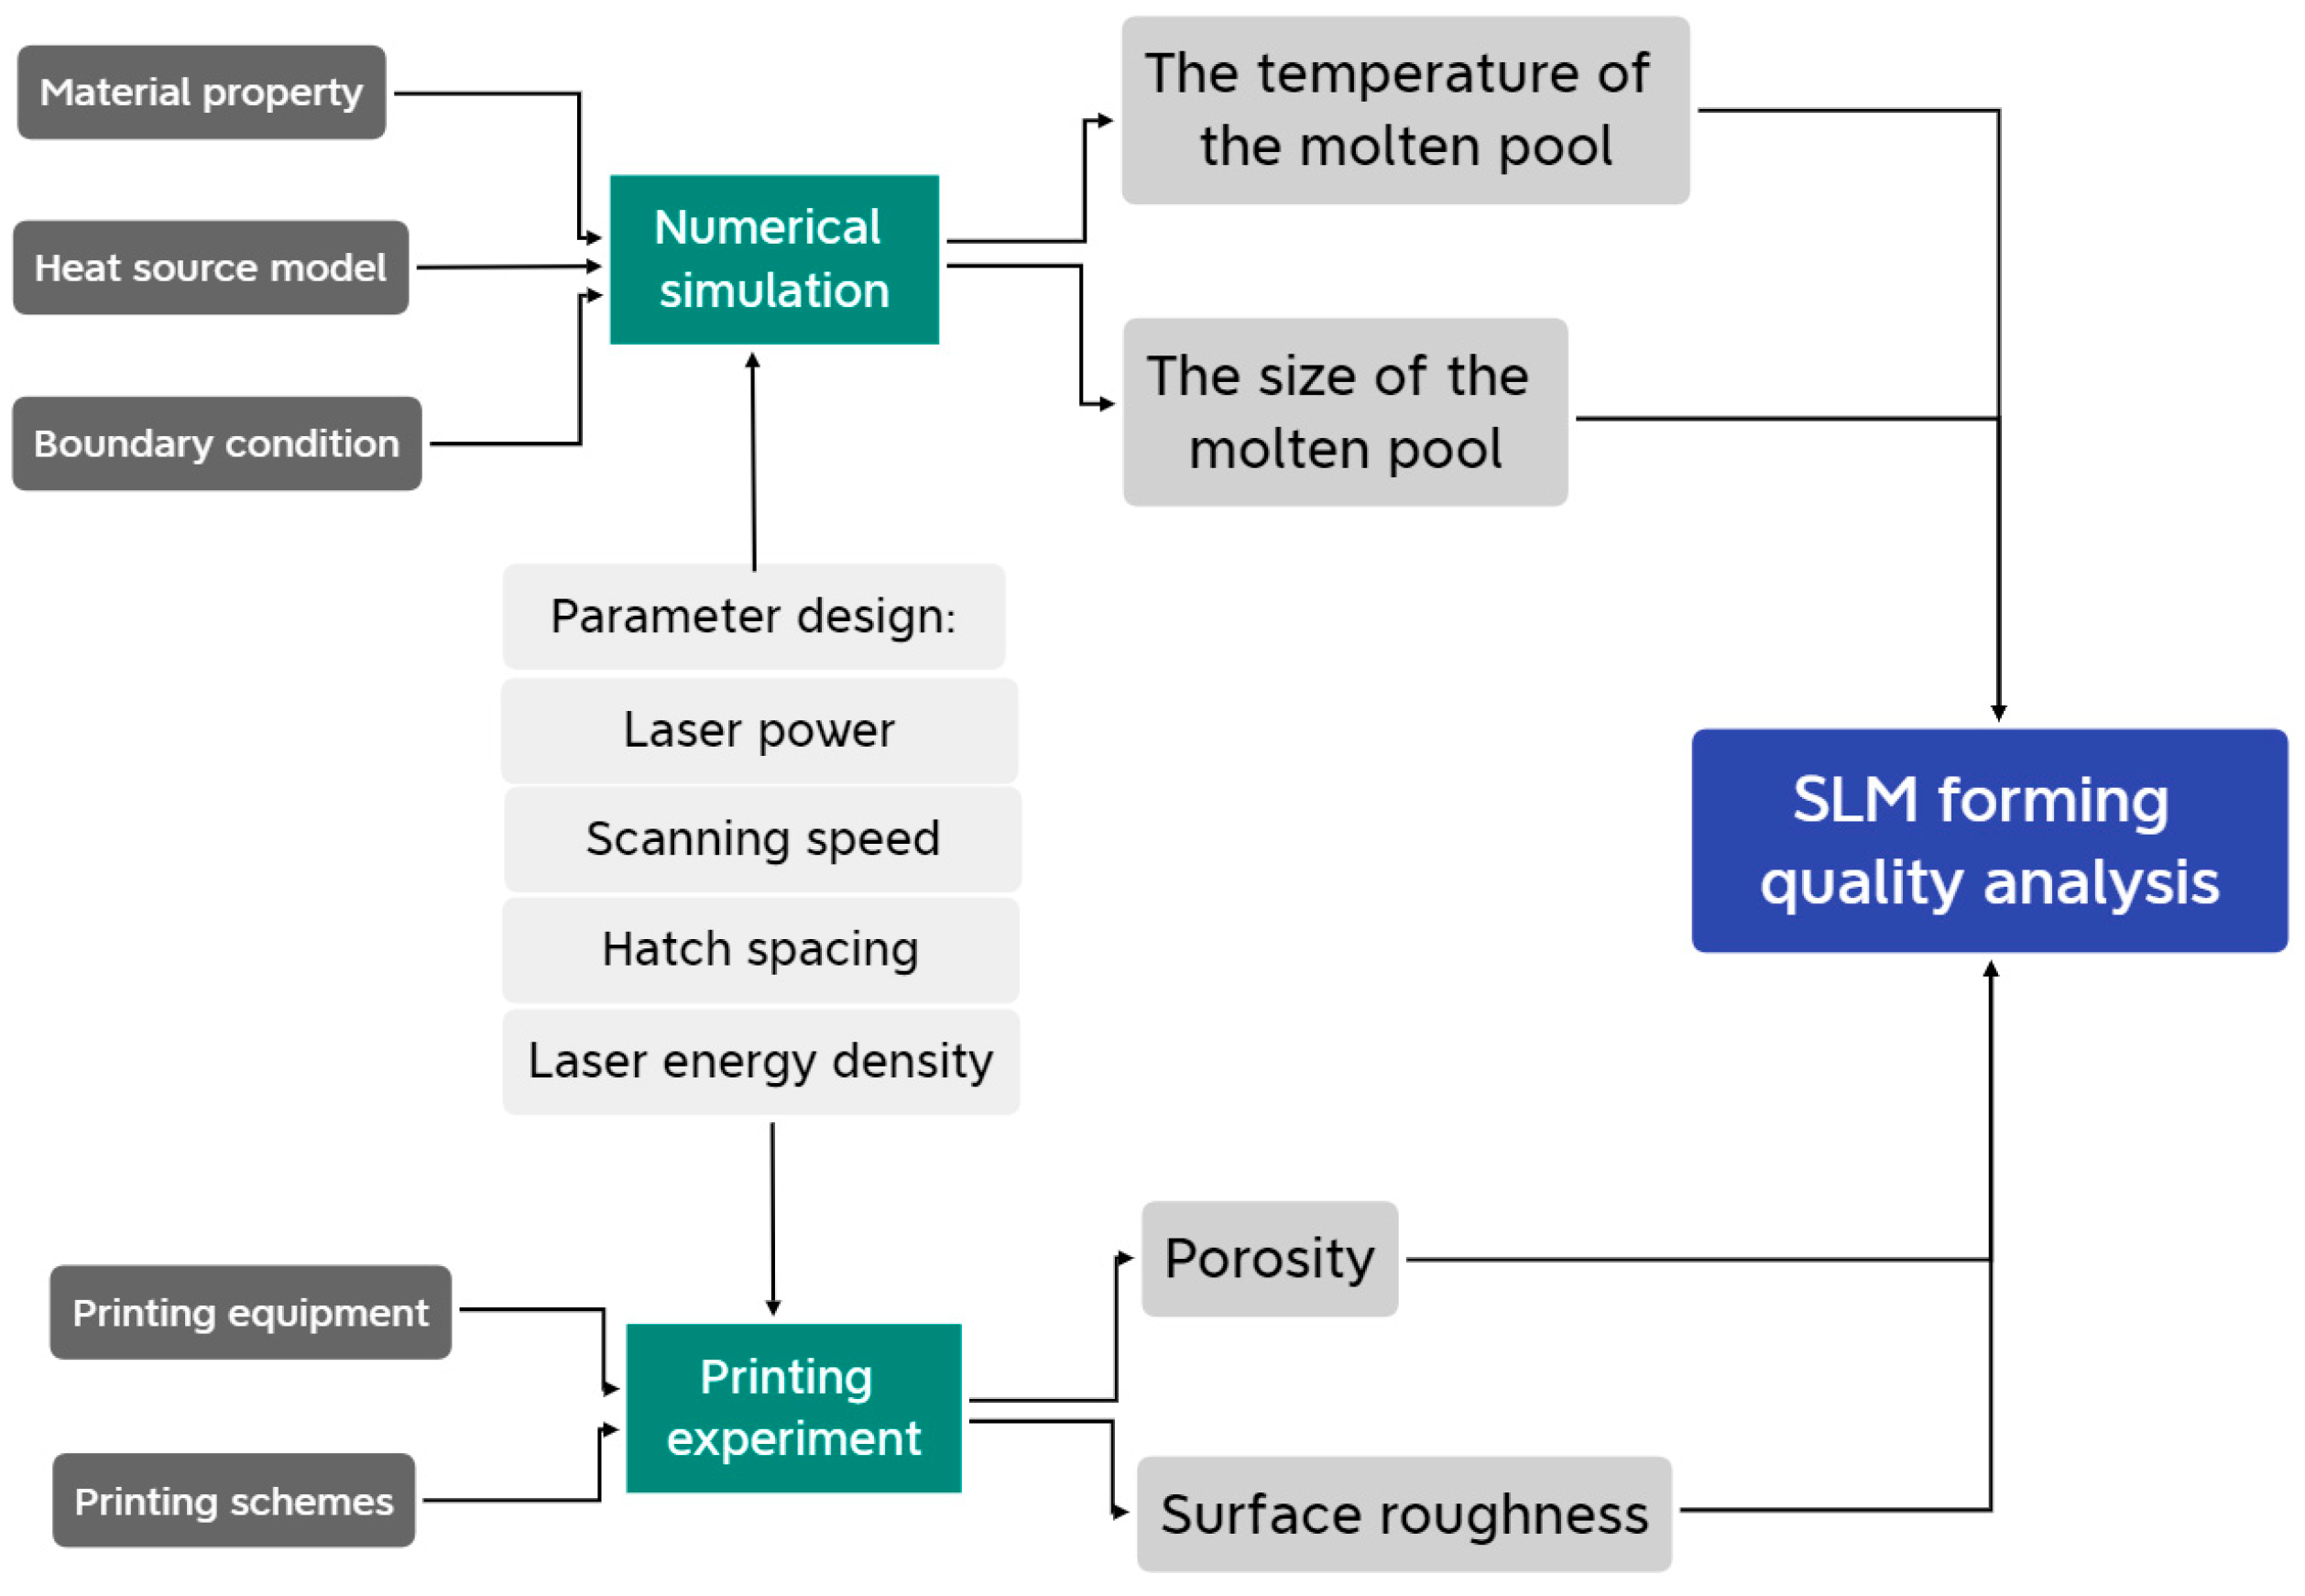
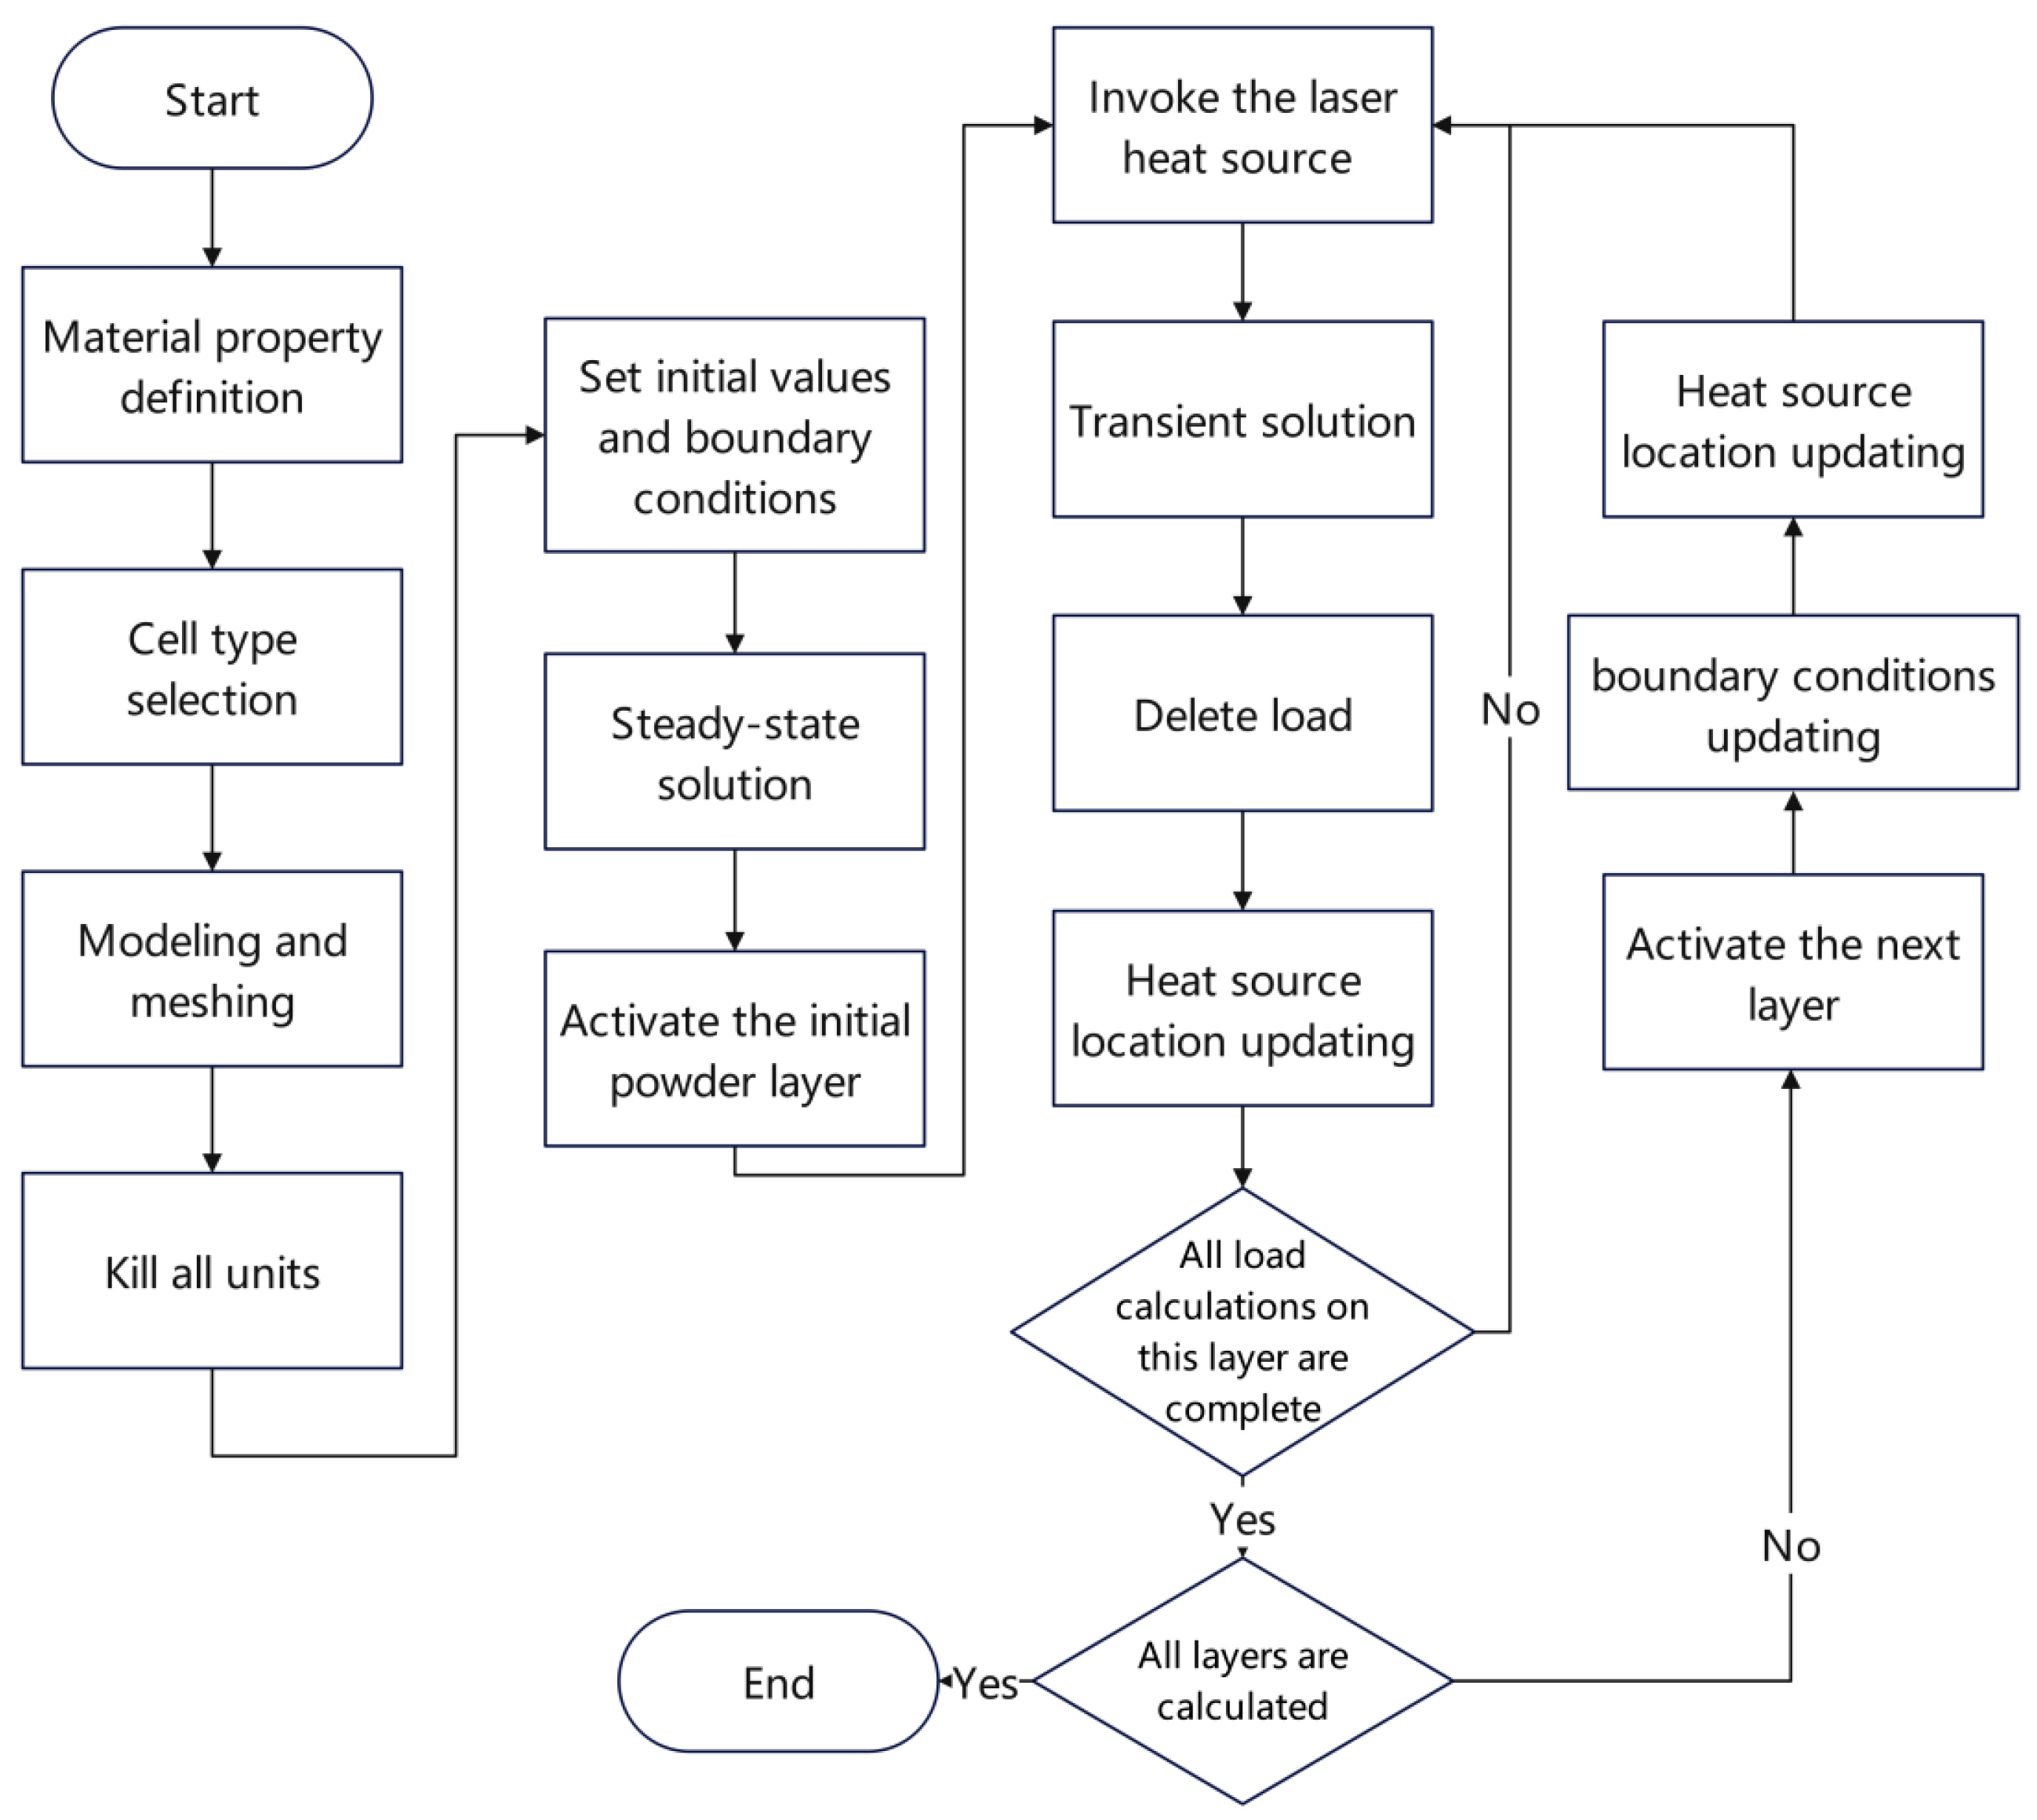
2.2. Numerical Simulation

In this study, the temperature field of TA1 alloy in selective laser melting was numerically simulated using ANSYS software. The software version used in this study was ANSYS R19.0. The influence of different process parameters on the forming process was analyzed, and the distribution characteristics and evolution rules of the temperature field in molten pool were obtained.
The numerical simulation of molten pool temperature field in the SLM forming process mainly includes the following steps: defining material parameters, establishing the CAD model, dividing the grid, loading the heat source model, setting initial conditions and boundary conditions, etc. In the simulation process, the software also needs to kill and activate the powder layer according to the print path, transform material parameters, adjust boundary conditions, etc. ANSYS Parametric Design Language (APDL) can directly encapsulate the key steps and then call the loop, reducing the influence of operation errors and making the simulation process more convenient. A flow chart of APDL, used to simulate SLM temperature field, is shown in Figure 2.
In the numerical simulation, in order to reflect the transformation of the material state, after each load loading calculation is completed, all grid cells of the print layer are traversed to obtain the temperature of each cell. When the temperature of the cell reaches the melting point, it is considered that the cell has completed the heating or cooling process, and then the cell type conversion command is called. After the conversion of all units is completed, the powder layer is killed and activated to start the simulation of the next layer. This method of numerical simulation is called the life-and-death unit method [16].
During the SLM process, the laser moves rapidly and the instantaneous temperature field changes drastically, which involves complex energy changes and energy transfers. The metal powder undergoes a solid–liquid–solid state transition in an instant. In the SLM process, heat conduction, heat convection and heat transfer are mainly involved. This process is a nonlinear transient heat conduction problem, which can be described by the three-dimensional transient heat conduction control differential equation [17].
x k x T x + y k y T y + z k z T z + Q = ρ c p T t
where ρ ( k g / m 3 ) is the density of the material, c (J/(kg°C)) is the specific heat capacity of the material, T (°C) is the temperature function of the powder, t (s) is the action time of the laser on the powder, k (W/(m°C)) is the thermal conductivity of the material, and Q (W/m3) is the intensity of the heat source. This control equation is the basis of SLM finite element simulation, and x, y, z (m) are the coordinates in the reference system.
Since the substrate used in this study was not preheated, the initial conditions can be expressed as follows [18]:
T ( x , y , z , t ) | t = 0 = T 0
where T 0 (°C) is the ambient temperature in the forming processing cavity.
The boundary conditions of the SLM simulation process need to consider heat exchange, heat radiation, and heat convection at the same time. The boundary conditions can be set as follows:
q = k T z + h T T 0 + σ ε T 4 T 0 4
where h (W/(m2°C)) is the heat convection coefficient, σ is the Stefan–Boltzmann constant, T (°C) is the temperature, and ε is the radiation coefficient of the TA1 powder to the laser [19].
In the SLM forming process, the laser is the only energy input, and its thermal energy distribution directly affects the temperature field of the SLM molten pool. As a research hotspot in the field of additive manufacturing, the laser heat source model has developed from the initial ideal uniform distributed heat source to the current Gaussian distributed heat source model, double ellipsoid heat source model, and combined heat source model [20,21,22].
The laser used in this study is a single-mode fiber laser with a wavelength of 1064 nm. In the above-mentioned heat source model, the energy distribution is more in line with Gaussian distribution. Since the laser is a low-power laser, the spot diameter is 60~70 μm. In this study, the Gaussian distribution model with energy exponential decay is used as the body heat source, and the heat load is applied to the unit body in the form of the body heat generation rate. The mathematical expression of this heat source is as follows [23]:
Q = 2 A P π r 0 2 d exp 2 r 2 r 0 2 exp z d
where P (W) is the laser power, r 0 (m) is the effective laser beam radius when the energy density of the center of the laser spot is reduced to 1/e2, r (m) is the radial distance from a point on the surface of the powder bed to the center of the laser spot, d (m) is the optical penetration depth, and A is the absorption rate of the material to the laser, which is affected by factors such as the laser wavelength, the surface condition of the powder, and the physical properties of the powder.

2.3. Forming Quality Evaluation
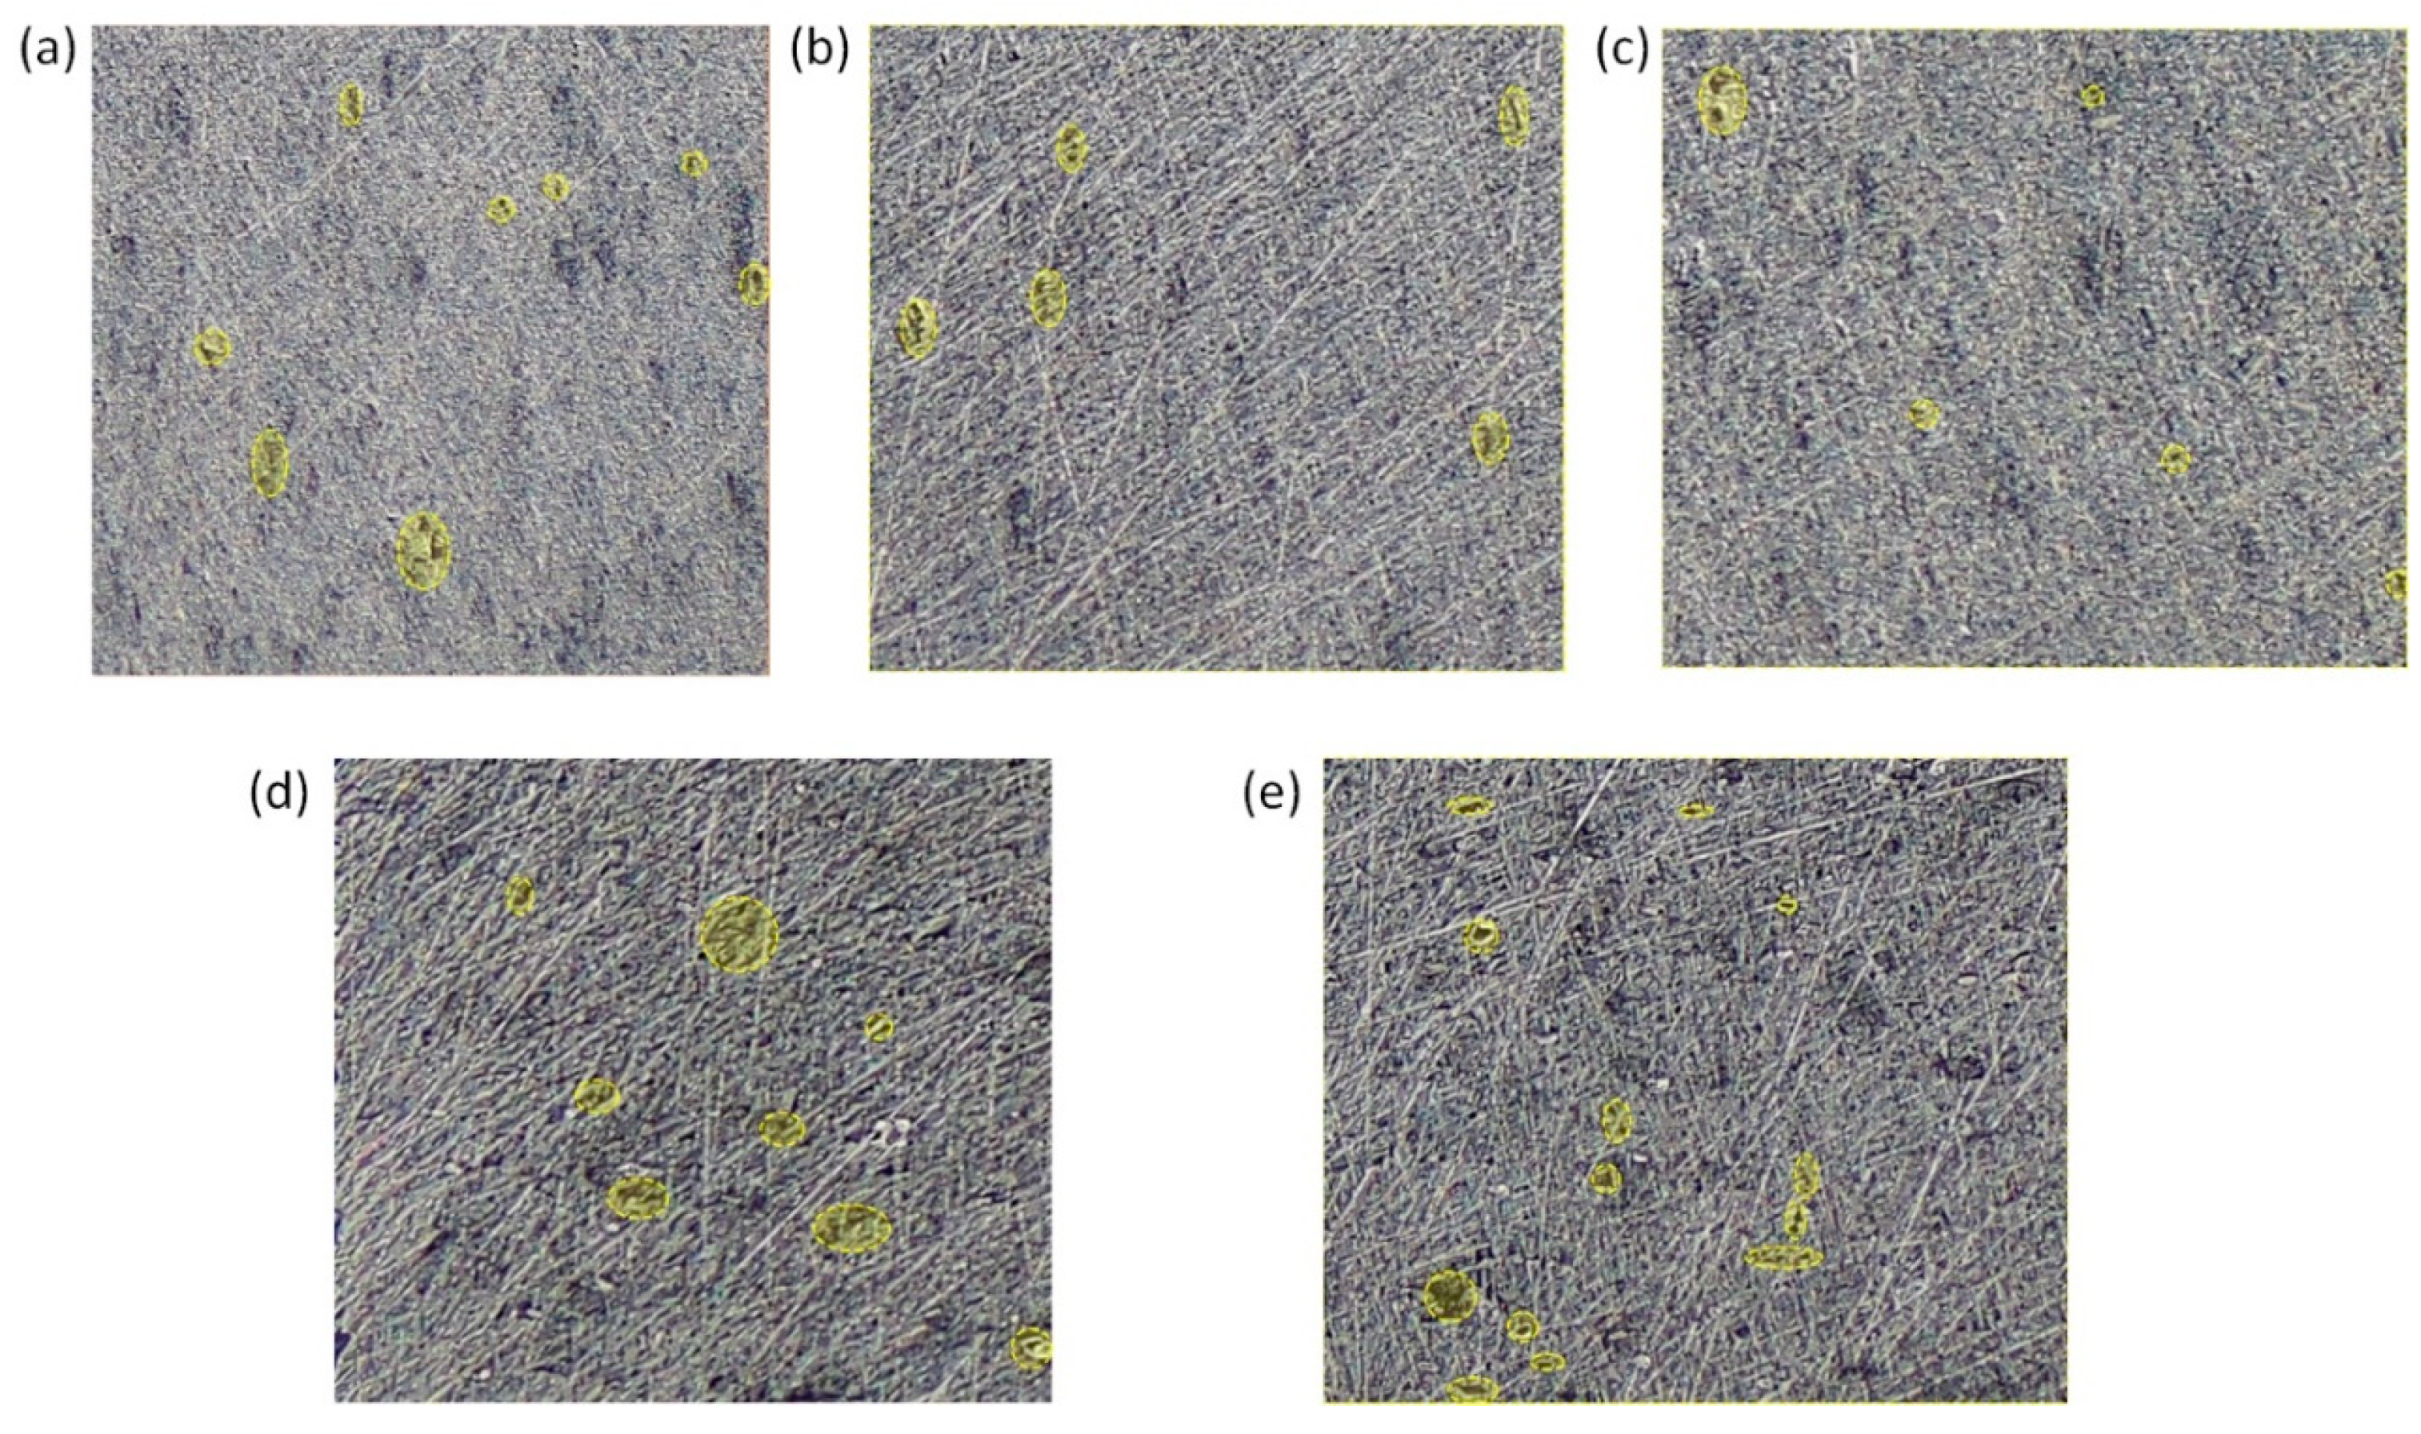
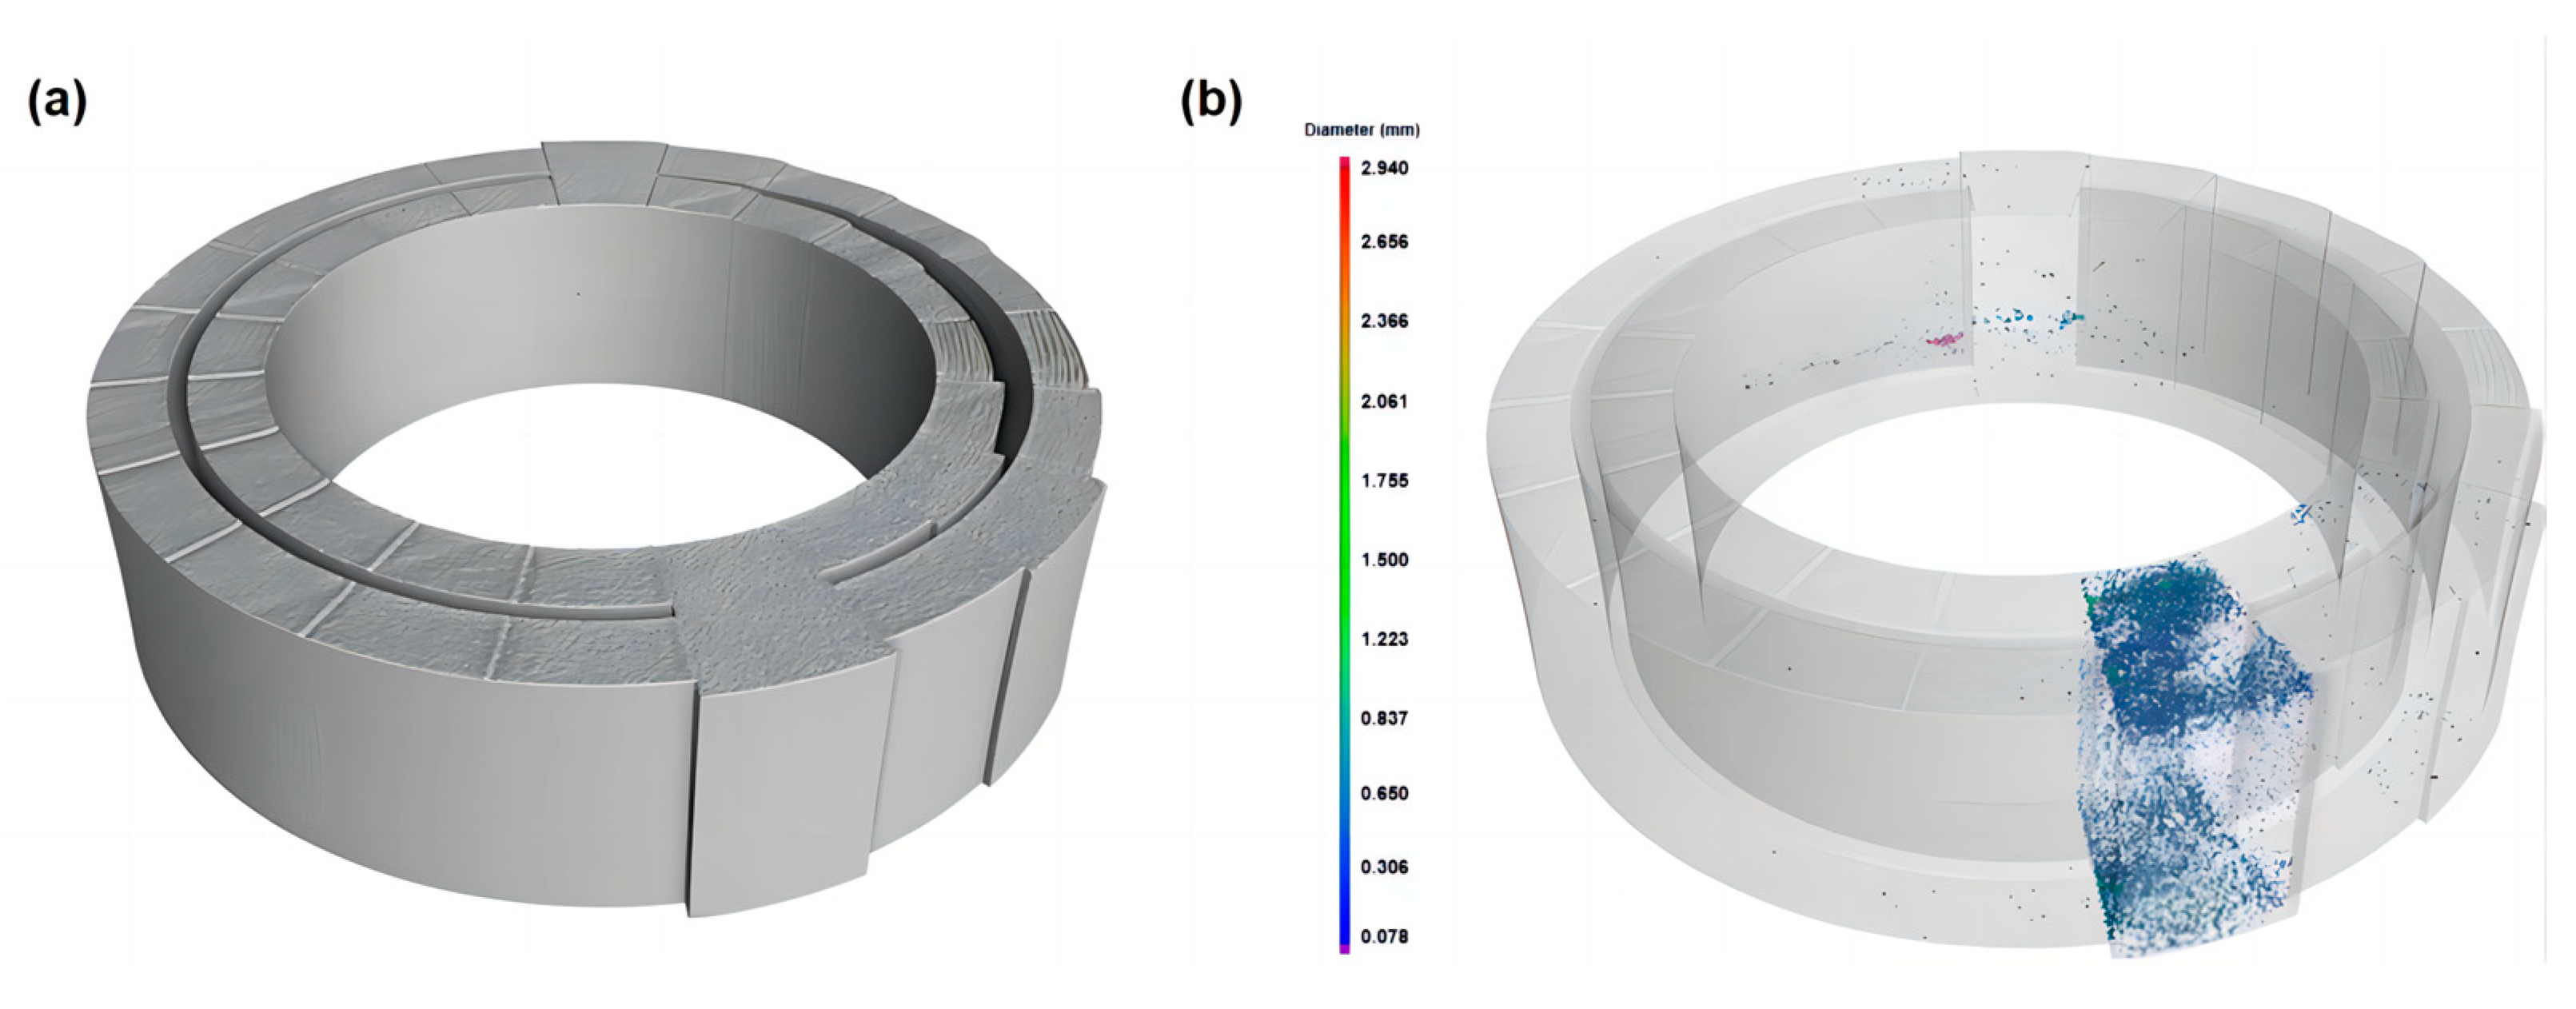
The printing equipment used in this research is a TI150 SLM metal printer from Nanjing Profeta Intelligent Technology Company. Porosity and surface roughness were used to evaluate the quality of SLM forming, as two key values in this study.

2.3.1. Porosity

Pore defects can seriously reduce forming density. Low density will adversely affect the mechanical properties, such as hardness and tensile strength, of SLM products. There are three main causes of the formation of pores: unfused defects, keyholes, and pores.
The lack of fusion defects occurs because of the low-energy laser input or fast scanning speed, which results in the downsizing of the molten pool [24]. The keyhole is mainly caused by the high-energy-density laser, which leads to the forming of the deep molten pool [25,26]. The pores are mainly caused by the moisture on the powder surface and the gas that cannot escape easily [27,28].

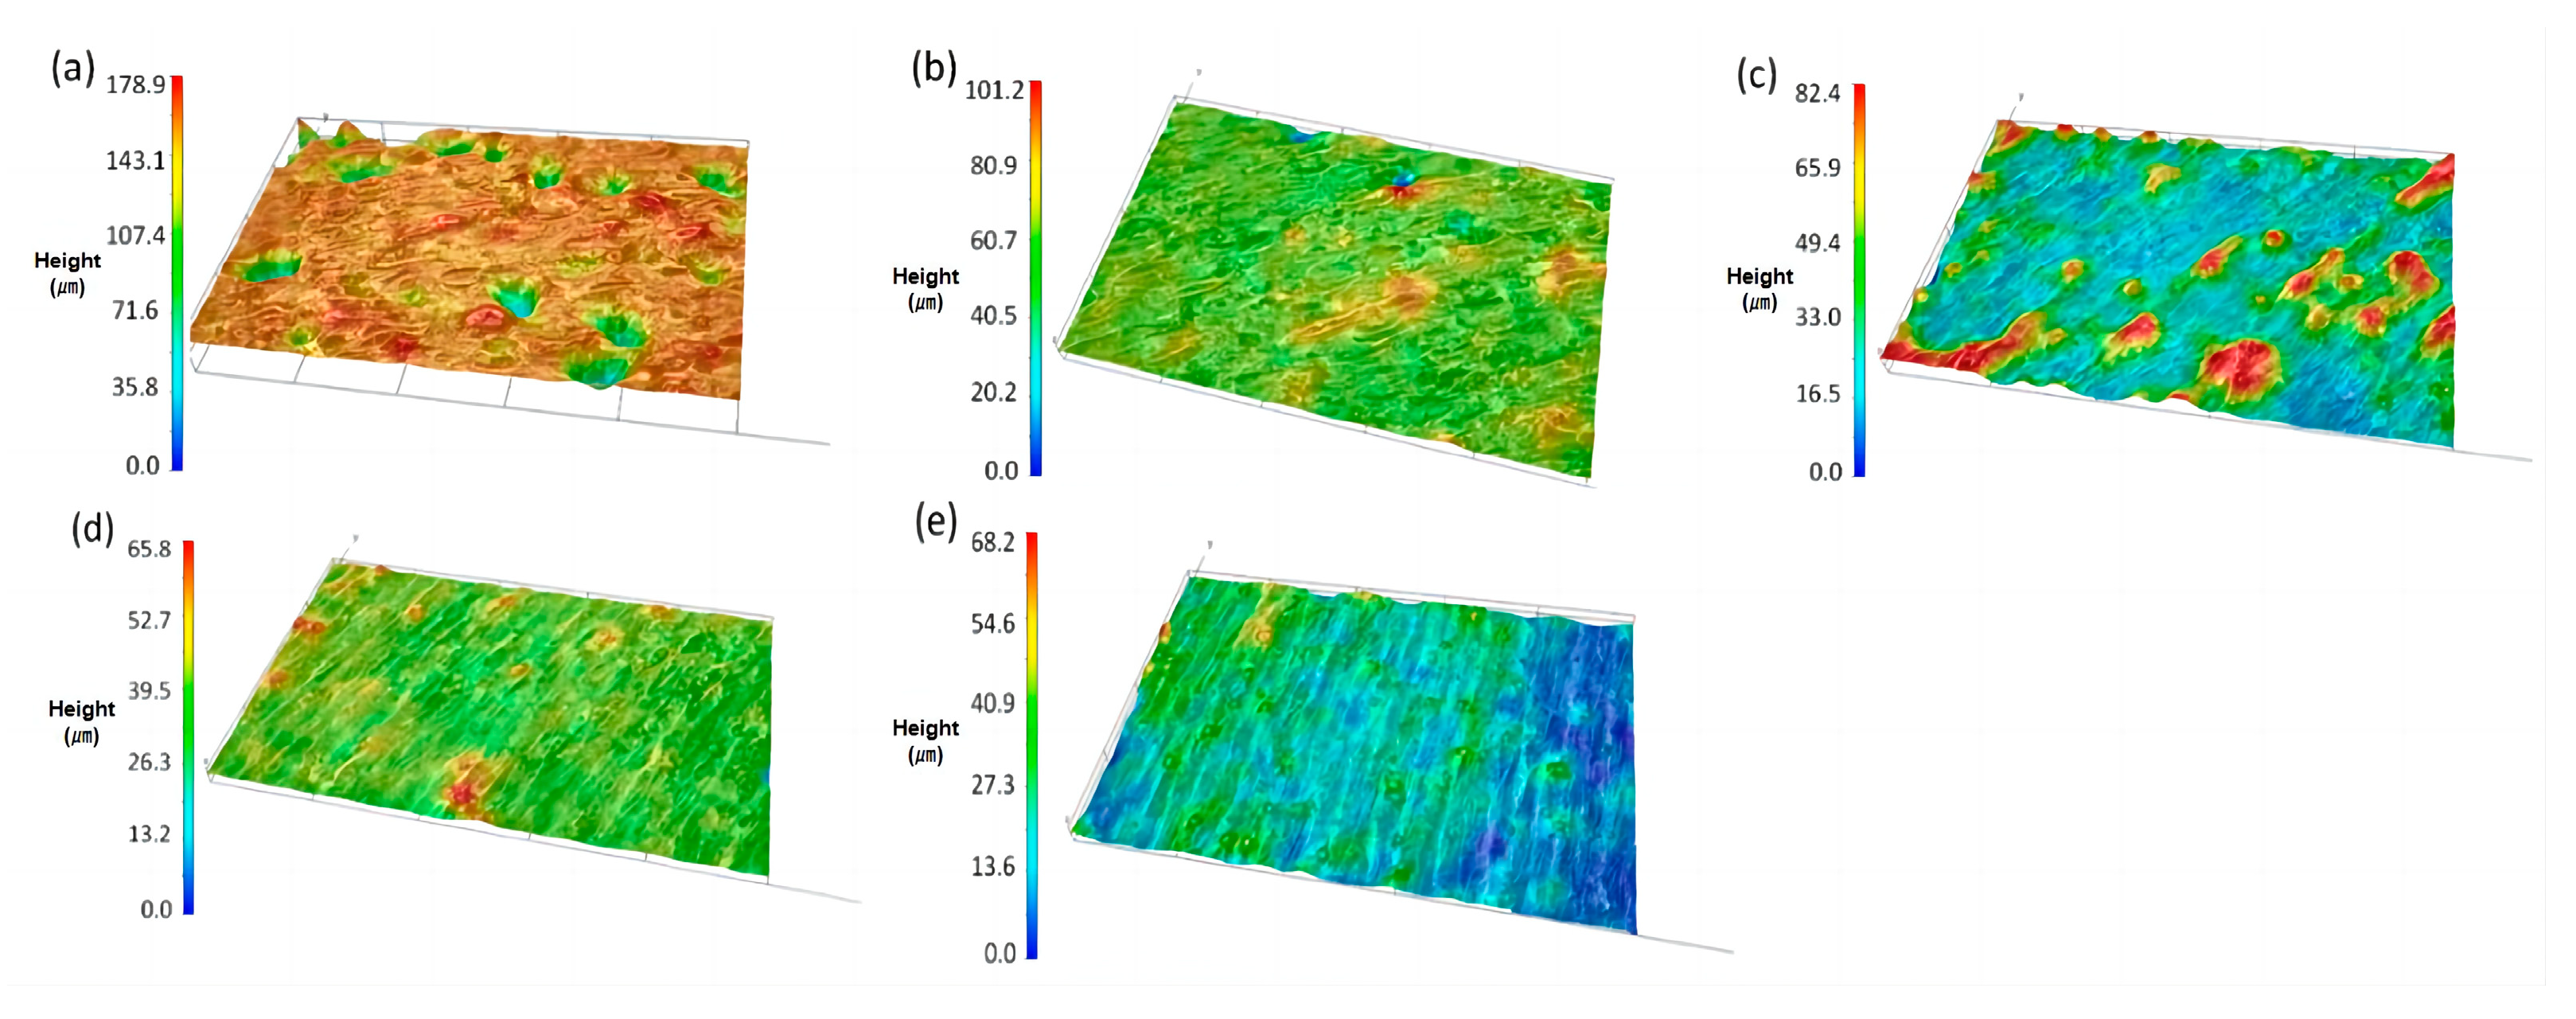
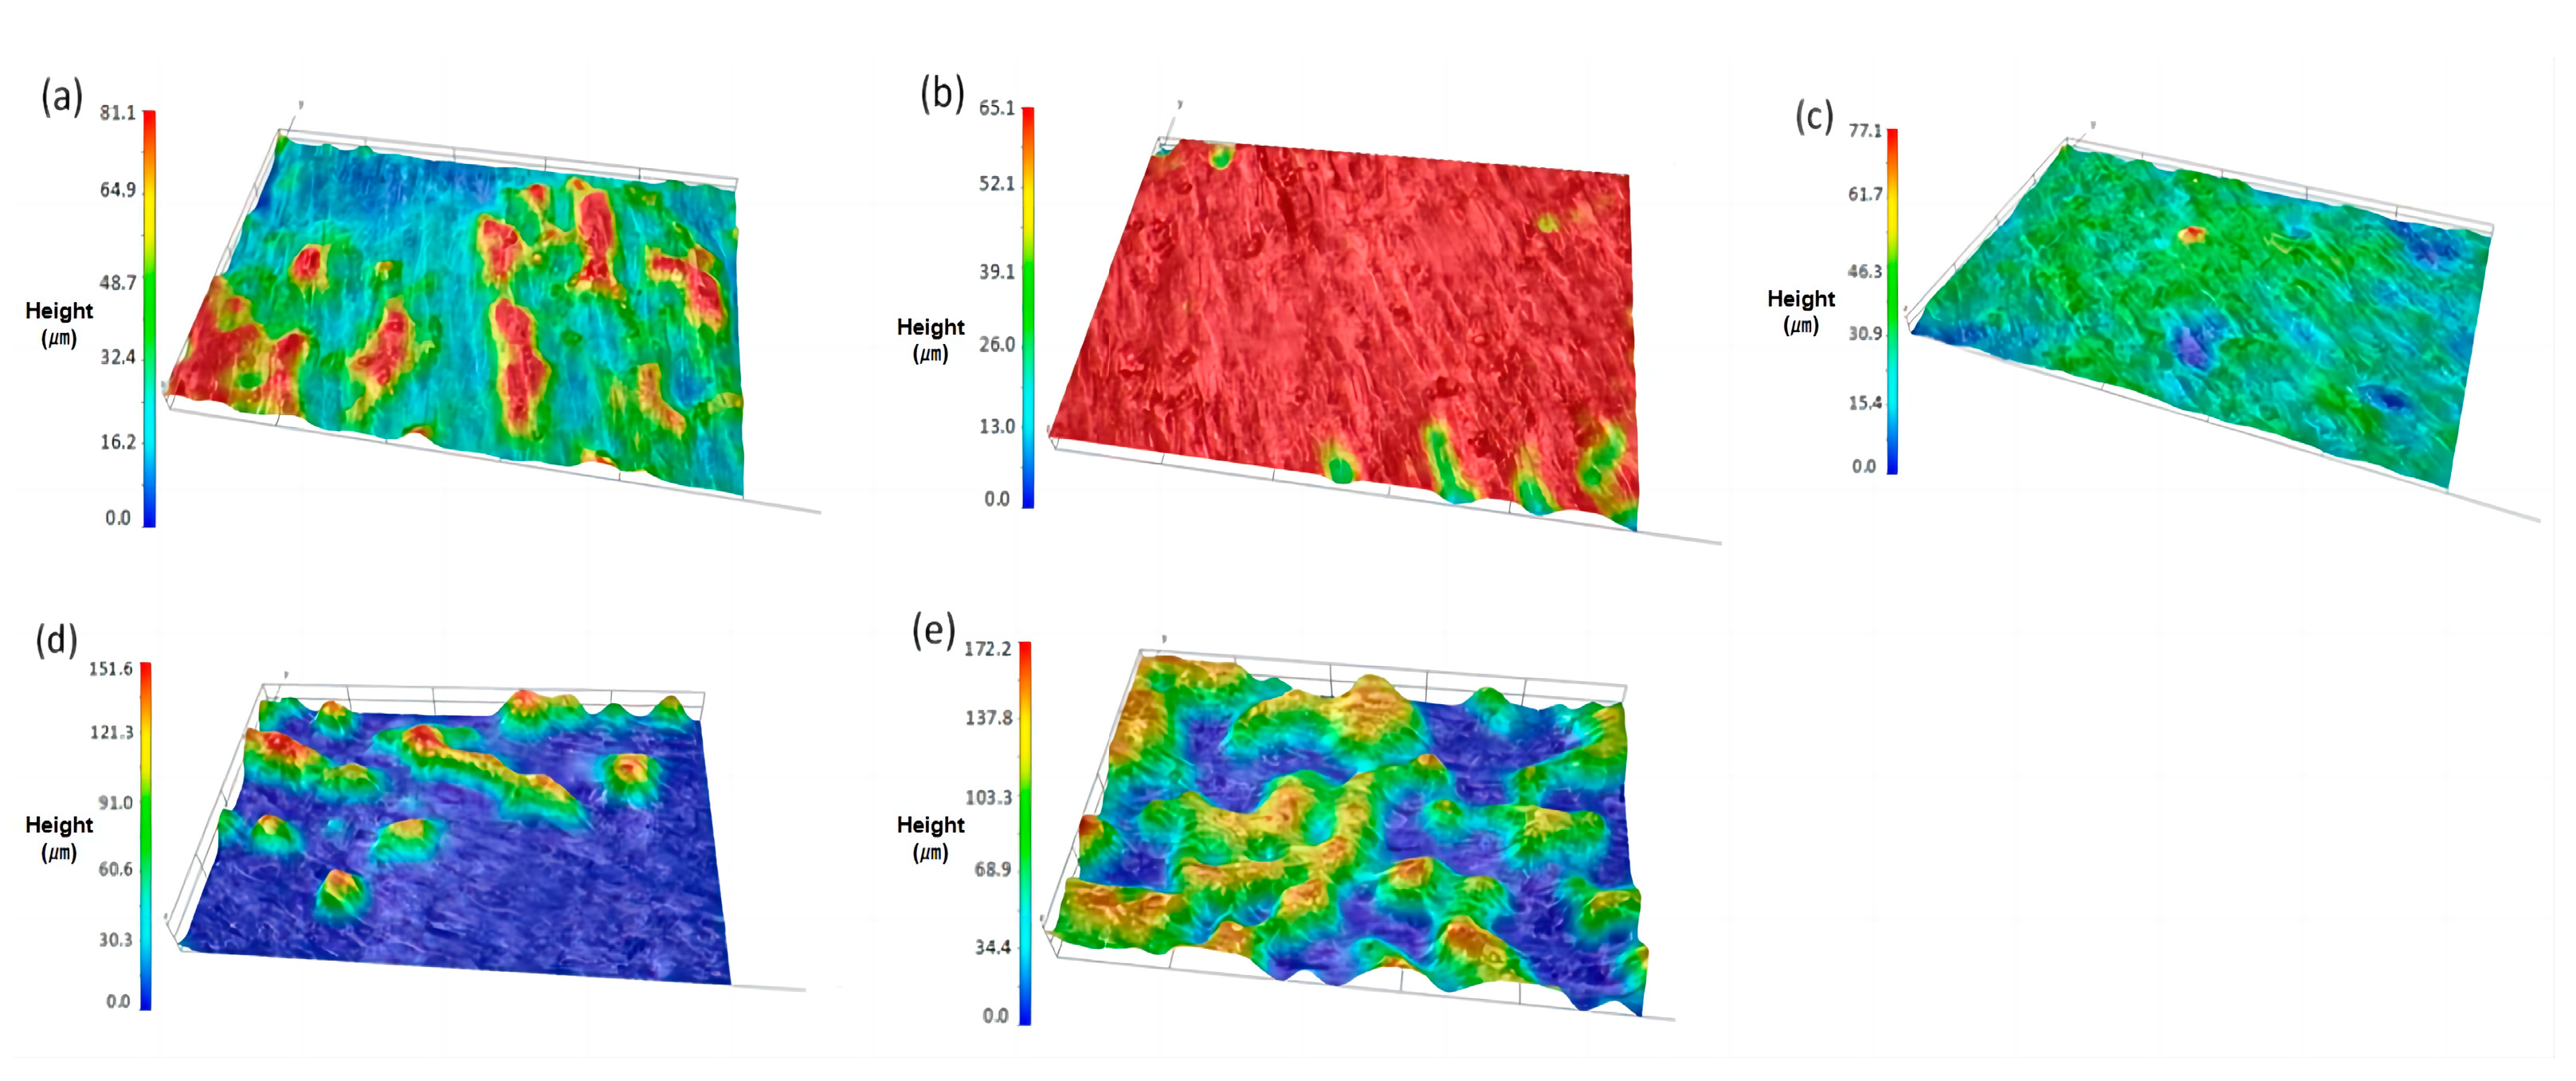
2.3.2. Surface Roughness

The main causes of the rough surface of SLM are spheroidization, powder sticking, splashing, etc. [29] According to the changeable nature of Gibbs free energy, the system will spontaneously tend toward the direction in which the free energy G decreases:
( d G ) T , P , n = γ d S
where G (J) is the Gibbs free energy, γ (N/m) is the surface tension, and S (m2) is the surface area of the liquid. It can be seen from the formula that G decreases, that is, d G < 0, while γ is generally a constant value; in order to satisfy the equation, it is necessary to reduce the surface area of the liquid. Generally, under the condition of constant volume, the spherical surface area is the smallest among all shapes, so the molten pool tends to be spherical. Powder sticking is mainly caused by the temperature gradient around the molten pool.
The splashing phenomenon is due to the evaporation of a small amount of liquid metal into the gas, and the recoil force brought by the metal vapor makes a part of the liquid metal splash into the air [30,31].

2.4. The Setting of Technological Parameters

Some 20 different settings of technological parameters were designed in this study, and these settings were applied in both numerical simulations and printing experiments, as listed in Table 4. In order to control the influence of other factors on the experimental results, each setting of technological parameters in the test was printed into sectors equal to the center of the substrate, and the 20 sectors formed a circle. Experiments were carried out at distances of 18 cm and 23 cm between the centers, and 50 melting channels were printed in each sector. As a key technological parameter, the input energy density E (J/mm3) can be expressed as follows:
E = P v h t
where P (W) is the laser power, v (mm/s) is the laser scanning speed, h (mm) is the laser scanning distance, and t (mm) is the layer thickness.
The selection range of parameter settings was based on the experience and a summary of historical research. The detection of porosity defects requires industrial CT for tomographic scanning of the molded parts. The detection of surface roughness was carried out with an ultra-depth-of-field microscope.

3. Results and Discussion

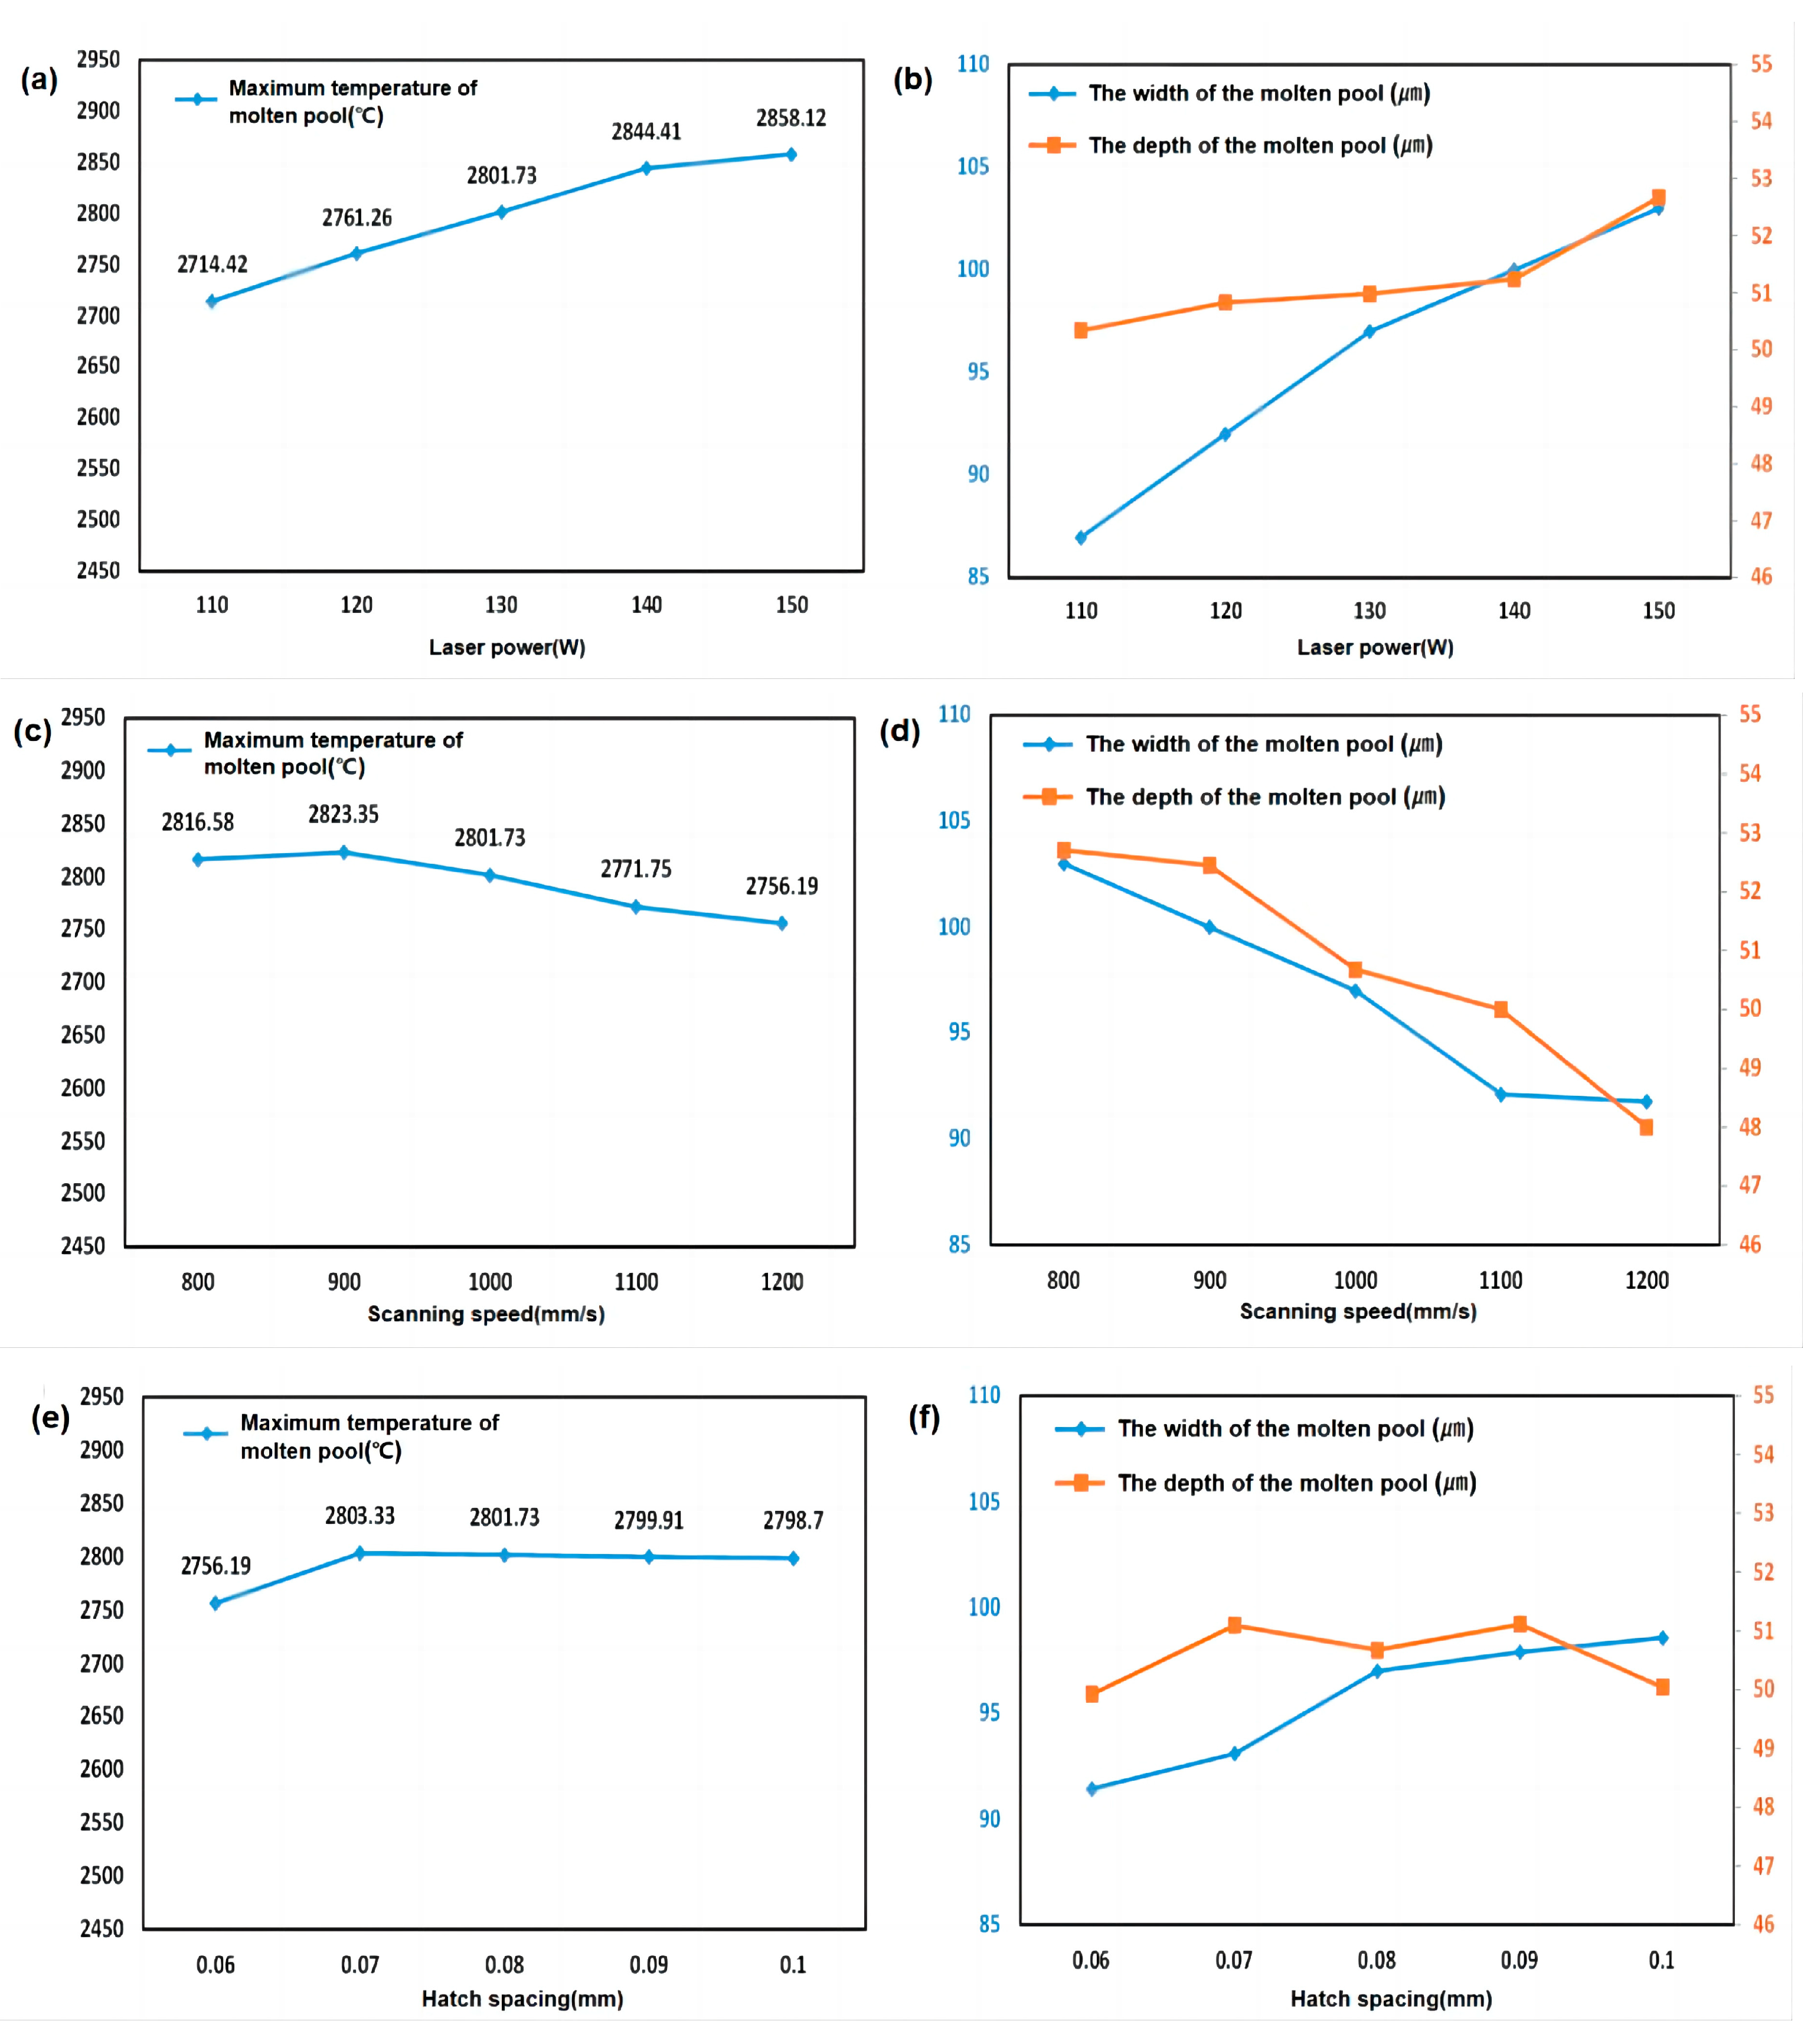
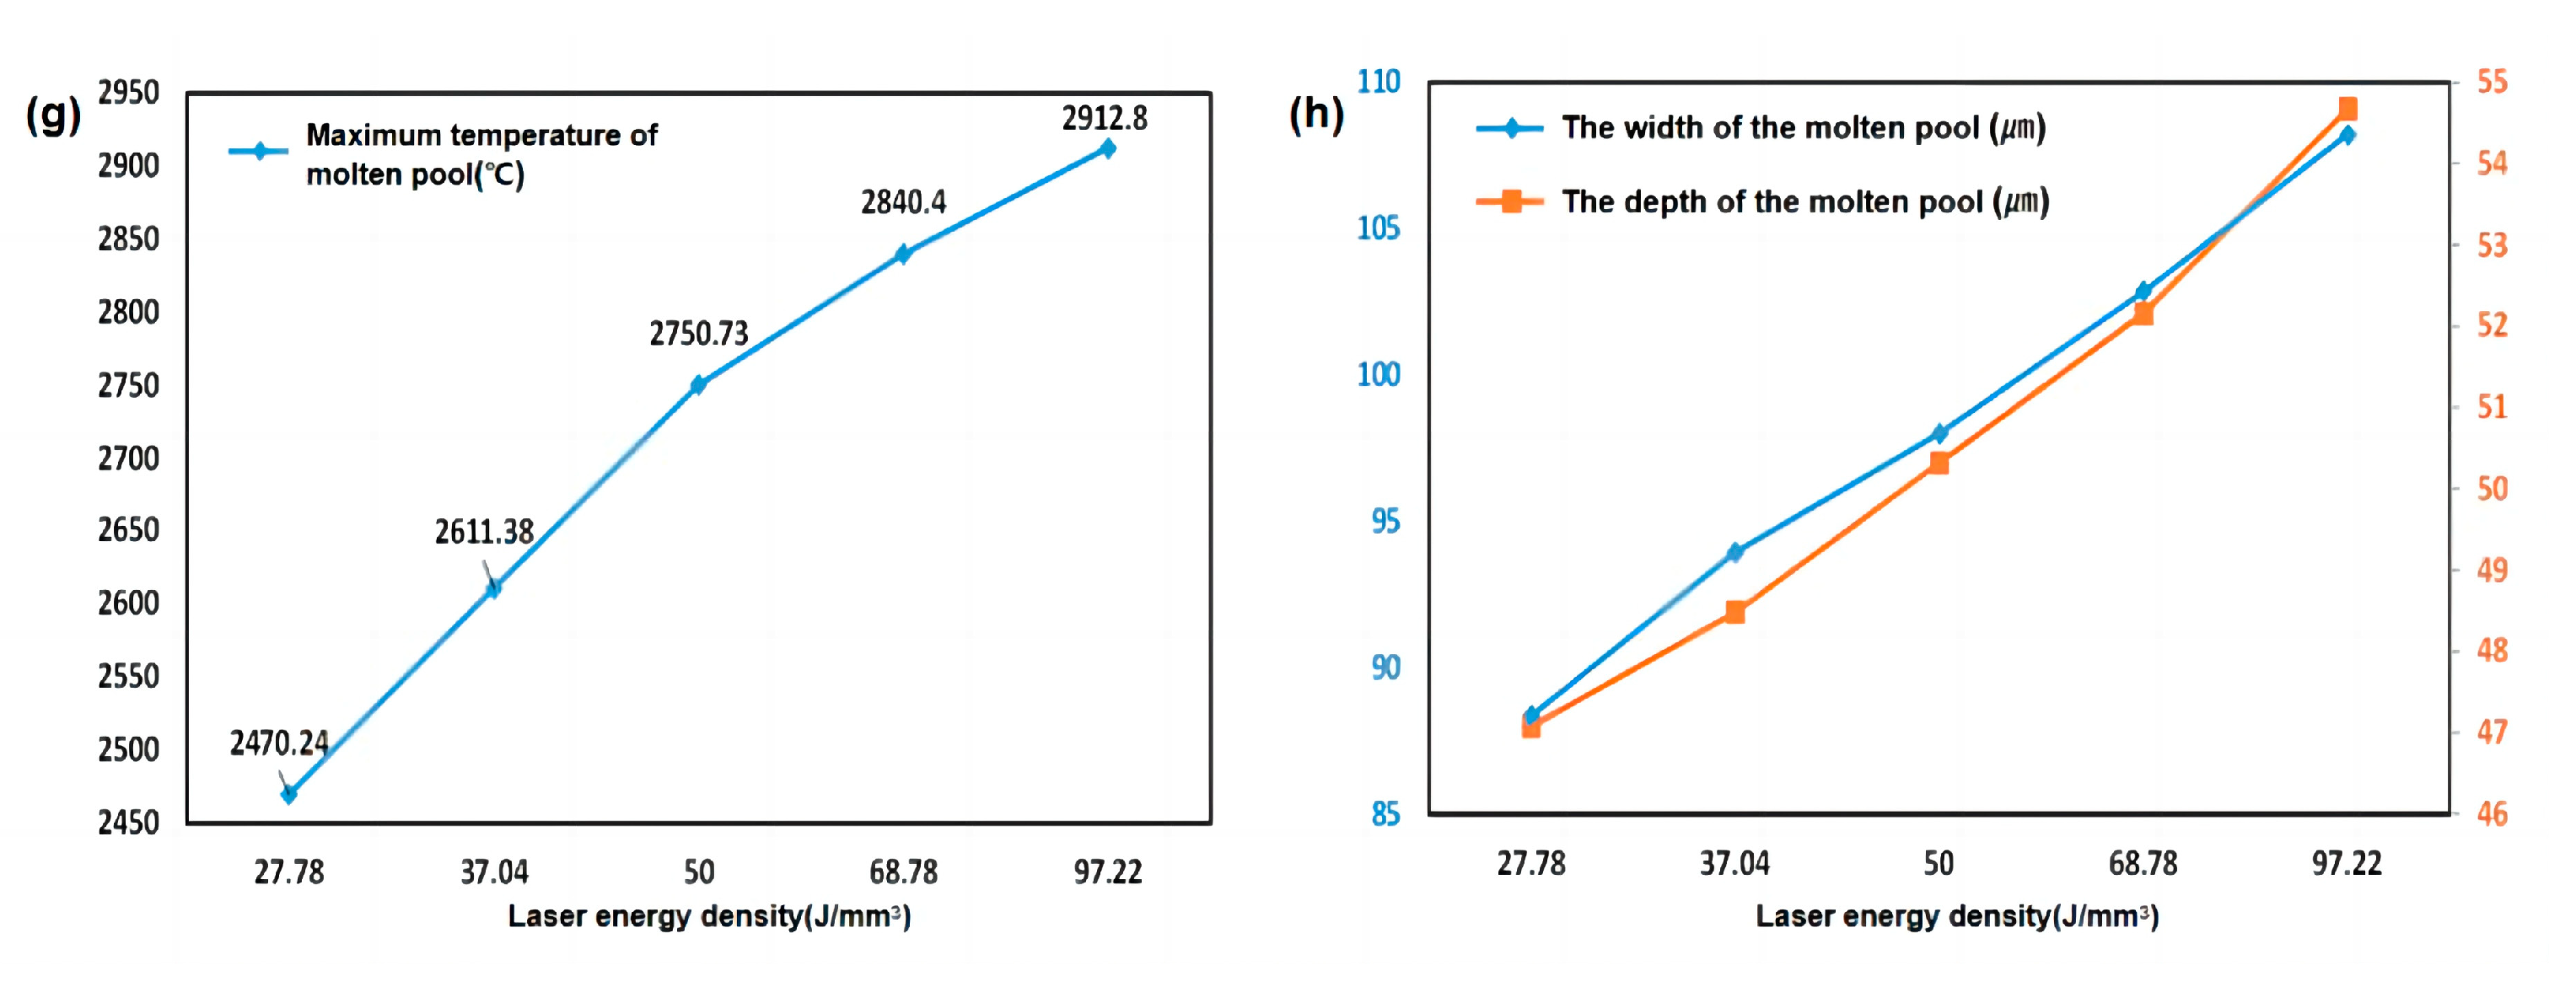
3.1. Parameter Influence on the Simulation Process

Numerical simulation can reveal the influence of typical technological parameters on the SLM process from the scale of the microscopic molten pool. In this study, the influence of different typical technological parameters was explored from three aspects: the maximum temperature, the depth and the width of the molten pool, which can effectively describe the state characteristics of the molten pool. The results of numerical simulation are shown in Figure 3. As can be seen from Figure 3, the temperature distribution from the center to the edge of the molten pool can be obtained through numerical simulation, and the size information of the molten pool can be obtained through the coordinate tool in the software.
It can be seen from Figure 4a that the maximum temperature of the molten pool has a roughly linear relationship with the laser power. As the laser power continues to increase, the increasing trend in the maximum temperature slows down. As shown in Figure 4b, the influence of laser power on the width of the molten pool is more obvious, and the influence on the depth of the molten pool is less. In Figure 4c,d, the scanning speed has no obvious effect on the maximum temperature, but a significant impact on the width and depth of the molten pool. With an increase in laser scanning speed, the size of the molten pool decreases proportionally. In Figure 4e,f, it can be found that the influence of hatch spacing on the temperature and size of the molten pool is not remarkable. It can be seen from Figure 4g,h that the energy density has a significant influence on the temperature in the central area of the molten pool. The size of the molten pool and the energy density show a linearly correlated trend.
Through the analysis of all the pictures in Figure 4, it can be found that different process parameters have different degrees of influence on SLM printing molding quality. Of the four process parameters, the most obvious influence on the molten pool is the laser power density, because this parameter can most intuitively indicate the size of the energy absorbed by the molten pool. Comparing Figure 4b,h, it can be found that the main difference between laser power and laser energy density lies in the influence on the longitudinal depth of the molten pool. The scanning speed mainly affects the size information of the molten pool. This shows that the laser energy density is a comprehensive representation of laser power and scanning speed, which is consistent with the definition of the laser power parameter. Among the four process parameters, hatch spacing has the least influence on the molten pool.
In order to verify the conclusion of numerical simulation, SLM-printed products with corresponding parameter settings were polished, and their microscopic morphology was observed under a metallographic microscope. The metallographic observations of laser power and scanning speed were chosen here because these two parameters can better validate the results of the numerical simulation in terms of temperature and dimensional information. The photographic accuracy of metallographic microscope is 20.0 µm/pixel.
As shown in Figure 5a, the pores in the metallographic observations are numerous and inconsistent in size, and there are still powder particles that are not completely melted. As the power gradually increases to 120 W, the number of pores decreases, and the overall cross-section is relatively smooth. However, when the power is further increased, the size of the molten pool is larger, and the phenomenon of excessive melting occurs, as shown in Figure 5d,e. The melting condition of the powder reflected in the metallographic observations corresponds to the temperature of the molten pool, and the average pore size corresponds to the size information of the molten pool. It can be found that the actual printing conditions are consistent with the numerical simulation results.
As shown in Figure 6, it can be found that with the increase in scanning speed, the average pore size will increase. The linearity of this size change is more obvious than in Figure 5. This is consistent with the conclusion of numerical simulation. As seen in Figure 6a,b, when the scanning speed is small, the molten pool absorbs sufficient energy, the forming cross-section is flat, and the powder can be firmly combined with the formed surface after melting and solidification, so the formed part has fewer pores. When the scanning speed is too large, the bonding between the adjacent molten pool is poor, the molten channel will be interrupted, and there are more cross-section pores.

3.2. Internal Quality of the Test Product

Industrial CT, which enables tomographic scanning of the molded parts, is adopted to detect porosity defects. As shown in Figure 7, the tomography of the SLM part requires a series of 2D images, and then reconstructs the 3D model. In order to control the influence of other factors on the experimental results, each group of process parameters in the test were printed into sectors equal in distance from the center of the substrate, and 20 sectors formed a circle. Experiments were carried out at distances of 18 cm and 23 cm from the center of the circle, and 50 molten channels were printed in each sector, with a total of 500 layers.
Figure 8 shows the results of the printing experiment regarding porosity, in which the horizontal coordinate is the designed technological parameter and the vertical coordinate is the average value of the porosity test results corresponding to the technological parameter.
It can be found in Figure 8a that as the laser power increases, the porosity decreases. According to the above analysis, when the laser power is high, deep penetration and the keyhole phenomenon will occur in the molten pool. Metal materials will splash, boil, and evaporate under high-energy laser beams, and the SLM forming process is unstable in this condition.
As shown in Figure 8b, the porosity of SLM-molded parts decreased slightly and then increased with the increase in scanning speed. When the scanning speed is too low, the pores are mainly caused by keyholes. The high-energy-density laser melts the powder material and vaporizes the molten pool metal, forming strip-shaped pores at the bottom of the molten pool. When the scanning speed increases, the porosity increases because the powder is not completely melted.
It can be seen from Figure 8c that with the increase in the hatch spacing, the porosity of the SLM product decreases first and then increases. When the hatch spacing is too small, the molten channel is excessively remelted, a large temperature gradient is formed inside the molten pool, and the porosity increases. When the hatch spacing is too large, the melting channel overlap rate is small, resulting in powder sticking and unmelted phenomena.
In Figure 8d, when the laser energy density is 27.78 J/mm3, the porosity has a maximum value of 30.5%, and the experimental error is large in this case because the state of the molten pool is unstable and the fluidity is poor. With the increase in laser energy density, the porosity is stable below 5%, which shows a steady downward trend.
It can be summarized that reasonably increasing laser power, reducing scanning speed, shortening the scanning interval, and increasing laser energy density can help reduce the porosity effectually.

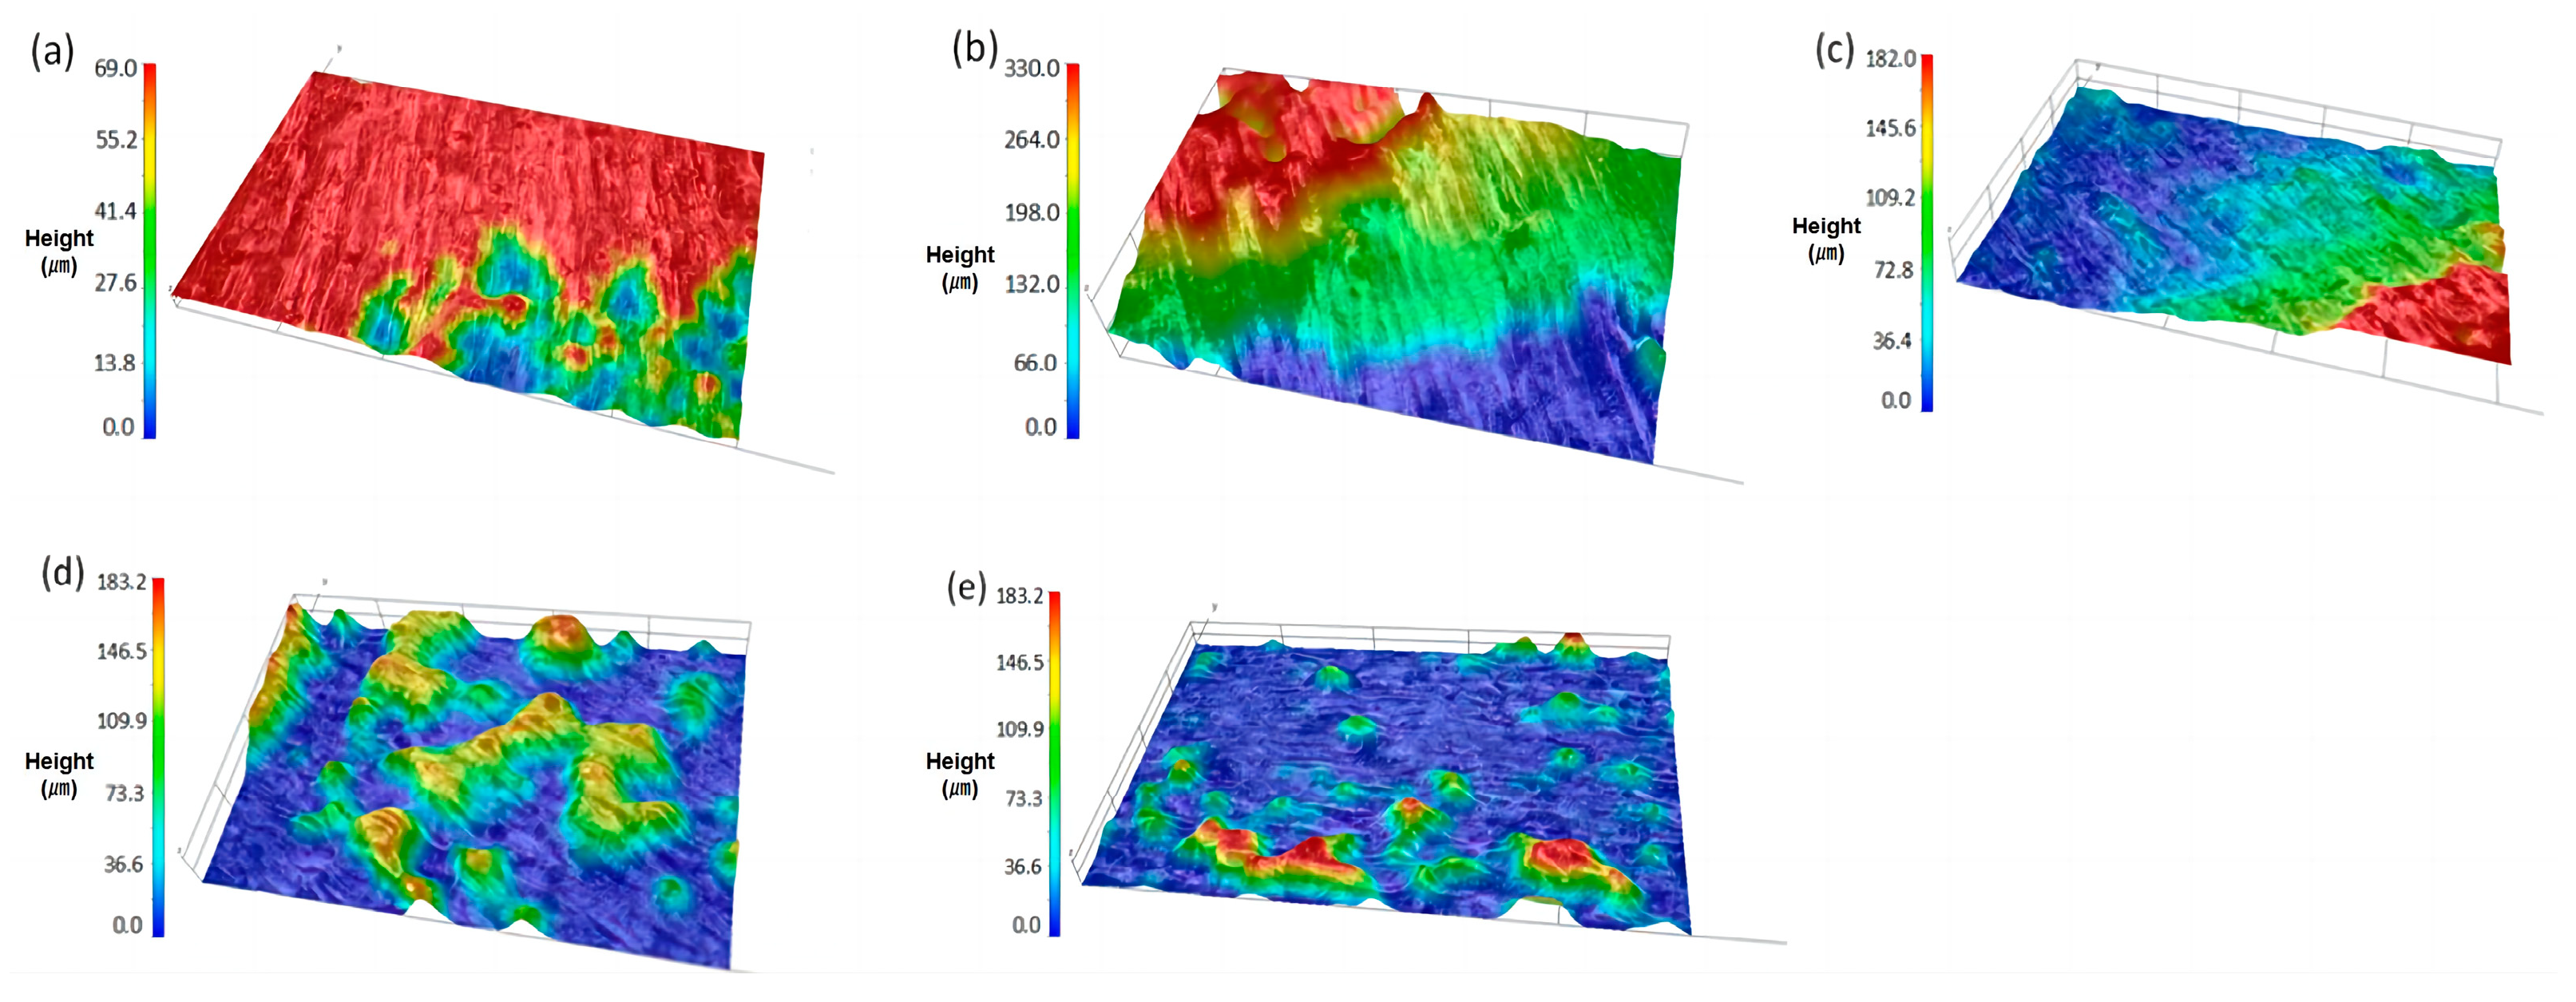
3.3. Surface Roughness of the Test Product

It can be seen in Figure 9 that when the laser power is 100 W, the surface of the forming part is relatively uneven. As the laser power increases to 130 W, the surface roughness decreases from 178 µm to 65 µm, and the surface gradually becomes flat. When the laser power is 120 W to 130 W, there are only a few bumps. When the laser power increases to 140 W, a concave area appears on the upper surface.
If the laser power becomes small, the overlap rate between the molten pools decreases. However, when the laser power reaches 140 W, the internal vaporization of the molten pool is obvious, and the recoil pressure of the gas is high.
In Figure 10, with the increase in the scanning speed, the surface roughness of the product fluctuates. When the scanning speed is 800 mm/s, there are more protrusions on the upper surface, and most of them can be distributed according to the melting channel. When the scanning speed is increased to 900 mm/s and 1000 mm/s, the surface is relatively flat, with only a few protrusions or depressions. As the scanning speed continues to increase, the liquid metal accumulates in the original place, and this may lead to several bulges.
In Figure 11, with the increase in the hatch spacing, the surface morphology of the forming part gradually remains unchanged, and the height difference increases. The overlapping rate of the melting channel decreases with the increase in hatch spacing, which results in intermittent melting channels.
It can be found in Figure 12 that the surface quality exhibits changes in volatility. When the energy of the laser beam is too low, some of the metal powder is not melted. The powder grains cause poor surface quality. When the laser energy density increases to 37.04 J/mm3, the laser beam energy is still not strong enough to completely melt the powder, and the phenomenon of powder sticking and spheroidization is more obvious. As the laser energy increases, the state of the molten pool is stable, and the surface roughness becomes better. When the laser power is too high, the internal movement of the molten pool is very violent, and the recoil pressure of the gas is strong. This makes the morphology of the molten channel uneven.

3.4. Discussion of Experimental Results

It is found that the laser energy density has the most significant influence on the molding quality of the product. The laser power mainly affects the temperature of the molten pool, and the most intuitive factor is the melting degree of the metal powder; when the power is small, it will melt insufficiently, and when the power is too large, it will melt excessively, which will cause the molding quality to deteriorate. The laser scanning speed mainly affects the size of the molten pool. The results of the metallographic observations and ultra-depth microscope observations both show that the scanning speed has a prominent effect on the pore size of the formed cross-section. This is because when the scanning speed is small, the powder has sufficient time to absorb energy, melting is more complete, and the cross-section is flat at this time. When the speed gradually increases, the size of the molten pool will decrease, and the connection probability of adjacent molten pools will decrease, resulting in the generation of large pores.
After comprehensive comparison, the most suitable parameter combination in this experiment was found to be laser power: 130 W, hatch spacing: 0.08 mm, and scanning speed: 1000 mm/s. Better product porosity and surface roughness can be obtained within this set of process parameters.
Limited to the experimental conditions and equipment, this study still has many shortcomings, being lacking in detailed mechanism analysis, tighter simulation and product integration, and more sophisticated detection methods. Future studies will try to explore the mechanism changes in the SLM process from more scales and angles.

4. Conclusions

In this study, the influence of typical technological parameters on the forming quality of products made with selective laser melting technology was studied. The technological process parameters mainly studied include laser power, hatch spacing, scanning speed, and laser energy density. Compared with previous studies, the experimental scheme design of this study is more comprehensive, and the numerical simulation and actual printing are combined to improve the reliability and interpretability of the results. The numerical simulation shows that the maximum temperature and size of the molten pool rise with the increase in laser power and go down with the increase in the scanning speed. However, the hatch spacing has little influence on the molten pool. The results of numerical simulation can be verified by observing the polished section of the product with a metallographic microscope. The printing experiment verified the conclusion of the numerical simulation. It also analyses the process of the influence of technological parameters on the surface and internal quality of SLM products. Both of these two methods show that the appropriate increase in laser power and laser energy density can significantly improve the forming quality, and that excessive input energy will result in bad surface quality. Additionally, scanning speed and hatch spacing mainly influence the lap rate of the molten pool. This research will contribute to research on the relationship between technological parameters, melting pool state, and forming defects. Additionally, it can provide an effective reference and basis for SLM product forming quality control in practice.

Author Contributions

Conceptualization, C.C.; methodology, T.Z.; validation, T.Z.; formal analysis, W.H.; investigation, W.H.; resources, W.W.; data curation, T.Z.; writing—original draft preparation, T.Z.; writing—review and editing, C.C.; supervision, C.C.; project administration, C.C.; funding acquisition, C.C. All authors have read and agreed to the published version of the manuscript.

Funding

This research was funded by Shenzhen Science and Technology Program, grant number JCYJ20210324135006016, and the Guangdong Basic and Applied Basic Research Foundation, grant number 2022A1515010345.

Data Availability Statement

Data is contained within the article.

Conflicts of Interest

The authors declare no conflict of interest.

References

  1. Cao, S.; Zhang, B.; Yang, Y.; Jia, Q.; Li, L.; Xin, S.; Wu, X.; Hu, Q.; Lim, C.V.S. On the role of cooling rate and temperature in forming twinned α’ martensite in Ti–6Al–4V. J. Alloys Compd. 2020, 813, 152247. [Google Scholar] [CrossRef]
  2. Suryawanshi, J.; Prashanth, K.G.; Scudino, S.; Eckert, J.; Prakash, O.; Ramamurty, U. Simultaneous enhancements of strength and toughness in an Al-12Si alloy synthesized using selective laser melting. Acta Mater. 2016, 115, 285–294. [Google Scholar] [CrossRef]
  3. Li, D.C.; Lu, Z.L.; Tian, X.Y.; Zhang, H.; Yang, C.C.; Cao, Y.; Miao, K.; Dichen, L.I.; Zhongliang, L.U.; Xiaoyong, T.; et al. Additive manufacturing—Revolutionary technology for leading aerospace manufacturing. Acta Aeronaut. Astronaut. Sin. 2022, 43, 15–31. [Google Scholar]
  4. Zhang, Y.; Zhang, W.; Wang, G. Discussion on the Technical Demands and Application Modes of Additive Manufacturing in Space. Mater. China 2017, 36, 503–511. [Google Scholar]
  5. Wang, Y.; Tan, Q.; Pu, F.; Boone, D.; Zhang, M. A Review of the Application of Additive Manufacturing in Prosthetic and Orthotic Clinics from a Biomechanical Perspective. Engineering 2020, 6, 1258–1266. [Google Scholar] [CrossRef]
  6. Zheng, Y. Microstructure and Mechanical Properties of TA1 Titanium Alloy Prepared by Selective Laser Melting. Powder Metall. Ind. 2022, 1, 50–54. [Google Scholar]
  7. Dong, S.Y.; Yan, S.X.; Feng, X.Y.; Li, Y.J.; Chen, S.Y. Research Status of Steel Powder Material for Laser Additive Manufacturing. Laser Optoelectron. Prog. 2018, 55, 011407. [Google Scholar] [CrossRef]
  8. Han, G.L.; Shi, W.T.; Han, Y.F.; Liu, Y.D. Study on surface quality of TC4 alloy formed by selective laser melting based on single—Track experiment. Laser J. 2021, 42, 163–169. [Google Scholar] [CrossRef]
  9. An, C.; Zhang, Y.M.; Zhang, J.S. The Research of Influence of Selective Laser Melting Process Parameters on Density and Surface Roughness of Co-Cr Alloy Molding Parts. Appl. Laser 2018, 38, 328–333. [Google Scholar] [CrossRef]
  10. Wang, W.H.; Liu, X.Y.; Pan, L. Effect of Linear Energy Density on Bubble-Defect of 316L Stainless Steel by Selective Laser Melting. Key Eng. Mater. 2019, 803, 32–36. [Google Scholar] [CrossRef]
  11. Larimian, T.; Kannan, M.; Grzesiak, D.; AlMangour, B.; Borkar, T. Effect of energy density and scanning strategy on densification, microstructure and mechanical properties of 316L stainless steel processed via selective laser melting. Mater. Sci. Eng. A-Struct. Mater. Prop. Microstruct. Process. 2020, 770, 138455. [Google Scholar] [CrossRef]
  12. Ben Slama, M.; Chatti, S.; Kolsi, L. Effect of processing parameters on porosity defects during SLM: A DOE-FEM approach. Weld. World 2023, 67, 2201–2213. [Google Scholar] [CrossRef]
  13. Qu, R.; Huang, L.; Xiao, D. Numerical simulation of melt pool evolution and metal spattering characterization during selective laser melting processing. Acta Aeronaut. Astronaut. Sin. 2022, 43, 398–417. [Google Scholar] [CrossRef]
  14. Hu, B.; Cai, G.; Fu, J.; Xin, Y.; Liu, K.; Lang, L. Investigation on granular medium forming formability of TA1 titanium alloy cylinder-shaped parts. Int. J. Adv. Manuf. Technol. 2021, 118, 1933–1940. [Google Scholar] [CrossRef]
  15. Li, Y.; Gu, D. Thermal behavior during selective laser melting of commercially pure titanium powder: Numerical simulation and experimental study. Addit. Manuf. 2014, 1–4, 99–109. [Google Scholar] [CrossRef]
  16. Ni, C.Y.; Zhang, C.D.; Liu, T.T.; Liao, W.H. Deformation Prediction of Metal Selective Laser Melting Based on Inherent Strain Method. Chin. J. Lasers-Zhongguo Jiguang 2018, 45, 0702004. [Google Scholar] [CrossRef]
  17. Du, L.; Ke, L.D.; Sun, J.L.; Xiao, M.L.; Zhang, X.L. Research on Thermal Behavior and Forming Quality of Selective Laser Melted Ti-6A1-4V Titanium Alloy. Hot Work. Technol. 2021, 50, 41–46. [Google Scholar] [CrossRef]
  18. Wang, Y.F.; Ji, X.; Liang, Y.S. Simulation of Temperature Field in Selective Laser Melting Considering Melt Pool Flow Effect. Appl. Laser 2022, 42, 30–43. [Google Scholar] [CrossRef]
  19. Tolochko, N.K.; Arshinov, M.K.; Gusarov, A.V.; Titov, V.I.; Laoui, T.; Froyen, L. Mechanisms of selective laser sintering and heat transfer in Ti powder. Rapid Prototyp. J. 2003, 9, 314–326. [Google Scholar] [CrossRef]
  20. Guan, J.J. Relationship of Element Size and Precision With Gauss Heat Source. J. Liaoning Univ. Pet. & Chem. Technol. 2009, 29, 50–53. [Google Scholar]
  21. Zhang, J.Z.; Xiong, H.G.; Yang, X. Numerical Simulation on Plate Butt Welding Based on Moving Gaussian Heat Source. Hot Work. Technol. 2013, 42, 163–165. [Google Scholar] [CrossRef]
  22. Dong, K.Q.; Liu, C.Y.; Chen, Y.J. Loading arithmetic research of gauss heat source model in ANSYS welding simulation. Mach. Des. Manuf. 2007, 2, 83–85. [Google Scholar] [CrossRef]
  23. Li, L.; Yan, L.; Cui, W.; Chen, Y.; Pan, T.; Zhang, X.; Flood, A.; Liou, F. Predictive Model for Thermal and Stress Field in Selective Laser Melting Process—Part I. Procedia Manuf. 2019, 39, 539–546. [Google Scholar] [CrossRef]
  24. Parida, R.P.; Senthilkumar, V. Experimental studies of defect generation in selective laser melted Inconel 718 alloy. In Proceedings of the 2nd International Conference on Recent Trends in Metallurgy, Materials Science and Manufacturing (IMME), Tiruchirappalli, India, 27–28 December 2019; pp. 1372–1377. [Google Scholar]
  25. Peng, T.; Chen, C. Influence of Energy Density on Energy Demand and Porosity of 316L Stainless Steel Fabricated by Selective Laser Melting. Int. J. Precis. Eng. Manuf. Green Technol. 2018, 5, 55–62. [Google Scholar] [CrossRef]
  26. Yang, J.J.; Han, J.; Yu, H.C.; Yin, J.; Gao, M.; Wang, Z.M.; Zeng, X.Y. Role of molten pool mode on formability, microstructure and mechanical properties of selective laser melted Ti-6A1-4V alloy. Mater. Des. 2016, 110, 558–570. [Google Scholar] [CrossRef]
  27. Wang, Z.Q.; Wang, X.D.; Xie, R.K.; Zhou, X.; Zhang, P.Y.; Li, Q.L. Pore Defects of Inconel 718 Alloy Fabricated by Selective Laser Melting. Surf. Technol. 2020, 49, 378–385. [Google Scholar]
  28. Yang, K.V.; Rometsch, P.; Jarvis, T.; Rao, J.; Cao, S.; Davies, C.; Wu, X.H. Porosity formation mechanisms and fatigue response in Al-Si-Mg alloys made by selective laser melting. Mater. Sci. Eng. A-Struct. Mater. Prop. Microstruct. Process. 2018, 712, 166–174. [Google Scholar] [CrossRef]
  29. Jin, X.; Lan, L.; He, B.; Zhu, A.; Gao, S. A Review on Surface Roughness of Metals Parts Fabricated by Selective Laser Melting. Mater. Rev. 2021, 35, 03168–03175. [Google Scholar]
  30. Zhang, X.; Dong, A.; Du, D.; Pan, Y.; Xiong, L.; Kong, Y.; Sun, B. Effect of SLM process parameters on microscopic defects and surface quality of GH3536 superalloy. J. Aeronaut. Mater. 2022, 42, 71–80. [Google Scholar]
  31. Wang, D.; Ye, G.Z.; Dou, W.H.; Zhang, M.K.; Yang, Y.Q.; Mai, S.Z.; Liu, Y. Influence of spatter particles contamination on densification behavior and tensile properties of CoCrW manufactured by selective laser melting. Opt. Laser Technol. 2020, 121, 105678. [Google Scholar] [CrossRef]
Figure 1. The research framework of this study.
Metals 13 01971 g001
Figure 2. The flow chart of numerical simulation.
Metals 13 01971 g002
Figure 3. Distribution of temperature field in SLM numerical simulation.
Metals 13 01971 g003
Figure 4. Simulation results of different laser power (in (a,b)), scanning speed (in (c,d)), hatch spacing (in (e,f)), and laser energy density (in (g,h)).
Metals 13 01971 g004aMetals 13 01971 g004b
Figure 5. Metallographic observations of different laser powers: (a) P = 100 W, (b) P = 110 W, (c) P = 120 W, (d) P = 130 W, (e) P = 140 W.
Metals 13 01971 g005
Figure 6. Metallographic observations of different scanning speeds: (a) V = 800 mm/s, (b) V = 900 mm/s, (c) V = 1000 mm/s, (d) V = 1100 mm/s, (e) V = 1200 mm/s.
Metals 13 01971 g006
Figure 7. (a) SLM product; (b) CT scanning of the test product.
Metals 13 01971 g007
Figure 8. Porosity of test products with different: (a) laser powers, (b) scanning speeds, (c) hatch spacing, (d) laser energy density.
Metals 13 01971 g008
Figure 9. Surface topography of products with different laser powers: (a) P = 100 W, (b) P = 110 W, (c) P = 120 W, (d) P = 130 W, (e) P = 140 W.
Metals 13 01971 g009
Figure 10. Surface topography of products with different scanning speeds: (a) V = 800 mm/s, (b) V = 900 mm/s, (c) V = 1000 mm/s, (d) V = 1100 mm/s, (e) V = 1200 mm/s.
Metals 13 01971 g010
Figure 11. Surface topography of products with different hatch spacing: (a) H = 0.06 mm, (b) H = 0.07 mm, (c) H = 0.08 mm, (d) H = 0.09 mm, (e) H = 0.10 mm.
Metals 13 01971 g011
Figure 12. Surface topography of products with different laser energy density: (a) E = 27.78 J/mm3, (b) E = 37.04 J/mm3, (c) E = 50 J/mm3, (d) E = 68.78 J/mm3, (e) E = 97.22 J/mm3.
Metals 13 01971 g012
Table 1. Composition of TA1 material.
ElementProportion (%)
Fe0.033
Ti99.952
C0.013
H0.002
Table 2. Particle diameter distribution of TA1 material.
Proportion (%)Particle Diameter (μm)
D1020.2
D5034.6
D9056.0
Table 3. Physical and thermal properties of TA1 material [15].
PropertiesValue
Density4540 kg/m3
Melting point1667 °C
Latent heat of fusion2.95 × 105 J/kg
Latent heat of evaporation8.878 × 106 J/kg
Surface tension coefficient1.525 N/m
Table 4. Parameter setting table.
Laser Power
(W)
Scanning Speed
(mm/s)
Hatch Spacing
(mm)
Laser Energy Density
(J/mm3)
110010000.0841.67
211010000.0845.83
312010000.0850
413010000.0854.17
514010000.0858.33
61208000.0862.5
812010000.0850
912011000.0845.45
1012012000.0841.67
1112010000.0666.67
1212010000.0757.14
1312010000.0850
1412010000.0944.44
1512010000.1040
1610012000.1027.78
1711011000.0937.04
1812010000.0850
191309000.0768.78
201408000.0697.22
Disclaimer/Publisher’s Note: The statements, opinions and data contained in all publications are solely those of the individual author(s) and contributor(s) and not of MDPI and/or the editor(s). MDPI and/or the editor(s) disclaim responsibility for any injury to people or property resulting from any ideas, methods, instructions or products referred to in the content.

