Article

Effect of Acetate on Microbiologically Influenced Corrosion of Internal Pipeline Surfaces

by
Mohamed Riyadh Ismail
*,
Mokhtar Che Ismail
and
Syed Zulfiqar Hussain Shah
Department of Mechanical Engineering, Universiti Teknologi Petronas, Seri Iskandar 32610, Perak Darul Ridzuan, Malaysia
*
Author to whom correspondence should be addressed.
Metals 2023, 13(12), 1974; https://doi.org/10.3390/met13121974
Submission received: 29 June 2023 / Revised: 10 August 2023 / Accepted: 14 August 2023 / Published: 4 December 2023

Abstract

:
Microbiologically influenced corrosion (MIC) is a serious threat to the integrity of crude oil pipelines. Sulphate-reducing bacteria (SRB) are the primary microorganisms responsible for MIC, and their aggressiveness is dependent on the energy source available to them. Acetate, a common energy source, has been shown to accelerate the corrosion of carbon steel in the presence of SRB. This study investigated the effect of acetate on the growth of SRB and the corrosion of carbon steel plates in simulated anaerobic conditions. The corrosion kinetics were studied using linear polarization resistance (LPR) and weight loss immersion tests for 42 days. The samples were characterized using Scanning Electron Microscopy (SEM) and Energy-Dispersive X-ray Spectroscopy (EDX). The results show that the addition of acetate to cultured media significantly increased the corrosion rate of carbon steel plates in both formation water and Postgate Medium B (PMB). This was due to increased growth of SRB in the presence of acetate, which led to the production of more corrosive hydrogen sulphide (H2S). The findings based on experimental data obtained from this study confirm that acetate can accelerate the corrosion of carbon steel in the presence of SRB.

1. Introduction

Microbiologically influenced corrosion (MIC) is a phenomenon that is induced and accelerated by microorganism activity [1]. It is estimated that MIC is responsible for 40% of the internal corrosion observed in pipelines, making it one of the most severe corrosion problems faced by the oil and gas industry [2]. The presence of carbon dioxide (CO2) and hydrogen sulphide (H2S) gases exacerbates this corrosion [3]. SRB, which are commonly found in anaerobic environments in pipelines, are the main species leading to MIC [4]. SRB grow by utilizing nutrients from oilfield water [5]. As heterotrophic organisms, SRB utilize carbon from organic substances and generate H2S [6]. During aerobic respiration, SRB use sulphate as the terminal electron acceptor, turning hydrogen sulphide (H2S) into a byproduct. [7].
Hydrogen sulphide is a colourless and highly toxic gas with a distinctive smell of rotten eggs [8]. H2S is a product of both biological and abiotic processes produced by SRB and causes corrosion by releasing aggressive substances such as sulphide into the environment, destroying the protective layer of steel, forming deposits, and stimulating the cathodic process [9,10]. Additionally, the growth rate of SRB is attributed to the reduction in the dissolved iron concentration caused by the reaction of hydrogen sulphide followed by the precipitation of iron sulphide. [11]. The gas dissolves to form a weak acid within the system, dissolving steel to produce iron sulphide (FeS) and hydrogen molecules as a corrosion byproduct. In an environment rich in hydrogen sulphide, the production of insoluble FeS by SRB can create a galvanic cell with steel as the anode, resulting in localized damage as the anode dissolves [12]. The toxic and corrosive nature of H2S poses a significant concern in the oil and gas industry [13]. The detrimental effects of this phenomenon include pipeline damage, structural degradation, and potential hazards to worker safety.
The organic compound acetate (C2H3O2) is classified under the functional group of carboxylates [14]. Acetate is the conjugate base of acetic acid, resulting from the loss of a proton (H+) [15]. Acetate is a significant component in several biological processes and serves as a source of energy for organisms, including bacteria [16]. The presence of acetate as an organic compound in pipelines through a process known as the hydrolysis of acetic acid supports the growth of SRB [17]. The growth of SRB in pipelines can produce more H2S, leading to the degradation of pipeline materials, mainly carbon steel [18,19]. According to the literature, when acetate is present, key genes involved in the metabolism of SRB are activated [20]. Another research work investigated the result of using different carbon sources on the growth and activity of SRB [19].
SRB and acetate metabolism are shown in Figure 1 below, where acetate enters the SRB cell when it undergoes metabolism. SRB possess a transportation mechanism that facilitates the uptake of acetate from the surrounding environment [21]. Acetate is capable of penetrating the bacterial cell through transport proteins or via diffusion across the cell membrane [22]. Acetyl-CoA synthesis activates acetateithin in the bacterial cell [23]. Acetyl-CoA is a pivotal molecule in cellular metabolism and functions as a substrate for acetate entry into various metabolic pathways [24]. The acetyl-CoA obtained from acetate metabolism undergoes entry into the Krebs cycle, also referred to as the citric acid cycle [25]. This cycle comprises a sequence of biochemical reactions within the cell’s mitochondria or cytoplasm [24]. In this cycle, acetyl-CoA is oxidized to produce the reducing equivalents Nicotinamide Adenine Dinucleotide + Hydrogen (NADH) and an Adenosine Triphosphate (ATP) molecule [26]. SRB employ the reduction reactions produced in the citric acid cycle or the reduction of sulphate ions [27]. The reduction process comprises multiple enzymatic reactions by particular enzymes within the bacterial cell. The transfer of reducing equivalents occurs towards the sulphate molecule, leading to the generation of H2S. However, it is important to note that the findings of this research remain unknown and not proven, as they have not been published or made available to the scientific community for validation.
This research study contributes to the engineering field by exploring the intricate mechanism of MIC of carbon steel under anaerobic conditions. It specifically focuses on the significance of SRB in MIC and the utilization of acetate as a carbon source for SRB metabolism. The study provides a comprehensive analysis of the interactions between SRB, acetate, and corrosion in the oil and gas industry. The findings of this study contribute novel insights into microbiological corrosion mechanisms and the intricate interactions between bacteria, organic compounds, and pipeline materials. This understanding can be effectively applied in the development of corrosion control strategies that specifically target the problem areas.
The remaining paper structure is organized as follows. Experimental details are discussed through related work in Section 2. Section 3 presents the results obtained from an experiment that was conducted. Section 4 presents the discussion, and Section 5 provides the conclusions.

2. Experimental Details

Two experiments were conducted, designated as Case A and Case B. The Case A set-up involved carbon steel coupons in formation water with 3% NaCl to simulate the condition in a pipeline environment. Case B used Postgate Medium B (PMB), which is commonly used in laboratory media to support the growth of SRB. Using both set-ups allowed us to gain a better understanding of the role of acetate and SRB activity in MIC.

2.1. Material

A carbon steel plate of A283 Grade C was used, whose chemical composition and physical properties are presented in Table 1 [28] and Table 2 [29,30]. The SEM image of carbon steel A283 Grade C as received is shown in Figure 2.

2.2. Test Matrix and Solution Preparation

Case A represents the corrosion of carbon steel in simulated formation water with 3% NaCl and saturated CO2. In contrast, Case B represents the corrosion of carbon steel in Postgate Medium B and formation water with 3% NaCl and saturated CO2. In both cases, the presence of acetate and SRB was investigated. The details of the Case A and B tests are summarized in Table 3.

2.2.1. Preparation of Formation Water

Test solutions were prepared based on the ASTM Standard Specification for Replacement Ocean Water D 1141-98 [31], which provides guidelines for accurately replicating the composition and properties of natural oceanic conditions. The solution was purged and saturated with carbon dioxide, resulting in a pH of 3.7. The autogenous pH of the solution was adjusted to be between 7.5 and 8.4 using sodium hydroxide, NaOH, and hydrochloric acid, HCl. This precise pH calibration procedure guarantees that the test solution emulates the pH parameters observed in marine environments, enabling precise and dependable experimentation within the oil and gas sector.

2.2.2. Preparation of Postgate Medium B (PMB) Solution

Postgate Medium B comprises various essential components carefully selected to meet the nutritional requirement of SRB and is utilized to promote the growth of SRB [32]. Postgate Medium B [33] contains 3.5 g/L sodium lactate, 2.0 g/L magnesium sulphate heptahydrate, 1.0 g/L ammonium chloride, 1.0 g/L yeast extract, 0.5 g/L potassium phosphate, 0.5 g/L iron (II) sulphate heptahydrate, 0.1 g/L ascorbic acid, and of 0.1 g/L thioglycolic acid. The chemical was mixed with 1 L of distilled water and stirred. The pH was altered to 7 using concentrated sodium hydroxide, and the solution was then sterilized in an autoclave for 3 h.

2.2.3. Preparation of Acetate Buffer

To produce 0.1 M acetate buffer at pH 7, 5.772 g of sodium acetate was added into 800 mL of distilled water. Then, 1.778 g of acetic acid was added to the solution. By using NaOH, the pH value was adjusted, and distilled water was added to reach a volume of 1 L [34].

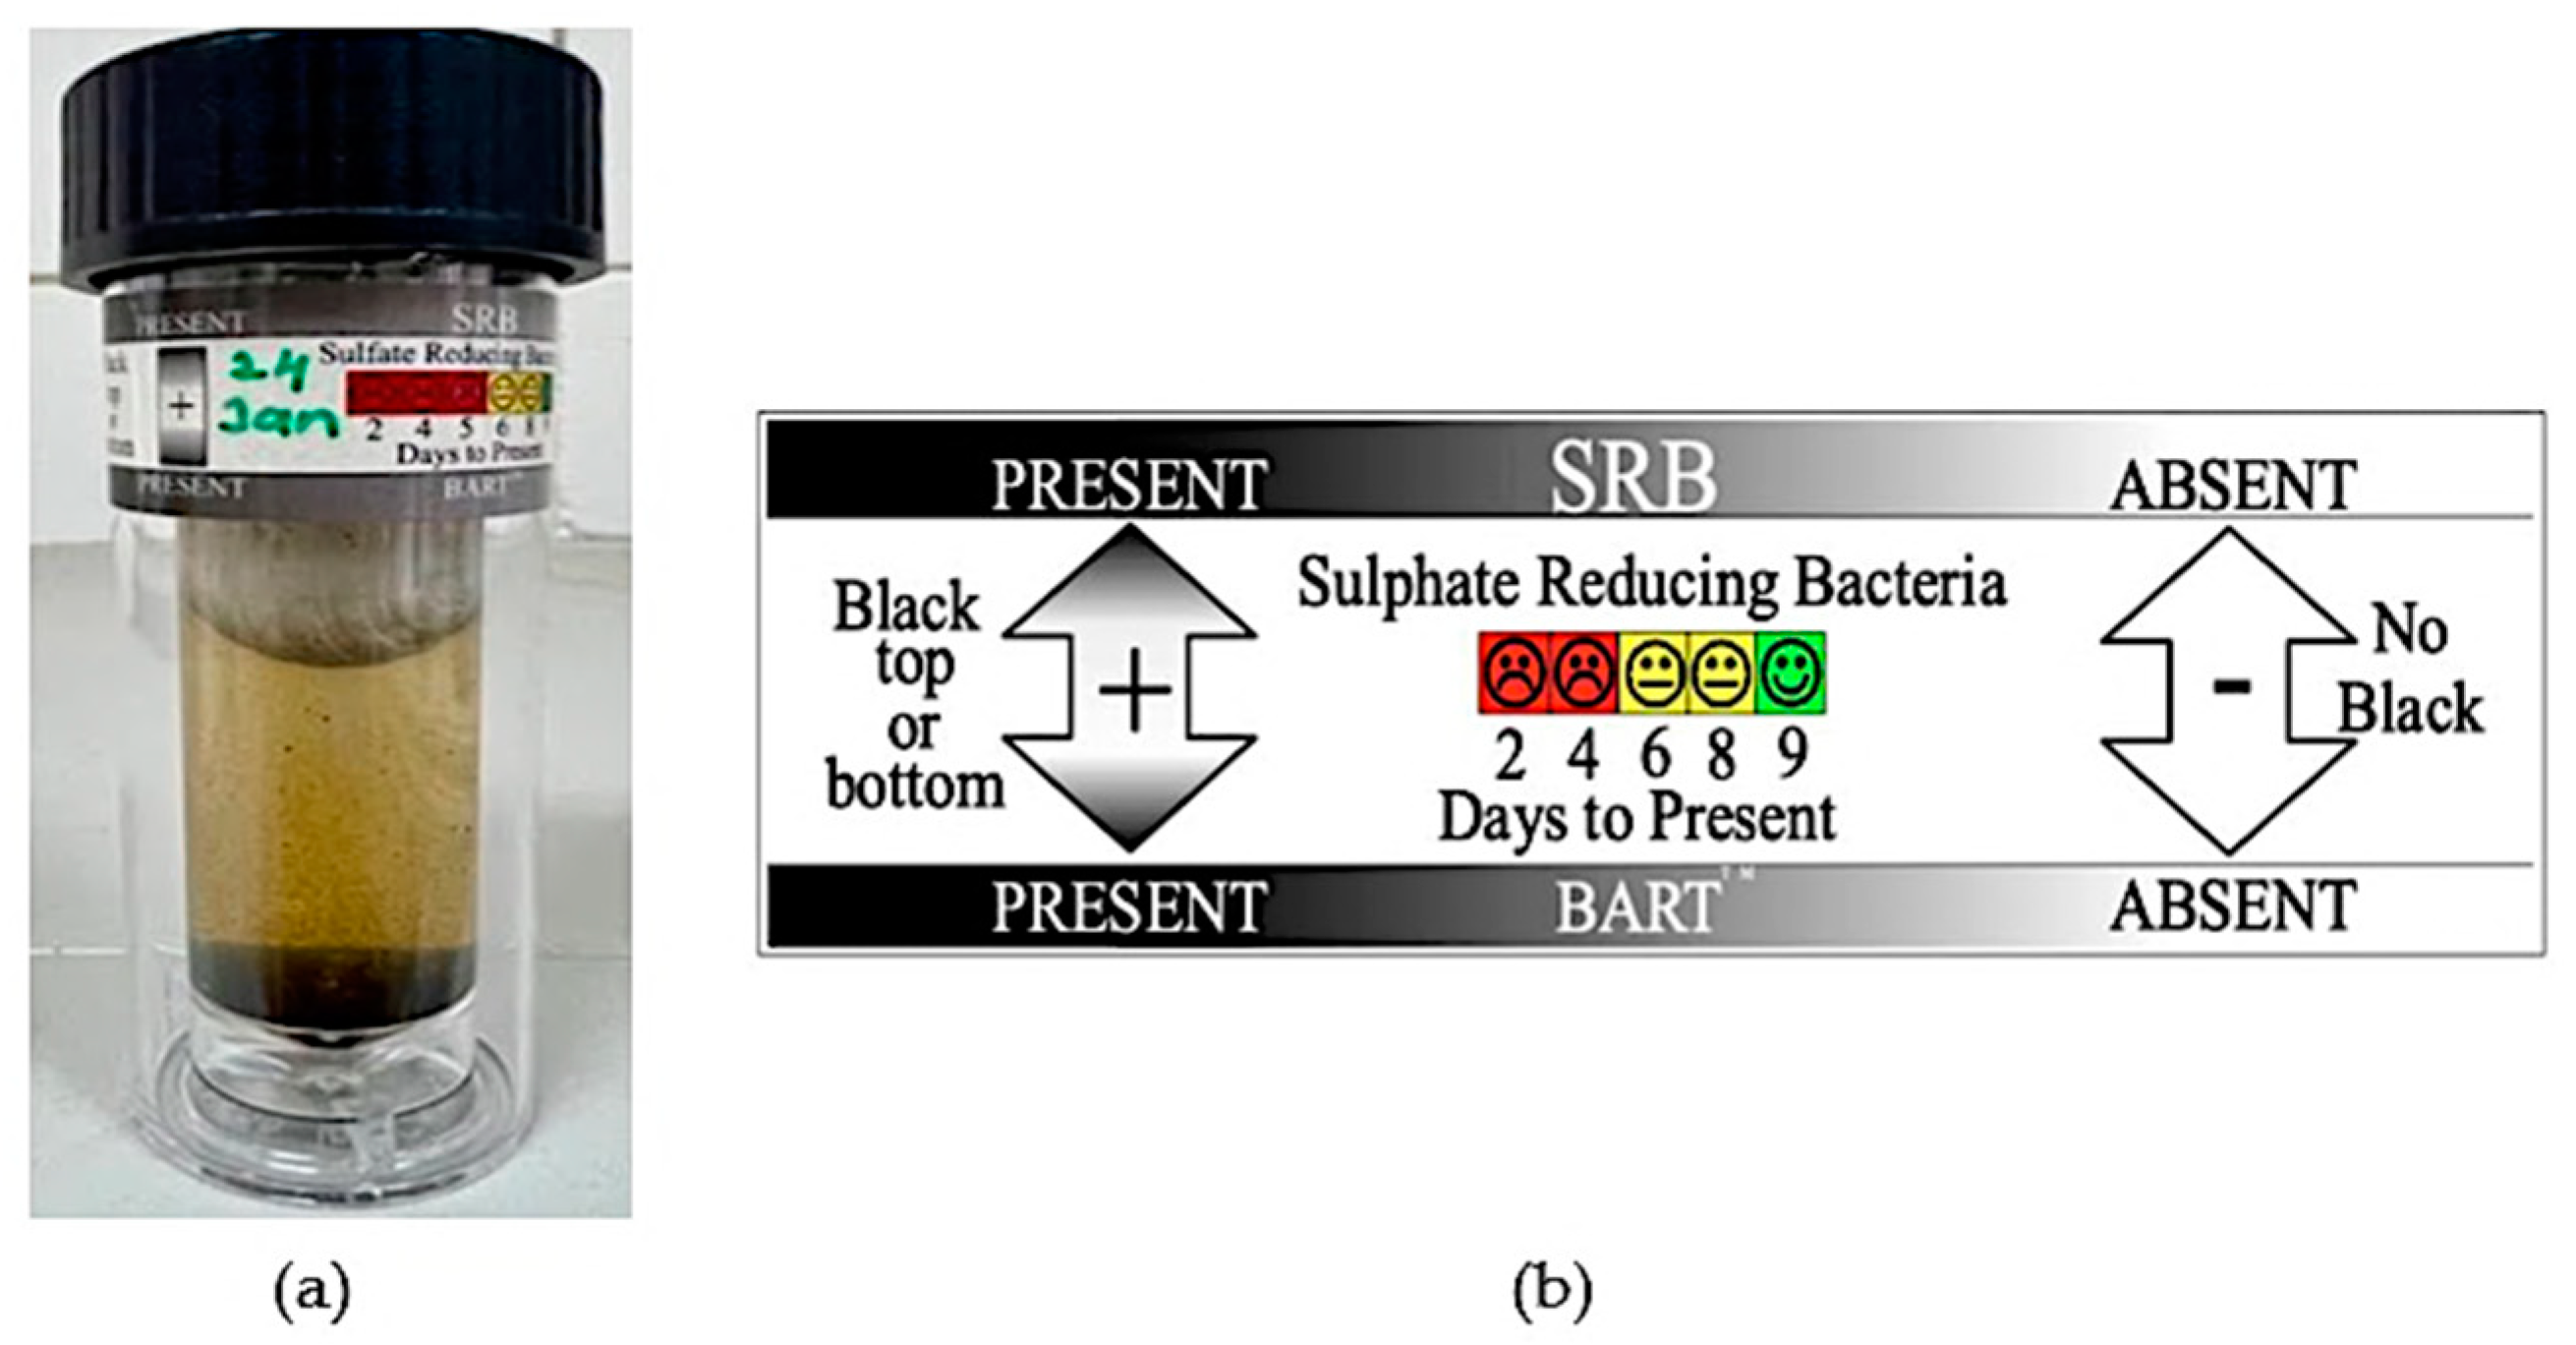
2.2.4. Isolation and Detection of SRB Using SRB-Bart Kit

Two litres of port water were extracted from an upstream pipeline that has been identified to have a corrosion problem. An amount of 30 mL of port water was taken and poured into the SRB-Bart Kit, as shown in Figure 3, and then placed in an incubator at 35 °C for 1 h. Blackening at the top and bottom of the kit was observed, indicating a positive reaction pattern for SRB. Serial dilution and SRB plating were carried out in a Petri dish containing Postgate Medium B agar, using streaking and spreading for bacteria culturing [35]. The Petri dish was then incubated at 35 °C for 3–7 days. The SRB colony was then streaked, and 10 mL of 0.3% NaCl solution was added in. Using a UV spectrophotometer with a single wavelength, 0.550 absorbance was carried out to produce 10 mL of SRB solution to add to the experiment solution. SRB were added every 24 h in the test solution throughout the experiment period.

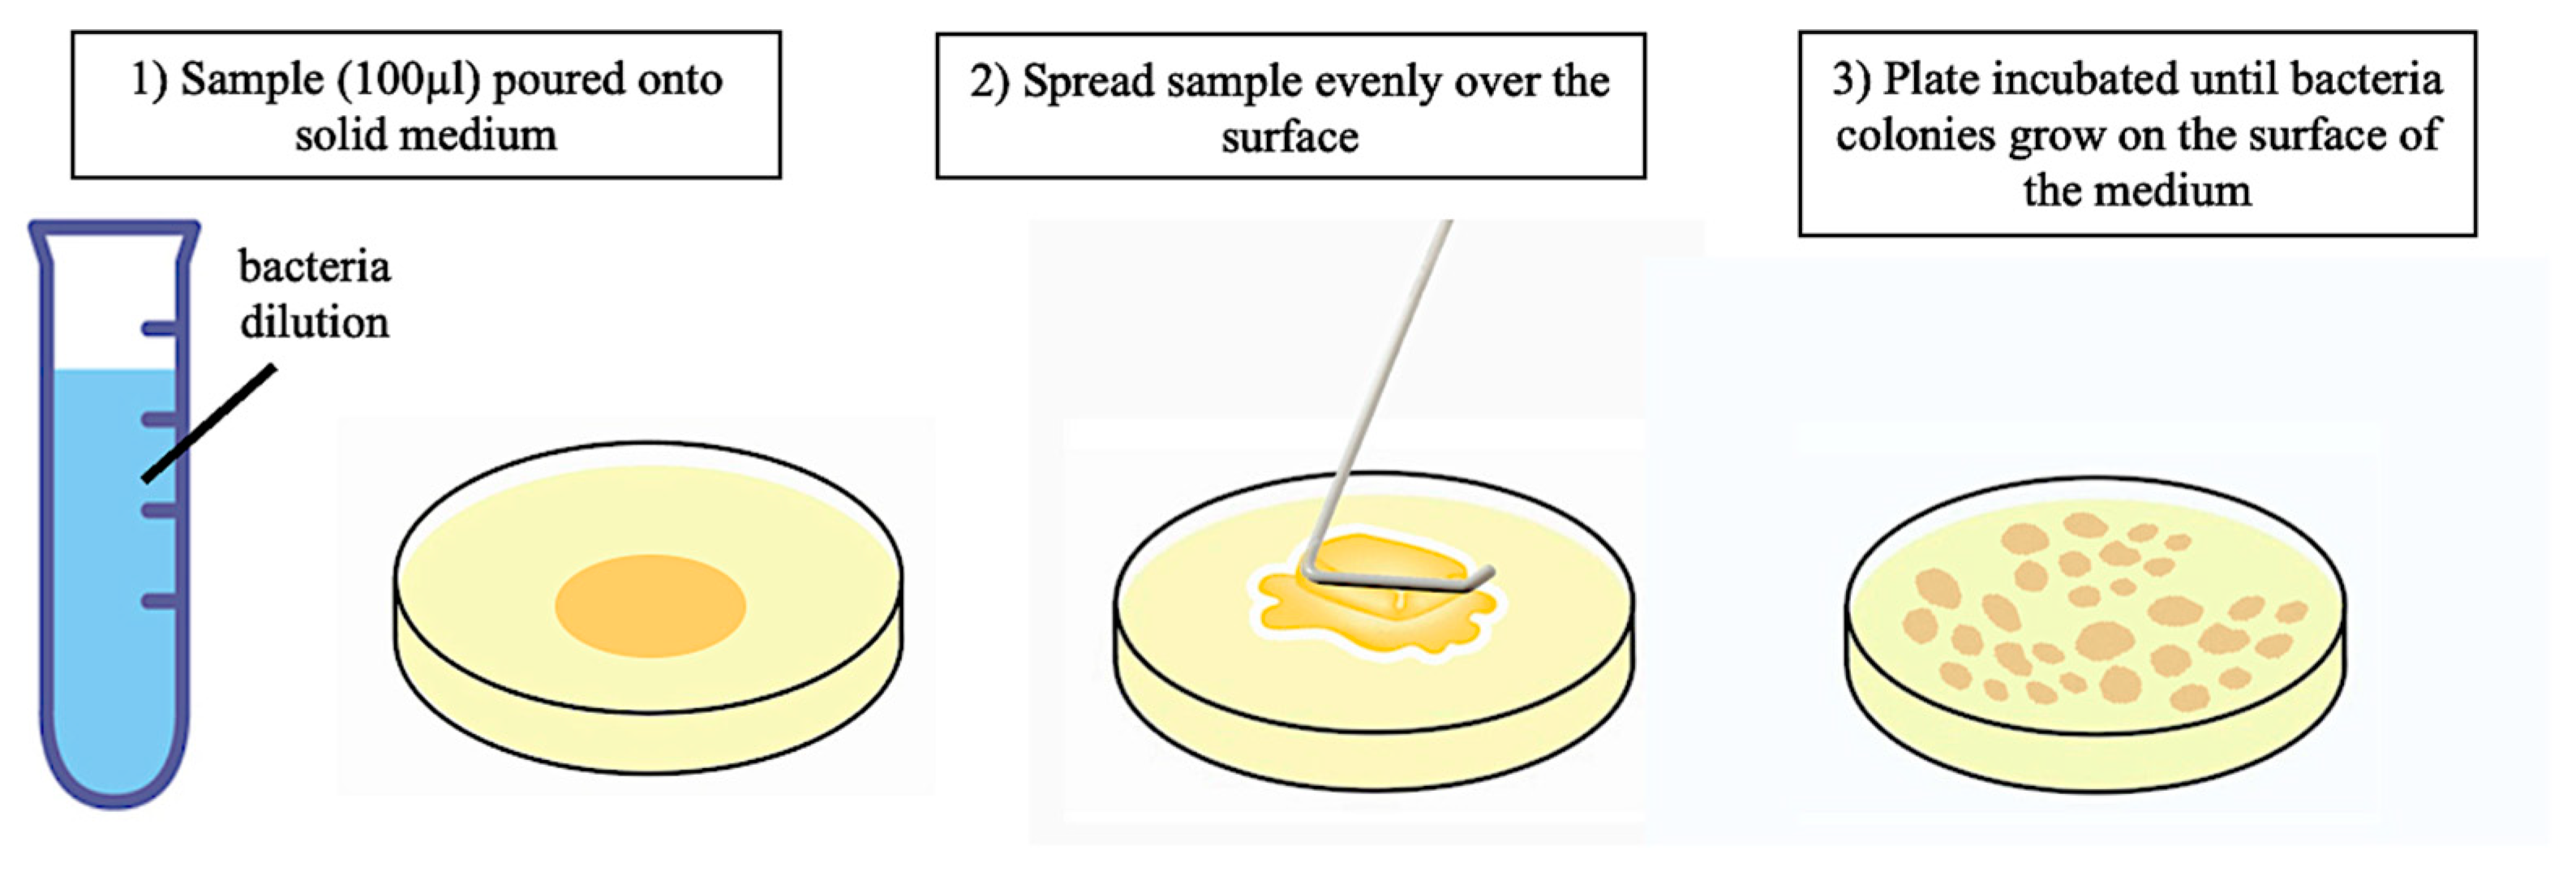
2.2.5. Serial Dilution and Plating for SRB

Serial dilution is the simplest technique for obtaining manageable concentrations of a desired organism, and it is complemented by Petri dish streaking and spreading, as shown in Figure 4 [36]. An amount of 100 mL of solution from the SRB-Bart kit (the blackened part) (solution0) was added to tube 1 containing 1 mL of normal saline solution; the product of this mixture was solution. This step was repeated by aliquoting 100 mL of the newly created solution and adding it to tube 2. Aliquoting and resuspension were likewise repeated until the final tube was reached, diluting the stock concentration by a factor of 10 with each step. We pipetted 100 mL from tube 1 into the centre of the surface of an agar plate made of PMB, as shown in Figure 5. The L-shaped glass spreader (hockey stick) was then dipped into alcohol. The glass spreader was placed over a Bunsen burner, and the sample was spread evenly over the surface of agar using a cool alcohol-flamed glass-rod spreader, carefully rotating the Petri dish underneath at an angle of 45° at the same time. The plate was incubated at 35 °C for 24–48 h. These steps were repeated for test tube 2 through 10.

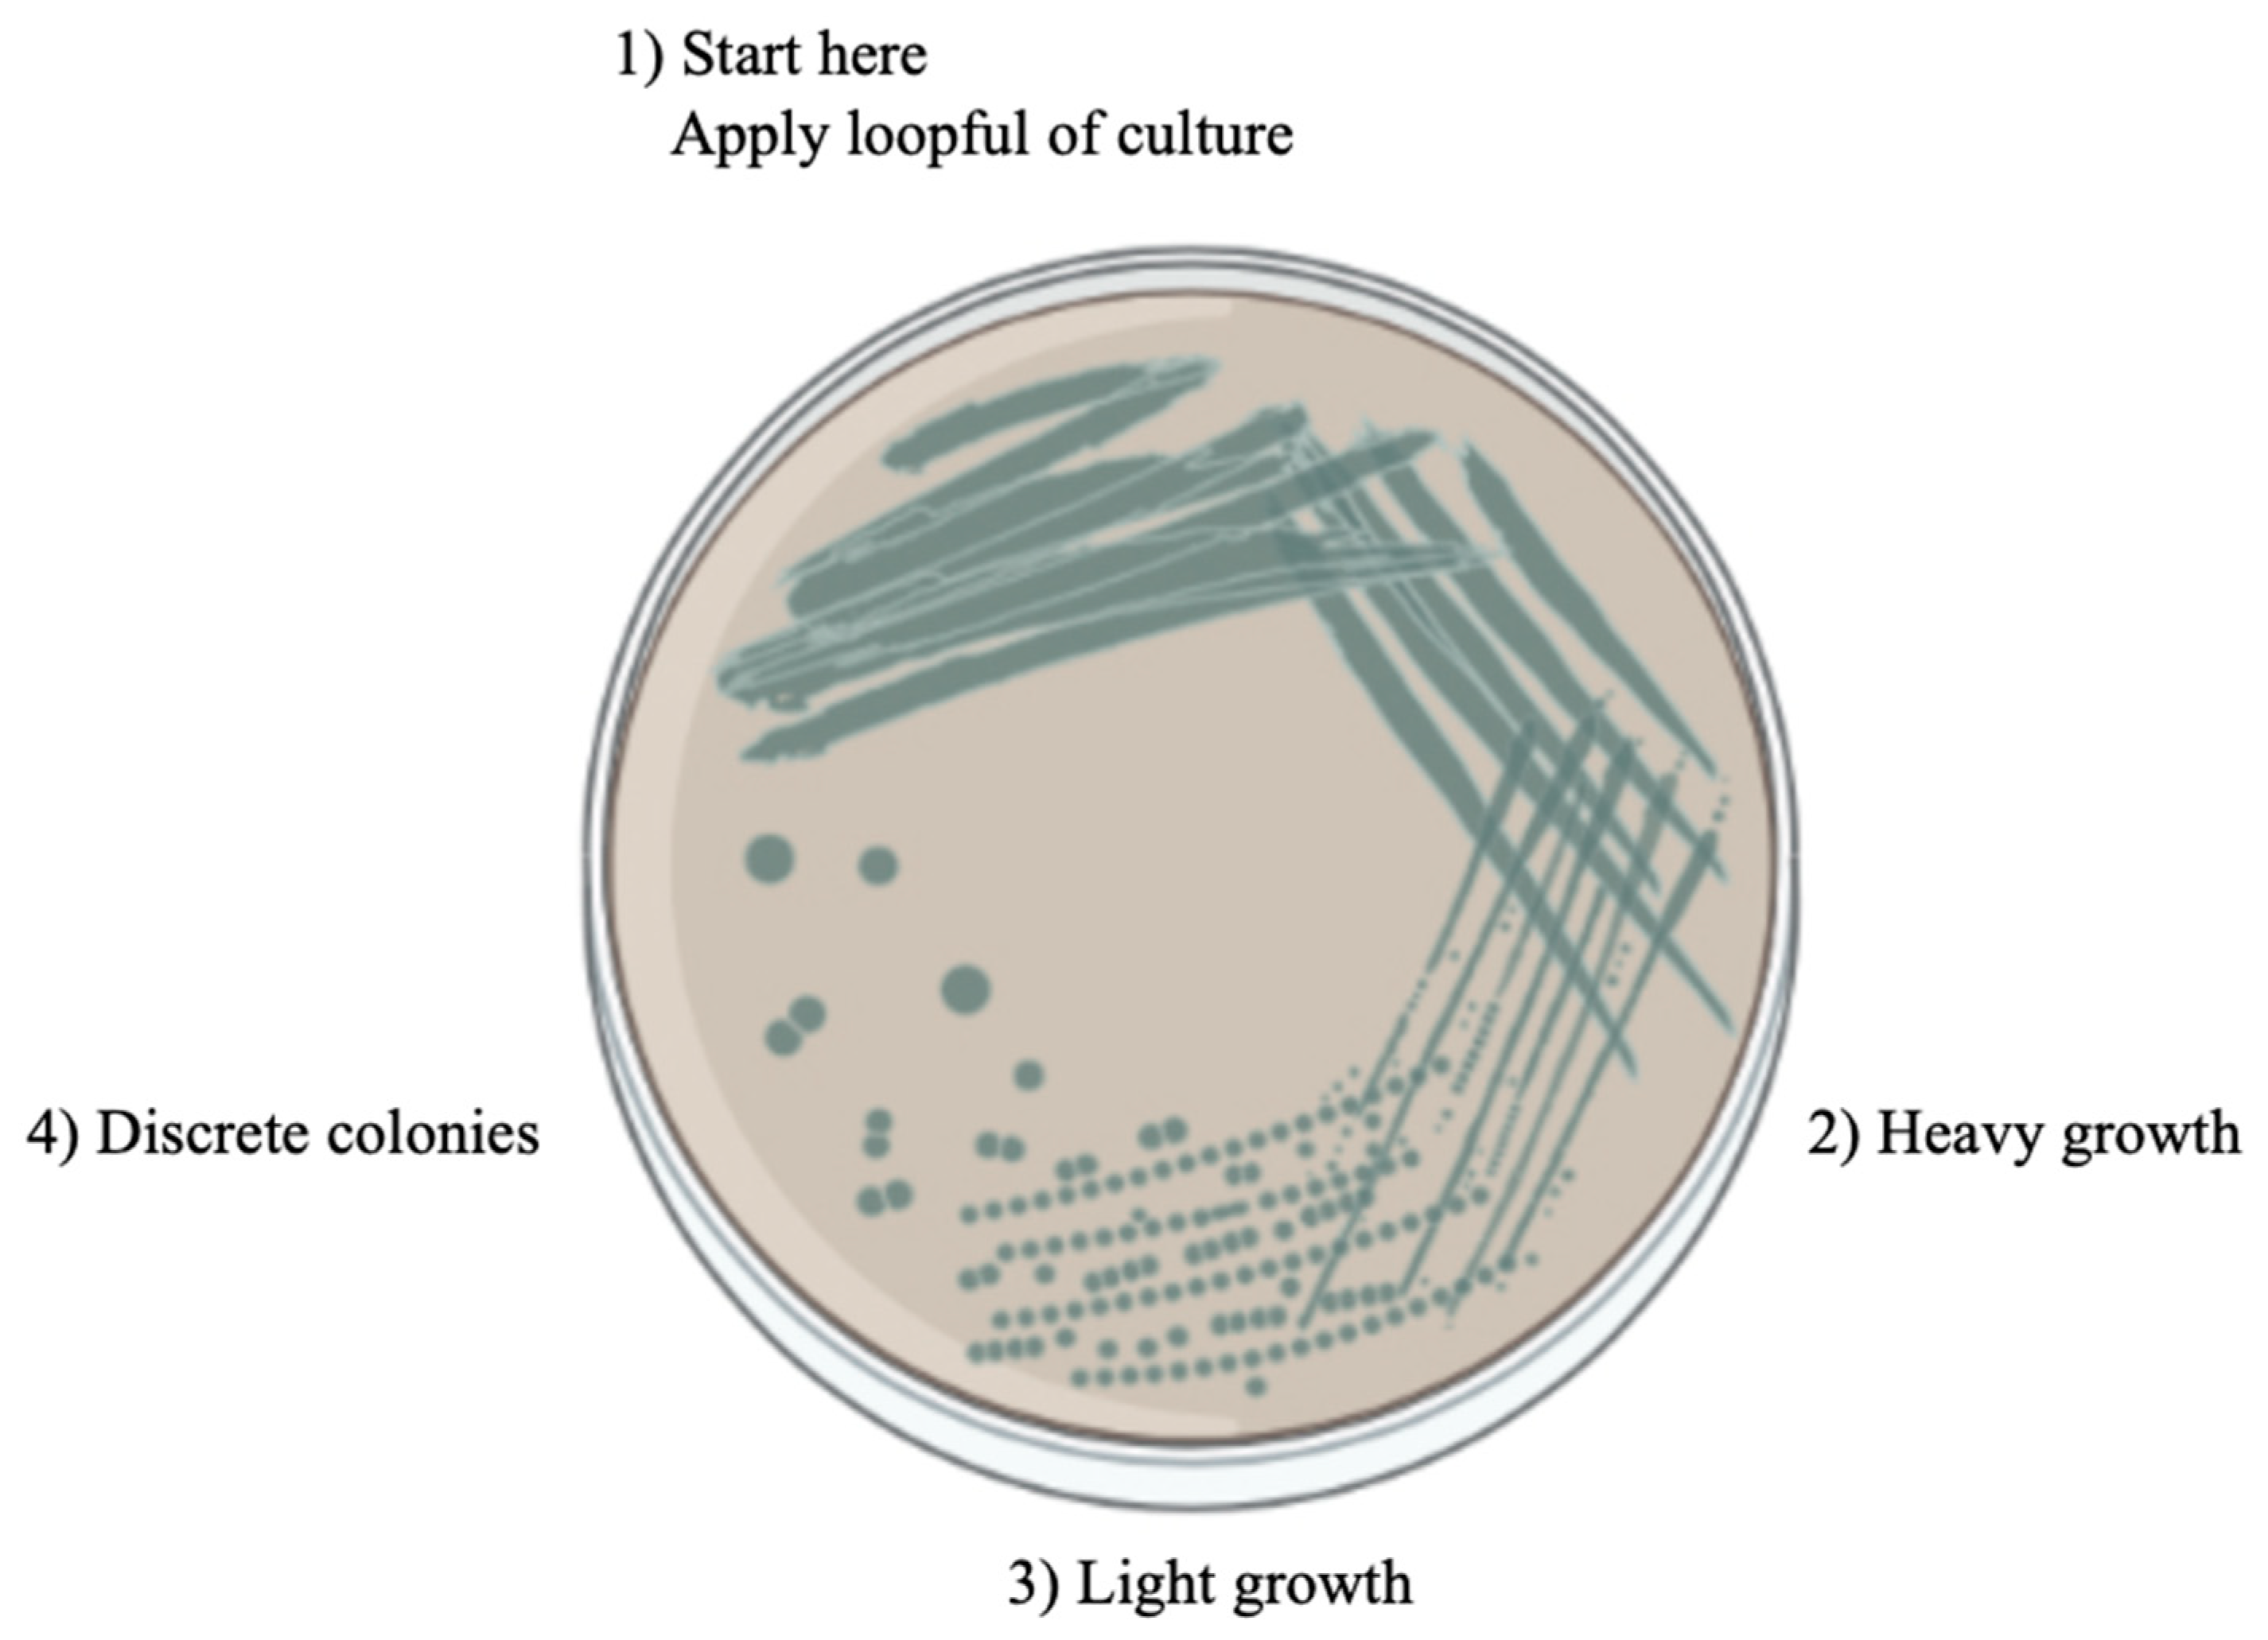
2.2.6. Streak Plate Method for Pure Culture

To produce isolated colonies of an organism (mostly bacteria) on an agar plate, a single bacterial cell is streaked across the surface of the agar plate. The streak plate method, as shown in Figure 6, is useful to separate organisms in a mixed culture (to purify/isolate a particular strain from contaminants) or to study the colony morphology of an organism. The inoculating loop in the Bunsen burner is sterilized by putting the loop into the flame until it is red hot. Then, it is allowed to cool. An isolated colony is chosen from the agar plate culture and spread over the first quadrant (approximately 1/4 of the plate) using close parallel streaks, or the loop is inserted into the tube/culture bottle and some inoculum is removed. The inoculating loop is gently streaked over a quarter of the plate using a back-and-forth motion (see area 1 in the figure below). The loop is placed in the flame again and allowed to cool. Going back to the edge of area 1, the streaks are extended into the second quarter of the plate (area 2). The loop is placed in the flame again and allowed to cool. Going back to the streaked area (area 2), the streaks are extended into the third quarter of the plate (area 3). The loop is placed in flame again and allowed to cool. Returning to the streaked area (area 3), the streaks are extended into the fourth quarter of the plate (area 4).

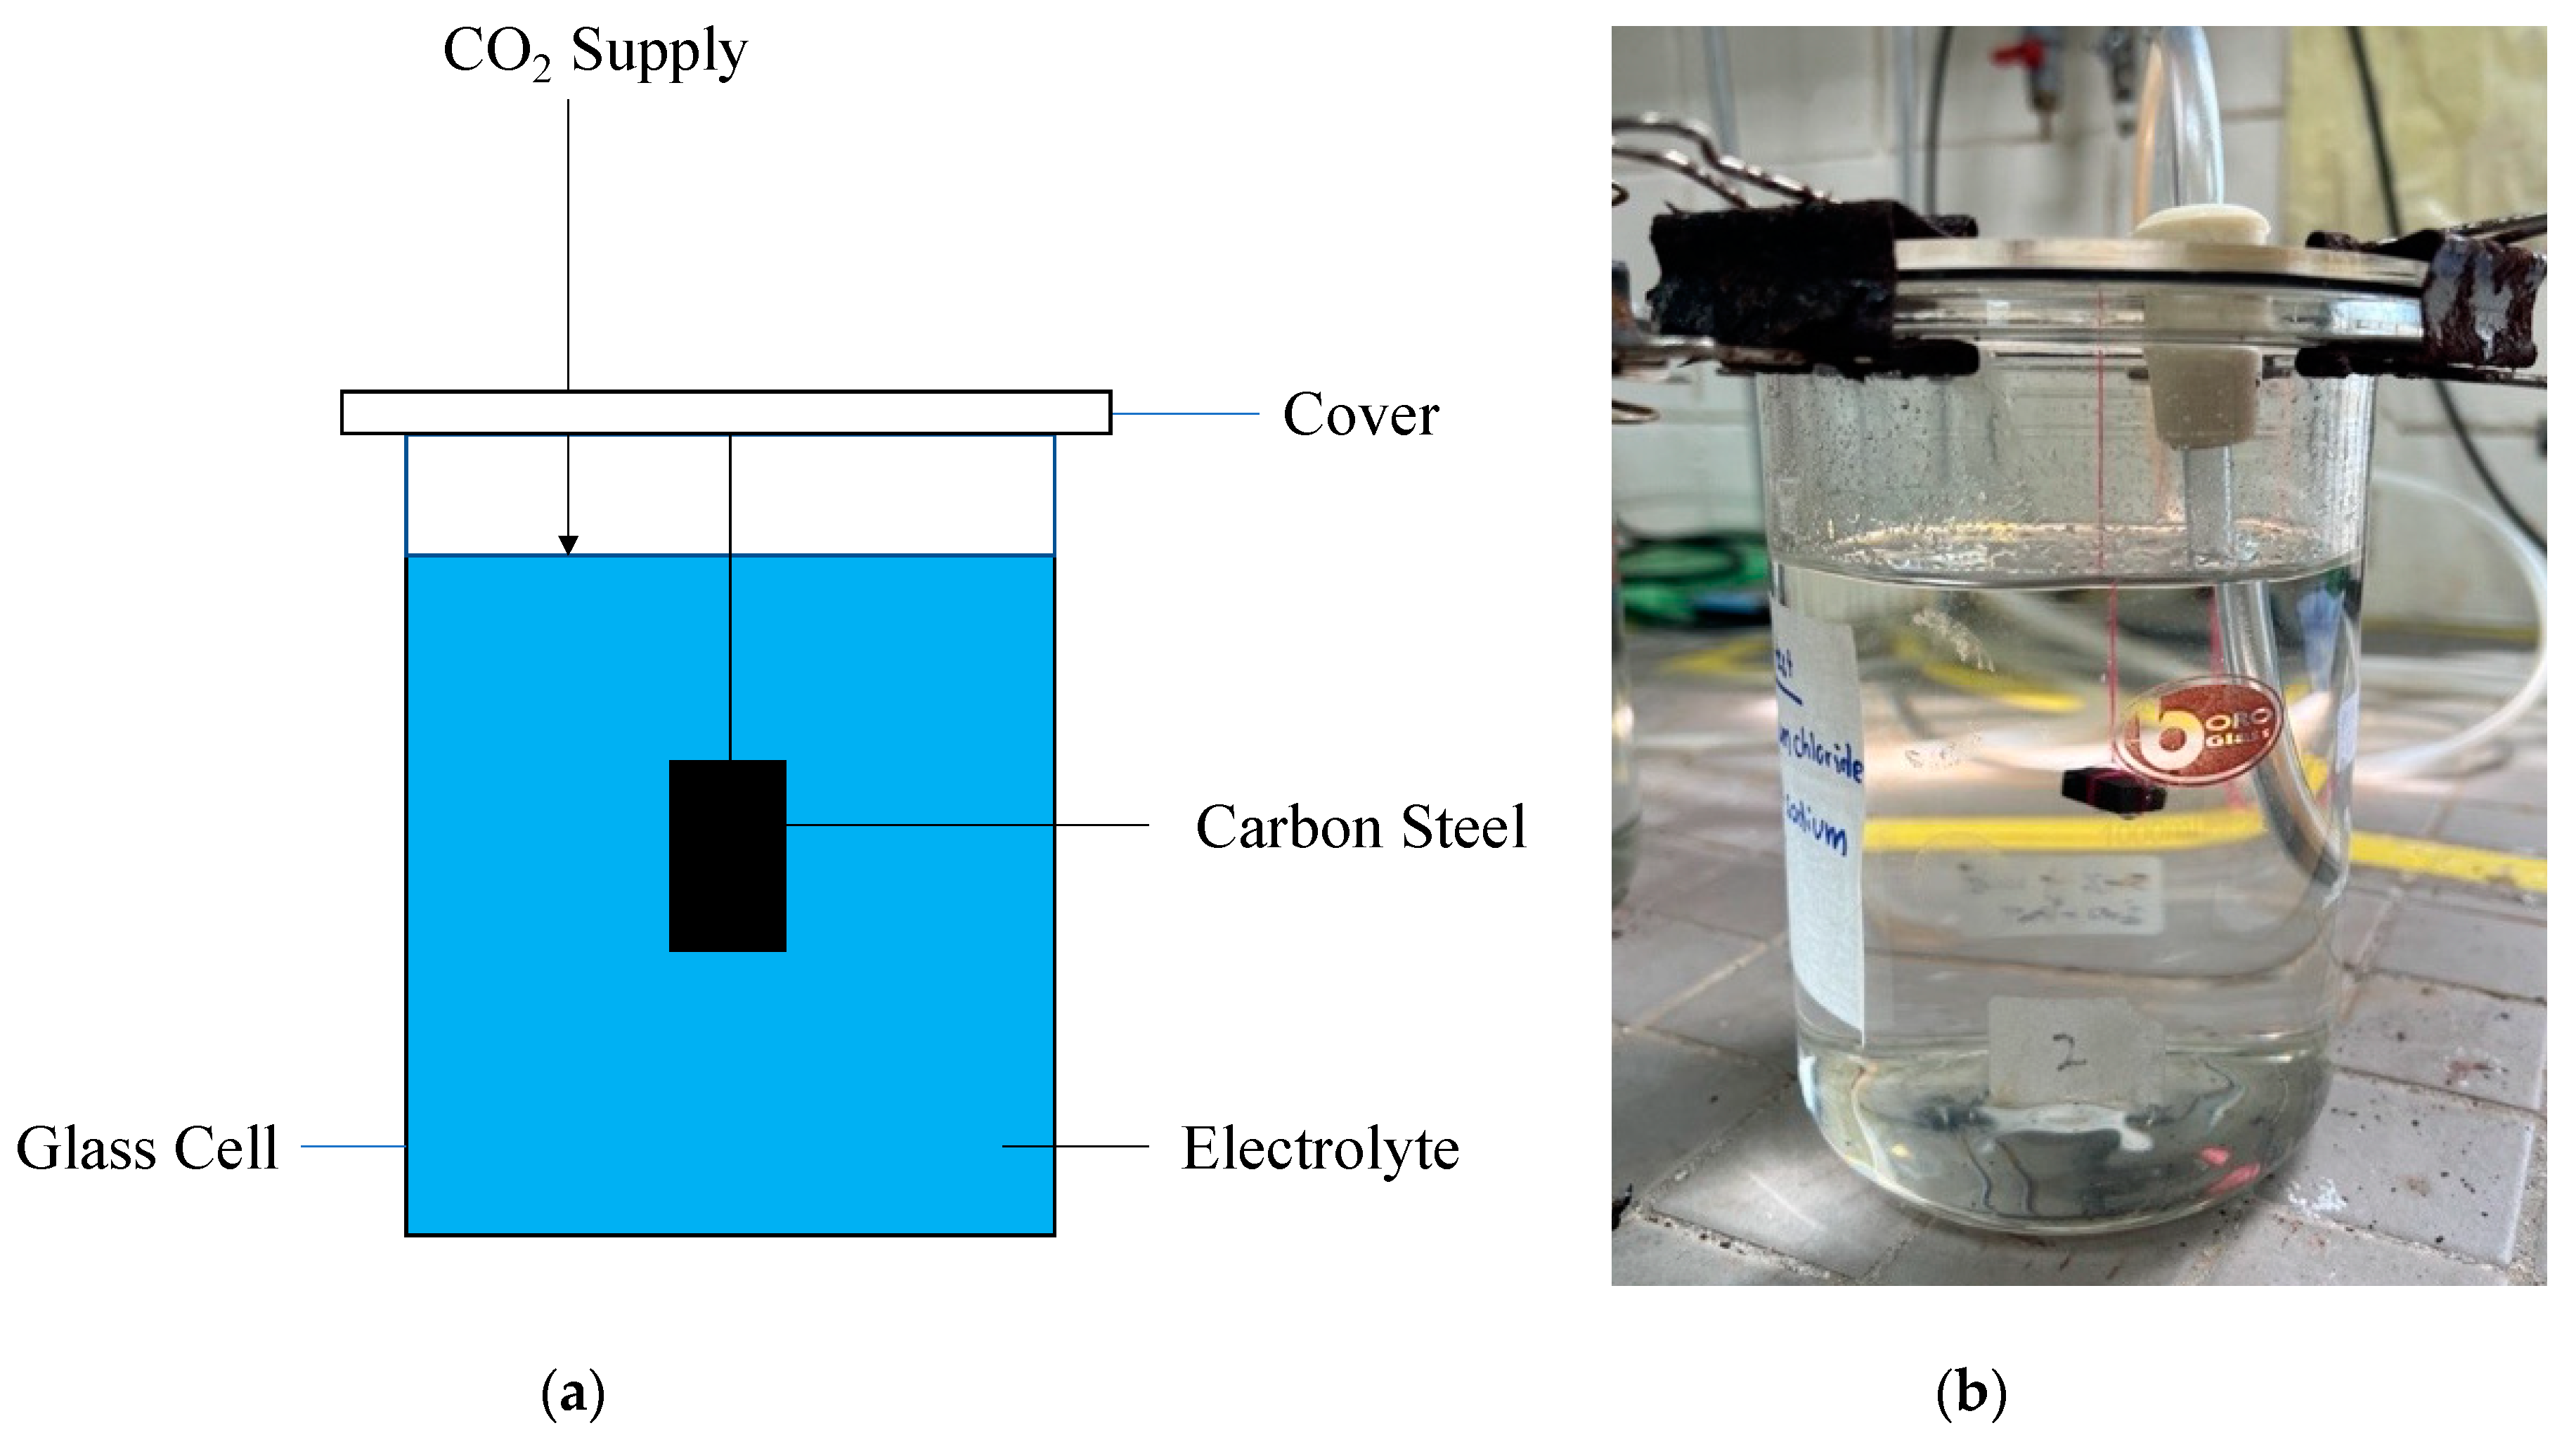
2.3. Corrosion Measurement

Corrosion rate measurement is carried out through linear polarization resistance (LPR) and weight loss immersion tests [37]. Combining these two methods can provide a more precise evaluation of the corrosion behaviour of carbon steel in this experiment.

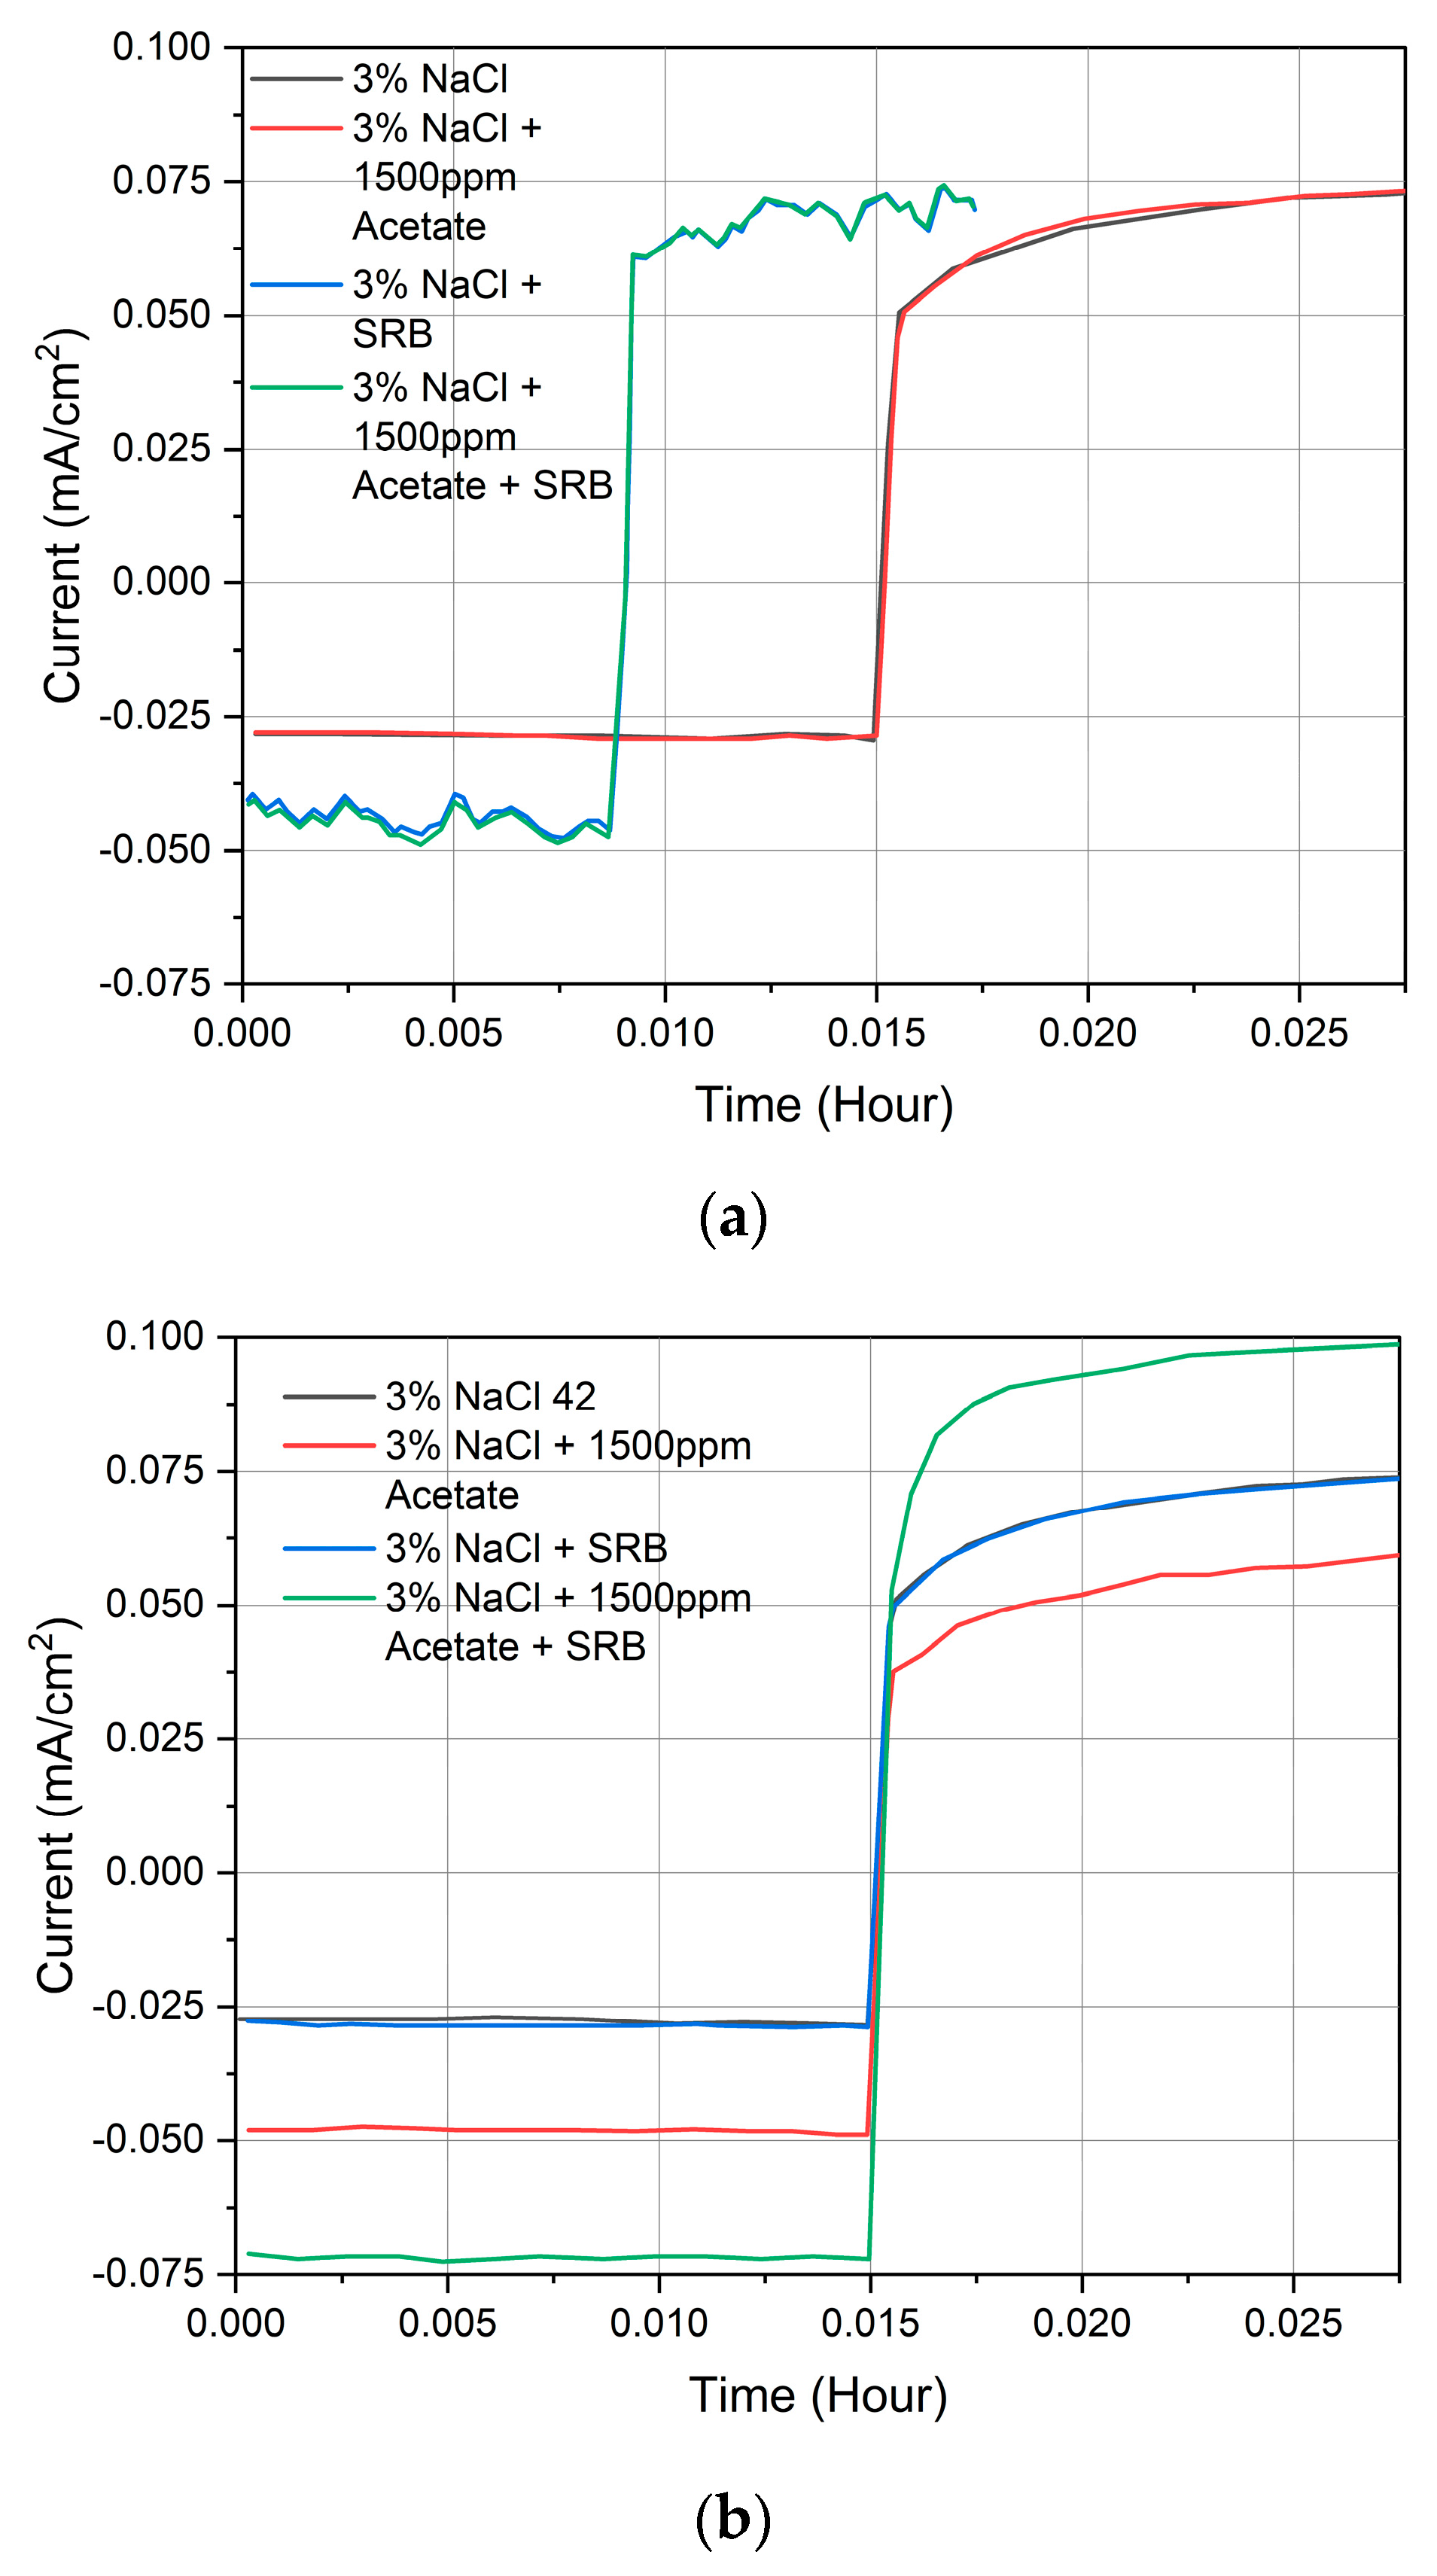
2.3.1. Linear Polarization Resistance test

LPR test was conducted in accordance with ASTM G59 using an ACM instrument to analyse the polarization resistance of carbon steel [38]. Figure 7 shows the experimental set-up for the LPR test. The LPR method is based on the Stern–Geary equation, which relates the polarization resistance of a metal to its corrosion rate [39]. The test matrix for linear polarization resistance is shown in Table 4 below. The reported results are based on the average of three experimental replicates.
R p = E i
where
  • Rp: polarization resistance (Ohm);
  • ∆E: potential difference (V);
  • ∆I: change in current (A).
Figure 7. Experimental set-up for the linear polarization test: (a) schematic and (b) actual picture of linear polarization test.
Metals 13 01974 g007
Table 4. Test matrix for linear polarization resistance.
Description
Size of Sample10 mm × 10 mm × 5 mm
Counter electrodeStainless steel
Reference electrodeSilver/silver chloride (Ag/AgCl)
Working electrodeCarbon steel A283 Grade C
The corrosion rate can be measured by converting the polarization resistance using the Stern–Geary equation [40].
i c o r r   =   B R p
where
  • icorr: corrosion current density, A.cm−2;
  • B: Stern–Geary constant.
Equation (3) shows the calculation of the corrosion rate if given Rp and icorr:
CR = 0.00327 × i c o r r × M n ρ
where
  • CR: corrosion rate, mm/yr;
  • M/n: equivalent weight, gm;
  • P: density of metal.

2.3.2. Weight Loss Immersion Test

The weight loss immersion test was conducted in accordance with ASTM G31 by immersing carbon steel in a corrosive solution to analyse weight loss over time [41]. The corrosion rate was calculated using the formula in Equation (4) [42]. Figure 8 shows the experimental set-up for the weight loss test. The reported results are based on average of three experimental replicates.
C R = k w ρ × A × T
where
  • CR = corrosion rate (mm/year);
  • w = weight loss (g);
  • A = exposed surface area of coupon (cm2);
  • ρ = density of carbon steel (g/cm3);
  • T = time (hours);
  • k: constant for unit conversion (8.76 × 10⁴).
Figure 8. Experimental set-up for the weight loss immersion test: (a) schematic and (b) actual picture of immersion weight loss test.
Metals 13 01974 g008

2.4. Surface Characterization of Carbon Steel

To observe changes in the surface of the carbon steel plate after the test was performed, SEM (TM 3000) was used to study pitting morphology, and EDX, using Quantax 70 software, version 1.3, was used to determine the corrosion byproduct’s elemental composition.

3. Results

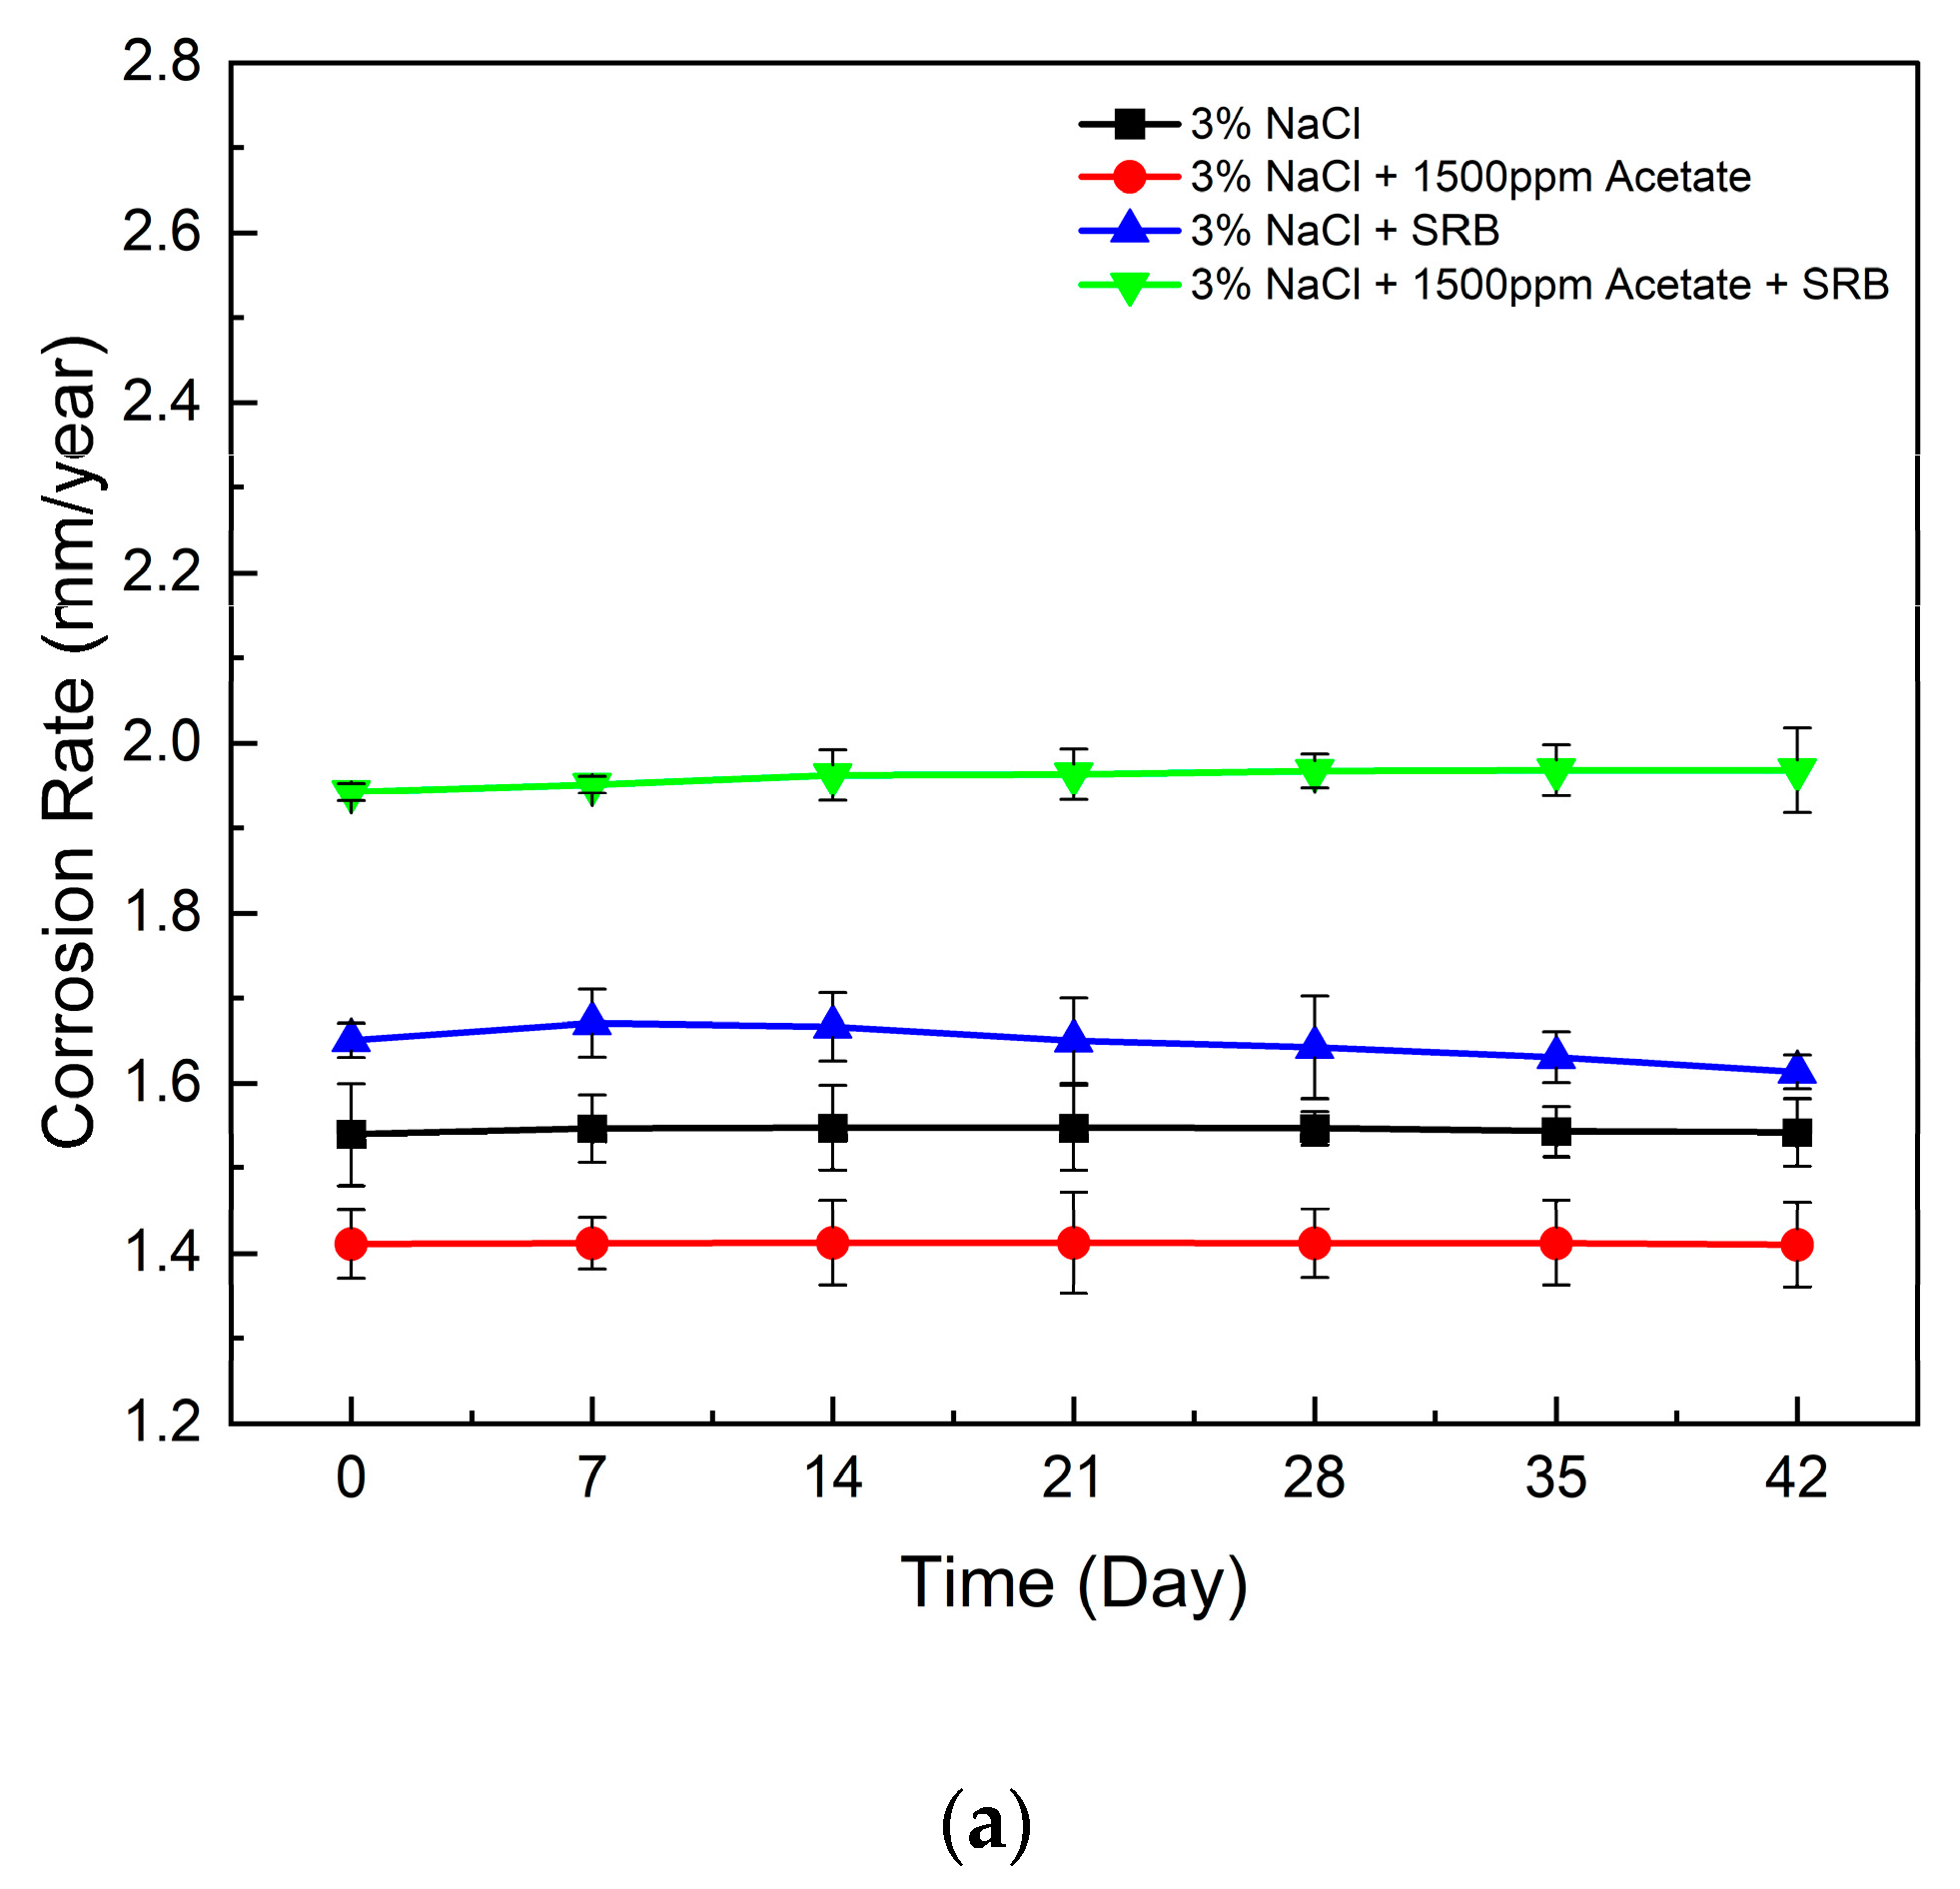
3.1. Corrosion Rate under Simulated Formation Water in Saturated CO2: Case A

The overall LPR results for current (mA/cm2) vs. time (hour) are shown in Figure 9. Figure 10a shows the corrosion rate vs. time for Case A and provides a visual representation of the variability in data points across the three trials conducted for this case. The presence of acetate decreased the corrosion rate by 9.5% (from 1.55 mm/year to 1.41 mm/year). However, with the presence of acetate and SRB, the corrosion rate increased to 17.2% (from 1.65 mm/year to 1.96 mm/year), indicating an increase in SRB activities and their abilities to produce corrosive byproducts, which further accelerated the corrosion of the carbon steel being tested.
A similar observation was noted in the weight loss immersion test, as shown in Table 5, and Figure 10b provides a visual representation of the variability in data points across the three trials conducted for this case. The corrosion rate decreased with the presence of acetate by 45.9% (from 0.83 mm/year to 0.52 mm/year). However, with acetate and SRB, the corrosion rate increased by 17.2% (from 1.01 mm/year to 1.20 mm/year). The presence of acetate in the SRB environment can thus substantially increase the corrosion rate.

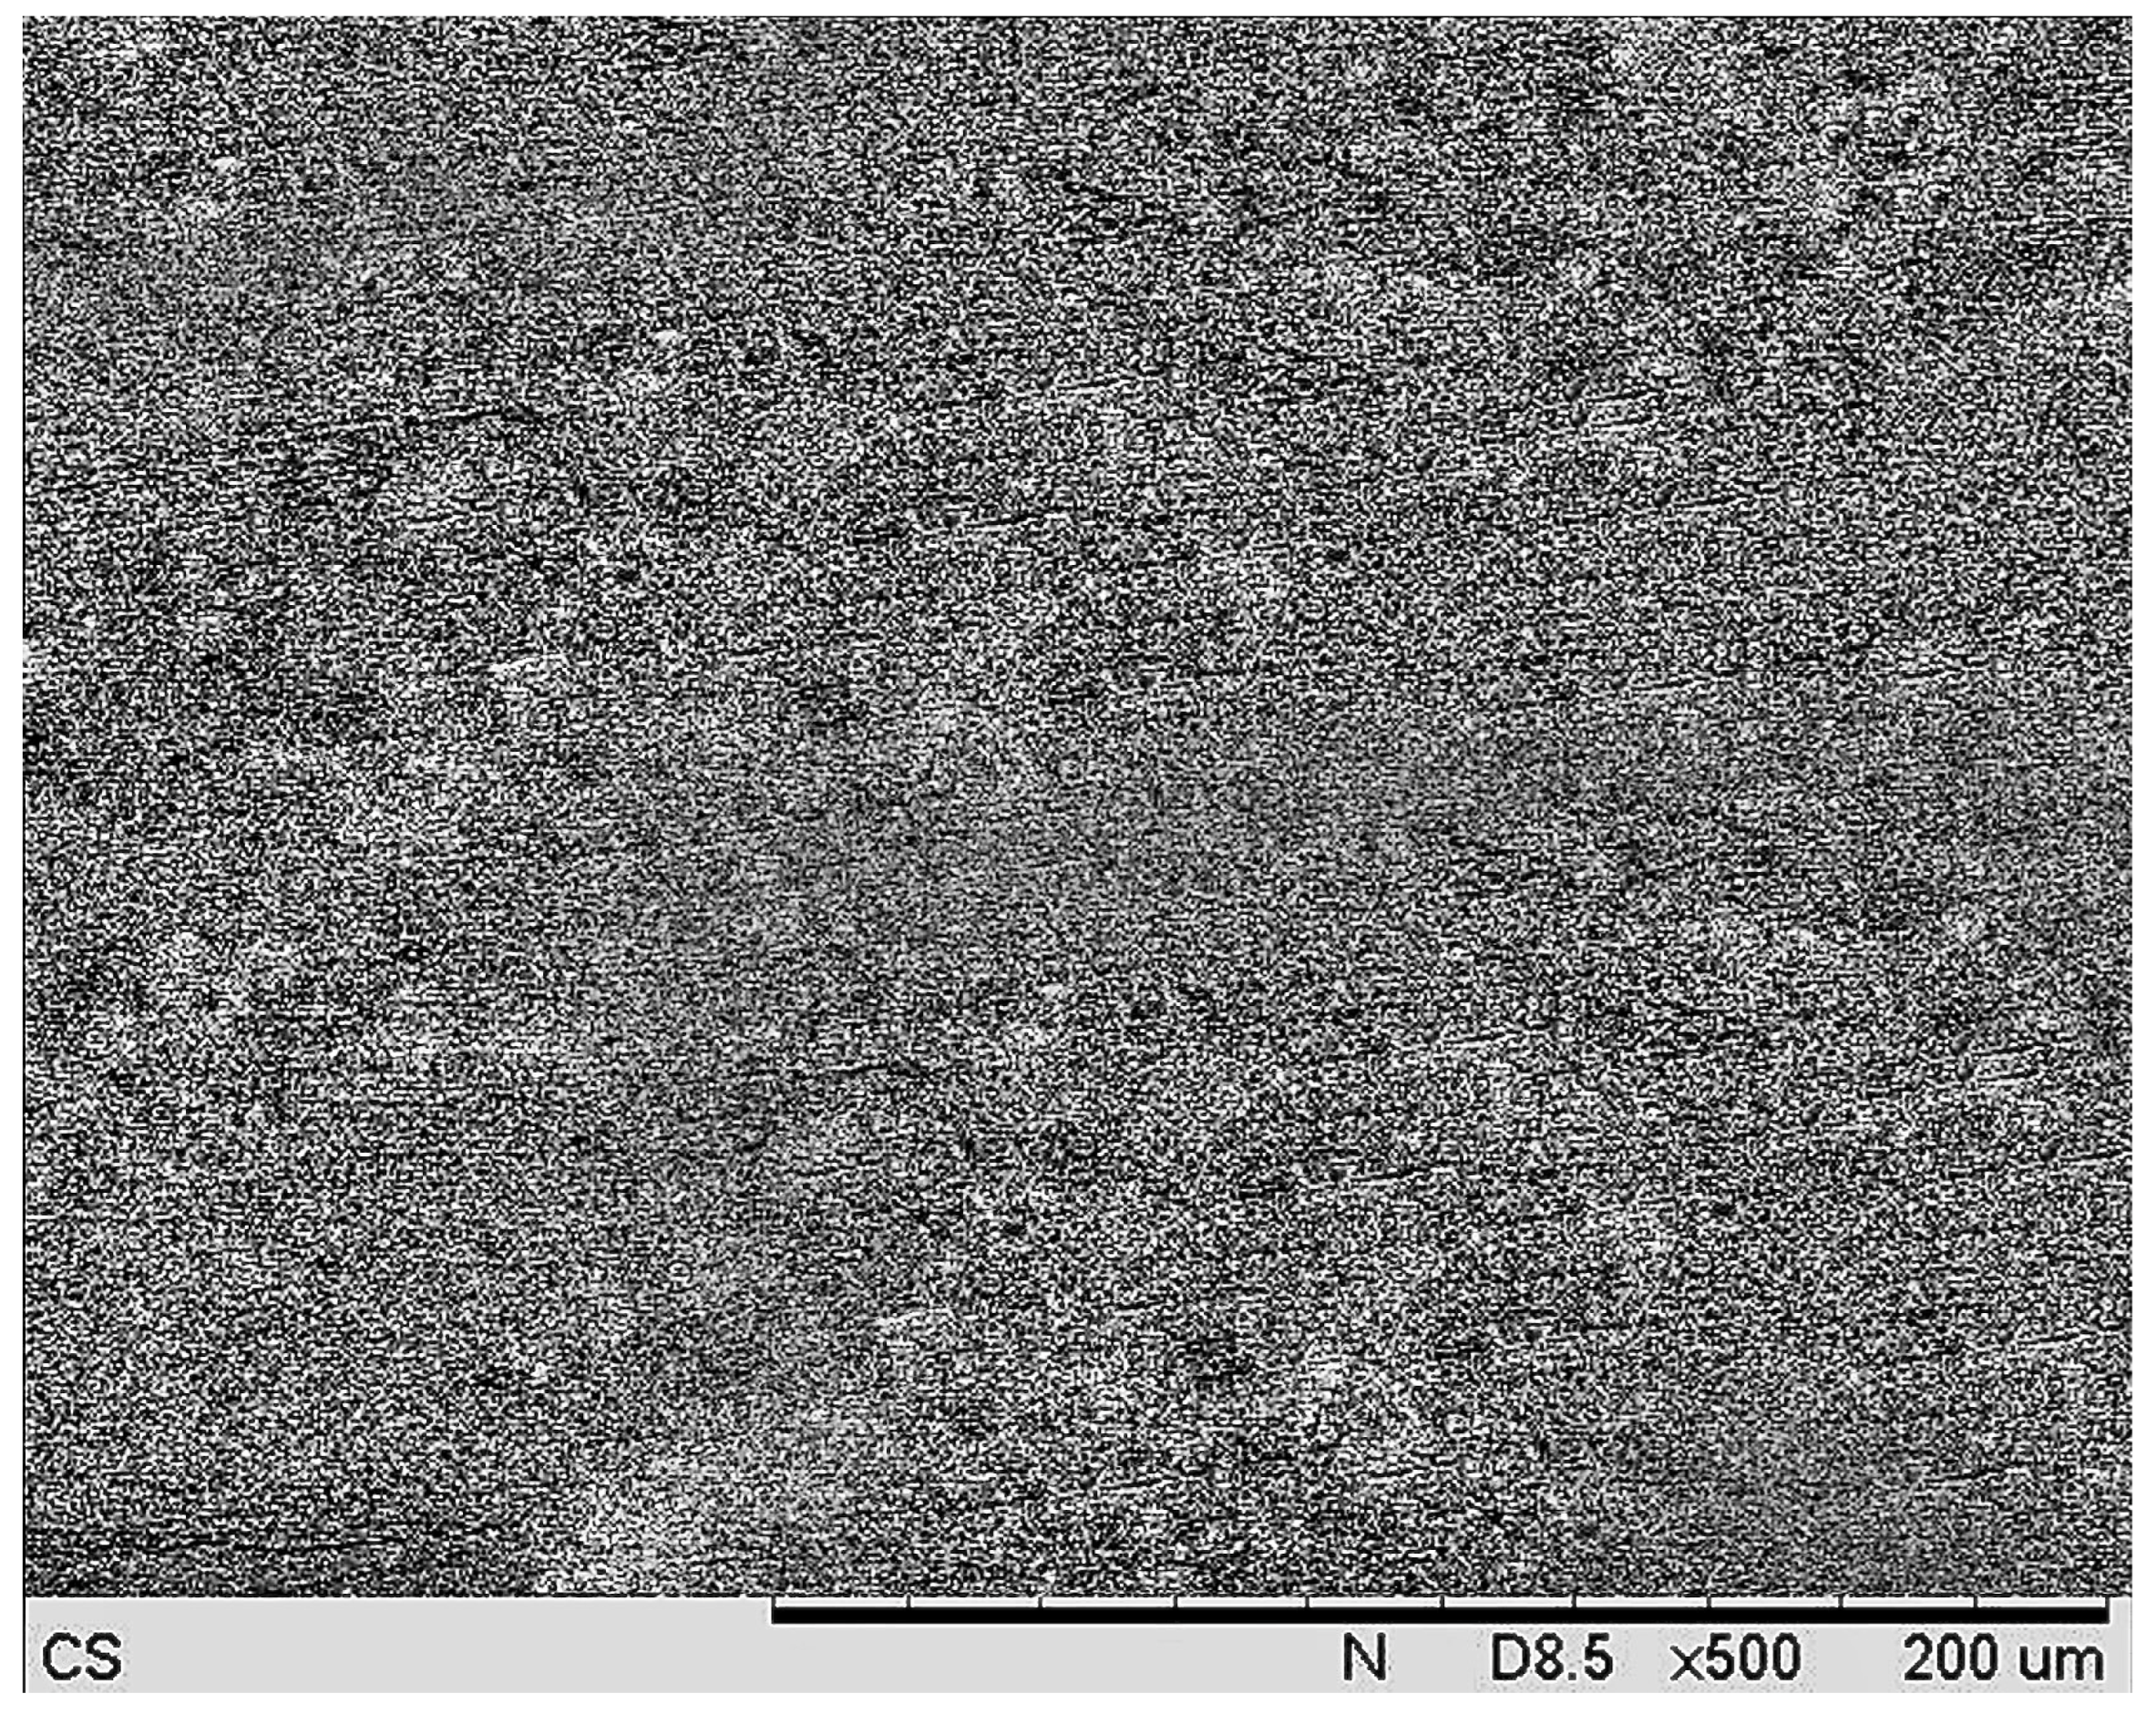
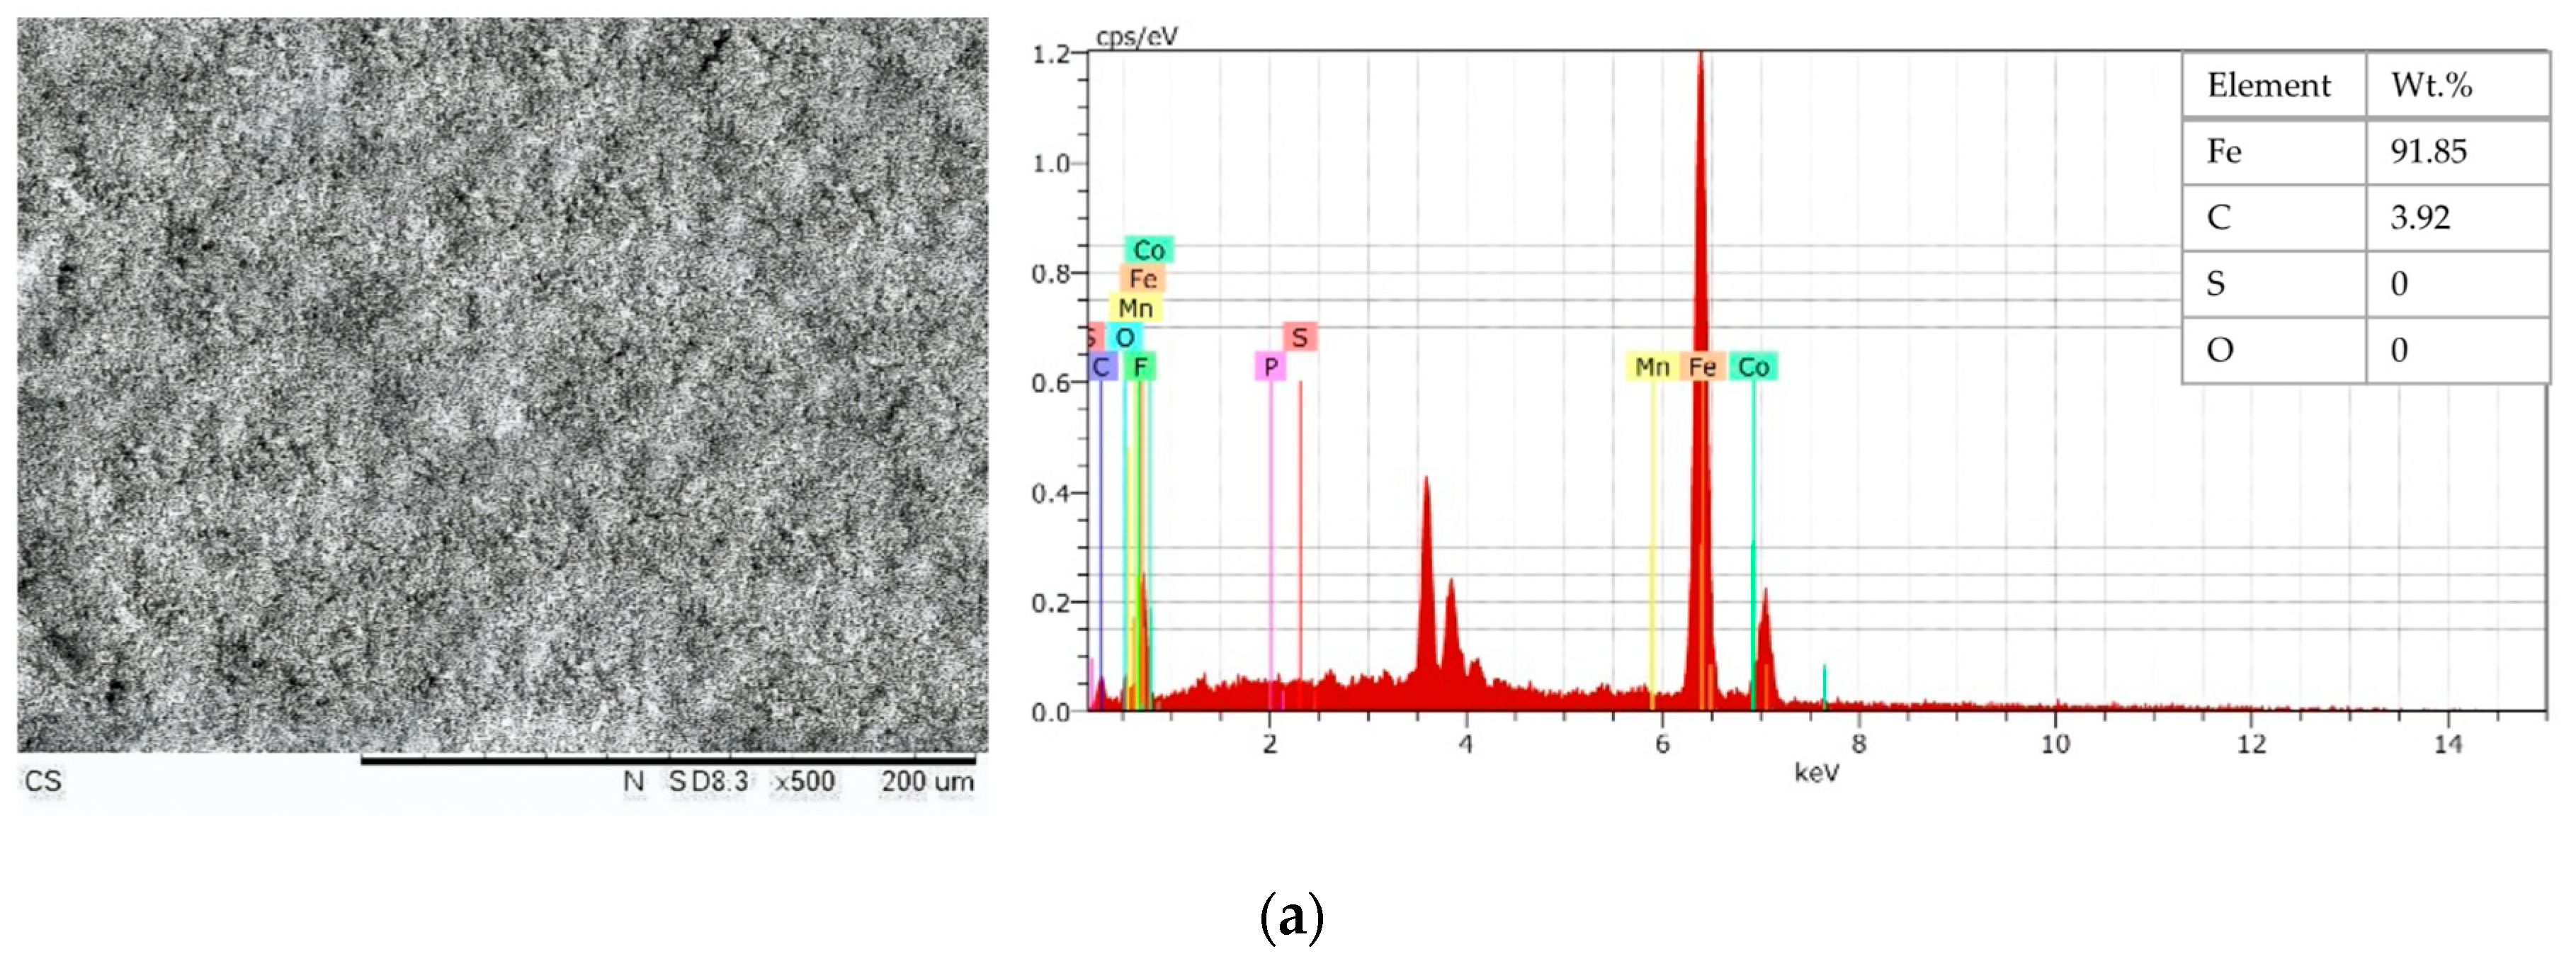
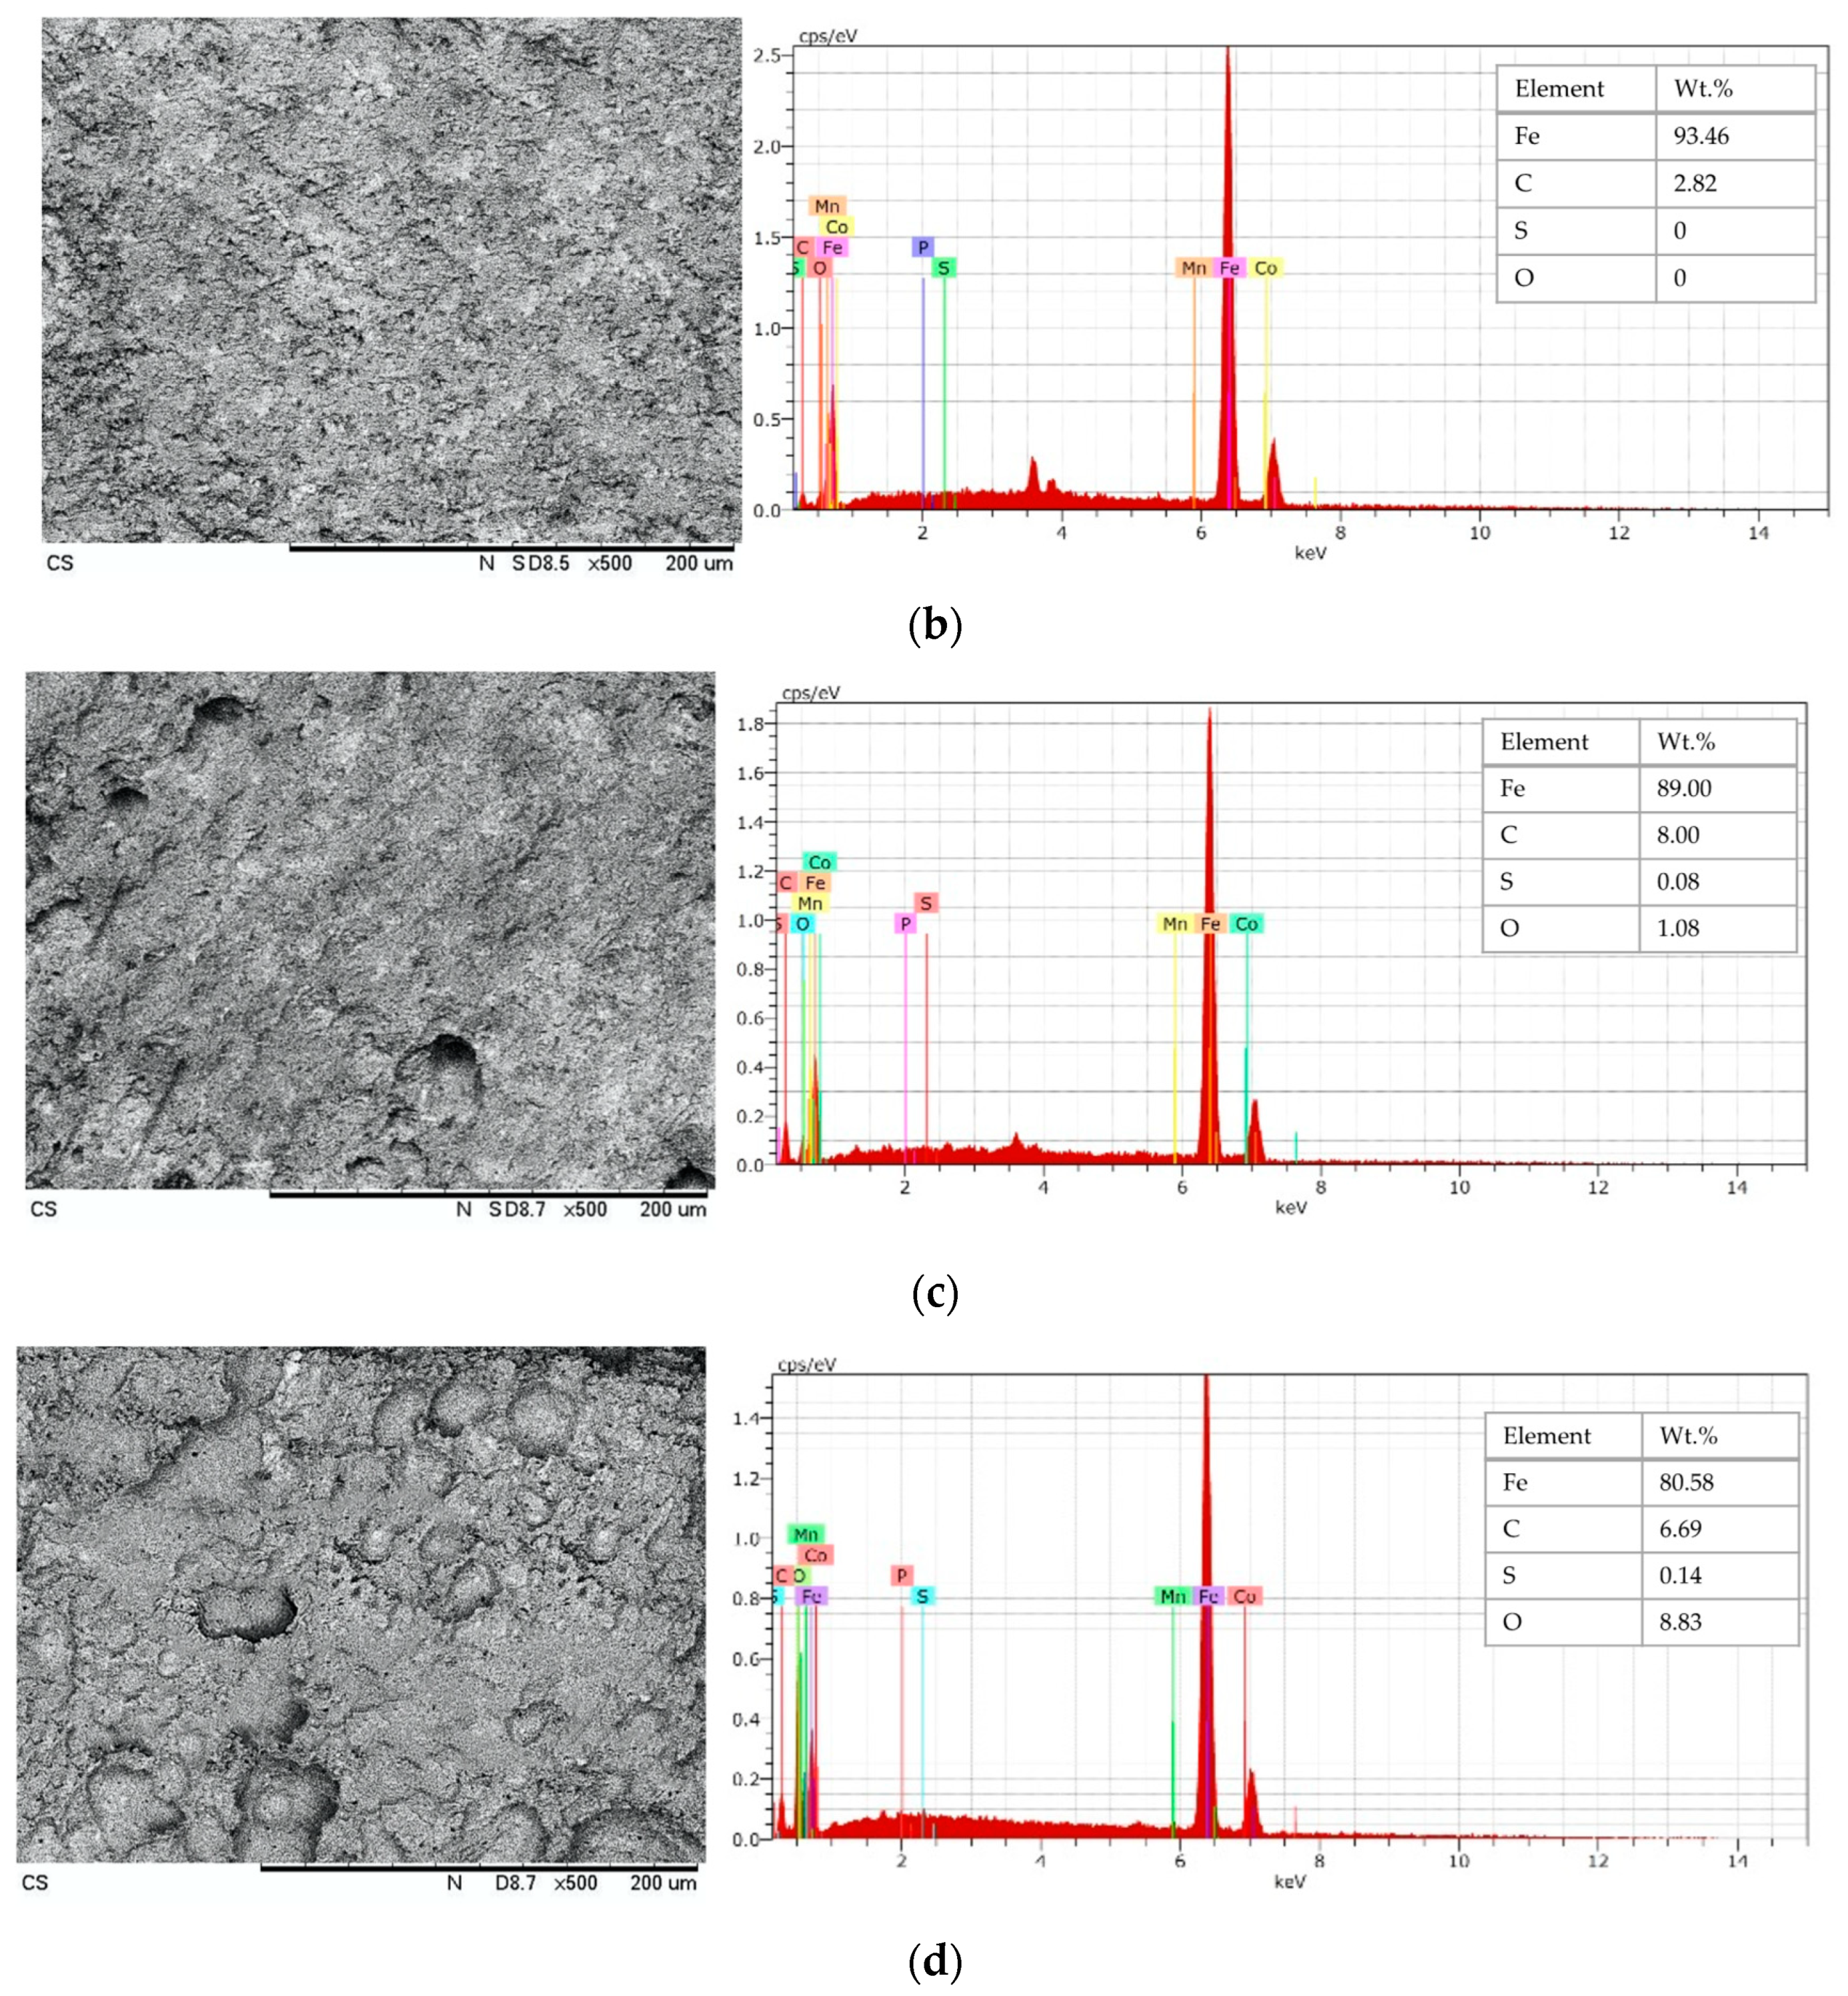
3.2. SEM Images and EDX Results: Case A

It can be seen from the SEM images in Figure 11a,b for Test-1A and Test-2A, respectively, that the surface was uniformly corroded and covered with a black film, indicating a possible formation of an iron carbonate layer with 0% sulphur. However, the SEM image of the Test-3A surface was covered with black film, and pitting was detected, with 0.01% sulphur. As shown in Figure 11d, for Test-4A, a more severe pitting-like surface was observed than in Figure 11c, with 0.04% sulphur.

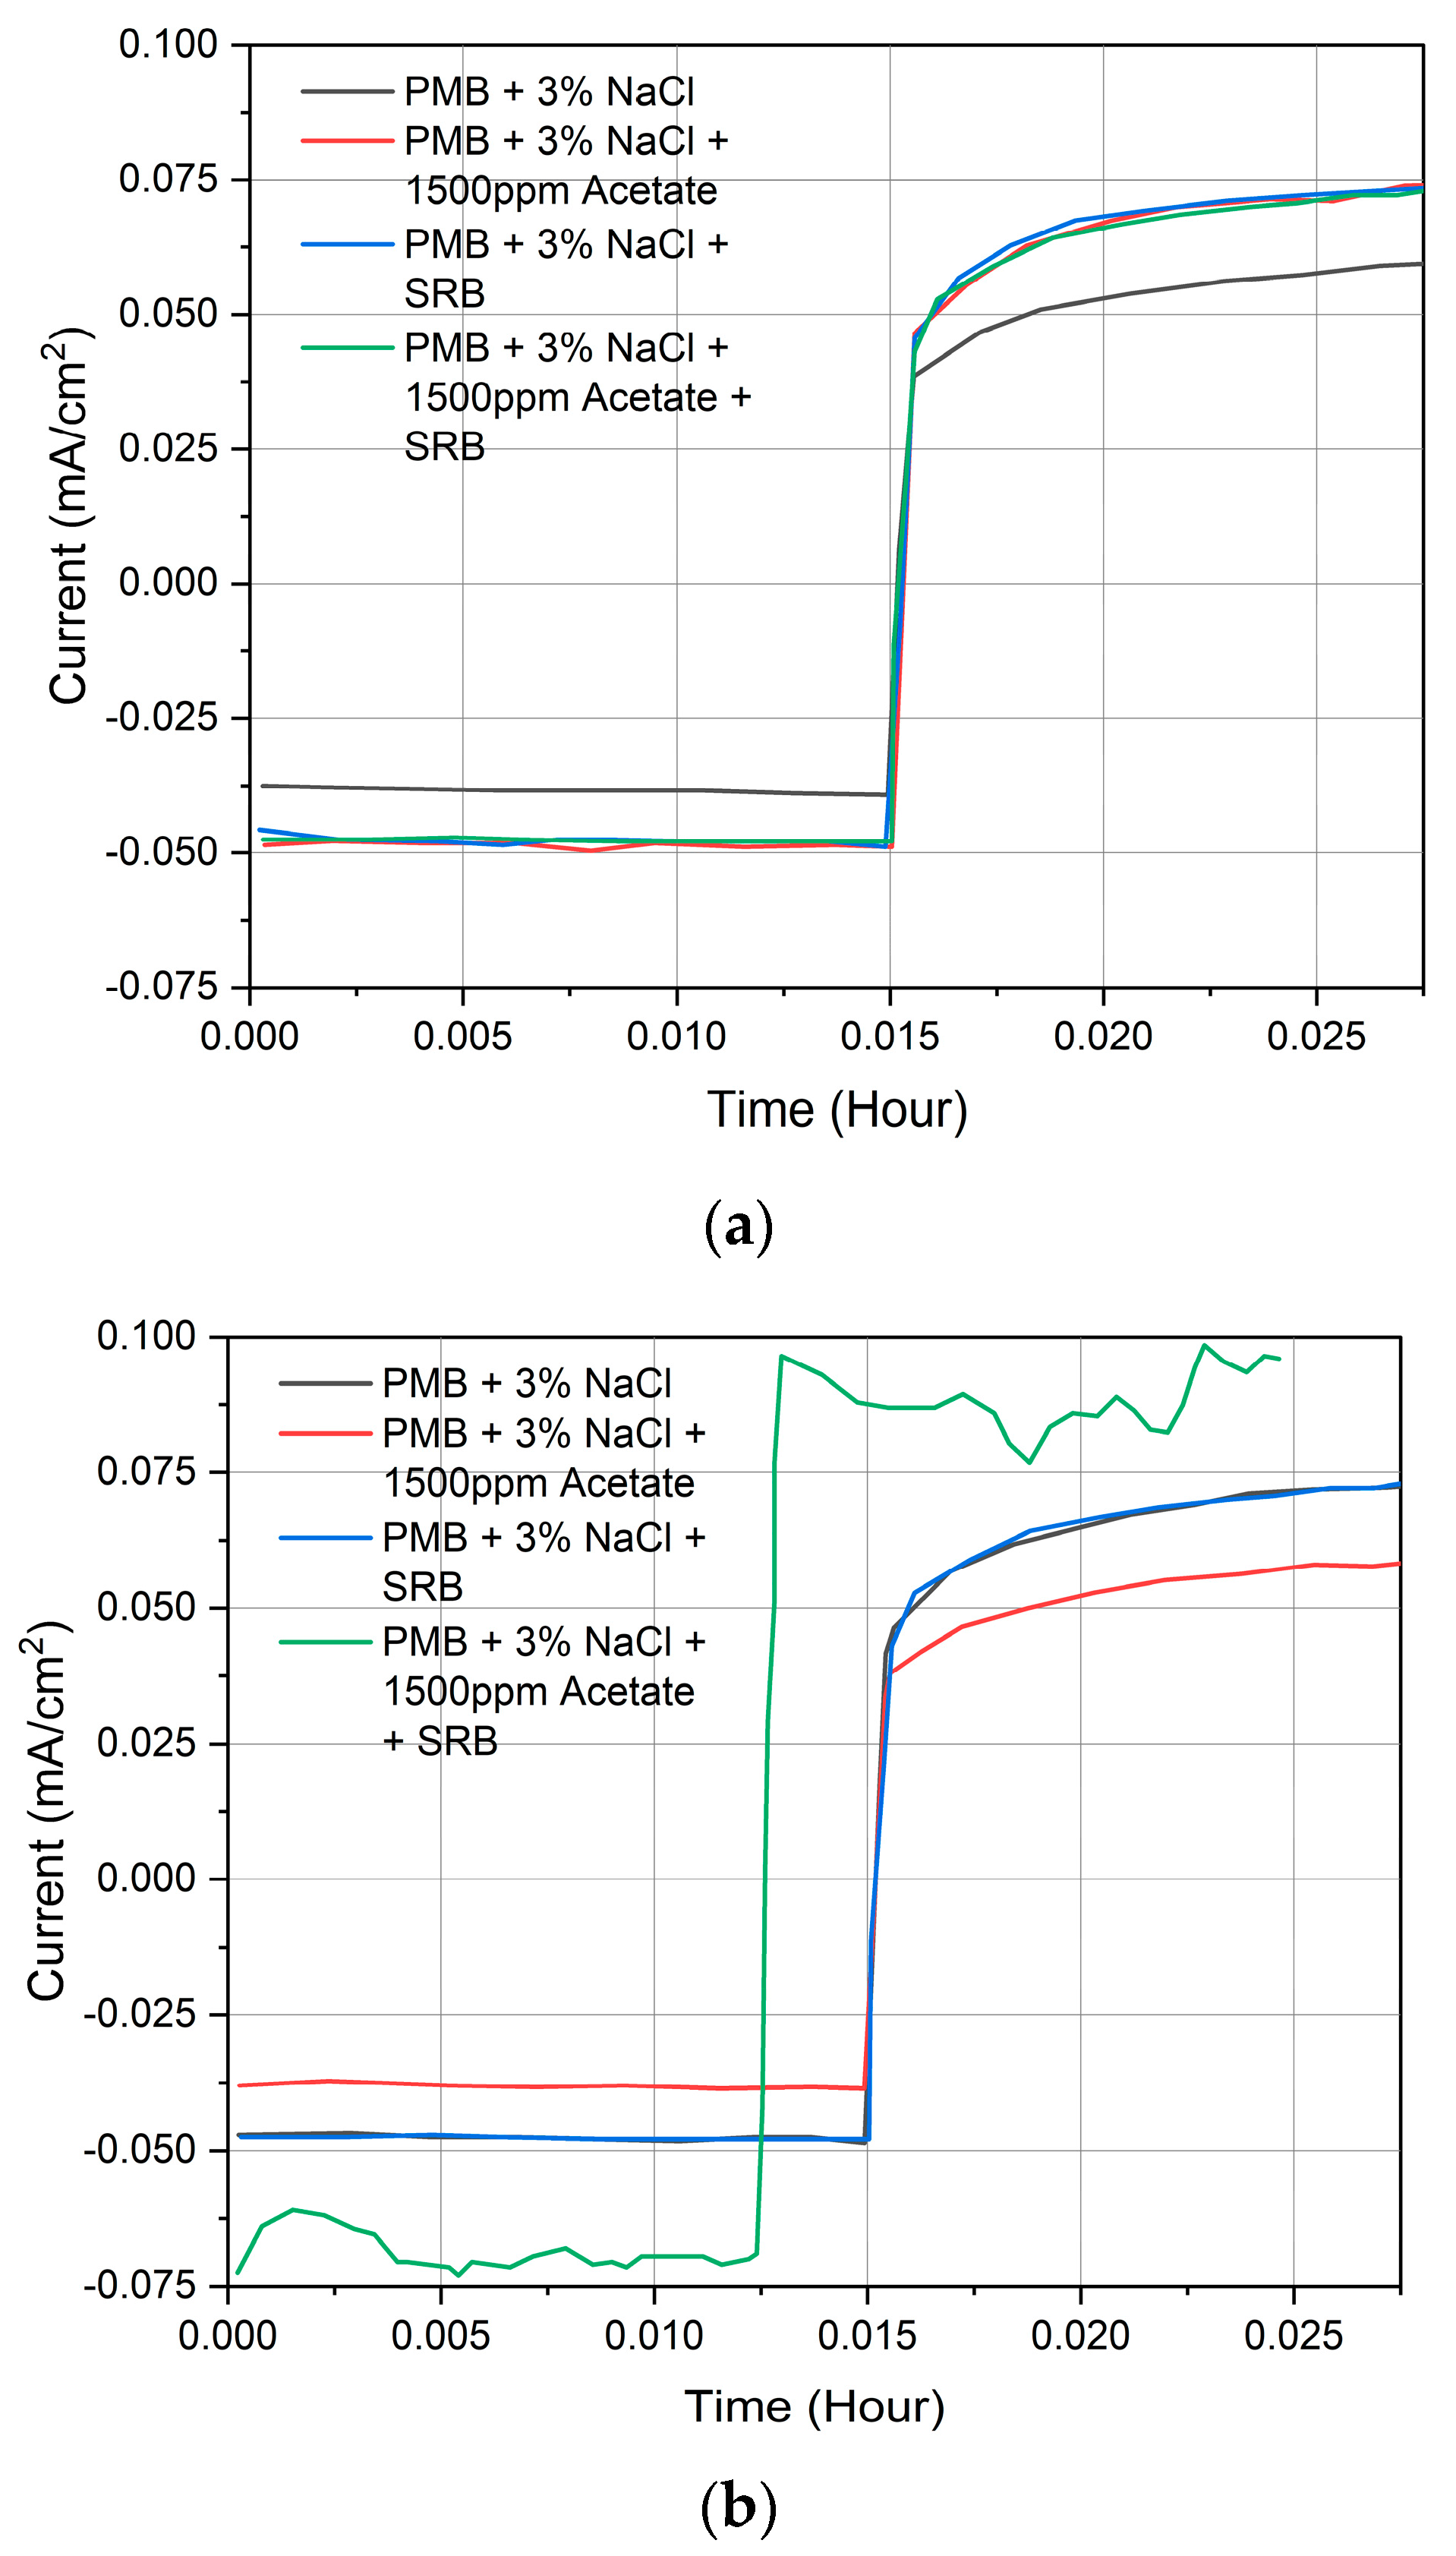
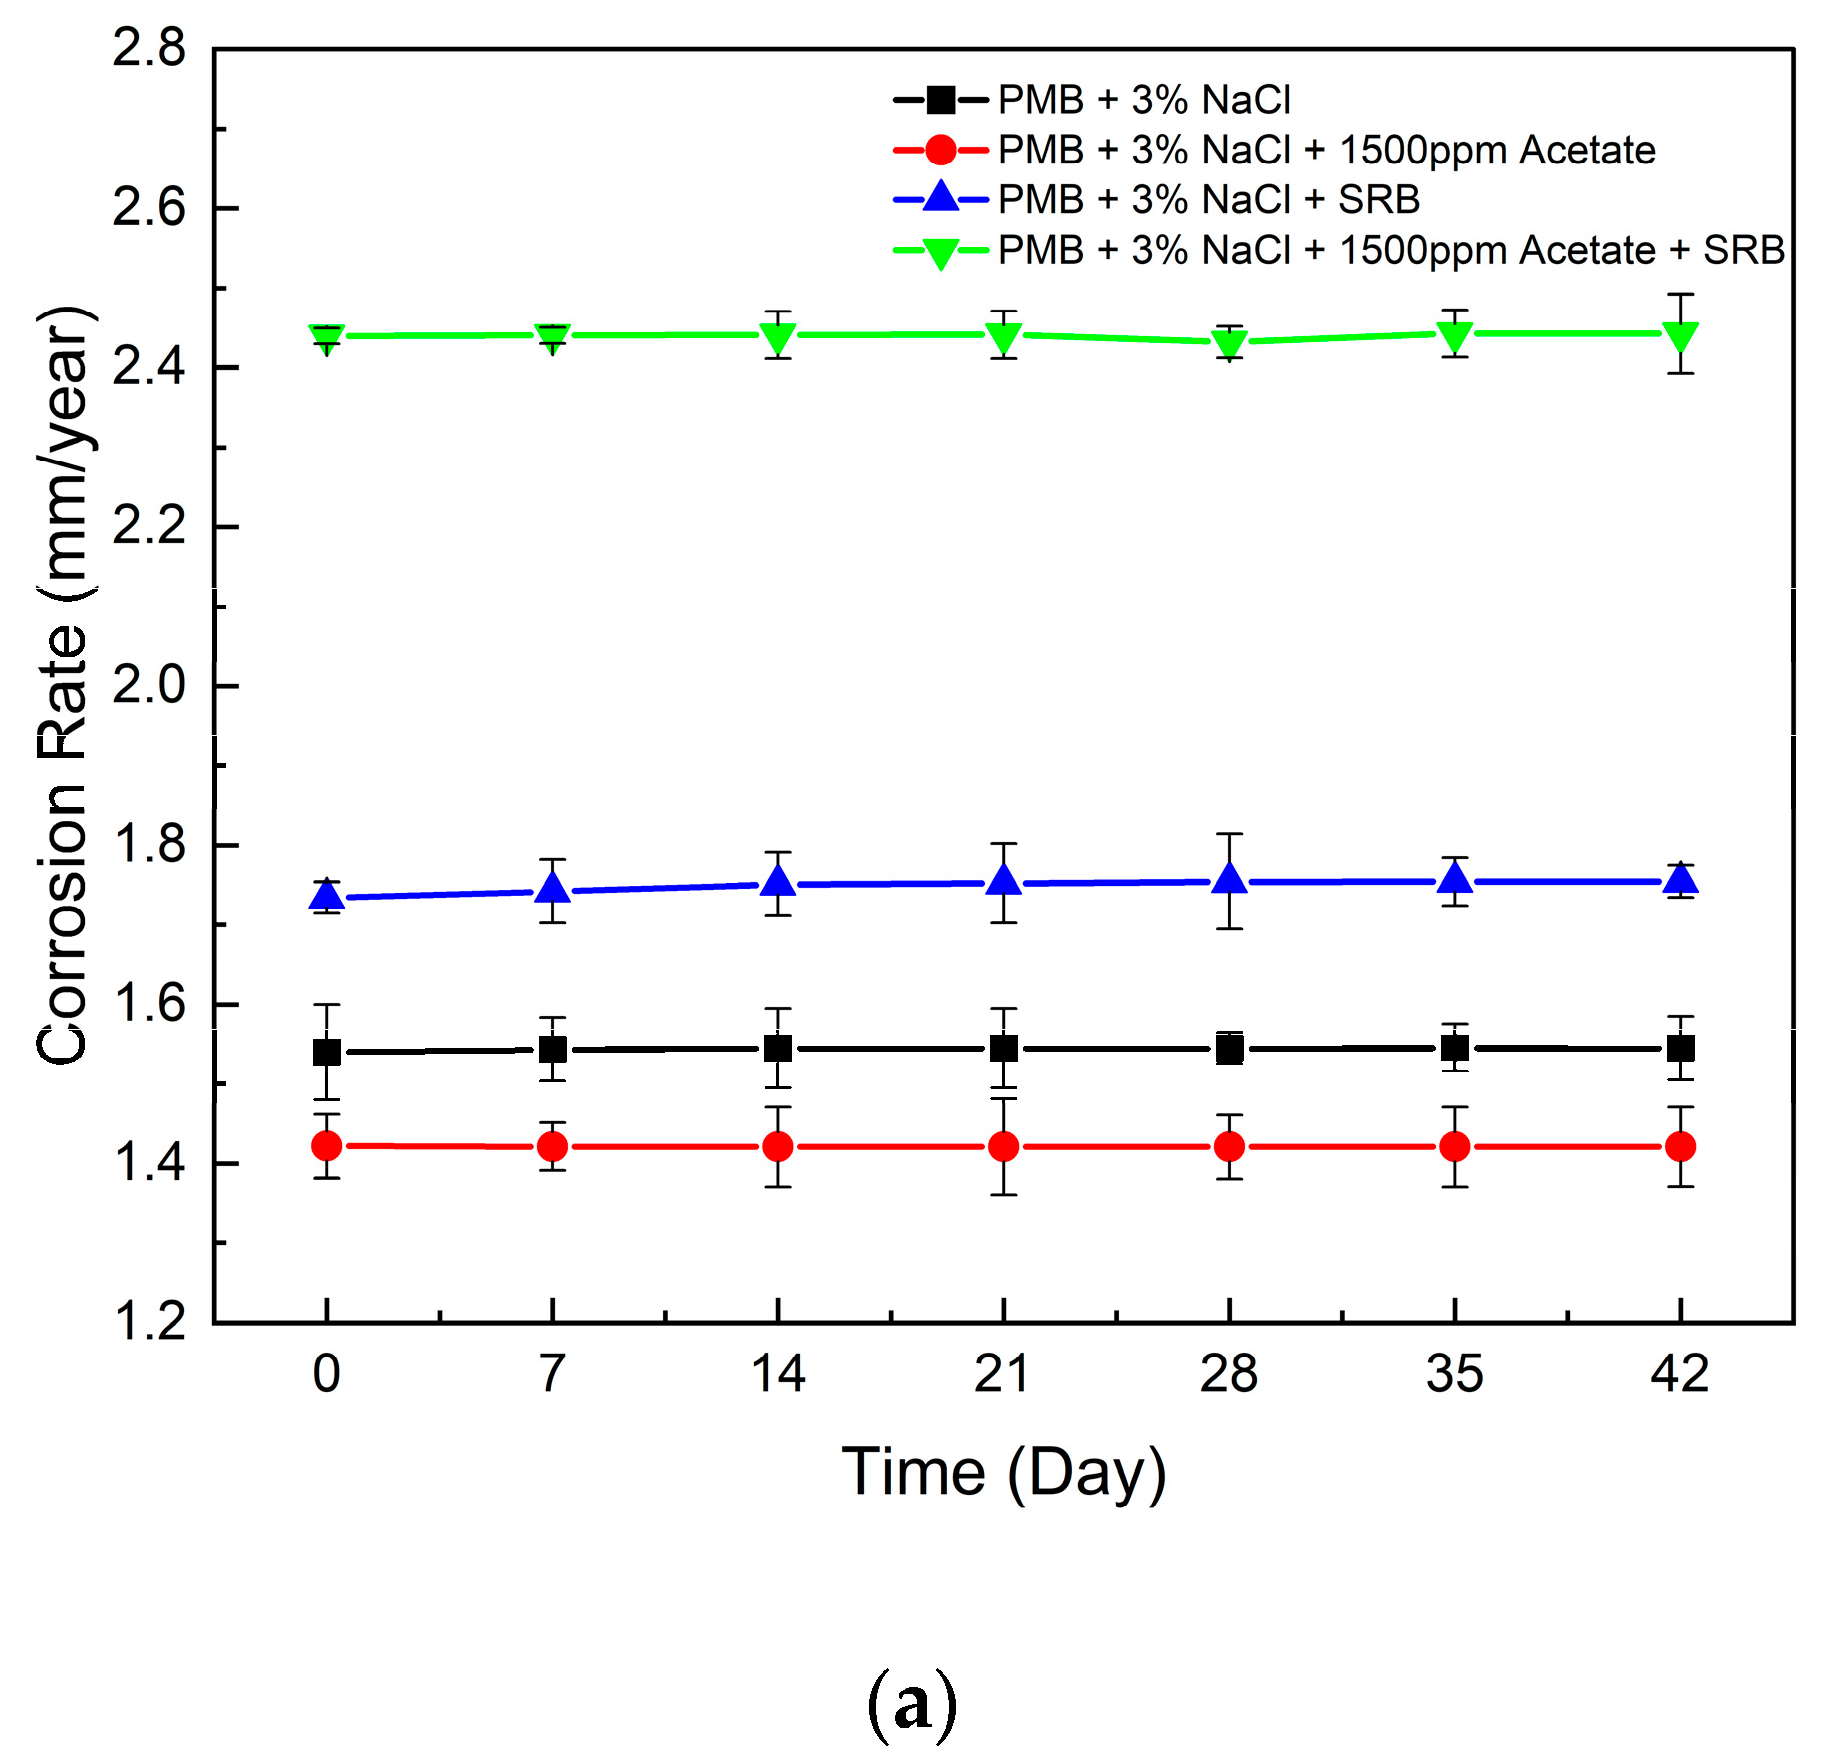
3.3. Corrosion Rate under Simulated Formation Water and Postgate Medium B in Saturated CO2: Case B

The overall LPR results for current (mA/cm2) vs. time (hour) are shown in Figure 12. Figure 13a shows the LPR corrosion rate vs. time for Case B and provides a visual representation of the variability in data points across the three trials conducted for this case. The presence of acetate decreased the corrosion rate by 8.8% (from 1.55 mm/year to 1.42 mm/year). However, with acetate and SRB, the corrosion rate increased to 32.9% (from 1.75 mm/year to 2.44 mm/year), corresponding to SRB kinetics producing corrosive byproducts, further speeding up the corrosion of the carbon steel.
Similar observations were found in the weight loss immersion test, as shown in Table 6, and Figure 13b provides a visual representation of the variability in data points across the three trials conducted for this case. The presence of acetate corrosion decreased the corrosion rate by 36.80% (from 0.74 mm/year to 0.51 mm/year). However, with acetate and SRB, the corrosion rate increased by 16.4% (from 1.12 mm/year to 1.32 mm/year). These findings demonstrate that acetate and SRB could significantly increase the severity of corrosion of carbon steel.

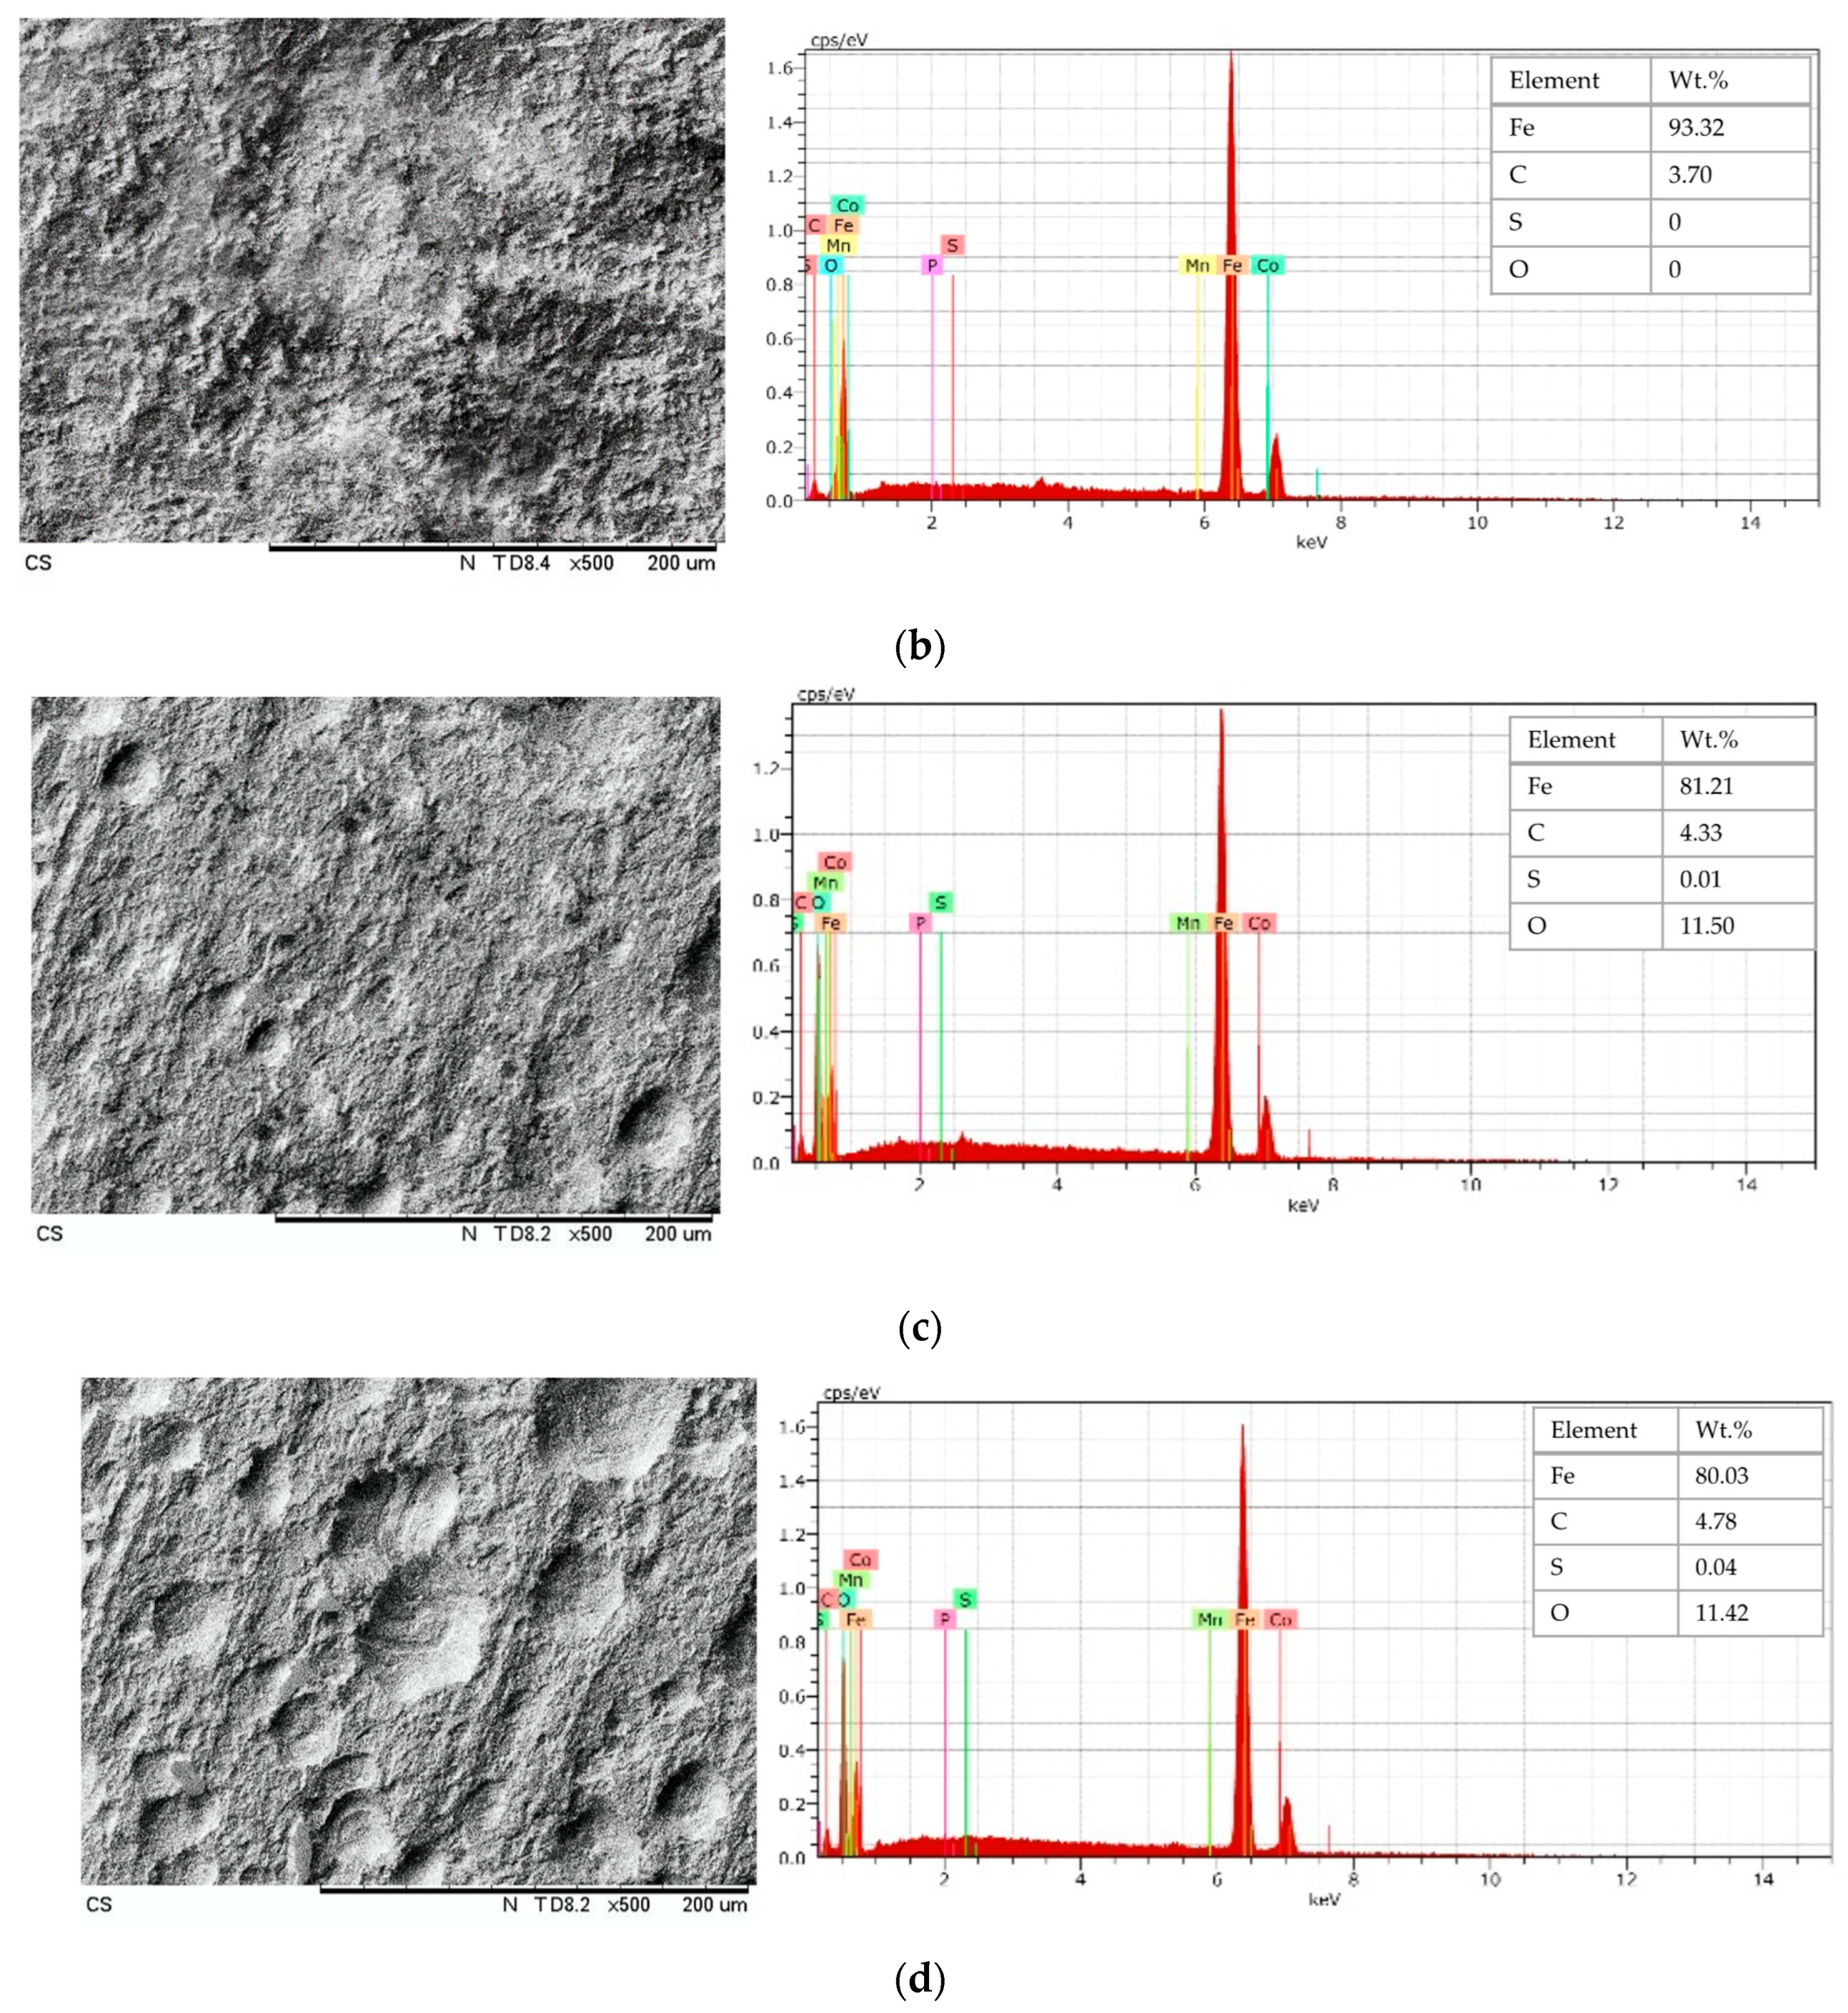
3.4. SEM Images and EDX Results: Case B

From the SEM images in Figure 14a,b, representing Test-1B and Test-2B, respectively, the formation of a black film of iron carbonate can be seen with 0% sulphur. However, as shown in the SEM image in Figure 14c, Test-3B pitting was detected on the surface of carbon steel, with 0.08% sulphur. In Figure 14d for Test-4B, the SEM image shows severe pitting as compared to that shown in Figure 14c, with 0.14% sulphur.

4. Discussion

The results of this study show that the presence of acetate in an SRB environment can significantly increase the corrosion rate of carbon steel. In Case A, the corrosion rate increased by 17.2% when acetate and SRB were present, and in Case B, the corrosion rate increased by 32.9%. This increase in the corrosion rate was due to the production of a corrosive byproduct, H2S, by SRB. This byproduct reacts with carbon steel to form FeS, which is corrosive [43].
Furthermore, the presence of acetate in the media enhanced SRB metabolism and resulted in more pronounced corrosion of the surface of carbon steel. Without SRB, adding acetate reduced the corrosion rate, as shown by the SEM image showing the surface of carbon steel with general corrosion and an FeCO3 film. A decrease in the corrosion rate indicates an inhibitive effect from acetate through a process called passivation involving the adsorption of acetate ions on the surface of carbon steel [44]. This result agrees with those of several investigators dealing with acetate ions’ effects on carbon steel [45].
The pitting and sulphur deposit on the surface of carbon steel, indicating the production of hydrogen sulphide as a byproduct of its metabolism reacting with the metal surface to form FeS [43]. It was observed that more sulphur deposits were detected via EDX in the PMB media, resulting in severe pitting on the carbon steel surface. Iron sulphide formation can lead to corrosion product deposition on the carbon steel surface layer, which further accelerates corrosion by allowing the penetration of a corrosive agent into the carbon steel substrate [46].
As described earlier, the presence of sulphur content deposited on the surface of carbon steel indicates hydrogen sulphide produced by SRB reacting with the surface of carbon steel to form FeS, which leads to pitting corrosion. This mechanism is due to the anaerobic respiration of SRB utilizing acetate through biochemical reactions in the bacteria cell. SRB use acetate as an electron donor and sulphate as an electron acceptor, converting them into hydrogen sulphide and carbon dioxide as end products. This reaction provides energy for the SRB to grow and carry out their metabolic activities.

5. Conclusions

This paper investigates the effect of acetate on MIC of internal pipeline surfaces. The following conclusions can be drawn:
(i)
The presence of acetate in the medium enhanced the metabolism of SRB and resulted in more pronounced corrosion of the surface of carbon steel.
(ii)
Without SRB, adding acetate reduced the corrosion rate.
(iii)
The pitting and sulphur deposit on the surface of carbon steel indicates that H2S is a byproduct of SRB metabolism and reacts with the carbon steel surface to form FeS.
(iv)
More sulphur deposit was detected in PMB media, resulting in severe pitting on the carbon steel surface.
(v)
FeS formation can lead to the deposition of corrosion products on the layer of the carbon steel surface, which can further accelerate corrosion by allowing the penetration of a corrosive agent into the carbon steel substrate.
(vi)
The mechanism of pitting corrosion is due to the anaerobic respiration of SRB utilizing acetate through biochemical reactions in the bacteria cell.
(vii)
SRB use acetate as an electron donor and sulphate as an electron acceptor, converting them into H2S and CO2 as end products. This reaction provides energy for the SRB to grow and carry out their metabolic activities.

Author Contributions

Conceptualization, M.R.I.; Methodology, M.R.I.; Validation, M.R.I.; Formal analysis, M.R.I.; Investigation, M.R.I. and S.Z.H.S.; Resources, M.C.I.; Writing—review and editing, M.R.I., S.Z.H.S. and M.C.I.; Supervision, S.Z.H.S. and M.C.I.; Writing—review and editing, S.Z.H.S. and M.C.I. All authors have read and agreed to the published version of the manuscript.

Funding

The Universiti Teknologi PETRONAS (UTP) helped fund this study.

Institutional Review Board Statement

Not applicable.

Informed Consent Statement

Not applicable.

Data Availability Statement

Data are contained within the article.

Conflicts of Interest

The authors declare no conflict of interest with respect to the research or publication of this work.

References

  1. Little, B.J.; Lee, J.S. Microbiologically Influenced Corrosion. In Kirk-Othmer Encyclopedia of Chemical Technology; Hoboken, N.J., Ed.; John Wiley & Sons, Inc.: Hoboken, NJ, USA, 2009. [Google Scholar] [CrossRef]
  2. Liu, T.; Cheng, Y.F.; Sharma, M.; Voordouw, G. Effect of fluid flow on biofilm formation and microbiologically influenced corrosion of pipelines in oilfield produced water. J. Pet. Sci. Eng. 2017, 156, 451–459. [Google Scholar] [CrossRef]
  3. Rebak, R.B.; Perez, T.E. Effect of carbon dioxide and hydrogen sulfide on the localized corrosion of carbon steels and corrosion resistant alloys. In CORROSION 2017; OnePetro: Richardson, TX, USA, 2017. [Google Scholar]
  4. Yazdi, M.; Khan, F.; Abbassi, R.; Quddus, N.; Castaneda-Lopez, H. A review of risk-based decision-making models for microbiologically influenced corrosion (MIC) in offshore pipelines. Reliab. Eng. Syst. Saf. 2022, 223, 108474. [Google Scholar] [CrossRef]
  5. Emmanuel, J.I.; Shaapere, T.T. Sulphate Reducing Bacteria SRB Control and Risk Based SRB Severity Ranking. In Abu Dhabi International Petroleum Exhibition & Conference; OnePetro: Richardson, TX, USA, 2018. [Google Scholar] [CrossRef]
  6. Houghton, J.; Fike, D.; Druschel, G.; Orphan, V.; Hoehler, T.M.; Marais, D.J.D. Spatial variability in photosynthetic and heterotrophic activity drives localized δ13Corg fluctuations and carbonate precipitation in hypersaline microbial mats. Geobiology 2014, 12, 557–574. [Google Scholar] [CrossRef]
  7. Little, B.J.; Lee, J.S. Microbiologically influenced corrosion. In Oil and Gas Pipelines; Wiley Online Library: New York, NY, USA, 2015; pp. 387–398. [Google Scholar]
  8. Van Aalst, J.A.; Isakov, R.; Polk, J.D.; Van Antwerp, A.D.; Yang, M.; Fratianne, R.B. Hydrogen sulfide inhalation injury. J. Burn Care Rehabil. 2000, 21, 248–253. [Google Scholar] [CrossRef] [PubMed]
  9. Thomas, C.J.; Edyvean, R.G.J.; Brook, R. Biologically enhanced corrosion fatigue. Biofouling 1988, 1, 65–77. [Google Scholar] [CrossRef]
  10. Cord-Ruwisch, R. Microbially Influenced Corrosion of Steel. In Environmental Microbe-Metal Interactions; Wiley Online Library: New York, NY, USA, 2000; pp. 159–173. [Google Scholar] [CrossRef]
  11. Reis, M.A.M.; Almeida, J.S.; Lemos, P.C.; Carrondo, M.J.T. Effect of hydrogen sulfide on growth of sulfate reducing bacteria. Biotechnol. Bioeng. 1992, 40, 593–600. [Google Scholar] [CrossRef]
  12. Hasnain, S.; Pirzada, S.H.A. Corrosion in oil and gas Industries: A review. ResearchGate. 2022. Available online: https://www.researchgate.net/publication/365650732_Corrosion_in_Oil_and_Gas_Industries_A_Review (accessed on 28 June 2023).
  13. Georgiadis, A.G.; Charisiou, N.; Yentekakis, I.V.; Goula, M.A. Hydrogen sulfide (H2S) removal via MOFs. Materials 2020, 13, 3640. [Google Scholar] [CrossRef]
  14. Cahn, R.S.; Dermer, O.C. Introduction to Chemical Nomenclature; Butterworth-Heinemann: Oxford, UK, 2013. [Google Scholar]
  15. Zhang, X.; Zhou, S.; Leonik, F.M.; Wang, L.; Kuroda, D.G. Quantum mechanical effects in acid–base chemistry. Chem. Sci. 2022, 13, 6998–7006. [Google Scholar] [CrossRef]
  16. Bhaduri, D.; Mandal, A.; Chakraborty, K.; Chatterjee, D.; Dey, R. Interlinked chemical-biological processes in anoxic waterlogged soil—A review. Indian J. Agric. Sci. 2017, 87, 1587–1599. [Google Scholar] [CrossRef]
  17. Sand, W. Microbial mechanisms of deterioration of inorganic substrates—A general mechanistic overview. Int. Biodeterior. Biodegrad. 1997, 40, 183–190. [Google Scholar] [CrossRef]
  18. Ohaeri, E.; Eduok, U.; Szpunar, J. Hydrogen related degradation in pipeline steel: A review. Int. J. Hydrog. Energy 2018, 43, 14584–14617. [Google Scholar] [CrossRef]
  19. AlAbbas, F.M.; Kakpovbia, A.; Olson, D.L.; Mishra, B.; Spear, J.R. The Role of Bacterial Attachment to Metal Substrate and Its Effects on Microbiologically Influenced Corrosion (MIC) in Transporting Hydrocarbon Pipelines. J. Pipeline Eng. 2012, 11, 131–144. [Google Scholar] [CrossRef]
  20. Kushkevych, I.; Dordević, D.; Vítězová, M. Possible synergy effect of hydrogen sulfide and acetate produced by sulfate-reducing bacteria on inflammatory bowel disease development. J. Adv. Res. 2021, 27, 71–78. [Google Scholar] [CrossRef]
  21. Colleran, E.; Finnegan, S.; Lens, P. Anaerobic treatment of sulphate-containing waste streams. Antonie Van Leeuwenhoek 1995, 67, 29–46. [Google Scholar] [CrossRef]
  22. Odom, J.M.; Peck, H.D., Jr. Hydrogenase, electron-transfer proteins, and energy coupling in the sulfate-reducing bacteria Desulfovibrio. Annu. Rev. Microbiol. 1984, 38, 551–592. [Google Scholar] [CrossRef] [PubMed]
  23. Selig, M.; Schäfer, T.; Schönheit, P. Acetyl-CoA synthetase (ADP forming) in archaea, a novel enzyme involved in acetate formation and ATP synthesis. Arch. Microbiol. 1993, 159, 72–83. [Google Scholar] [CrossRef]
  24. Bose, S.; Ramesh, V.; Locasale, J.W. Acetate metabolism in physiology, cancer, and beyond. Trends Cell Biol. 2019, 29, 695–703. [Google Scholar] [CrossRef]
  25. Ling, R.; Chen, G.; Tang, X.; Liu, N.; Zhou, Y.; Chen, D. Acetyl-CoA synthetase 2 (ACSS2): A review with a focus on metabolism and tumor development. Discov. Oncol. 2022, 13, 58. [Google Scholar] [CrossRef]
  26. Pike, L.; Smift, A.; Croteau, N.J.; Ferrick, D.A.; Wu, M. Inhibition of fatty acid oxidation by etomoxir impairs NADPH production and increases reactive oxygen species resulting in ATP depletion and cell death in human glioblastoma cells. Biochim. Et Biophys. Acta Bioenerg. 2011, 1807, 726–734. [Google Scholar] [CrossRef]
  27. Cao, J.; Zhang, G.; Mao, Z.-S.; Li, Y.; Fang, Z.; Yang, C. Influence of electron donors on the growth and activity of sulfate-reducing bacteria. Int. J. Miner. Process. 2012, 106, 58–64. [Google Scholar] [CrossRef]
  28. Farhat, H. A Case Study of Soil-Side Corrosion of Aboveground Storage Tanks in the Middle East. In CORROSION 2018; OnePetro: Richardson, TX, USA, 2018. [Google Scholar]
  29. Sar, M.H.; Barrak, O.S.; Al-Adili, A.S.; Hussein, S.K.; Hussein, A.K. Study the effect of filer material on microstructure of welding the carbon steel in shielded metal arc welding. J. Mech. Eng. Res. Dev. 2020, 43, 408–416. [Google Scholar]
  30. Ahmad, M.; Arifin, A.; Abdullah, S.; Jusoh, W.; Singh, S. Fatigue crack effect on magnetic flux leakage for A283 grade C steel. Steel Compos. Struct. 2015, 19, 1549–1560. [Google Scholar] [CrossRef]
  31. Liu, H.; Chen, C.; Yuan, X.; Tan, Y.; Meng, G.; Liu, H.; Cheng, Y.F. Corrosion inhibition behavior of X80 pipeline steel by imidazoline derivative in the CO2-saturated seawater containing sulfate-reducing bacteria with organic carbon starvation. Corros. Sci. 2022, 203, 110345. [Google Scholar] [CrossRef]
  32. Marais, T.S.; Huddy, R.J.; Van Hille, R.P.; Harrison, S.T.L. Effect of temperature change on the performance of the hybrid linear flow channel reactor and its implications on sulphate-reducing and sulphide-oxidising microbial community dynamics. Front. Bioeng. Biotechnol. 2022, 10, 908463. [Google Scholar] [CrossRef] [PubMed]
  33. Tanner, R.S. Monitoring sulfate-reducing bacteria: Comparison of enumeration media. J. Microbiol. Methods 1989, 10, 83–90. [Google Scholar] [CrossRef]
  34. Green, A.A. The Preparation of Acetate and Phosphate Buffer Solutions of Known PH and Ionic Strength. J. Am. Chem. Soc. 1933, 55, 2331–2336. [Google Scholar] [CrossRef]
  35. Lynch, T.P.; Bihl, D.E.; Johnson, M.; Maclellan, J.A.; Piper, R.K. Hanford Radiological Protection Support Services Annual Report for 2000; Pacific Northwest National Lab. (PNNL): Richland, WA, USA, 2001. [Google Scholar] [CrossRef]
  36. Missoum, A. Methods for Isolation and Identification of Microorganisms. In Microbial Systematics: Taxonomy, Microbial Ecology, Diversity; CRC Press: Boca Raton, FL, USA, 2020; pp. 28–50. [Google Scholar] [CrossRef]
  37. Anita, N.; Joany, R.M.; Dorothy, R.; Aslam, J.; Rajendran, S.; Subramania, A.; Singh, G.; Verma, C. Linear polarization resistance (LPR) technique for corrosion measurements. In Electrochemical and Analytical Techniques for Sustainable Corrosion Monitoring; Elsevier: Amsterdam, The Netherlands, 2023; pp. 59–80. [Google Scholar]
  38. Adnan, M.A.; Kee, K.-E.; Raja, P.B.; Ismail, M.C.; Kakooei, S. Influence of Heat Treatment on the Corrosion of Carbon Steel in Environment Containing Carbon Dioxide and Acetic Acid. IOP Conf. Ser. Mater. Sci. Eng. 2018, 370, 012039. [Google Scholar] [CrossRef]
  39. Badea, G.E.; Caraban, A.; Sebesan, M.; Dzitac, S.; Cret, P.; Setel, A. Polarisation measurements used for corrosion rates determination. J. Sustenable Energy 2010, 1, 1–4. [Google Scholar]
  40. Angst, U.; Büchler, M. A new perspective on measuring the corrosion rate of localized corrosion. Mater. Corros. 2020, 71, 808–823. [Google Scholar] [CrossRef]
  41. Crozier, B.; Been, J.; Tsaprailis, H.; Place, T.D. Long term evaluation of microbial induced corrosion contribution to underdeposit sludge corrosivity in a heavy crude oil pipeline. In CORROSION 2013; OnePetro: Richardson, TX, USA, 2013. [Google Scholar]
  42. Zhao, R.; Wang, B.; Li, D.; Chen, Y.; Zhang, Q. Effect of sulfate-reducing bacteria from salt scale of water flooding pipeline on corrosion behavior of X80 steel. Eng. Fail. Anal. 2022, 142, 106788. [Google Scholar] [CrossRef]
  43. Pourmadadi, M.; Mirshafiei, M.; Yazdian, F.; Rasekh, B.; Zamani, M.; Mansouri, A.; Rahdar, A.; Pandey, S. A study on the microbial biocorrosion behavior of API 5 L X65 carbon steel exposed to seawater. Environ. Prog. Sustain. Energy 2023, e14210. [Google Scholar] [CrossRef]
  44. Kahyarian, A.; Schumaker, A.; Brown, B.; Nesic, S. Acidic corrosion of mild steel in the presence of acetic acid: Mechanism and prediction. Electrochim. Acta 2017, 258, 639–652. [Google Scholar] [CrossRef]
  45. Hedges, B.; McVeigh, L. The role of acetate in CO2 corrosion: The double whammy. In CORROSION 1999; OnePetro: Richardson, TX, USA, 1999. [Google Scholar]
  46. Davis, J. Introduction to Surface Engineering for Corrosion and Wear Resistance; ASM International: Detroit, MI, USA, 2001; pp. 1–10. [Google Scholar] [CrossRef]
Figure 1. The metabolism of SRB and acetate.
Metals 13 01974 g001
Figure 2. SEM image of carbon steel plate A283 Grade C.
Metals 13 01974 g002
Figure 3. (a) SRB-Bart Kit and (b) SRB detection indicator.
Metals 13 01974 g003
Figure 4. Serial dilution technique.
Metals 13 01974 g004
Figure 5. Spread plate technique.
Metals 13 01974 g005
Figure 6. Streak plate technique.
Metals 13 01974 g006
Figure 9. LPR graphs for Case A: (a) day 0 and (b) day 42.
Metals 13 01974 g009
Figure 10. (a) LPR corrosion rate and (b) weight loss corrosion rate for Case A.
Metals 13 01974 g010aMetals 13 01974 g010b
Figure 11. SEM images for Case A: (a) Test-1A, (b) Test-2A, (c) Test-3A, and (d) Test-4A.
Metals 13 01974 g011aMetals 13 01974 g011b
Figure 12. LPR graphs for Case B: (a) day 0 and (b) day 42.
Metals 13 01974 g012
Figure 13. (a) LPR corrosion rate and (b) weight loss corrosion rate for Case B.
Metals 13 01974 g013aMetals 13 01974 g013b
Figure 14. SEM images for Case B: (a) Test-1B, (b) Test-2B, (c) Test-3B, and (d) Test-4B.
Metals 13 01974 g014aMetals 13 01974 g014b
Table 1. Chemical composition of carbon steel plate A283 Grade C.
ElementCSiMnPSCu (min)
Content (%)0.240.15–0.400.900.0350.040.20
Table 2. Physical properties of carbon steel plate A283 Grade C.
MaterialYield Strength ksi (Mpa)Tensile Strength ksi (Mpa)Elongation 8 InchElongation 2 Inch
A283 Grade C30 (205)55–75 (380–515)2225
Table 3. Test matrix for Case A and Case B.
ParametersDescriptions
Working electrode Carbon steel A283 Grade C
Duration42 days
Size of sample 10 mm × 10 mm × 5 mm
Pressure Atmospheric pressure (constant)
Temperature (°C)25
Solutions for Case ATest-1A: 3% NaCl with CO2
Test-2A: 3% NaCl + 1500 ppm acetate with CO2
Test-3A: 3% NaCl + SRB with CO2
Test-4A: 3% NaCl + 1500 ppm acetate + SRB with CO2
Solutions for Case BTest-1B: PMB + 3% NaCl with CO2
Test-2B: PMB + 3% NaCl + 1500 ppm acetate with CO2
Test-3B: PMB + 3% NaCl + SRB with CO2
Test-4B: PMB + 3% NaCl + 1500 ppm acetate + SRB with CO2
Sample type (working electrode) The surface was finished with SiC paper with grits of 80, 120, 240, 320, 400, and 600.
Table 5. Corrosion rate for Case A in carbon steel A283 Grade C according to weight loss method test (the values in the parentheses represent standard deviation among the three tests conducted).
Weight (g)Test-1ATest-2ATest-3ATest-4A
Before4.58 (±0.05)4.45 (±0.03)4.67 (±0.03)4.86 (±0.01)
After4.21 (±0.05)4.21 (±0.05)4.21 (±0.04)4.31 (±0.03)
Weight loss 0.37 (±0.02)0.23 (±0.04)0.45 (±0.04)0.54 (±0.02)
Corrosion rate (mm/year)0.83 (±0.04)0.52 (±0.05)1.01 (±0.02)1.20 (±0.05)
Table 6. Corrosion rate for Case B in carbon steel A283 Grade C according to weight loss method test (the values in the parentheses represent standard deviation among the three tests conducted).
Weight (g)Test-1BTest-2BTest-3BTest-4B
Before4.70 (±0.05)4.76 (±0.03)4.99 (±0.03)4.65 (±0.01)
After4.36 (±0.05)4.52 (±0.05)4.48 (±0.04)4.05 (±0.03)
Weight loss0.33 (±0.02)0.23 (±0.03)0.50 (±0.04)0.59 (±0.02)
Corrosion rate (mm/year)0.74 (±0.04)0.51 (±0.05)1.12 (±0.02)1.32 (±0.05)
Disclaimer/Publisher’s Note: The statements, opinions and data contained in all publications are solely those of the individual author(s) and contributor(s) and not of MDPI and/or the editor(s). MDPI and/or the editor(s) disclaim responsibility for any injury to people or property resulting from any ideas, methods, instructions or products referred to in the content.

