Article

Investigation on Optical Absorption and Reflection of Carbon Nanotubes Mixed Copper Composites for Laser Sintering Process Improvement

I-Form Advanced Manufacturing Research Centre, School of Mechanical and Manufacturing Engineering, Dublin City University, D09 V209 Dublin, Ireland
*
Author to whom correspondence should be addressed.
Metals 2023, 13(12), 1984; https://doi.org/10.3390/met13121984
Submission received: 24 October 2023 / Revised: 23 November 2023 / Accepted: 28 November 2023 / Published: 7 December 2023
(This article belongs to the Special Issue Advances in Additive Manufacturing and Their Applications)

Abstract

:
Selective laser sintering (SLS) of copper components manufactured via powder metallurgy is widely studied due to minimal material wastage. However, copper has poor optical absorption when exposed to infrared (IR) lasers, such as in laser-based additive manufacturing or laser surface processing. To address this issue, an innovative approach to enhance the optical absorption of copper powders during infrared laser sintering is presented in this study. Carbon nanotubes (CNTs) have several unique properties, including their high surface area, plasmonic response, excellent conductivity, and optical absorption properties. CNTs were mixed with copper powders at different weight percentages using an acoustic method. The resulting Cu-CNT compositions were fabricated into pellets. The Box-Behnken Design of Experiments methodology was used to optimize the IR laser processing conditions for sintering. Spectroscopic analysis was conducted to evaluate the reflection and thermal absorption of the IR wavelengths by the Cu-CNT composites. Density and hardness measurements were taken for the laser-sintered Cu-CNT pellets. The coating of copper powders with CNTs demonstrated enhanced optical absorption and correspondingly reduced reflection. Due to the enhanced optical absorption, increased control and sensitivity of the laser sintering process was achieved, which enabled improvement in the mechanical properties of strength, hardness, and density, while also enabling control over the composite thermal expansion coefficient. A maximum average hardness of 66.5 HV was observed. Indentation test results of the samples revealed maximum tangential and radial stresses of 0.148 MPa and 0.058 Mpa, respectively.

1. Introduction

Copper is one of the widely utilized metals providing high thermal and electrical conductivities. The mechanical properties of copper include malleability and ductility, which enable the applicability of copper in a wide range of industrial applications. The most common applications of copper are engine ejectors, variable-geometry convergent-divergent valves, electrical switches, linings for combustion chambers, electronic packages, contact breakers, cooling structures, heat exchangers, spinning neutron targets, and integrated circuits [1,2,3,4,5,6,7]. Powder metallurgy is one of the widely used techniques for manufacturing copper components. In powder metallurgy, copper powder contained in custom-made dies is compacted under high pressure. Compacted components are post-processed using conventional high-temperature furnace sintering.
The laser sintering of metals is a relatively new focus for manufacturing copper parts [8,9]. In addition to defining the overall quality of a part, design considerations such as minimum feature size, support generation, and stress concentrations can increase production time, quality, finishing looks, energy consumption, and cost [10]. It is also possible to create more complex designs with laser sintering in comparison to traditional manufacturing technologies like machining and casting [11]. However, when laser sintering is performed in the infrared region, high laser power is required. The high optical reflectivity of copper and low absorption make the material being processed susceptible to laser damage. To overcome this challenge, nanotechnology is becoming increasingly popular as nanoscale structures offer unique properties. The addition of carbon nanotubes in copper powder for enhancing laser sintering has been recently examined [12,13]. Besides mechanical and electrical properties, the addition of carbon nanotubes in copper can reduce the reflection of the composite over that of pure copper powder. Carbon nanotubes contain high surface-covering properties as well as high thermal and electrical conductivity. This causes the matrix reinforcement to coalesce into a rigid substance [14]. Metal matrix composites (MMCs) have found extensive usage in a variety of areas, including the aerospace, automotive, and structural industries, due to their excellent mechanical, tribological, electrical, and thermal qualities [15,16]. The benefits of MMCs include improved strength-to-density ratios, strong resistance to wear, corrosion, radiation, and fatigue, lower creep rates, coefficients of thermal expansion, no moisture absorption, noninflammability, and increased electrical and thermal conductivities [17,18].
To achieve consistent dispersion of CNTs in the copper powder, various techniques have been reported in the literature, such as surface chemical oxidation [19], shear mixing [20], ultra-sonication [21], and the use of surfactants [22]. Ball milling is a commonly used technique to disperse reinforcements in metal-based nanocomposites and to avoid agglomeration issues. However, this technique frequently includes cold welding, fracture, and re-welding of powder particles, which may result in restricted CNT reinforcement into the metal matrix [23]. It has been reported in the literature that the pre-treatment of CNTs, mill type, milling speed, ball-to-powder ratio, and milling duration are some of the process factors that affect the efficiency of distributing CNTs uniformly in metal-based composites [24]. Several investigations have reported on the effectiveness of grinding on the dispersion of CNTs in metal matrixes. Additionally, the mechanical binding of CNTs into the metal matrix strengthens the connection between the metal and the CNTs [25,26]. Despite all of its benefits, several researchers have suggested that ball milling deteriorates and causes damage to CNTs [26,27,28,29,30]. A relatively new technique known as resonant acoustic powder metallurgy has been developed, and it allows for the efficient mixing of reinforcement within the matrix [31].
In the current studies, CNTs of different weight percentages were mixed in copper powder using the acoustic mixing technique. Cu-CNTs composites were compacted via cold isostatic hydraulic pressing to form pellets. The optical behavior of Cu-CNTs was examined via spectroscopy, and a comparison with pure copper was drawn. Compacted Cu-CNTs pellets were exposed to an infrared laser to investigate the effects of laser sintering on the pellets using a custom-built rig to avoid contamination and oxidation. While previous studies have examined the production of Cu-CNTs, very few have examined the possibility of laser sintering as opposed to furnace sintering. This study, therefore, fills this gap via an examination of the effect of process parameters on the resulting MMC strength, hardness, and density.

2. Materials and Methods

2.1. Copper Powder Mixing with CNTs, Fourier Transform Infrared (FTIR) Spectroscopy, and Pellet Production

In this work, commercially available spherical-type copper powders purchased from Sigma-Aldrich Ireland County Wicklow were used to fabricate the sample pellets for enhanced optical absorption investigations. A schematic of the workflow is shown in Figure 1. The purity of the copper powder was 98%, and the particle size was 10–25 μm with a D50 of 12.6 μm and a D90 of 23.2 μm. To enhance the optical absorption of copper powders, single-walled carbon nanotubes (SWCNTs) were added to the copper powder at 0.2, 0.4, and 0.6 wt.%. The SWCNTs had >95 wt.% purity with an outer diameter of >50 nm. Additional technical and physical properties of the copper powders and carbon nanotubes used for sample preparation are listed in Table 1. For the mixing of copper and CNT powders, a Resodyn Lab RAM acoustic mixer was used. The mixing was performed for 3 min at 20 g. Following the powder mixing, a spectroscopic evaluation was conducted on the samples to examine the reflection and absorption of the Cu-CNTs composite. The acoustic mixing was performed by placing powder into a container and applying the acoustic mixing phenomenon.
In this study, an Autotouch 40-ton hydraulic press was used to compact the Cu-CNTs powder to form 2 mm thick and 20 mm diameter pellets. A pressure of 793 MPa was applied to the powder for 9 min following previous studies (see [32]). The optical reflection of the pure copper and Cu-CNTs was analyzed using a Perkin Elmer Spectrum Two FTIR. In this study, a Box-Behnken design was employed to examine the impact of three factors on the porosity of copper-CNTs (carbon nanotube) composites produced by laser sintering. The Box-Behnken design was chosen to permit the investigation of the main effects and two-way interactions of the three factors, as well as to estimate the experimental error. The resulting data were employed to develop a mathematical model to analyze the fabrication process and to analyze the porosity of the composite material. The three factors, namely laser power, CNTs concentration, and laser scan speed, were varied at three levels each using 12 unique runs and 5 repetitions; see Table 2. A total of 17 samples were fabricated using compaction. The levels for the laser power were set at 300 W, 350 W, and 400 W, whilst the CNTs concentration levels mixed with copper powder were 0.2 wt.%, 0.4 wt.%, and 0.6 wt.%. The levels for laser scan speed were set at 1 mm/s, 1.5 mm/s, and 2 mm/s. The response variables were the relative density and hardness, as well as the tangential and radial strengths of the composite material.

2.2. Laser Processing

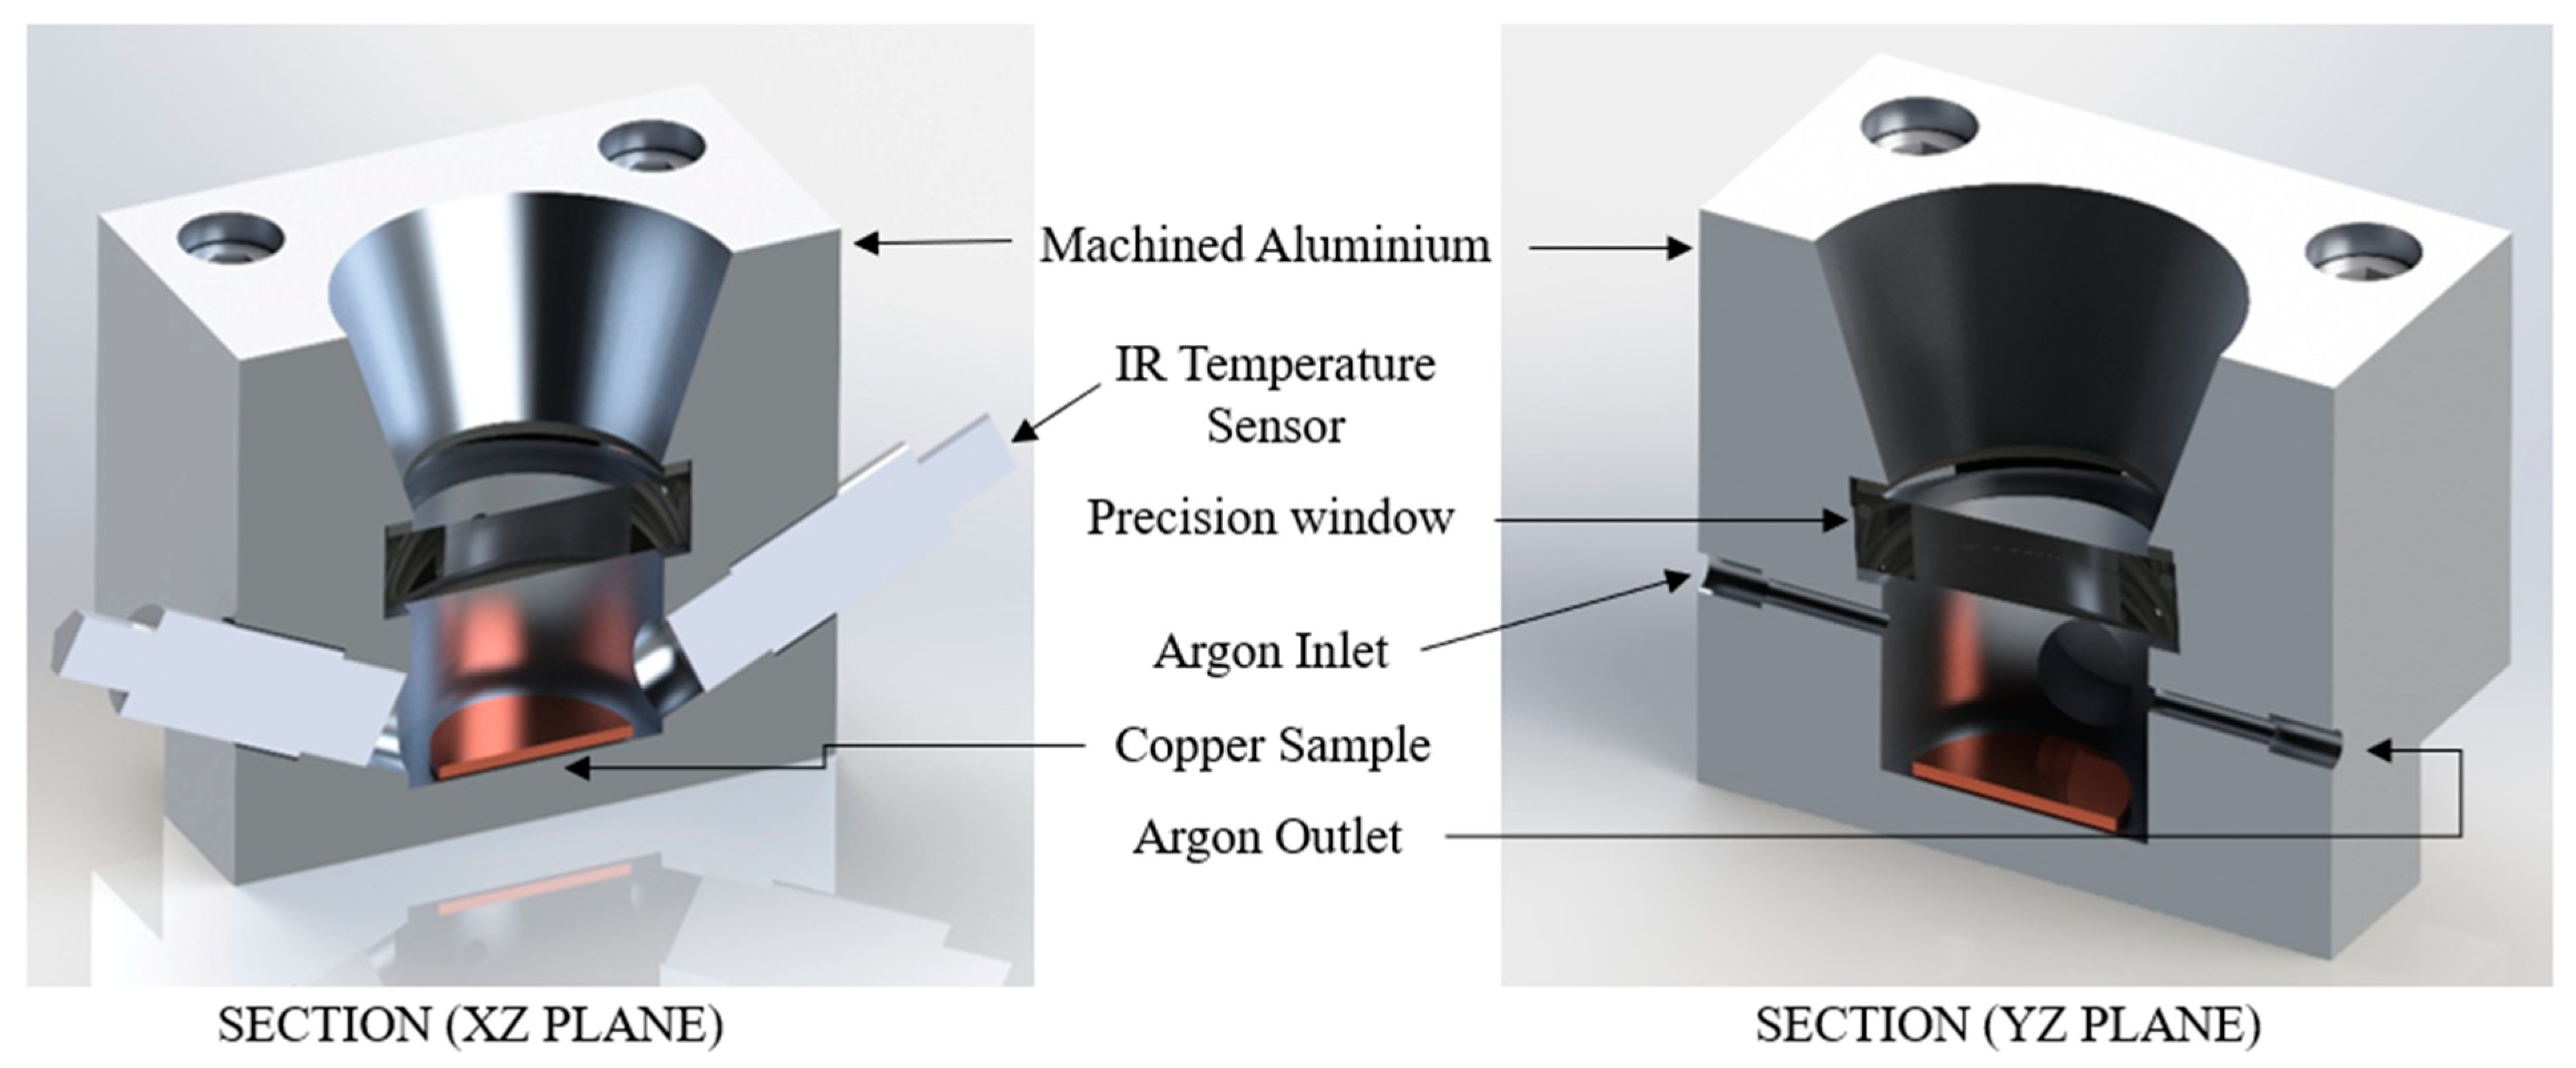
To perform the laser sintering of Cu-CNTs pellets, a specially designed sintering chamber was used, which is referred to as the laser sintering rig. This rig was equipped with an IPG fiber laser having a wavelength of 1068 nm and 1000 W power. Temperature sensors were installed in the rig to monitor the sintering temperature, and gas connections were provided to maintain an argon gas environment during the sintering process. A schematic of the laser sintering chamber is shown in Figure 2. To monitor the sintering temperature, infrared temperature sensors (Calex PMU21) were mounted on the laser sintering rig. A UVFS Broadband Precision window of 1050 nm with an anti-reflection coating from Thorlabs was used to allow the laser beam to irradiate the sample while keeping the argon gas in the chamber. Two input and output connections for argon gas were provided to prevent contamination and oxidation during the sintering process.
According to the DoE provided in Table 2, for laser sintering, a fixed laser spot size of 5 mm was used, and the laser power varied from 300 W to 400 W. The scan speed was set at 1, 1.5, and 2 mm/s. Overall, the specially designed laser sintering rig provided a controlled environment for the sintering of Cu-CNTs pellets, with precise monitoring of the sintering temperature and the provision of an argon gas environment to prevent contamination and oxidation. These laser sintering parameters ranges were carefully selected after initial trials to ensure that optimum values could be determined for optimal sintering of the Cu-CNTs pellets.

2.3. Density Measurement

The density of the Cu-CNTs sintered sample was measured using the Archimedes principle [33]. The principle involves measuring the mass of an object in air and liquid and then using the resulting values to calculate the density and porosity of the sample. The mathematical equation for density calculations is presented in Equations (1) and (2) and was used to calculate the percent porosity of the sintered samples.
ρ s = m a ρ l m a m l
ϕ % = ρ s ρ C u C × 100
Here, ρ s and ρ l denote the resulting density of the sample and liquid medium, respectively, m a is the mass of the sample in air, and m l is the mass of samples in the liquid. In Equation (2), ϕ is the percentage porosity, whereas ρ C u C denotes the density of Cu-CNTs. Once the density of the sample was determined, the percentage porosity ( ϕ % ) values were determined for each sample based on three separate measurements.

2.4. Hardness Measurement

The Vickers hardness method was used to evaluate the resilience of samples to mechanical deformation [34]. An indenter with diamond-pyramid-square shapes and enclosed 136° angles between the vertex faces were used for hardness measurements. The indenter was pressed into the samples for 20 s with an indentation force of 9.81 N, and the resulting diagonal lengths were measured. From these lengths, the Vickers Pyramid Number (HV) was calculated using Equation (3):
H V = 1.854   P d 2
Here, HV donates the Vickers Pyramid number, P represents the load in Newtons, and d is the mean diagonal of the indentation. To obtain hardness values, five separate places on the samples were tested. To remove any ambiguity, three hardness values were measured for each location on the sample, and the results were averaged.
Additionally, the samples were characterized using indentation testing with a 5 mm protrusion indenter and a loading velocity of 1 mm/min using the Zwick Roell, (Z005, T1-FR005TN.A50) UK universal testing equipment. Equations (4) and (5) were used to determine the radial stress ( σ r ) and tangential stress ( σ t ).
σ r = 3 F 2 π t 2 1 + ν l o g R x
σ t = 3 F 2 π t 2 1 + ν l o g R x + ( 1 ν )
where F represents the vertical force at the center point, x donates the indenter diameter, t represents the sample’s thickness, v represents the Poisson ratio, and R represents the radius of the samples.

3. Results

3.1. Spectroscopy of Cu-CNTs Composite

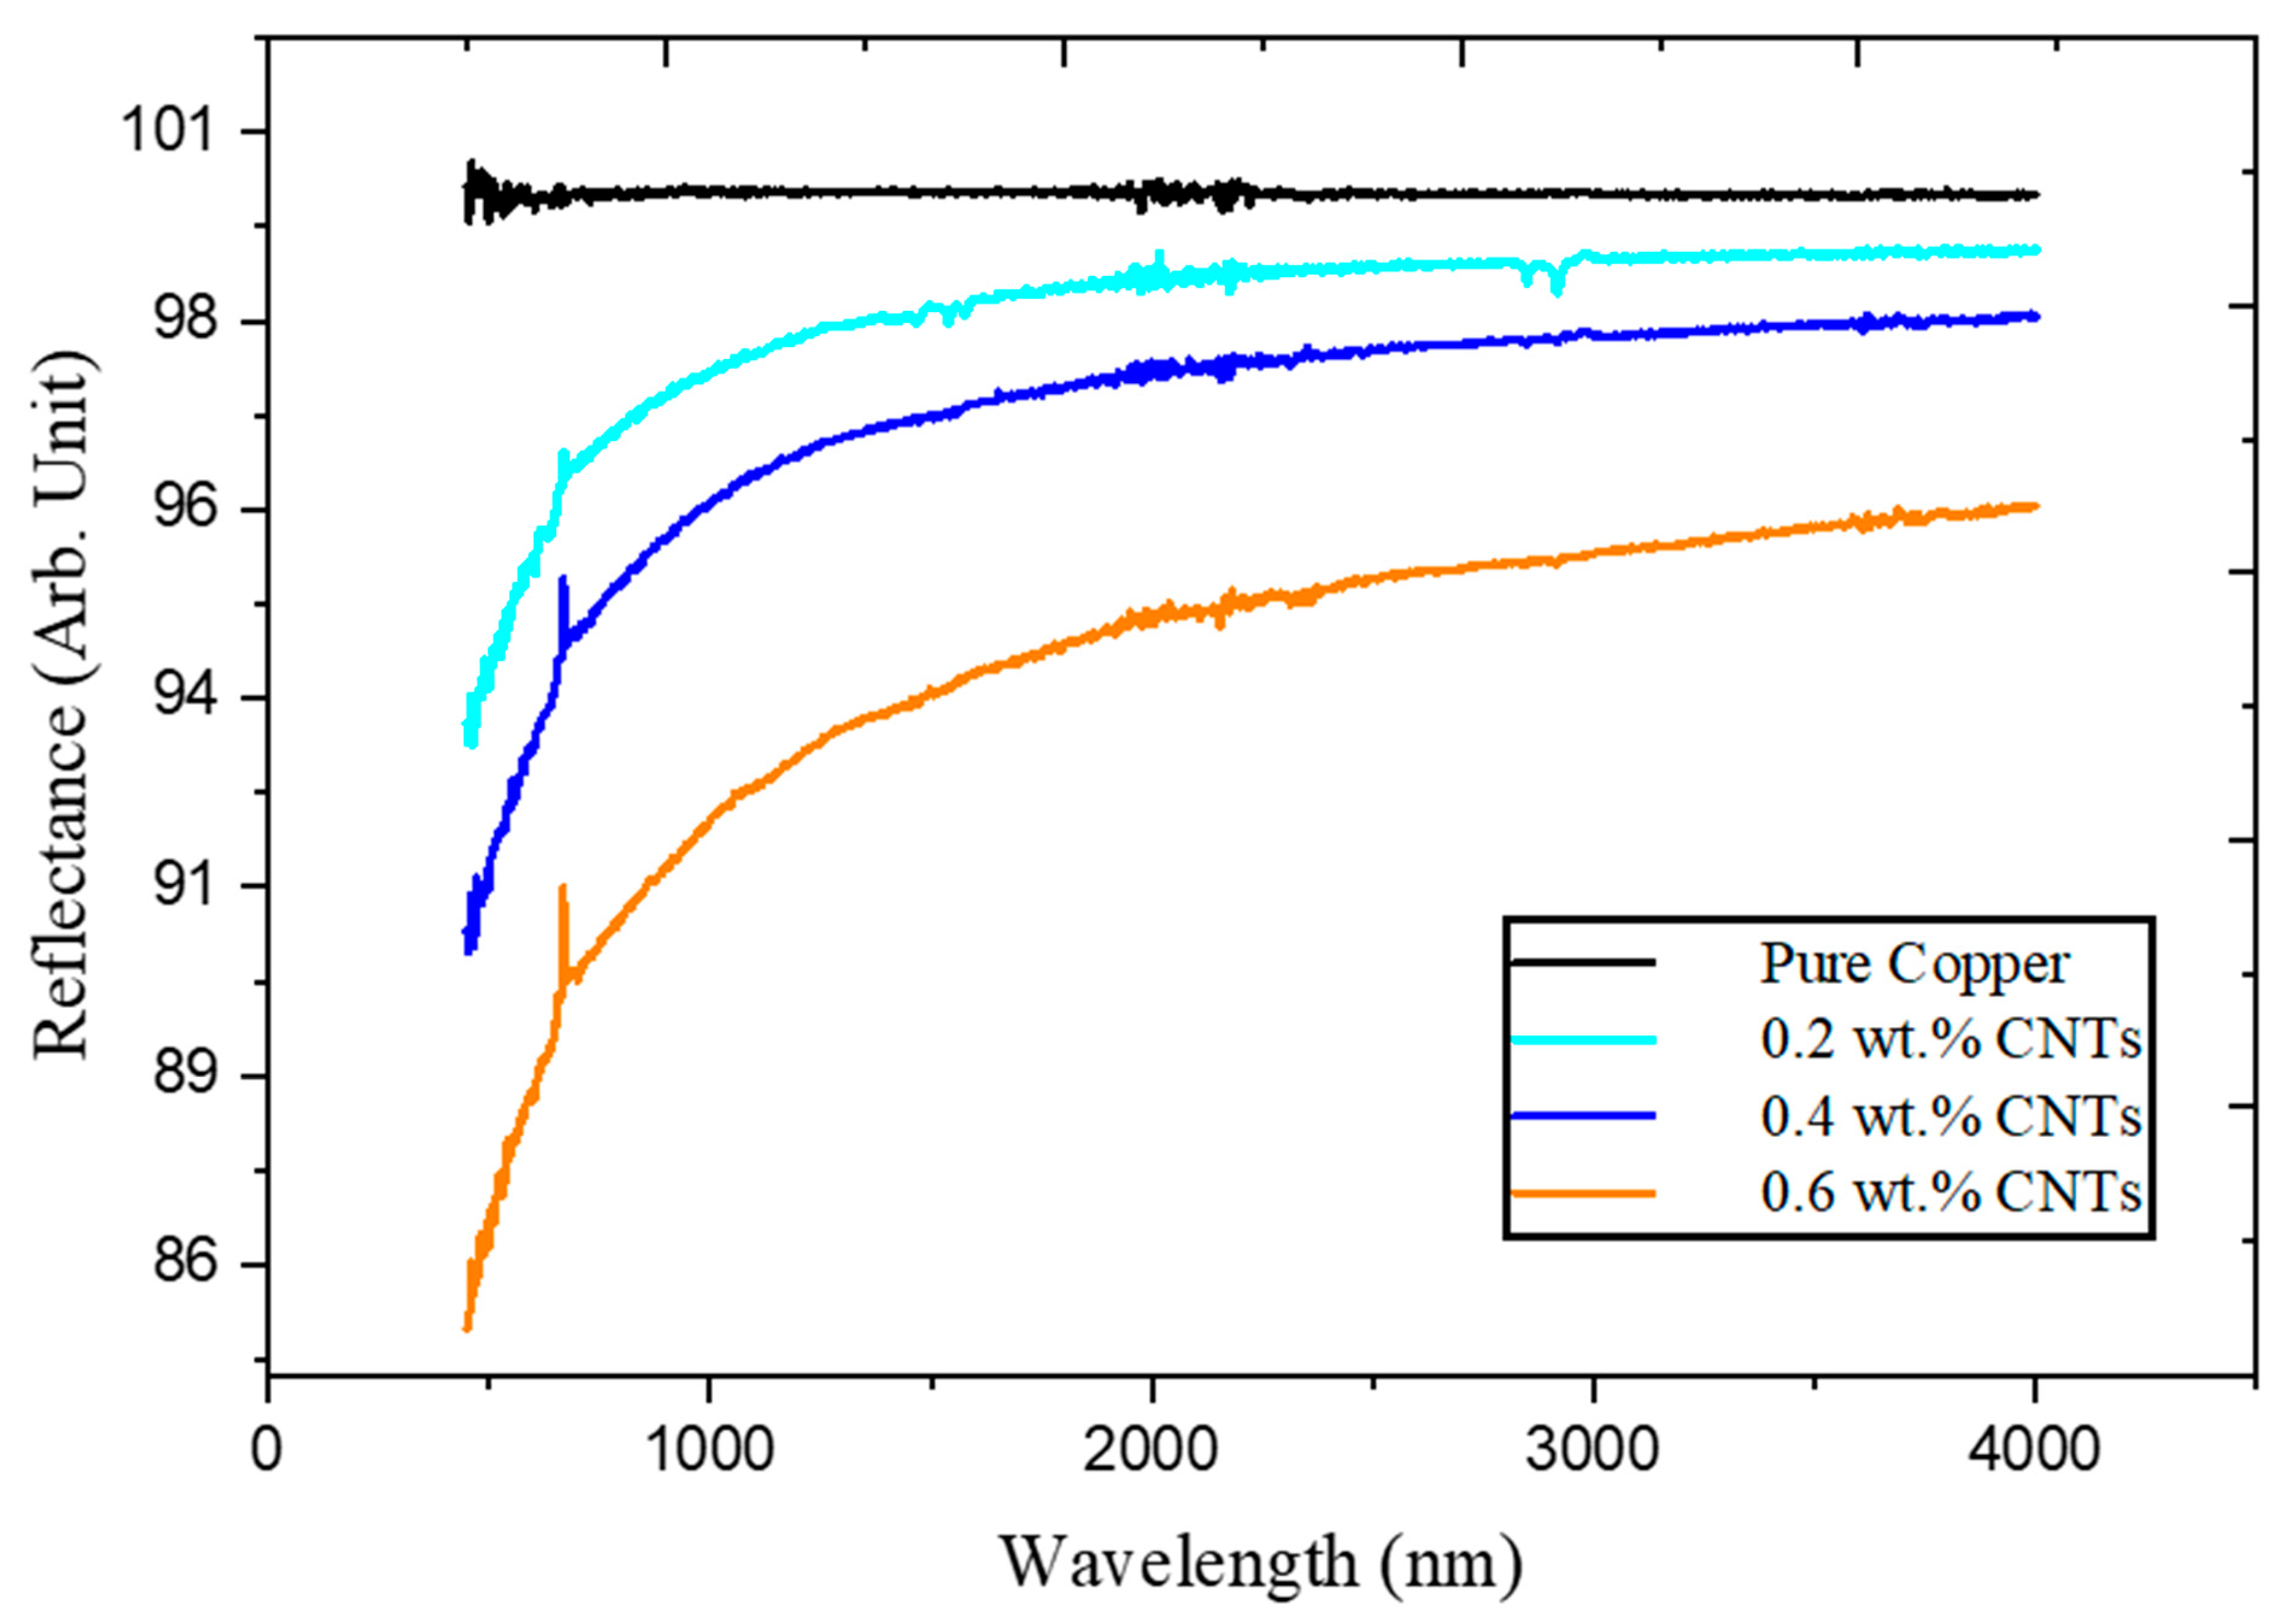
The pure copper and CNTs mixed copper powders were prepared at three distinct weight percentage concentrations of CNTs: 0.2, 0.4, and 0.6 wt.%. Figure 3 depicts the reflectance of the pure copper and Cu-CNTs samples recorded from the FTIR spectroscope from 500 nm to 4000 nm. The spectroscopic analysis of the pure copper powder demonstrated that its reflection was 100% at a wavelength of 1068 nm. The high levels of reflection in copper powder create challenges for laser sintering, even at low laser powers, as the reflected laser beam can cause harm to the laser source. However, the addition of single-walled CNTs to the pure copper powder resulted in a decrease in copper reflection and an improvement in laser absorption. It can be observed from Figure 3 that an increase in the CNTs content led to a reduction in the level of reflection. When 0.6 wt.% of CNTs were added to the pure powder, the copper powder reflection at a 1068 nm wavelength was decreased by 8% compared to that of the pure powder.

3.2. Laser Sintering Optimization of Cu-CNTs Composition

In the laser sintering chamber specifically designed for this purpose, as illustrated in Figure 2, the initial experiment involved the laser sintering of a pure copper pellet in an ambient environment. The purpose of this step was to optimize the laser parameters by testing the effect of varying levels of laser power on the compacted pellet of pure copper powder. It was observed that sintering was not possible at power levels above 450 W, as evidenced by the laser-sintered copper pellets shown in Figure 4a–c, which were produced at 600 W, 500 W, and 450 W of the laser power, respectively. At overly high laser power levels, the pellet was either overly vaporized or burned. Subsequently, to prevent contamination and oxidation, the laser-sintered pure copper pellet shown in Figure 4d was processed in a laser sintering apparatus that maintained an inert atmosphere environment with 400 W laser power to provide a fully dense pellet without any crack. The Cu-CNTs samples were made according to laser processing parameters and CNT concentration according to Box-Behnken DoE, as described in Table 2.

3.3. Optimization of Energy Densities

The laser sintering temperature was recorded using infrared temperature sensors by passing the laser beam in a to-and-fro pattern on each track. The resulting sintering temperature is shown in Table 3. The temperature of the Cu-CNTs composite was found to rise rapidly due to the increased absorption of photonic energy of the MMC. The energy density of the laser sintering was calculated using the following equation [35,36,37].
E = P V × d
where E is the energy density in Joules per square meter, P is the laser power in Watts, V is the scanning speed of the laser, and d is the spot-size diameter. The fast heat dissipation rate of Cu, low laser absorption rate in the near-infrared (IR) region, and the low-density components were caused by insufficient laser energy being deposited on powders [38,39]. However, the addition of CNTs increased the absorption of laser energy to the Cu-CNTs composite, which resulted in increased densification of the powder particles.

3.4. Morphological Analysis of Laser-Sintered Pellets

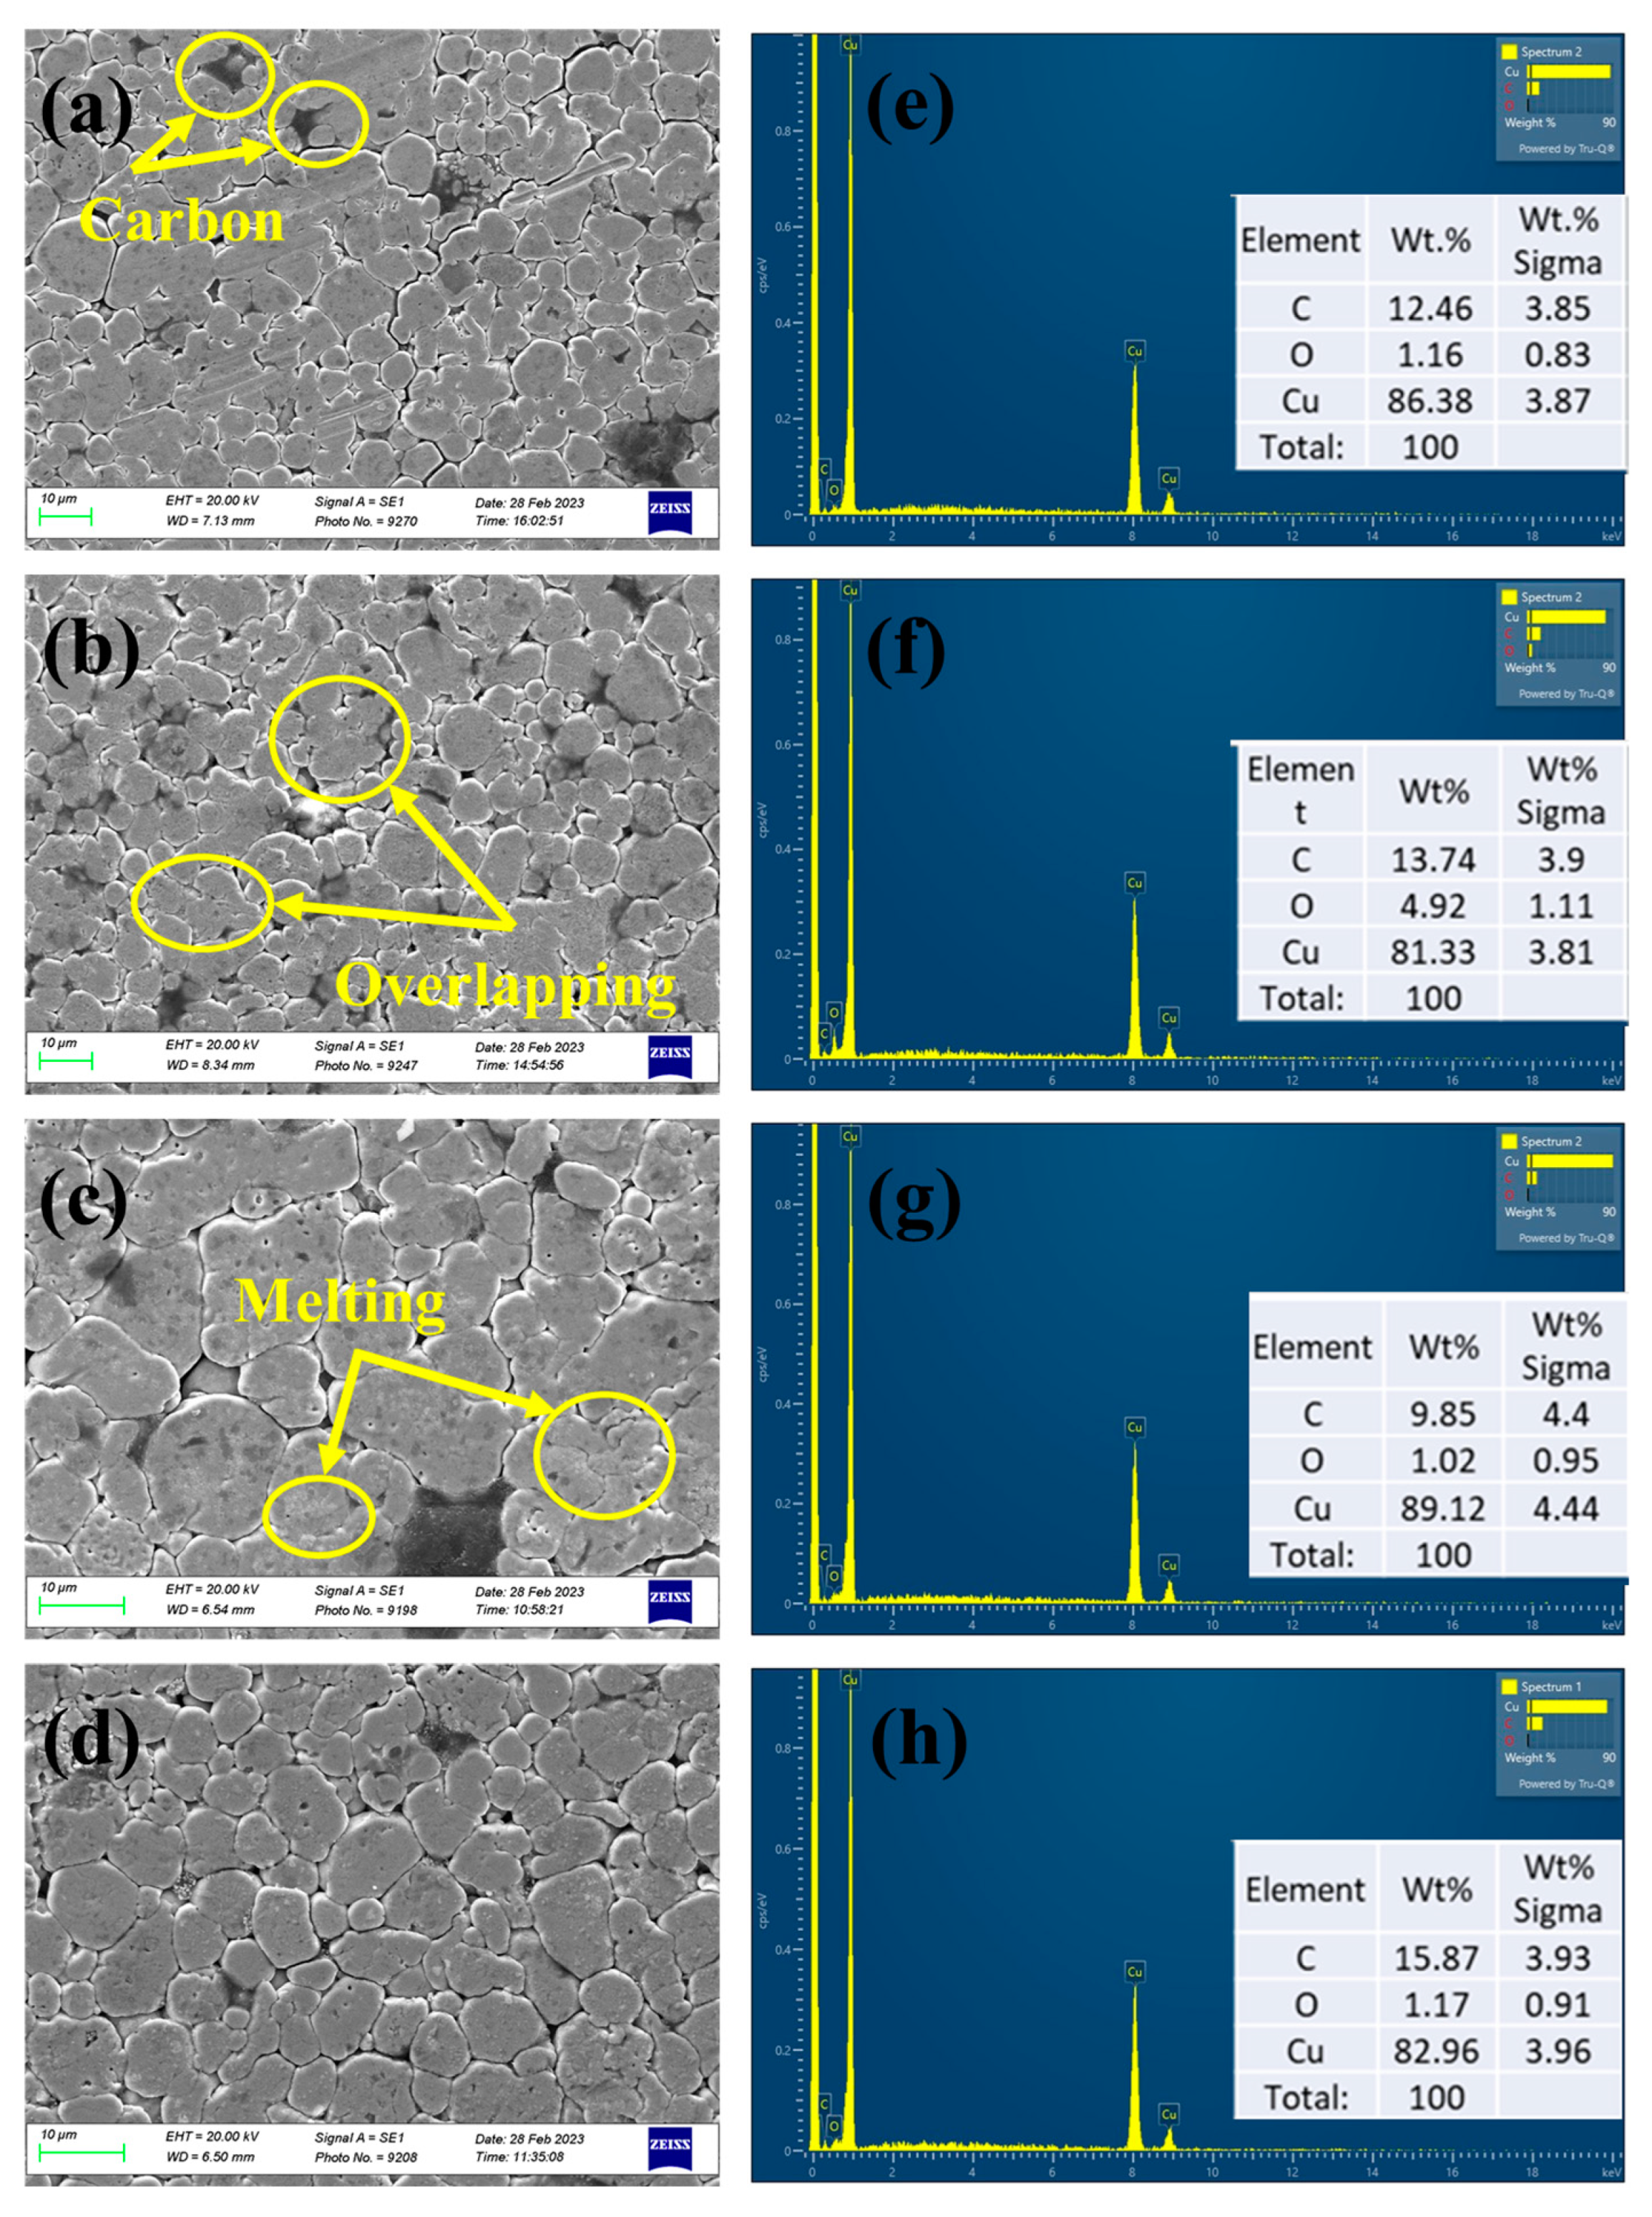
Figure 5a–d displays SEM images of the 0.2 wt.% CNT mixed copper pellets that were processed at S3, S11, S13, and S15 process parameters (see Table 2), demonstrating their structural solidity and stability. Figure 5a shows a Cu-CNTs pellet sintered at a high laser power of 400 W and a scan speed of 1.5 mm/s, resulting in small surface pores. Although the slow sintering laser scan speed left some carbon marks on the surface, a highly dense grain structure and crack-free structure were observed. Figure 5e demonstrates the EDX of run 3, and it is found that the composition of the material is (C) 16.95 wt.%, (O) 0.83 wt.%, and (Cu) 82.22 wt.%. When the laser power was decreased to 350 W and a scan speed of 2 mm/s was applied, the overlapping of copper and CNT powder particles was observed (see Figure 5b). Similar results were obtained when using a scan speed of 1.5 mm/s at 30% laser power (see Figure 5c). In Figure 5d, it is seen that the sample was processed with lower power and speed. It is clear from this sample that it contained a higher degree of porosity. Figure 5e–h show the EDX compositional analysis of the samples in Figure 5a–d.
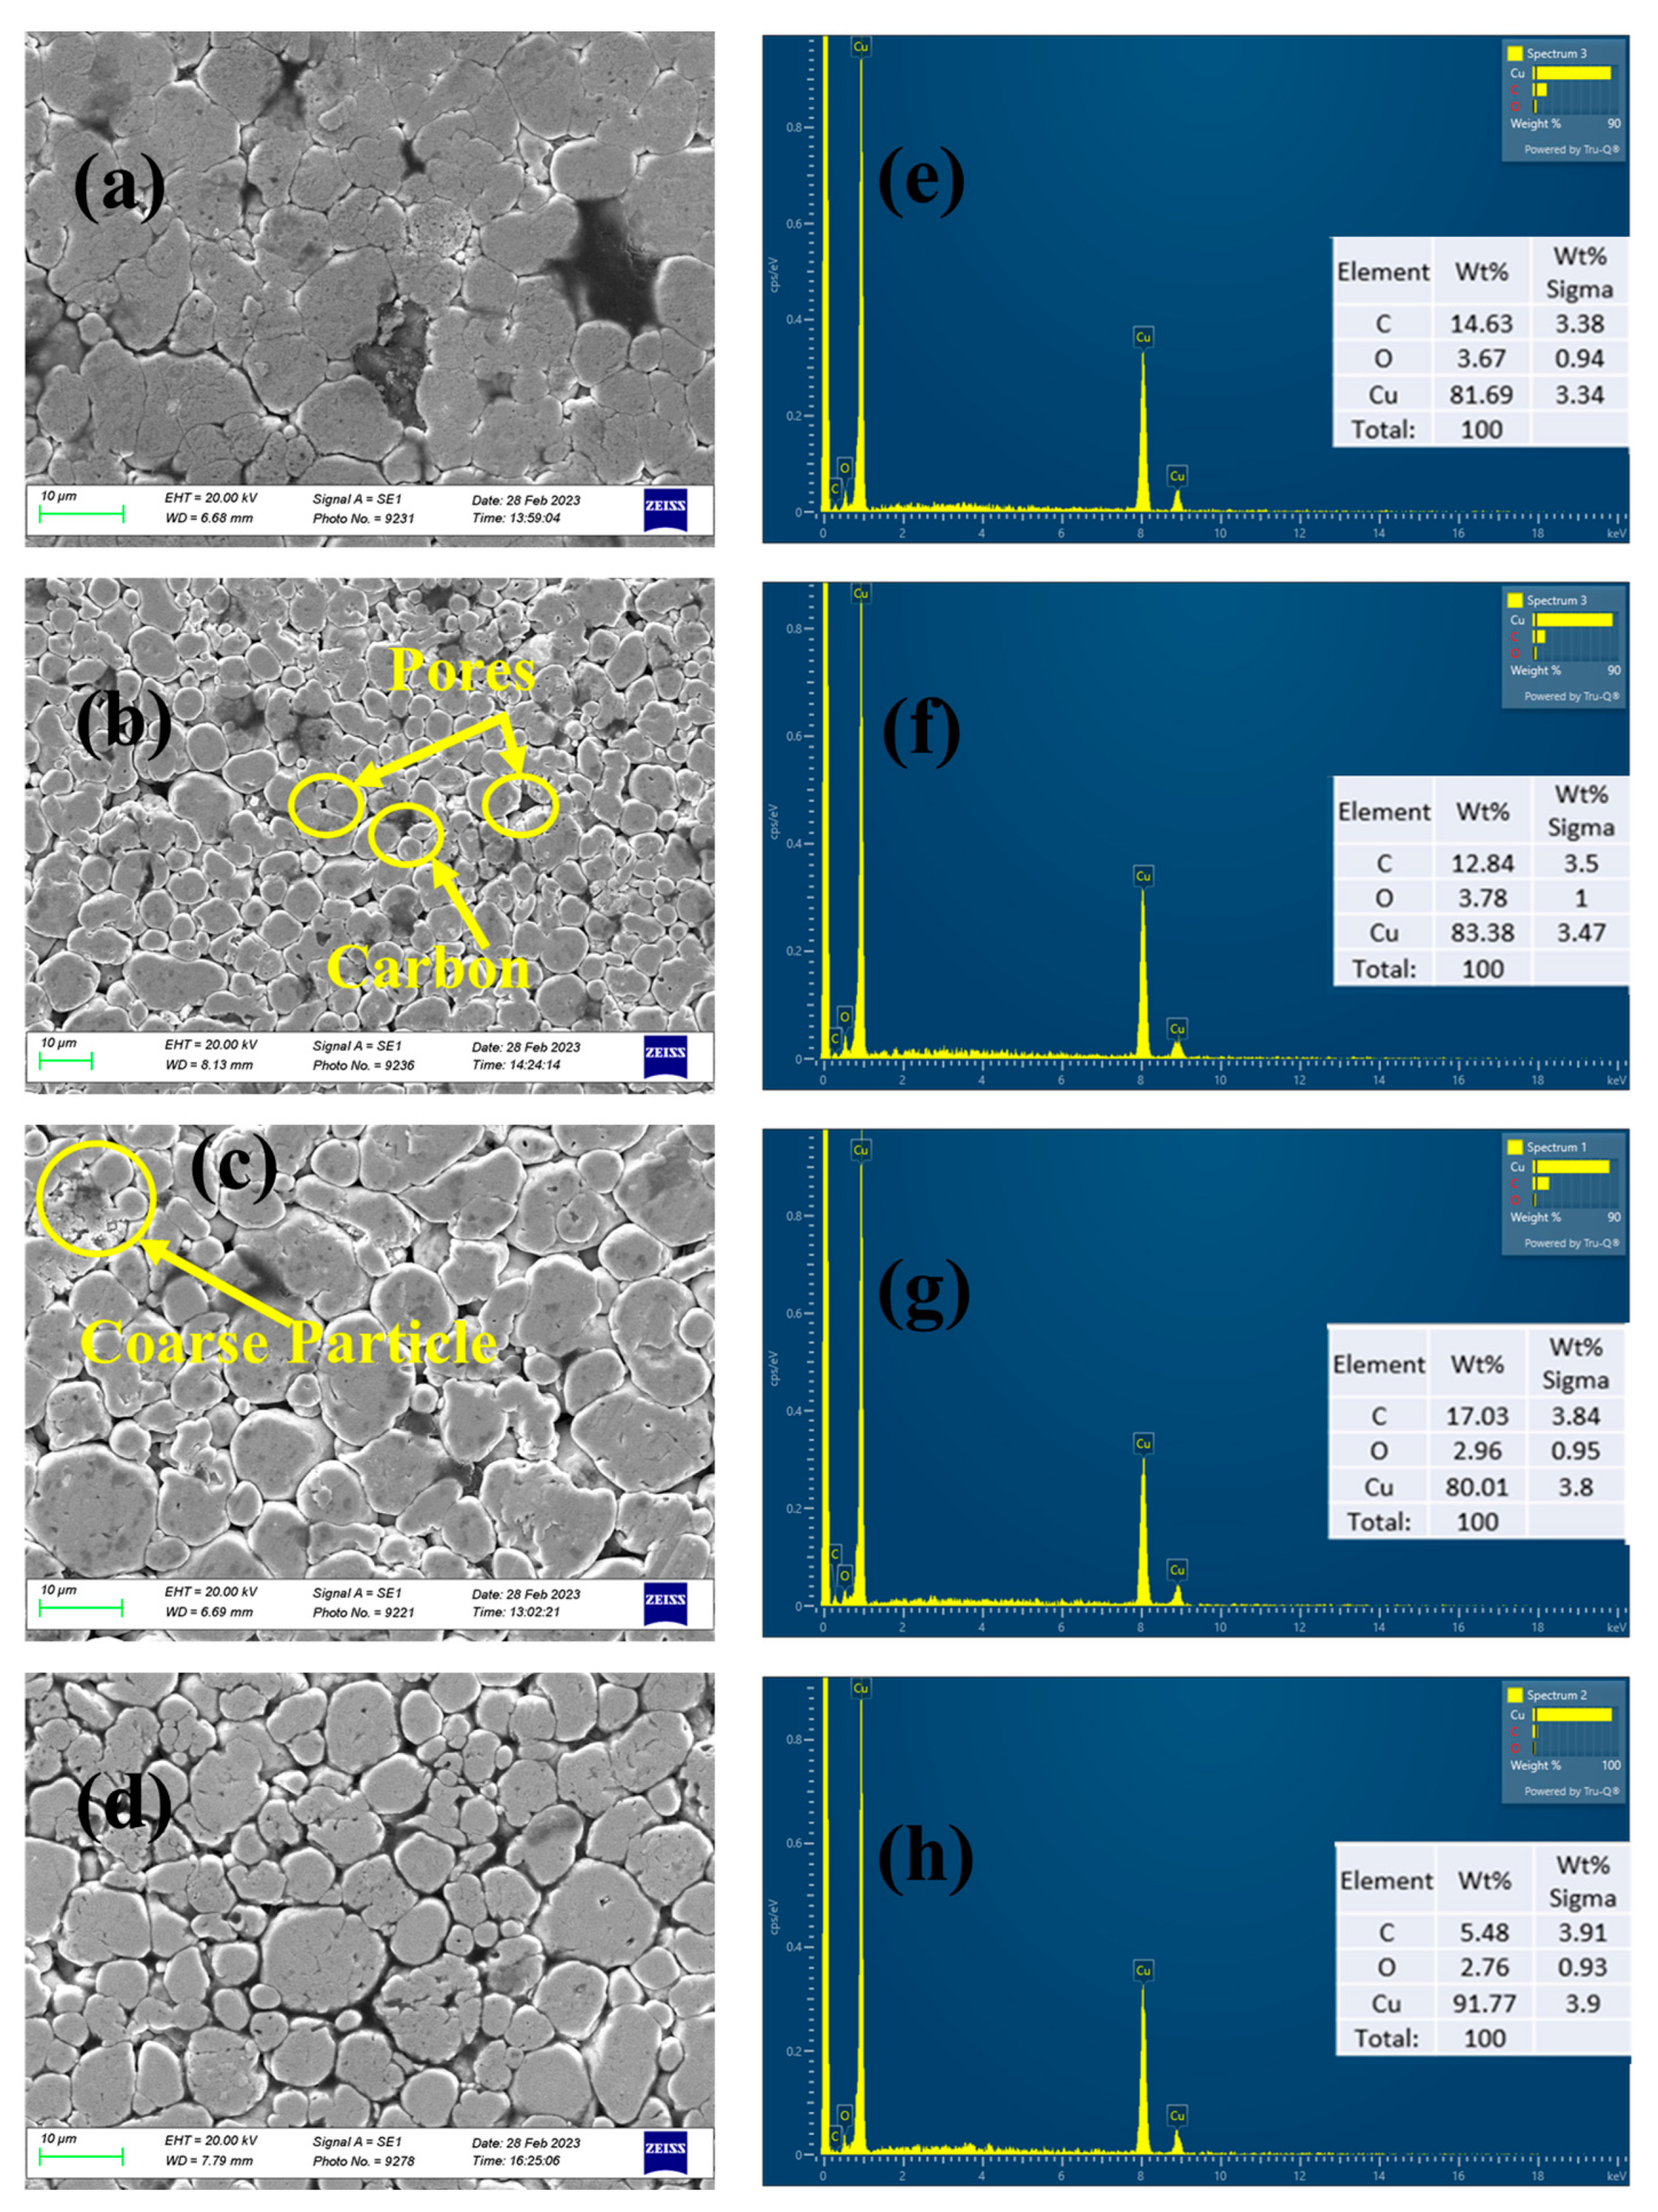
Figure 6a–d shows the SEM images and EDX spectra of pellets with 0.4% CNT laser-sintered at 300 W, 350 W, 350 W, and 350 W laser power according to the Box-Behnken DoE. It can be observed in Figure 6a that powder particles were consolidated with overlapping at 300 W laser power sintering. To further increase the consolidation of the powder particles, the laser power was increased to 350 W. As shown in Figure 6b–d, powders were more consolidated, although small pores appeared on the surface of the pellets. Nonetheless, no delamination or flaking was observed. Figure 6e–h show the EDX compositional analysis of the samples in Figure 6a–d.
While maintaining the CNTs concentration at 0.4 wt.%, the laser power and scan speed were varied. Figure 7a,b show SEM images and EDX spectra of samples that were sintered at 40% laser power with a scan speed of 2 and 1 mm/s, respectively, whereas Figure 7c shows a sample that was sintered at a low laser power of 30% and a scan speed of 2 mm/s. Figure 7d shows an SEM image of the repeated sample which was sintered at 350 W and 1.5 mm/s of scan speed. Figure 7a,b illustrate that a high laser power results in a high particle density with small pores and carbon. However, the overlapping of the particles was apparent at a low scan speed. At a low laser power and fast scan speed, coarse particles appear on the pellet surface, as demonstrated in Figure 7c. Figure 7e–h show the EDX compositional analysis of the samples in Figure 7a–d.
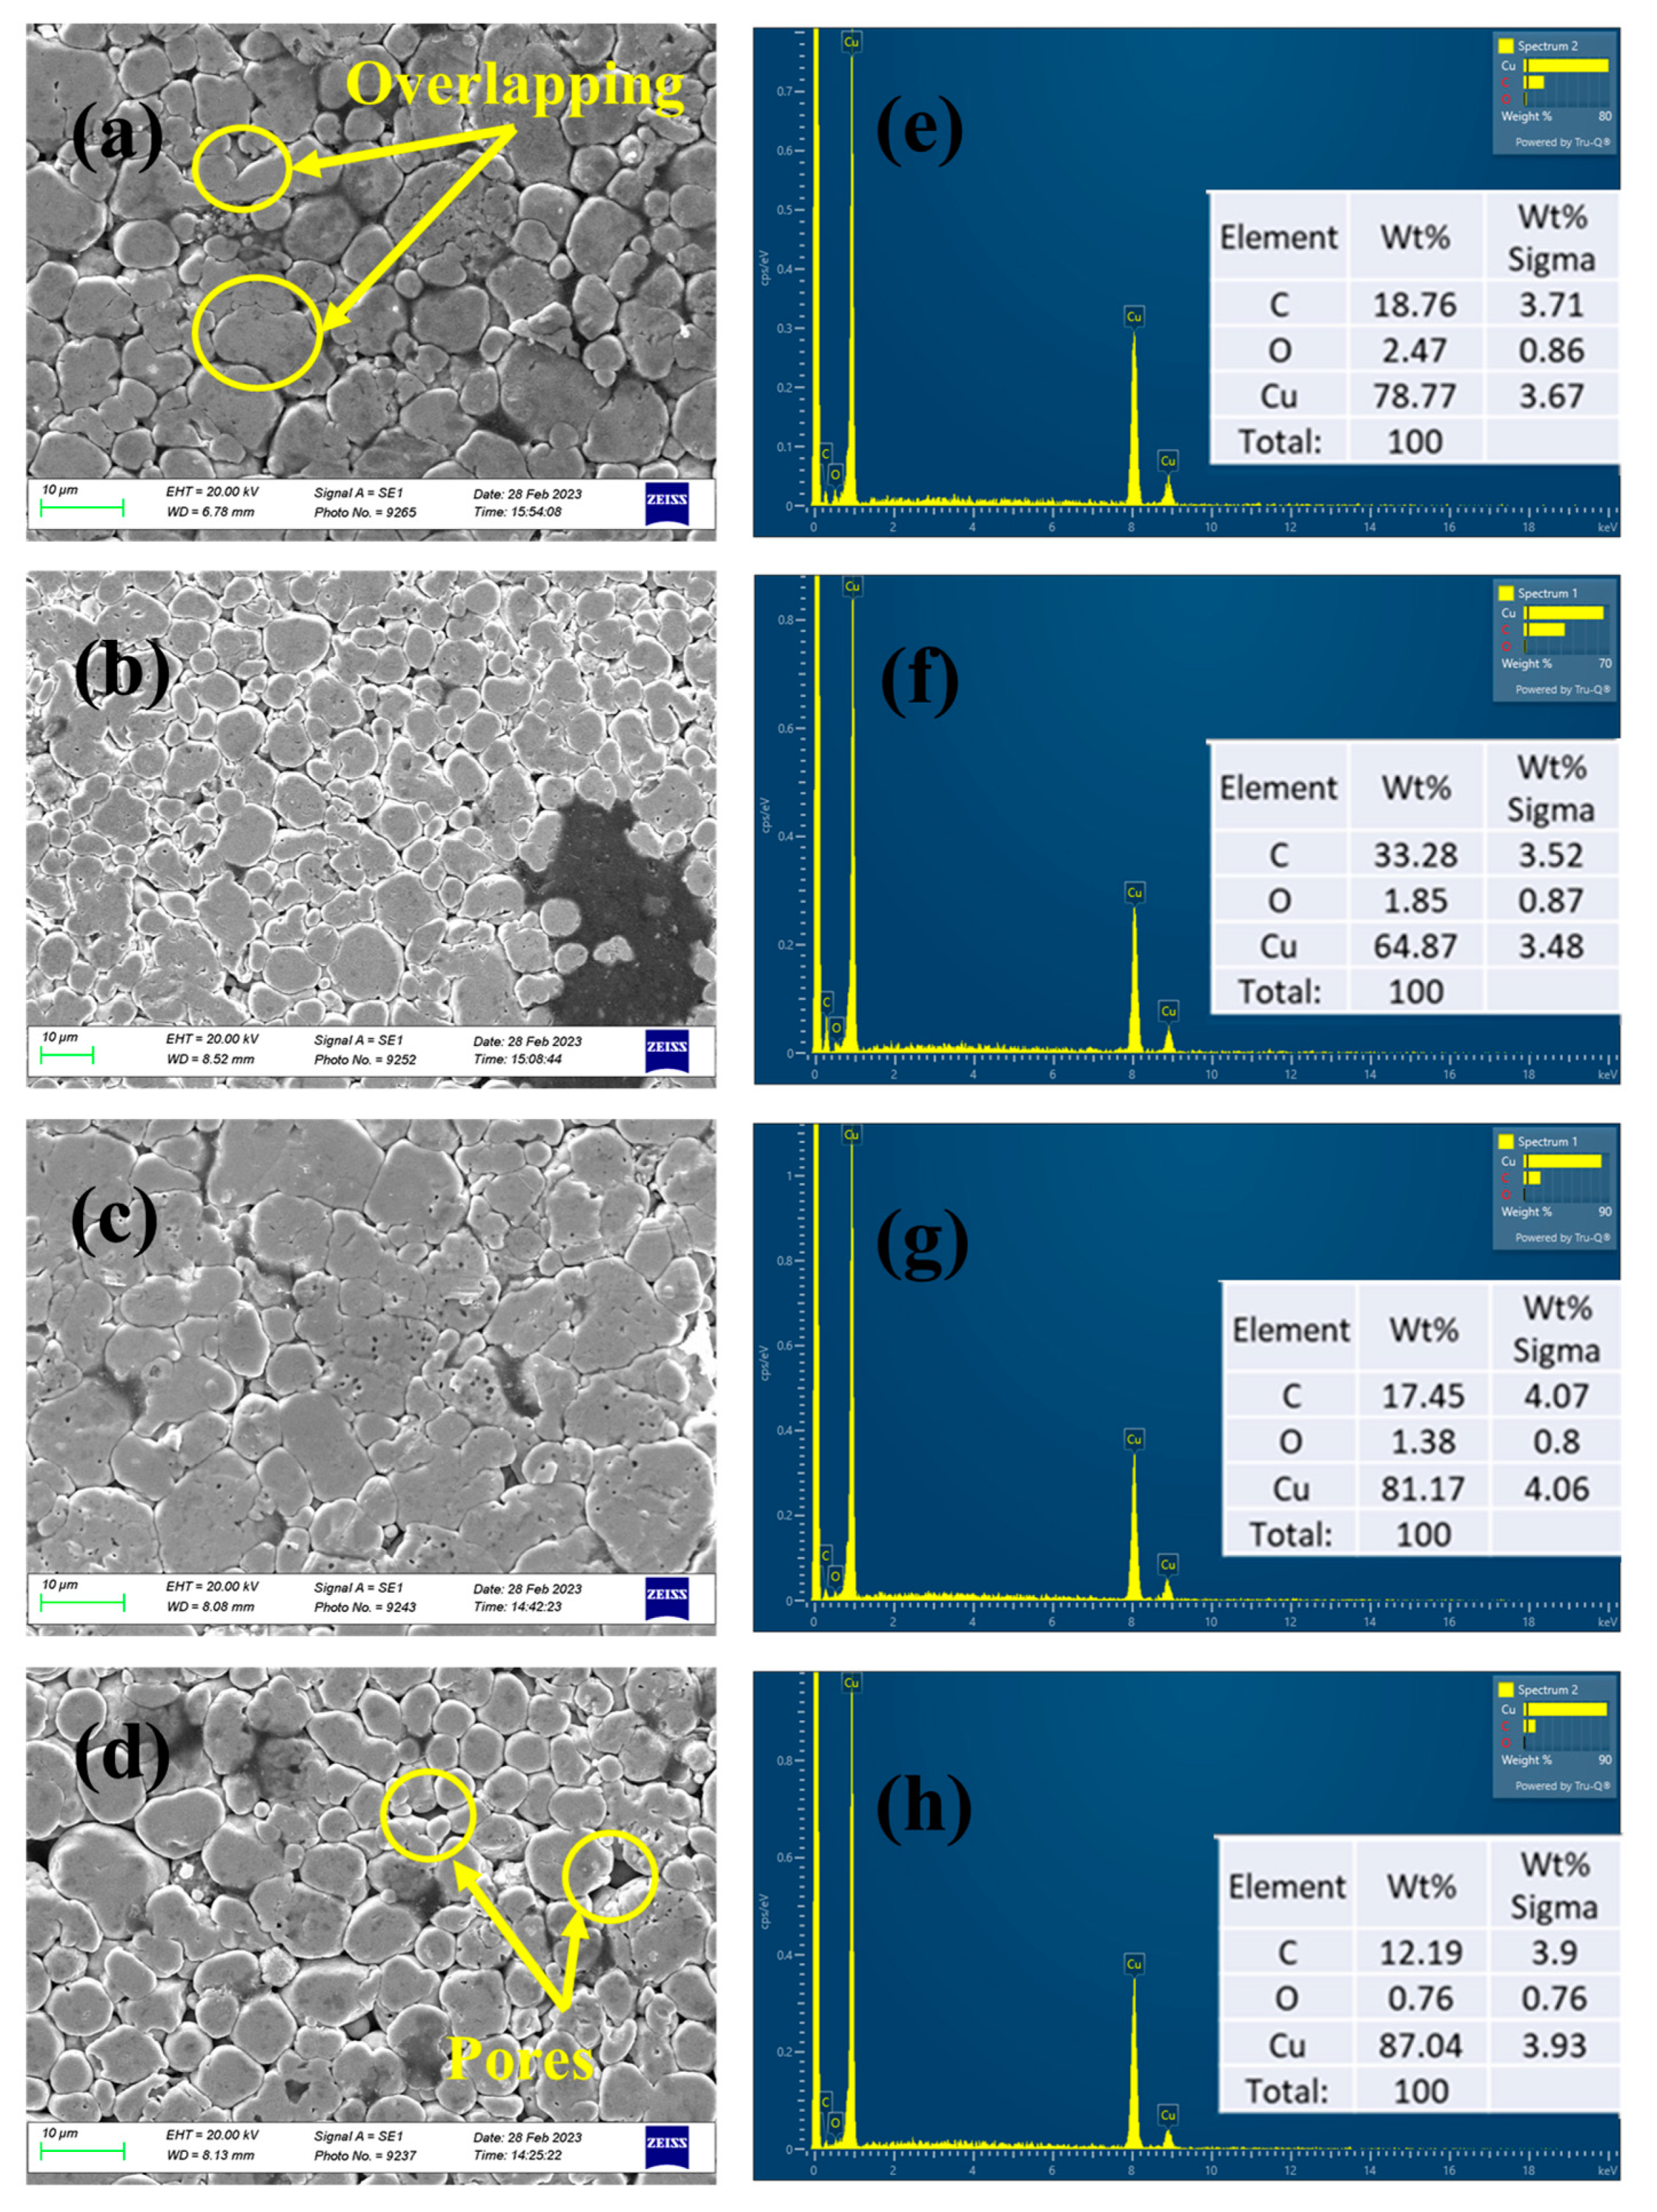
Figure 8 depicts the SEM images and EDX spectra of the Cu powder with a maximum CNT content of 0.6 wt.%. A higher residual porosity is expected when starting with a low laser power of 30%. Residual microscopic porosity is common and often arises from incomplete infiltration due to the failure of the liquid metal to wet the reinforcement. Residual porosity is also highly challenging to prevent in composites processed using powder metallurgy [40]. As shown in Figure 8b, laser sintering at an increased laser power of 35% resulted in high density and a better consolidation of the powder particles, which led to a few tiny pores on the surface. Figure 8c presents the SEM image of the sintered sample at a high laser power of 40% with a moderate scan speed of 1.5 mm/s. Figure 8e–h show the EDX compositional analysis of the samples in Figure 8a–d.

3.5. Density Measurements

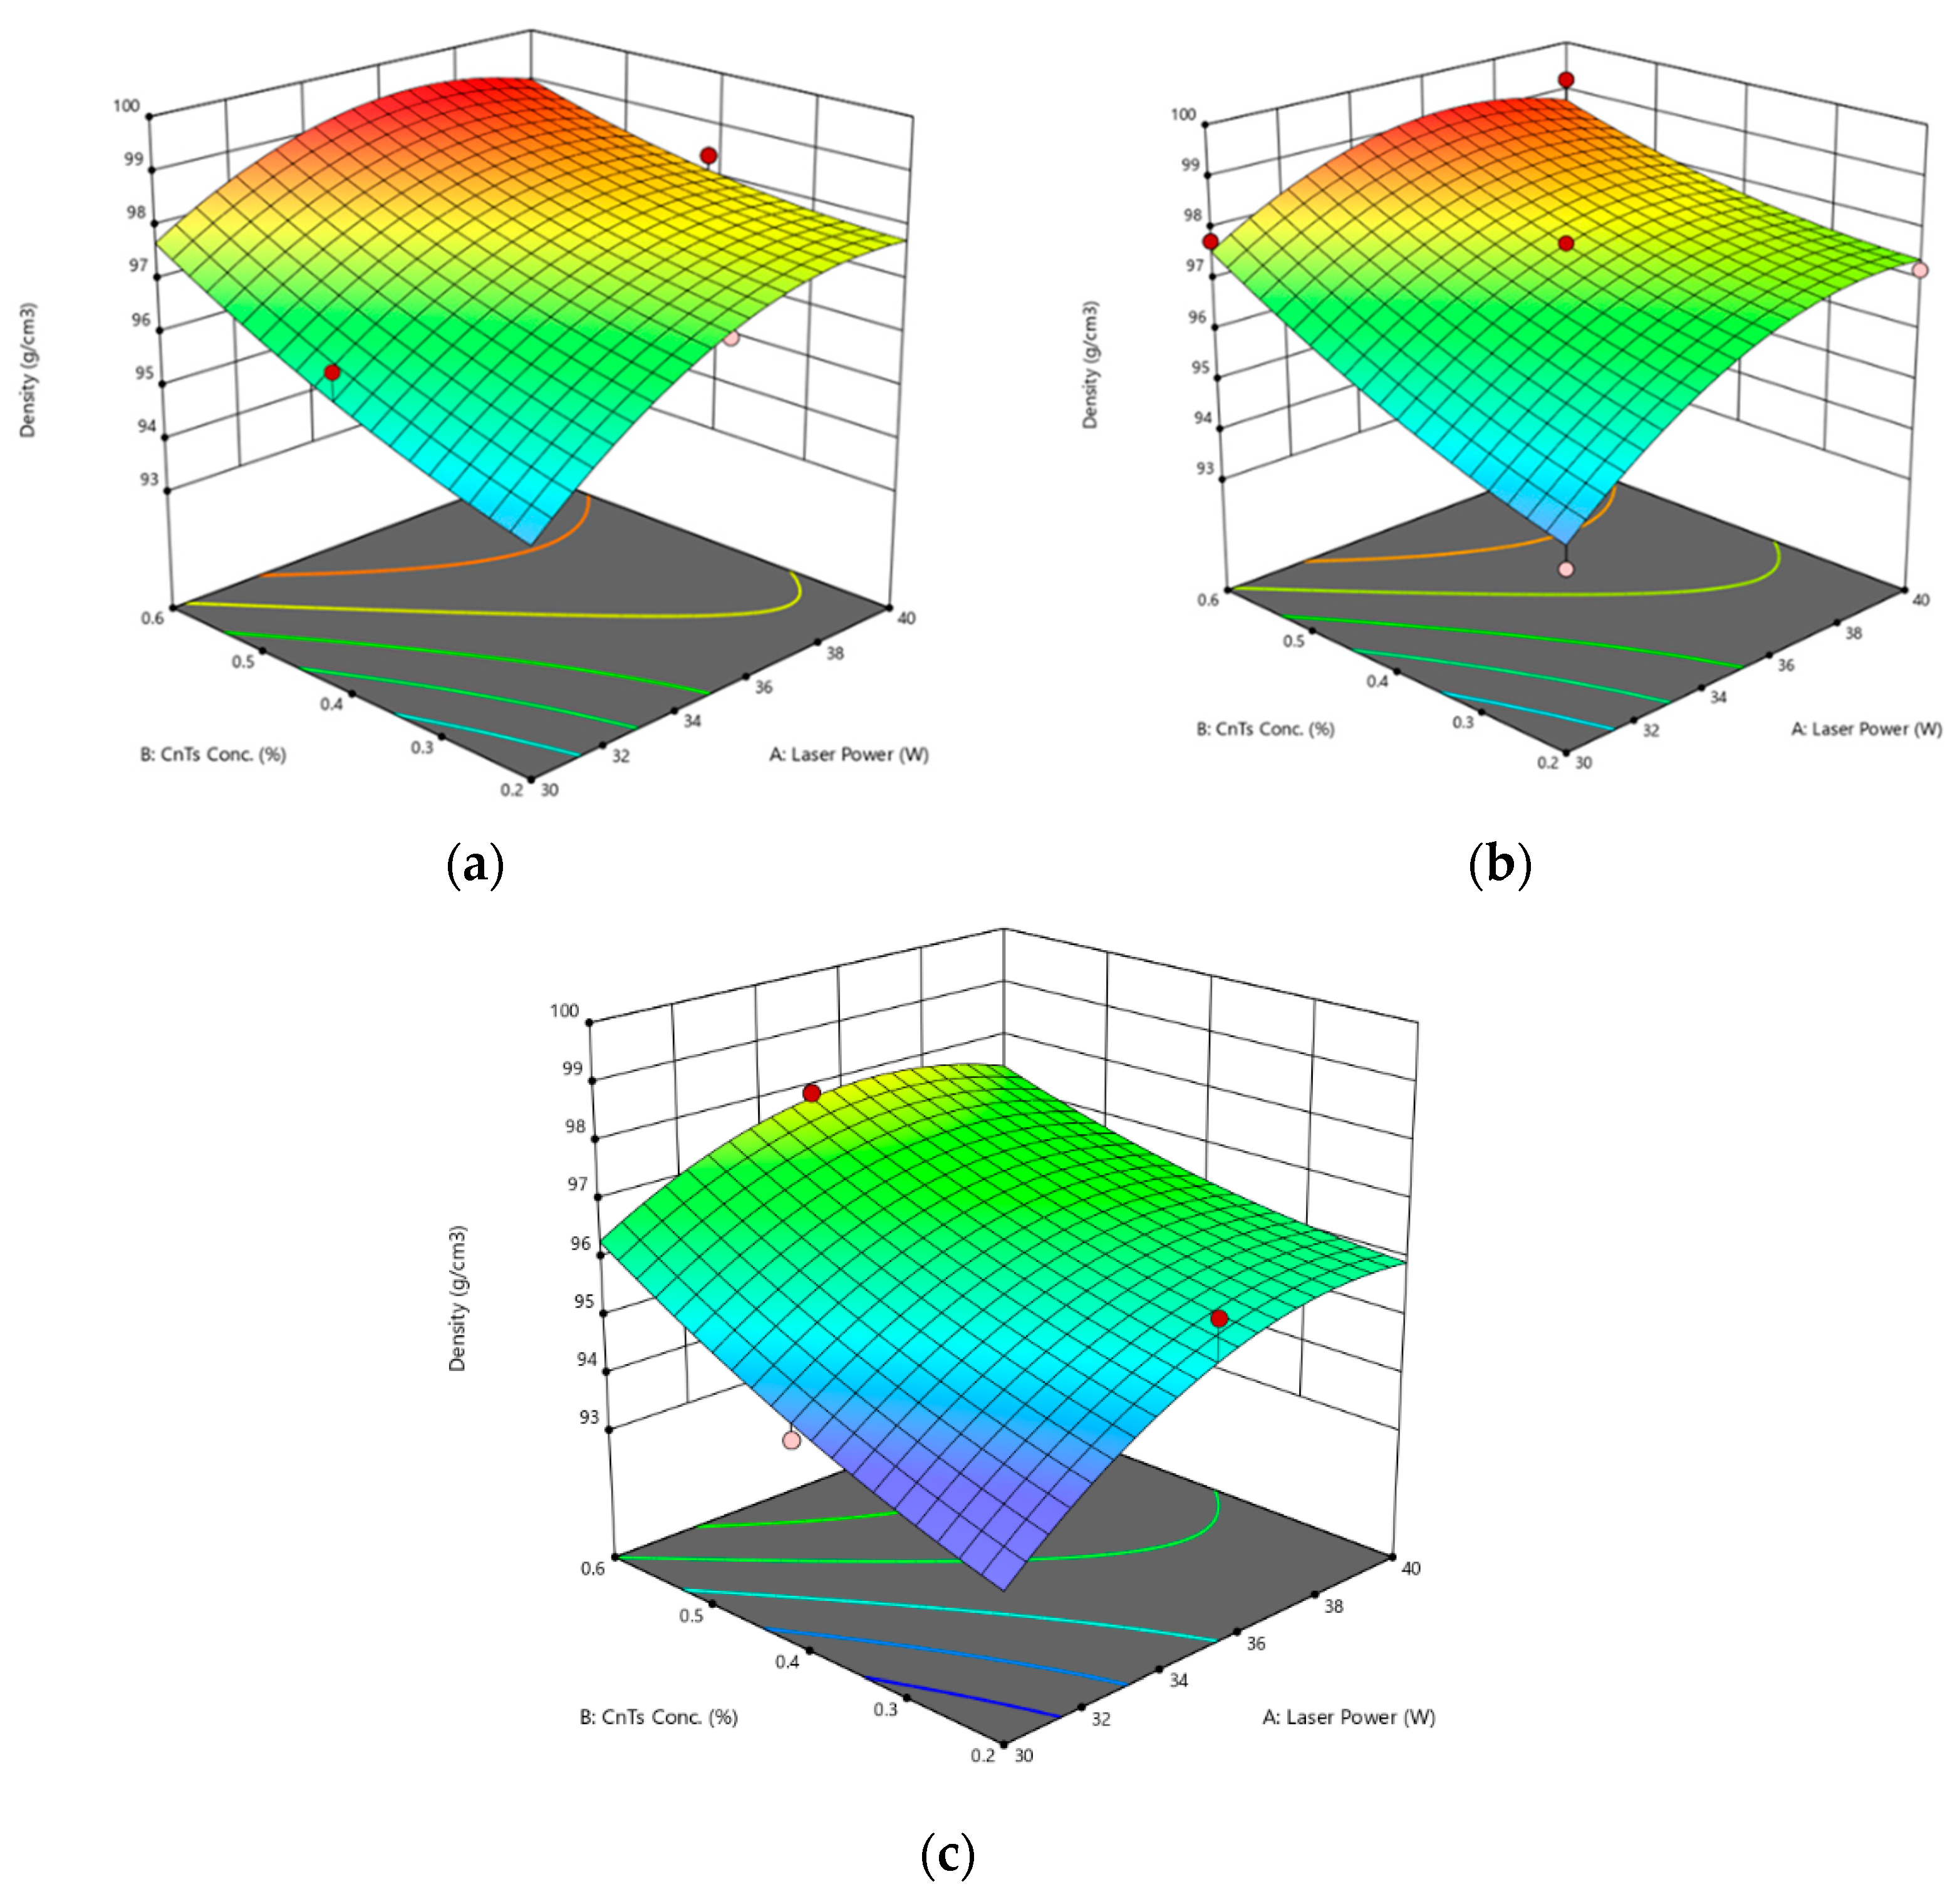
The resultant values of density measurements are shown in Table 4. The relative density of all 17 samples was above 94%, which shows that the density of all samples was stable. The relative density measured values of all samples are given in Table 4. The results revealed that the higher concentrations (0.6 wt.%) of the CNTs at high laser power (40%) and the lower scan speed of 1.5 mm/s give the highest relative density of 99.22%. Moreover, at 0.4 wt.% concentration of the CNTs at a lower scan speed of 1 mm/s, 98.38% is achieved. The square root method was employed to configure the first response, relative density. Response surface methodology (RSM) was applied to evaluate the model, and a coefficient of determination (S2) value of over 94% was obtained, indicating that the model is significant. Furthermore, the RSM approach provided the standard deviation of the entire model, the mean values of the responses, and the coefficient of the variant. The 3D surface response plots were generated for relative density at scan speeds of 1 mm/s, 1.5 mm/s, and 2 mm/s, shown in Figure 9a–c, respectively. The results revealed that increasing the laser power led to higher relative density. The 3D surface plots illustrated the response surface of the relative density for various scan speed values. The results demonstrated that the minimum relative density was 94.10%, achieved with a laser power of 30%, a scan speed of 1.5 mm/s, and a CNT concentration of 0.2 wt.%.
An analysis of variance (ANOVA) was conducted for the Box-Behnken design of experiments with 17 runs, as shown in Table 5. The ANOVA results indicated that the model is significant, as evidenced by the model F-value of 10.07. The probability of an F-value of this magnitude occurred due to the noise level recorded at only 0.30%. The model terms with p-values less than 0.05 are considered significant. In the cases of A, B, C, and A2, representing laser power and CNT concentration in samples, they were found to be significant model terms. Model terms with values greater than 0.1000 are considered not significant. If there are numerous insignificant model terms (not counting those required to support hierarchy), model reduction may improve the overall model.
The lack of fit F-value of 1127 implied that the lack of fit is significant compared to the pure error. The probability of an F-value of this magnitude occurring due to noise is 0.01%. This is favorable as there is a significant lack of fit. The statistical analysis of the model yielded a standard deviation value of 0.5650, a mean value of 97.15, a C.V% of 0.5816, and an R2 value of 0.9283. The signal-to-noise ratio was found to be 11.084, indicating that the signal is adequate as it exceeds the minimum value of four.
According to the results in Table 6, the model’s R-squared value was determined to be 0.9283, and this model was able to account for the variability in the experimental data. The estimated and actual experimental values were found to be in respectable agreement, as indicated by the corrected R-squared value of 0.8362. The fact that the R-squared value was near one, the coefficient of variance was low, and the estimated R-squared value was low demonstrated that this model was an effective option for natural observation estimates. Figure 10 shows the relationship between actual and predicted values of relative density.

3.6. Hardness Results

The macroscopic hardness test was significantly influenced by the local porosity, as evidenced by the considerable variation in hardness values measured across the five distinct locations on the specimen’s surface shown in Figure 11, and Table 7 shows the summarized measured hardness value of each location in the sample. Additionally, the SEM images demonstrated that the samples’ porosity was evenly dispersed. The average hardness was investigated using the same Box-Behnken-designed experiments with 17 runs for different experimental conditions of laser power, CNT concentration, and scan speed, and the results are shown in Table 4. The HV values range from 49.3 to 66.5, indicating a considerable variation in the hardness of the samples. Overall, the results indicate that the three factors—laser power, CNT concentration, and scan speed—have a significant impact on the hardness of the samples.
The analysis of the hardness values measured revealed that increasing the laser power from 300 W to 400 W led to increased hardness. For instance, the Study 1 sample showed an increase in HV from 53.82 to 61.6 with an increase in laser power. This trend was also observed in other samples, including Study 4, Study 6, Study 8, and Study 9. On the other hand, increasing the CNT concentration from 0.2 to 0.6 wt.% leads to a decrease in hardness. This trend can be observed in the samples prepared in Study 3, Study 5, Study 12, Study 13, and Study 15. In contrast, increasing the scan speed from 1 to 2 mm/s had a mixed effect on the hardness, as seen in the samples from Study 5, Study 8, and Study 10.

3.7. Results from Indentation Testing of Samples

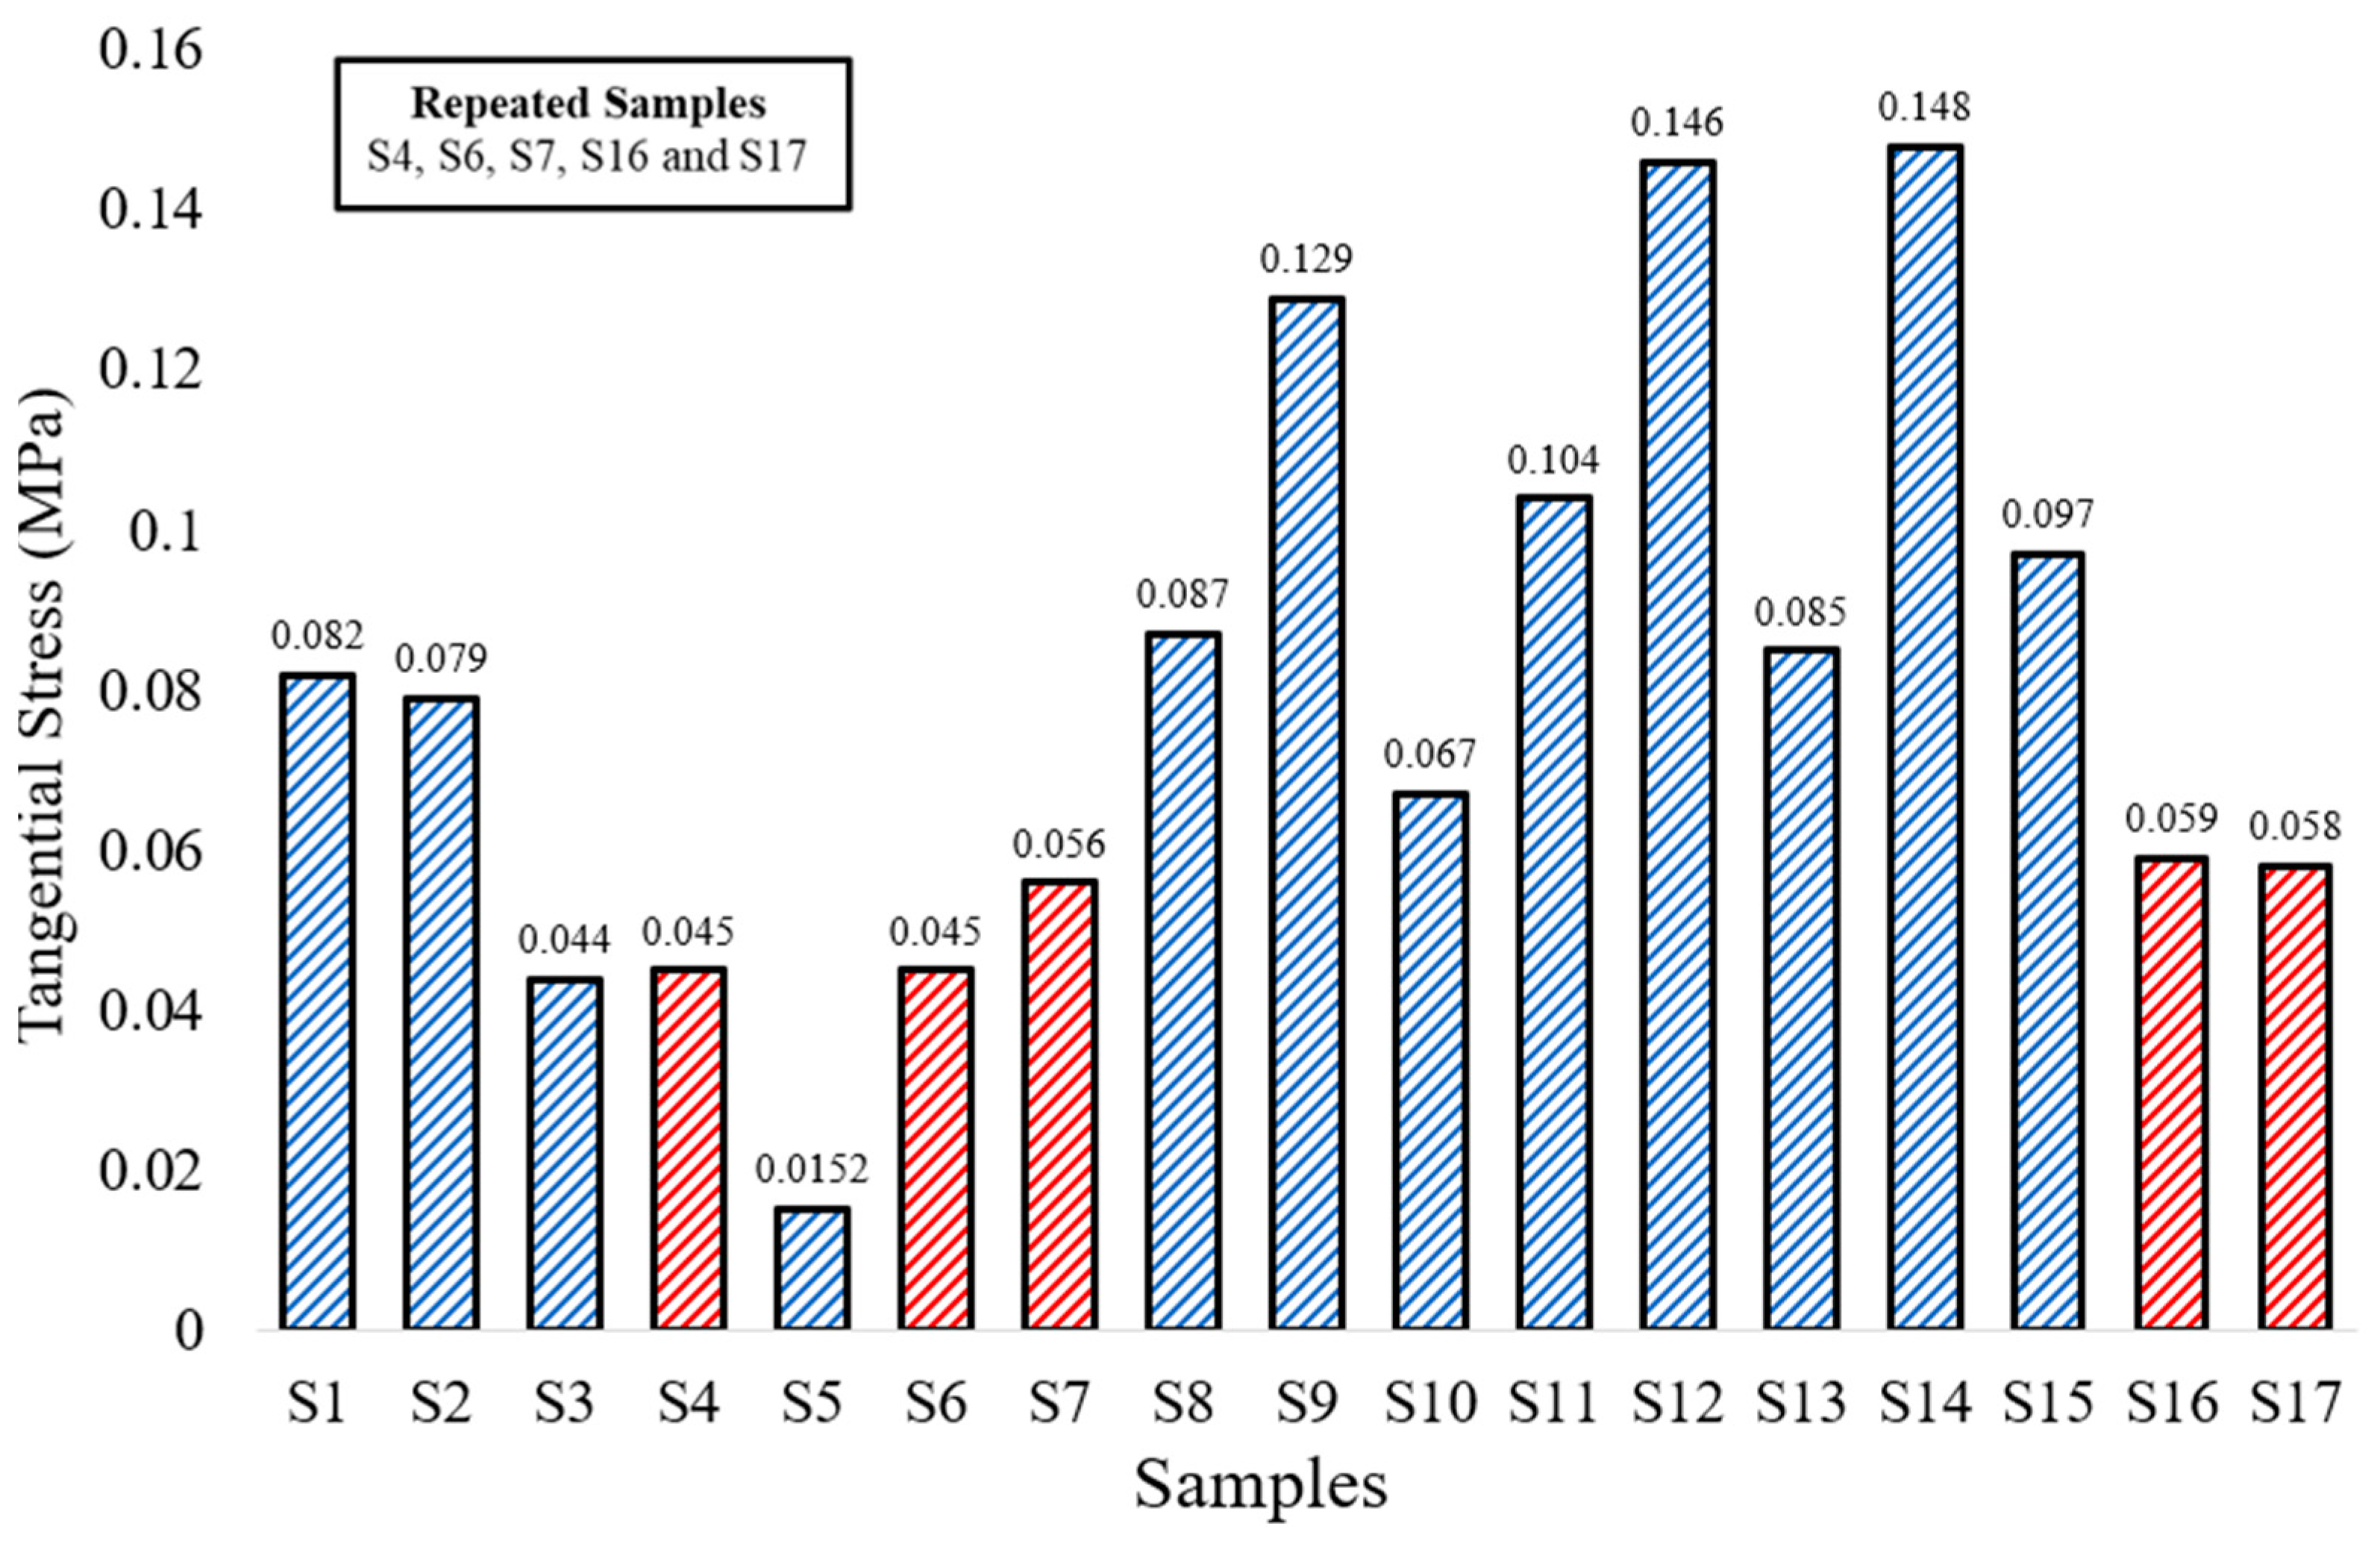
The grain structures of the material determine its strength, and feeble grain boundaries or grain structures are more likely to fracture, which causes the material to deteriorate [41]. The indentation compression force was applied to the center of all the samples. Samples 3, 4, and 6 showed brittle failure, whereas the rest of the samples exhibited ductile shear failure, as shown in Figure 12, according to the Box-Behnken design of the experiment (i.e., S1–S17). The corresponding radial and tangential pressures for each sample are shown in Figure 13 and Figure 14.
Figure 13 shows the radial stress findings for all 17 samples. According to the findings, the samples experienced random peak stresses with the highest of 0.058 MPa at S5 and the lowest peak stress of 0.017 MPa at S3. The repeated sample run according to DoE (i.e., 7, 16, and 17) showed similar peak stresses of 0.0216 MPa on average, whereas the similar sample of runs (i.e., 4 and 6) had a radial stress of 0.017 MPa. The red bars indicate the repeated experiments in the DoE with same inputs.
Further, the tangential stresses were also calculated on all 17 runs. Figure 14 shows the tangential results of 17 samples. The peak tangential stresses were significantly higher than the radial stresses. The highest peak tangential stresses were found in sample 5 of 0.152 MPa and the minimum stresses were found in sample 3. Similar to radial stress, the repeated samples of the Box-Behnken model (i.e., S7, S16, and S17) have similar tangential stress of an average of 0.057 MPa, whereas the rest of the similar samples (S4 and S6) showed lower tangential stress of an average of 0.045 MPa. The red bars indicate the repeated experiments in the DoE with same inputs.

4. Discussions

4.1. Morphological Analysis

In this study, the effect of CNTs addition to Cu powder on the sintering behavior resulted in interesting morphological features of the resulting metal matrix composite. This study explored the impact of CNT concentration, laser power, and scan speed on the sintering process of the CNTs/Cu composite. The SEM analysis and Energy Dispersive X-ray (EDX) were conducted to examine the morphological and elemental properties of the sintered composites. The study found that the addition of CNTs to the Cu powder resulted in significant improvements in the sintering behavior of the composite. The three types of strengthening mechanisms for CNTs reinforced metal matrix composites reported in the literature are thermal mismatch, Orowan looping, and shear-lag theory [25]. Zhou et al. [42] suggested that the load transfer mechanism and bridging mechanism of CNTs are primarily responsible for the property enhancement of CNTs/Al composites. The mechanical characteristics of CNTs/Cu composites were that the evenly dispersed CNTs in grain boundaries have a pinning effect on inhibiting grain development, increasing grain boundaries, and refining grains, which simultaneously increase strength and flexibility. As mentioned in the literature as well, the mixing of CNT-metal powders determines how the CNTs are distributed in the matrix [43]. Ball milling is a commonly used technique reported in the literature for the uniform mixing of the powders that affect the sintering process. However, this technique requires 6 to 7 h for uniform powder mixing. Comparatively, the Resodyn Acoustic mixer provides similar results in a few minutes. A higher laser power and lower scan speed increase the temperature of the composite pellet during laser sintering, which affects the consolidation of the powder particles.
The SEM analysis conducted on the samples revealed interesting findings related to the concentration of carbon nanotubes (CNTs) and laser power during the laser sintering process. The results indicated that lower concentrations of CNTs (0.2 wt.%) with higher laser power of 400 W produced residual porosity (as shown in Figure 5a). However, by lowering the laser power, the consolidation of the particles increased [40].
Increasing the concentration of CNTs up to 0.4 wt.% led to different behavior of the sintered samples. The overlapping of particles occurred at a lower scan speed of 1–1.5 mm/s, while sintering at a higher laser power of 400 W formed small pores on the surface. Moreover, at a low laser power of 300 W and a high scan speed of 2 mm/s, coarse particles were created (as shown in Figure 7c). The finest outcome was achieved using a concentration of 0.4 wt.% of CNTs, as evidenced in Figure 6b, with an even distribution of particles.
Further SEM examination of the samples revealed that a high percentage of CNTs in the composite and the slow scan speed of the laser provided better consolidation (as shown in Figure 12) of the particles after laser sintering. However, a slow scan speed also resulted in porosity in the pellets. Energy Dispersive X-ray (EDX) investigation was carried out on the surface of the same composite to confirm the presence of Cu, O, and C. Since copper cannot create carbides, the carbon signal in the EDX provides proof that the sample contains carbon nanotubes [44]. These findings suggest that the concentration of CNTs and laser power are critical parameters in determining the quality of the sintered samples. Higher concentrations of CNTs and slower scan speeds of the laser provide better consolidation of the particles, but they also increase the risk of porosity. On the other hand, lower concentrations of CNTs and higher laser powers can cause residual porosity and small pores on the surface. Therefore, a balance must be achieved between these parameters to obtain the desired outcome. The results obtained from SEM analysis and EDX investigation provide insights into how CNTs behave during the laser sintering process. These findings can be applied to optimize sintering parameters to produce high-quality CNT-based composites.

4.2. Density

The study of Cu-CNTs samples revealed that the concentration of CNTs and laser parameters significantly impact the density of the samples. These findings are consistent with the previous research reported in the literature [7,45]. When the concentration of CNTs was increased to 0.6 wt.% in the copper composite, the relative density of the samples increased to 99.21%. Similar studies in the literature have also reported that the addition of CNTs to metal powder increases the laser absorption rate and leads to an increase in the produced part’s relative density [46,47].
However, it was found that by adjusting the laser parameters such as scan speed and laser power, a relative density of 98.3% could also be achieved with a 0.4 w.t% concentration of CNTs in the sample (S9). This suggests that the optimization of laser parameters can be utilized to enhance the density of CNT-reinforced metal matrix composites, potentially reducing the amount of CNTs required to achieve the desired property levels. Higher CNT concentration could lead to a saturation of reinforcement, and hence could potentially negatively impact the final part properties. It is worth noting that the density of composite material is an important factor that influences its mechanical and physical properties. Higher density generally leads to improved strength, stiffness, and thermal conductivity, making it a desirable property for many applications. Therefore, the ability to control the density of CNT-based composites by adjusting laser parameters and the concentration of CNTs could have a significant impact on the optimization of their properties for various industrial applications.

4.3. Hardness

The results of the hardness tests conducted on the Cu-CNT samples revealed that the laser power, CNT concentration, and scan speed have a significant impact on the hardness of the samples. The observed variation in hardness can be attributed to several factors, such as the formation of defects and the formation of new phases during laser processing. The increase in hardness with increasing laser power is a well-known phenomenon in the field, as higher laser power leads to more energy input into the samples, which promotes the formation of new phases and the elimination of defects. These new phases could include intermetallic compounds or solid solutions that have a higher hardness than the original materials [48]. On the other hand, the decrease in hardness with increasing CNT concentration could be explained by the agglomeration of CNTs. When the concentration of CNTs is high, they tend to agglomerate, which could create defects in the structure of the composite and reduce the effectiveness of the laser processing. This could lead to a reduction in the hardness of the samples [49]. Interestingly, the effect of scan speed on hardness was mixed, suggesting that the optimal scan speed may depend on other factors such as laser power and CNT concentration. This implies that the optimization of laser processing parameters requires a systematic investigation to identify the most effective processing conditions for the specific composite material under consideration.
The findings from this study could help in the development of CNT-based composites with tailored hardness values for specific applications. By carefully selecting the processing parameters, the hardness of the composites could be optimized, leading to improved mechanical properties and potential applications in various industrial sectors.

4.4. Indentation Test

The tensile strength of the samples was evaluated through an indentation test, and the results indicate that the laser sintering parameters have a significant impact on the strength of the samples. An increase in laser power was found to have the greatest effect on the radial and tangential values of the samples’ strength. It is suggested that a higher laser power provides greater energy input, leading to better atomic dispersion and bonding between particles [50]. However, the concentration of CNTs and the scan speed also played a role in determining the strength of the samples. Sample 3, with a higher laser power and a low concentration of CNTs, exhibited the highest brittle failure due to the low mechanical bonding of the particles caused by a fast scan speed of 1.5 mm/s. On the other hand, a slow scan speed is believed to improve the laser absorption of the material, leading to better consolidation of the particles. However, the slow scan speed could also result in higher porosity in the samples [46]. It is essential to find an optimal combination of laser sintering parameters to achieve the desired strength and properties of the samples. Future studies can investigate the effects of other factors, such as the type and size of CNTs, the composition of the base material, and the shape and orientation of the particles, on the tensile strength and other mechanical properties of the composites. Future research in this area should also explore the effect of other processing parameters on the hardness of the composites, such as the size and type of CNTs, and the composition of the base material.

5. Conclusions

The findings of this research work offer valuable insights into the enhancement of copper powder absorption by incorporating varying percentages of carbon nanotubes (CNTs). The goal of this study was to increase the laser power absorption capacity of the copper powder through the inclusion of CNTs, up to a maximum of 0.6 wt.%. The optical properties of the CNTs mixed with copper powder were examined using spectroscopy, which revealed that the IR laser reflectance of the copper powder was reduced by 8%. To mitigate contamination and oxidation during the sintering process, a specially designed laser sintering rig was utilized. The temperature of the pellet during sintering was monitored using a thermal camera, and the laser operating parameters were adjusted to control it. The use of the sintering rig led to the improved consolidation of powder particles as compared to laser sintering in an open atmosphere. Powder metallurgy was employed to produce Cu-CNT composites, and the influence of CNTs on the composites’ characteristics was investigated. The mechanical and morphological features were determined, and the physical properties of the laser-sintered sample, such as density and hardness, were analyzed using the Box-Behnken model for response surface methodology (RSM) where a maximum average hardness of 66.5 HV was observed. Indentation test results of the samples revealed maximum tangential and radial stresses of 0.148 MPa and 0.058 MPa, respectively. The results demonstrated that the addition of CNTs improved the sintering behavior and refined the grain structure, leading to an increase in strength and flexibility. The SEM analysis revealed that lower concentrations of CNTs and higher laser powers could cause residual porosity, while higher CNT concentrations and slower scan speeds led to better particle consolidation. The study also found that adjusting laser parameters could enhance the density of CNT-reinforced composites. Overall, the research work provides valuable insights into optimizing the sintering process for CNT-based composites for various applications. It highlights the importance of carefully selecting the CNT concentration and laser parameters to achieve the desired properties of the composite. This research work has practical implications for various industries that use metal-based composites in their products. The findings of this study can be used to improve the strength, hardness, and density of metal-based composites. Additionally, it can assist in the development of new, innovative materials that incorporate CNTs for a wide range of applications, such as in the electronics, aerospace, and automotive industries. The research work can also be extended to investigate the use of other nanomaterials in metal-based composites to identify alternative composite options.

Author Contributions

Conceptualization, H.A., L.A.K., E.M., I.U.A., K.F. and D.B.; methodology, H.A., L.A.K., E.M., I.U.A., K.F. and D.B.; validation, I.U.A. and D.B.; formal analysis, H.A., I.U.A. and D.B.; investigation, H.A., I.U.A. and D.B.; writing—original draft, H.A.; writing—review and editing, H.A., L.A.K., I.U.A. and D.B.; visualization, E.M.; supervision, K.F. and D.B.; funding acquisition, D.B. All authors have read and agreed to the published version of the manuscript.

Funding

This work is supported in part by a research grant from the Science Foundation Ireland (SFI) under Grant Numbers 16/RC/3872, 19/US-C2C/3579, and is co-funded under the European Regional Development Fund.

Data Availability Statement

The data will be available on request.

Conflicts of Interest

The authors declare no conflict of interest.

Nomenclature

CNTsCarbon Nanotubes
CuCopper
SWCNTsSingle-walled carbon nanotubes
WWatts
ρ l Liquid Density
mlMass in liquid
ρ C u C Density of Cu-CNTs
H V Vickers pyramid number
NNewton
FForce
E Energy
VScanning speed
WtWeight
DoEDesign of experiment
IRInfrared
MMCsMetal matrix composites
μmMicrometer
ρ s Sample density
maMass in air
ϕPorosity
DDiameter
σ r Radial stress
σ t Tangential stress
PLaser power
SEMScanning electron microscopy
3DThree-dimensional
MPaMegapascal
FTIRFourier transform infrared

References

  1. Kianian, B. Comparing Acquisition and Operation Life Cycle Costs of Powder Metallurgy and Conventional Wrought Steel Gear Manufacturing Techniques. Procedia CIRP 2019, 81, 1101–1106. [Google Scholar] [CrossRef]
  2. Vasanthakumar, P.; Sekar, K.; Venkatesh, K. Recent developments in powder metallurgy based aluminium alloy composite for aerospace applications. Mater. Today Proc. 2019, 18, 5400–5409. [Google Scholar] [CrossRef]
  3. Ghosh, S. Electroless copper deposition: A critical review. Thin Solid Films 2019, 669, 641–658. [Google Scholar] [CrossRef]
  4. Nazari, K.A.; Nouri, A.; Hilditch, T. Mechanical properties and microstructure of powder metallurgy Ti-xNb-yMo alloys for implant materials. Mater. Des. 2015, 88, 1164–1174. [Google Scholar] [CrossRef]
  5. Anandaraj, T.; Sethusundaram, P.; Chanakyan, C.; Sakthivelu, S.; Meignanamoorthy, M. Influence of different reinforcements on properties of metal matrix composites: A review. Mater. Today Proc. 2020, 37, 3480–3484. [Google Scholar] [CrossRef]
  6. Gao, X.; Yue, H.; Guo, E.; Zhang, S.; Yao, L.; Lin, X.; Wang, B.; Guan, E. Tribological properties of copper matrix composites reinforced with homogeneously dispersed graphene nanosheets. J. Mater. Sci. Technol. 2018, 34, 1925–1931. [Google Scholar] [CrossRef]
  7. Yan, X.; Chang, C.; Dong, D.; Gao, S.; Ma, W.; Liu, M.; Liao, H.; Yin, S. Microstructure and mechanical properties of pure copper manufactured by selective laser melting. Mater. Sci. Eng. A 2020, 789, 139615. [Google Scholar] [CrossRef]
  8. Colopi, M.; Demir, A.G.; Caprio, L.; Previtali, B. Limits and solutions in processing pure Cu via selective laser melting using a high-power single-mode fiber laser. Int. J. Adv. Manuf. Technol. 2019, 104, 2473–2486. [Google Scholar] [CrossRef]
  9. Oyar, P. Laser Sintering Technology and Balling Phenomenon. Photomed. Laser Surg. 2018, 36, 72–77. [Google Scholar] [CrossRef]
  10. Vora, P.; Mumtaz, K.; Todd, I.; Hopkinson, N. AlSi12 in-situ alloy formation and residual stress reduction using anchorless selective laser melting. Addit. Manuf. 2015, 7, 12–19. [Google Scholar] [CrossRef]
  11. Bartolomeu, F.; Buciumeanu, M.; Pinto, E.; Alves, N.; Carvalho, O.; Silva, F.S.; Miranda, G. 316L stainless steel mechanical and tribological behavior—A comparison between selective laser melting, hot pressing and conventional casting. Addit. Manuf. 2017, 16, 81–89. [Google Scholar] [CrossRef]
  12. Tanabi, H.; Erdal, M. Effect of CNTs dispersion on electrical, mechanical and strain sensing properties of CNT/epoxy nanocomposites. Results Phys. 2018, 12, 486–503. [Google Scholar] [CrossRef]
  13. Wang, F.; Zhang, K.; Liang, W.; Wang, Z.; Tay, T.E.; Lu, S.; Yang, B. Epoxy/CNT@X nanocomposite: Improved quasi-static, dynamic fracture toughness, and conductive functionalities by non-ionic surfactant treatment. Polym. Test. 2019, 81, 106256. [Google Scholar] [CrossRef]
  14. Alam, T.; Ansari, A.H.; Arif, S.; Alam, N. Mechanical properties and morphology of aluminium metal matrix nanocomposites-stir cast products. Adv. Mater. Process. Technol. 2017, 3, 600–615. [Google Scholar] [CrossRef]
  15. Liu, Y.; Wang, F.; Cao, Y.; Nie, J.; Zhou, H.; Yang, H.; Liu, X.; An, X.; Liao, X.; Zhao, Y.; et al. Unique defect evolution during the plastic deformation of a metal matrix composite. Scr. Mater. 2018, 162, 316–320. [Google Scholar] [CrossRef]
  16. Stalin, B.; Ravichandran, M.; Sudha, G.; Karthick, A.; Prakash, K.S.; Asirdason, A.B.; Saravanan, S. Effect of titanium diboride ceramic particles on mechanical and wear behaviour of Cu-10 wt% W alloy composites processed by P/M route. Vacuum 2020, 184, 109895. [Google Scholar] [CrossRef]
  17. Casati, R.; Vedani, M. Metal Matrix Composites Reinforced by Nano-Particles—A Review. Metals 2014, 4, 65–83. [Google Scholar] [CrossRef]
  18. Ikeshoji, T.-T.; Nakamura, K.; Yonehara, M.; Imai, K.; Kyogoku, H. Selective Laser Melting of Pure Copper. JOM 2017, 70, 396–400. [Google Scholar] [CrossRef]
  19. Datsyuk, V.; Kalyva, M.; Papagelis, K.; Parthenios, J.; Tasis, D.; Siokou, A.; Kallitsis, I.; Galiotis, C. Chemical oxidation of multiwalled carbon nanotubes. Carbon 2008, 46, 833–840. [Google Scholar] [CrossRef]
  20. Jung, M.; Lee, Y.-S.; Hong, S.-G.; Moon, J. Carbon nanotubes (CNTs) in ultra-high performance concrete (UHPC): Dispersion, mechanical properties, and electromagnetic interference (EMI) shielding effectiveness (SE). Cem. Concr. Res. 2020, 131, 106017. [Google Scholar] [CrossRef]
  21. Yu, J.; Grossiord, N.; Koning, C.E.; Loos, J. Controlling the dispersion of multi-wall carbon nanotubes in aqueous surfactant solution. Carbon 2007, 45, 618–623. [Google Scholar] [CrossRef]
  22. Vaisman, L.; Wagner, H.D.; Marom, G. The role of surfactants in dispersion of carbon nanotubes. Adv. Colloid Interface Sci. 2007, 130, 37–46. [Google Scholar] [CrossRef] [PubMed]
  23. Singh, S.C.E.; Selvakumar, N. Effect of milled B4C nanoparticles on tribological analysis, microstructure and mechanical properties of Cu-4Cr matrix produced by hot extrusion. Arch. Civ. Mech. Eng. 2017, 17, 446–456. [Google Scholar] [CrossRef]
  24. Nouari, S. Effect of Processing on the Dispersion of CNTs in Al-Nanocomposites. Adv. Mater. Res. 2011, 239–242, 759–763. [Google Scholar] [CrossRef]
  25. George, R.; Kashyap, K.; Rahul, R.; Yamdagni, S. Strengthening in carbon nanotube/aluminium (CNT/Al) composites. Scr. Mater. 2005, 53, 1159–1163. [Google Scholar] [CrossRef]
  26. Poirier, D.; Gauvin, R.; Drew, R.A. Structural characterization of a mechanically milled carbon nanotube/aluminum mixture. Compos. Part A Appl. Sci. Manuf. 2009, 40, 1482–1489. [Google Scholar] [CrossRef]
  27. Jenei, P.; Yoon, E.; Gubicza, J.; Kim, H.; Lábár, J.; Ungár, T. Microstructure and hardness of copper-carbon nanotube composites consolidated by High Pressure Torsion. Mater. Sci. Eng. A 2011, 528, 4690–4695. [Google Scholar] [CrossRef]
  28. Ruoff, R.S.; Qian, D.; Liu, W.K. Mechanical properties of carbon nanotubes: Theoretical predictions and experimental measurements. Comptes Rendus Phys. 2003, 4, 993–1008. [Google Scholar] [CrossRef]
  29. Demczyk, B.; Wang, Y.; Cumings, J.; Hetman, M.; Han, W.; Zettl, A.; Ritchie, R. Direct mechanical measurement of the tensile strength and elastic modulus of multiwalled carbon nanotubes. Mater. Sci. Eng. A 2002, 334, 173–178. [Google Scholar] [CrossRef]
  30. De Heer, W.A. Nanotubes and the Pursuit of Applications. MRS Bull. 2004, 29, 281–285. [Google Scholar] [CrossRef]
  31. Soulier, M.; Benayad, A.; Teulon, L.; Oudart, Y.; Senol, S.; Vanmeensel, K. Nanocomposite powder for powder-bed-based additive manufacturing obtained by dry particle coating. Powder Technol. 2022, 404, 117474. [Google Scholar] [CrossRef]
  32. Ayub, H.; Khan, L.A.; McCarthy, E.; Ahad, I.U.; Fleischer, K.; Brabazon, D. Investigating the morphology, hardness, and porosity of copper filters produced via Hydraulic Pressing. J. Mater. Res. Technol. 2022, 19, 208–219. [Google Scholar] [CrossRef]
  33. Kazup, Á.; Fegyverneki, G.; Gácsi, Z. Evaluation of the Applicability of Computer-Aided Porosity Testing Methods for Different Pore Structures. Met. Microstruct. Anal. 2022, 11, 774–789. [Google Scholar] [CrossRef]
  34. Yanıkoğlu, N.D.; Sakarya, R.E. Test methods used in the evaluation of the structure features of the restorative materials: A literature review. J. Mater. Res. Technol. 2020, 9, 9720–9734. [Google Scholar] [CrossRef]
  35. Yang, Z.; Peng, H.; Wang, W.; Liu, T. Crystallization Behavior of Poly(ε-Caprolactone)/Layered Double Hydroxide Nanocomposites. J. Appl. Polym. Sci. 2010, 116, 2658–2667. [Google Scholar] [CrossRef]
  36. Guo, Q.; Zhao, C.; Qu, M.; Xiong, L.; Escano, L.I.; Hojjatzadeh, S.M.H.; Parab, N.D.; Fezzaa, K.; Everhart, W.; Sun, T.; et al. In-situ characterization and quantification of melt pool variation under constant input energy density in laser powder bed fusion additive manufacturing process. Addit. Manuf. 2019, 28, 600–609. [Google Scholar] [CrossRef]
  37. Liu, S.; Li, H.; Qin, C.; Zong, R.; Fang, X. The effect of energy density on texture and mechanical anisotropy in selective laser melted Inconel 718. Mater. Des. 2020, 191, 108642. [Google Scholar] [CrossRef]
  38. Constantin, L.; Fan, L.; Mortaigne, B.; Keramatnejad, K.; Zou, Q.; Azina, C.; Lu, Y.F.; Silvain, J.-F. Laser sintering of cold-pressed Cu powder without binder use. Materialia 2018, 3, 178–181. [Google Scholar] [CrossRef]
  39. Hess, A.; Schuster, R.; Heider, A.; Weber, R.; Graf, T. Continuous Wave Laser Welding of Copper with Combined Beams at Wavelengths of 1030nm and of 515nm. Phys. Procedia 2011, 12, 88–94. [Google Scholar] [CrossRef]
  40. Pappas, J.M.; Dong, X. Porosity characterization of additively manufactured transparent MgAl2O4 spinel by laser direct deposition. Ceram. Int. 2019, 46, 6745–6755. [Google Scholar] [CrossRef]
  41. Nagira, T.; Liu, X.; Ushioda, K.; Fujii, H. Mechanism of grain structure development for pure Cu and Cu-30Zn with low stacking fault energy during FSW. Sci. Technol. Weld. Join. 2020, 25, 669–678. [Google Scholar] [CrossRef]
  42. Zhou, J.; Zhong, K.; Zhao, C.; Meng, H.; Qi, L. Effect of carbon nanotubes grown temperature on the fracture behavior of carbon fiber reinforced magnesium matrix composites: Interlaminar shear strength and tensile strength. Ceram. Int. 2020, 47, 6597–6607. [Google Scholar] [CrossRef]
  43. Kim, K.T.; Cha, S.I.; Hong, S.H.; Hong, S.H. Microstructures and tensile behavior of carbon nanotube reinforced Cu matrix nanocomposites. Mater. Sci. Eng. A 2006, 430, 27–33. [Google Scholar] [CrossRef]
  44. Uddin, S.M.; Mahmud, T.; Wolf, C.; Glanz, C.; Kolaric, I.; Volkmer, C.; Höller, H.; Wienecke, U.; Roth, S.; Fecht, H.-J. Effect of size and shape of metal particles to improve hardness and electrical properties of carbon nanotube reinforced copper and copper alloy composites. Compos. Sci. Technol. 2010, 70, 2253–2257. [Google Scholar] [CrossRef]
  45. Duan, B.; Zhou, Y.; Wang, D.; Zhao, Y. Effect of CNTs content on the microstructures and properties of CNTs/Cu composite by microwave sintering. J. Alloy. Compd. 2018, 771, 498–504. [Google Scholar] [CrossRef]
  46. Constantin, L.; Wu, Z.; Li, N.; Fan, L.; Silvain, J.-F.; Lu, Y.F. Laser 3D printing of complex copper structures. Addit. Manuf. 2020, 35, 101268. [Google Scholar] [CrossRef]
  47. Jiang, Q.; Zhang, P.; Yu, Z.; Shi, H.; Wu, D.; Yan, H.; Ye, X.; Lu, Q.; Tian, Y. A Review on Additive Manufacturing of Pure Copper. Coatings 2021, 11, 740. [Google Scholar] [CrossRef]
  48. Park, C.; Jung, D.; Chun, E.-J.; Ahn, S.; Jang, H.; Kim, Y.-J. Effect of laser shock peening without coating on fretting corrosion of copper contacts. Appl. Surf. Sci. 2020, 514, 145917. [Google Scholar] [CrossRef]
  49. Babu, R.V.; Kanagaraj, S. Effect of different processing techniques on hardness, electrical and thermal conductivity of Copper/Carbon nanotube composites for industrial applications. Diam. Relat. Mater. 2021, 120, 108634. [Google Scholar] [CrossRef]
  50. Ghayoor, M.; Lee, K.; He, Y.; Chang, C.-H.; Paul, B.K.; Pasebani, S. Selective laser melting of austenitic oxide dispersion strengthened steel: Processing, microstructural evolution and strengthening mechanisms. Mater. Sci. Eng. A 2020, 788, 139532. [Google Scholar] [CrossRef]
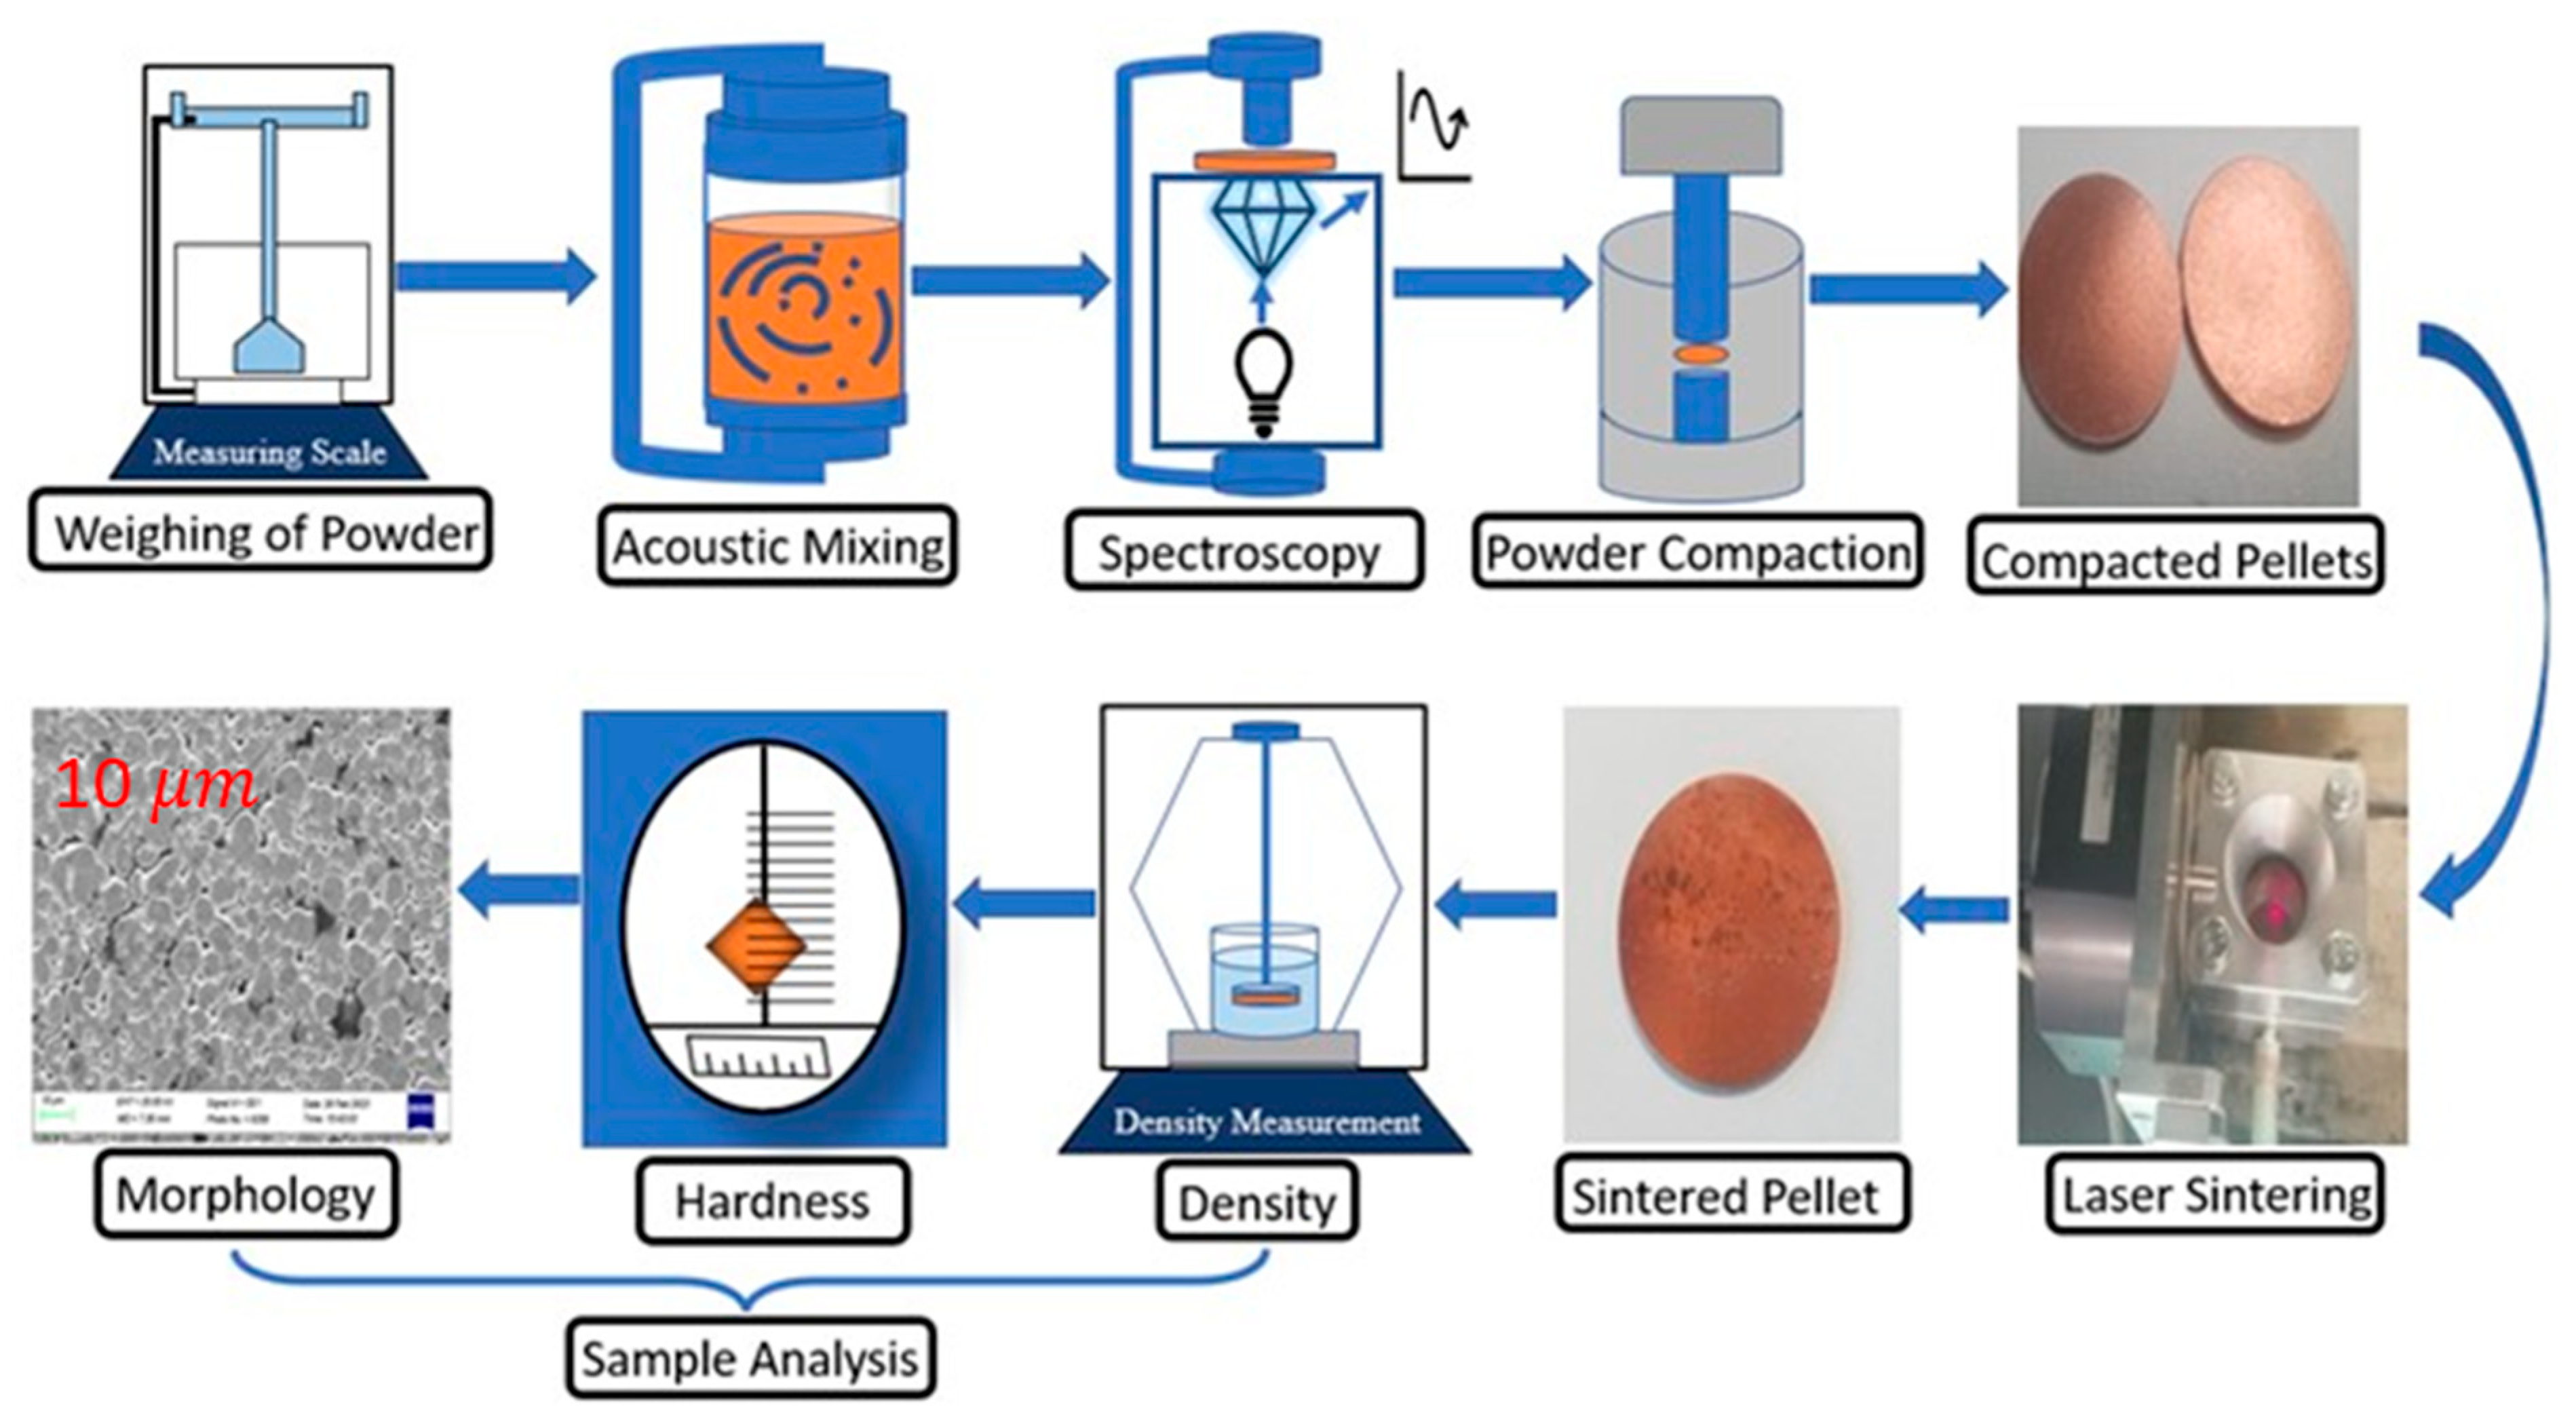
Figure 1. Schematic of the experimental sample fabrication procedure and analysis.
Metals 13 01984 g001
Figure 2. Schematic of laser sintering setup demonstrating the passage for the laser beam, gas outlet, laser spectrum bandpass filter, and copper pellet in the inert environment.
Metals 13 01984 g002
Figure 3. FTIR reflection of pure and Cu-CNTs composite at 0.2, 0.4, and 0.6 wt.%.
Metals 13 01984 g003
Figure 4. Laser-sintered pellets: (a) 600 W laser power, (b) 500 W laser power, (c) 450 W laser power, and (d) 400 W laser power.
Metals 13 01984 g004
Figure 5. Micrographs of laser-sintered pellets Cu with 0.2 wt.% of CNTs corresponding to the Box-Behnken represented (a,e) S3 (400 W, 1.5 mm/s), (b,f) S11 (350 W, 2 mm/s), (c,g) S13 (300 W, 1.5 mm/s), and (d,h) S15 (300 W, 1 mm/s) with EDX analysis.
Metals 13 01984 g005
Figure 6. Micrographs results of laser-sintered pellets Cu with 0.4% of CNTs corresponding to the Box-Behnken represented: (a,e) S2 (300 W, 1 mm/s), (b,f) S4 (350 W, 1.5 mm/s), (c,g) S6 (350 W, 1.5 mm/s), and (d,h) S7 (350 W, 1.5 mm/s) with EDX analysis.
Metals 13 01984 g006
Figure 7. Micrographs of laser-sintered pellets Cu with 0.4% of CNTs corresponding to the Box-Behnken represented: (a,e) S8 (400 W, 2 mm/s), (b,f) S9 (400 W, 1 mm/s), (c,g) S10 (300 W, 2 mm/s), and (d,h) S16 (350 W, 1.5 mm/s) with EDX analysis.
Metals 13 01984 g007
Figure 8. Micrographs of laser-sintered pellets Cu with 0.6% of CNTs corresponding to the Box-Behnken represented: (a,e) S1 (300 W, 1.5 mm/s), (b,f) S5 (350 W, 2 mm/s), (c,g) S12 (400 W, 1.5 mm/s), and (d,h) S14 (350 W, 1 mm/s) with EDX analysis.
Metals 13 01984 g008
Figure 9. (a) A 3D surface response of relative density at a scan speed of 1 mm/s, (b) 3D surface response of relative density at a scan speed of 1.5 mm/s, and (c) 3D surface response of relative density at a scan speed of 2 mm/s.
Metals 13 01984 g009
Figure 10. Predicted vs. actual values of relative density of sintered samples.
Metals 13 01984 g010
Figure 11. (a) A 3D surface response of hardness at a scan speed of 1 mm/s, (b) 3D surface response of hardness at a scan speed of 1.5 mm/s, and (c) 3D surface response of hardness at a scan speed of 1 mm/s.
Metals 13 01984 g011
Figure 12. Pictures of the samples after indentation testing of the laser-sintered samples.
Metals 13 01984 g012
Figure 13. Experimental results for indentation testing of laser-sintered samples (S1–S17) for radial stress.
Metals 13 01984 g013
Figure 14. Experimental results for indentation testing of laser-sintered samples (S1–S9) for tangential stress.
Metals 13 01984 g014
Table 1. Physical properties of the copper powders and carbon nanotubes used in this study.
Product FormPowder Size (μm)Purity (%)Melting/Boiling Point (°C)Density (g/cm3)
Carbon nanotube (single wall)10–25 μ m 95%2000/40271.74
Copper powder (spheroidal)0.5–2.0 μ m 98%1083/25678.96
Table 2. Sample process parameters according to Box-Behnken design of experiments.
StdRunFactor 1Factor 2Factor 3
A: Laser PowerB: CNTs Conc.C: Scan Speed
(W)(wt.%)(mm/s)
313000.61.5
523000.41
234000.21.5
1343500.41.5
1253500.62
1463500.41.5
1773500.41.5
884000.42
694000.41
7103000.42
11113500.22
4124000.61.5
1133000.21.5
10143500.61
9153500.21
16163500.41.5
15173500.41.5
Table 3. Laser sintering, multiple tracks’ beam parameters, and corresponding energy densities.
Track NumberLaser PowerBeam Spot SizeScan SpeedEnergy DensityTemp. with 0.2 wt.% CNTsTemp. with 0.4% CNTsTemp. with 0.6% CNTs
(W)mmmm/sJ/mm2(°C)(°C)(°C)
1100554374154
320052208998111
42505225132168172
63005160203286335
83505170317385467
114005180547618657
Table 4. Box-Behnken Design of Experiments (DoE) with Response 1 (Relative Density) and Response 2 (Hardness).
StdRunFactor 1Factor 2Factor 3Response 1Response 2
A: Laser PowerB: CNTs Conc.C: Scan SpeedRelative Density Hardness
W%mm/s%(HV)
313000.61.597.7653.82
523000.4196.4955.56
234000.21.597.2054.54
1343500.41.597.7353.48
1253500.6297.8752.86
1463500.41.597.7052.98
1773500.41.597.6853.14
884000.4295.8961.6
694000.4198.3858.48
7103000.4294.1856.48
11113500.2296.2058.62
4124000.61.599.2150.7
1133000.21.594.1066.5
10143500.6198.5449.3
9153500.2197.1054.48
16163500.41.597.7353.08
15173500.41.597.6753.24
Table 5. ANOVA response for the relative density values.
SourceSum of SquaresdfMean SquareF-Valuep-Value
Model28.9593.2210.070.003
A-Laser Power8.318.325.990.0014
B-CNTs Conc.9.6419.6430.210.0009
C-Scan Speed5.0815.0815.90.0053
AB0.682110.68212.140.1872
AC0.00810.0080.0250.8789
BC0.013710.01370.0430.8416
A23.5213.5211.030.0128
B20.336410.33641.050.3388
C21.2911.294.050.0839
Residual2.2370.3193
Lack of Fit2.2330.7441127<0.0001
Pure Error0.002640.0007
Cor Total31.1816
Table 6. Significant validation parameters result in the optimization process.
Verification ParametersObtained Values
R-Squared0.9283
Adjusted R-Squared0.8362
Predicted R-Squared−0.1455
Adequate Precision11.084
Standard Deviation0.565
Mean5.35
Coefficient of Variation (CV %)0.5816
Table 7. Vickers hardness results were measured from the surface of the sample pellets at five different locations and the average of Vickers Hardness at F = 9810 mN (100 p).
Sample No.Mean Diagonal (d) in μmVickers Hardness ValuesAverage
L1L2L3L4L5L1L2L3L4L5
1615755585554495656.15453.82
25755555857.154.156.156.554.15755.56
358.957.95757.960.953.455.356.157.95054.54
4586157555854.14954.156.154.153.48
5606058605951.254.554.550.853.352.86
6625859566048.254.553.358.150.852.98
7596057605853.350.856.750.854.153.14
850.95654575672.158.16256.759.161.6
9605555585250.860.660.254.566.358.48
106058535856.550.854.564.554.558.156.48
11565755575359.156.756.156.764.558.62
12636060.5605846.750.850.750.854.550.7
13505353505072.158.158.172.172.166.5
14606061616451.251.24949.845.349.3
15575957.95757.9545355.356.15454.48
1659.658.459.15959.552.254.453.153.352.453.08
1759.55959.6576052.453.352.257.151.253.24
Disclaimer/Publisher’s Note: The statements, opinions and data contained in all publications are solely those of the individual author(s) and contributor(s) and not of MDPI and/or the editor(s). MDPI and/or the editor(s) disclaim responsibility for any injury to people or property resulting from any ideas, methods, instructions or products referred to in the content.