
Evolution of Irradiation Defects in W and W-Re Systems: A Density Functional Theory and Rate Theory Study
 , , , and
Abstract
:1. Introduction
2. Computational Methodology
2.1. Calculation of Energy Parameters
2.2. Rate Theory Model
3. Results and Discussion
3.1. Energy Parameter Calculation in W
3.2. Energy Parameter Calculation in W-Re
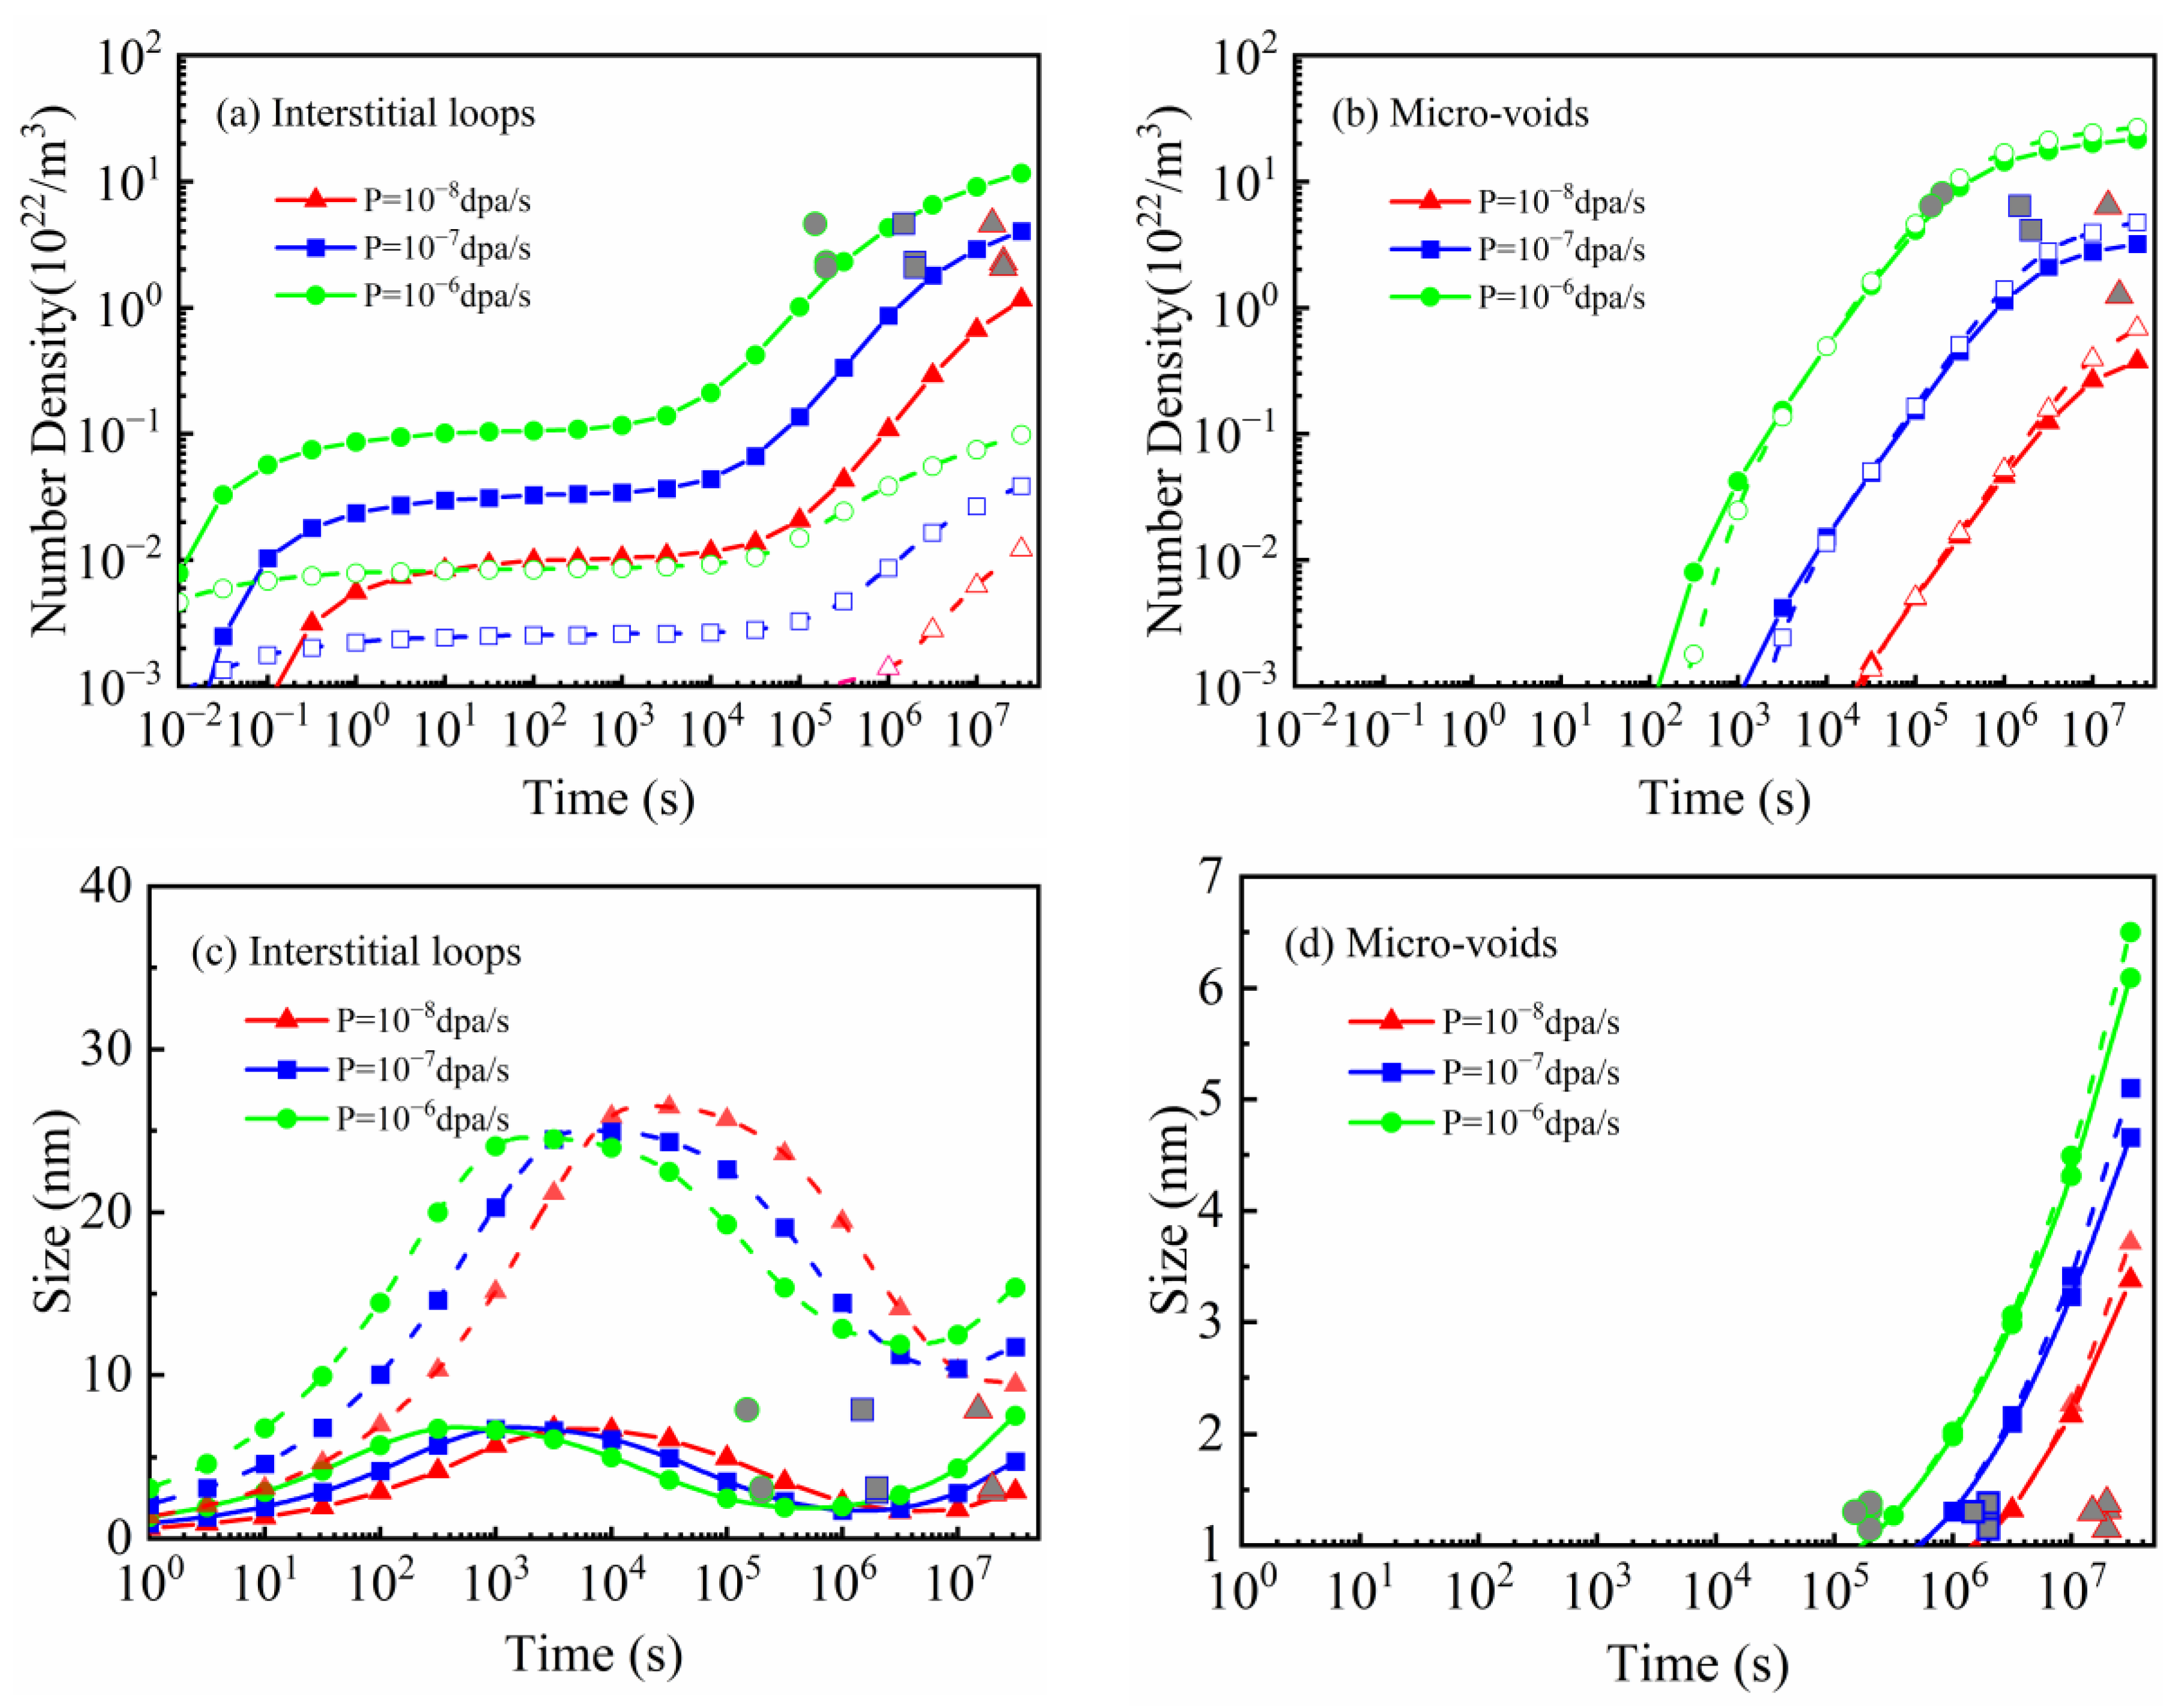
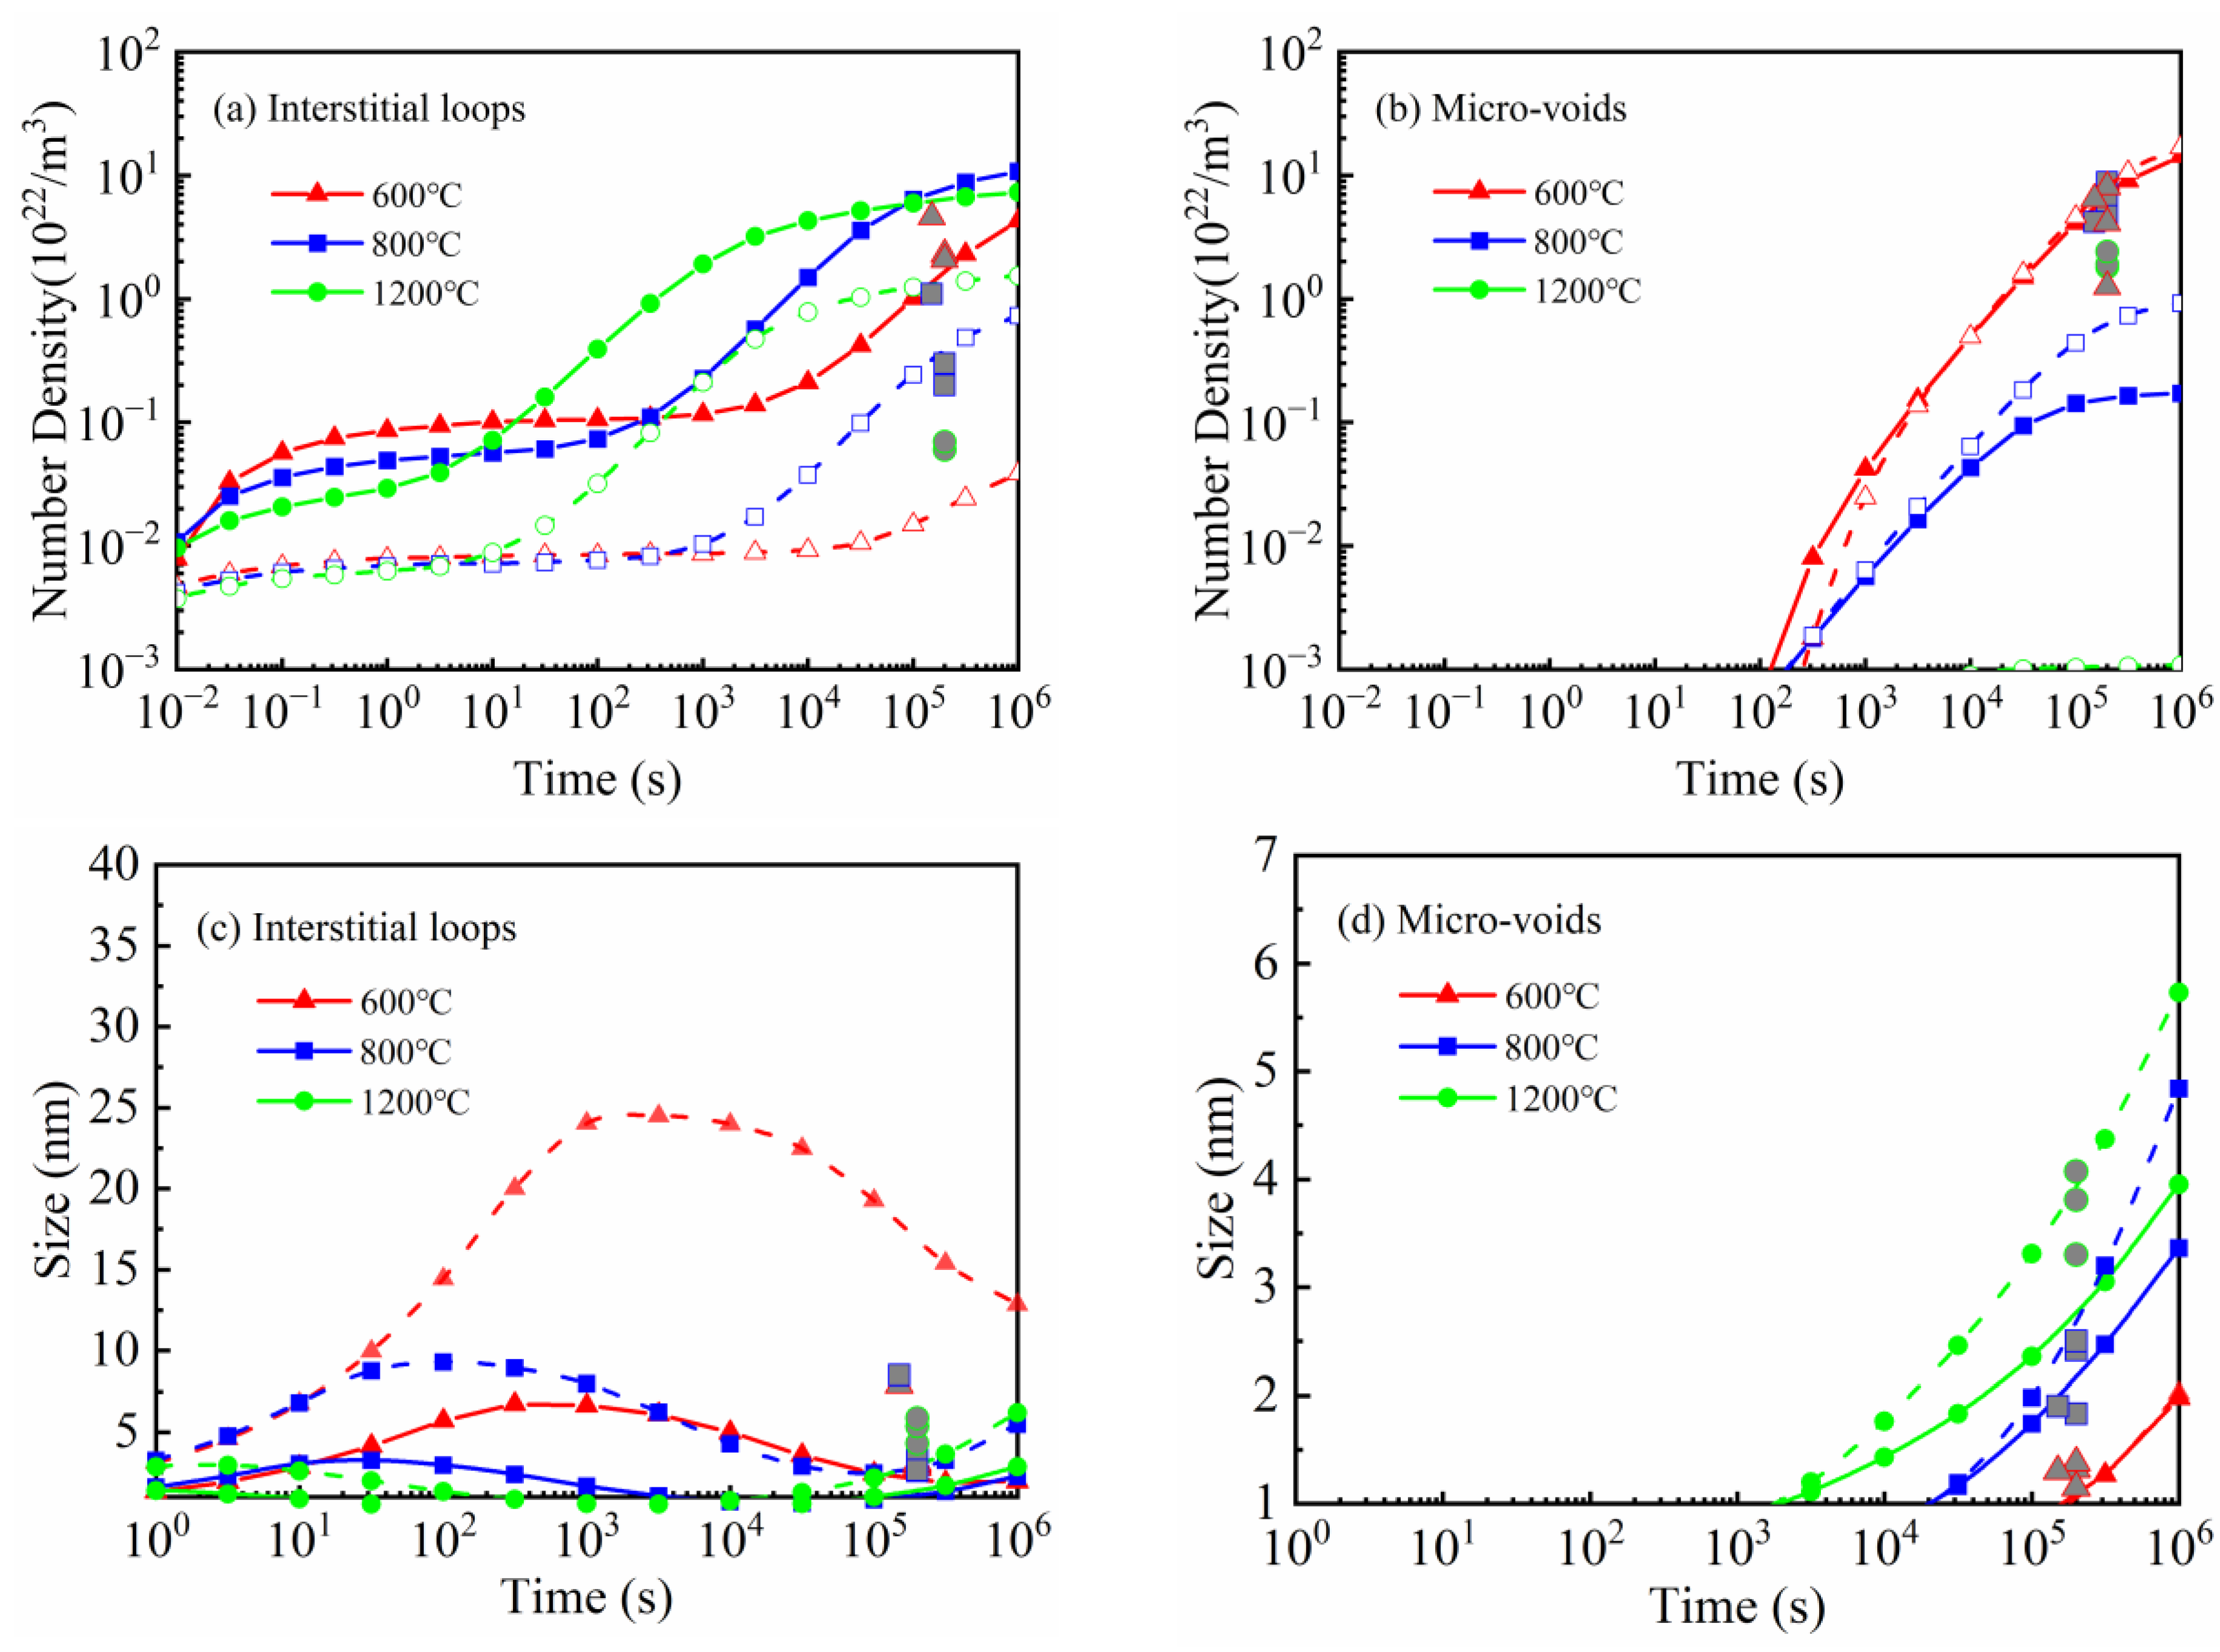
3.3. Rate Theory Calculation for W
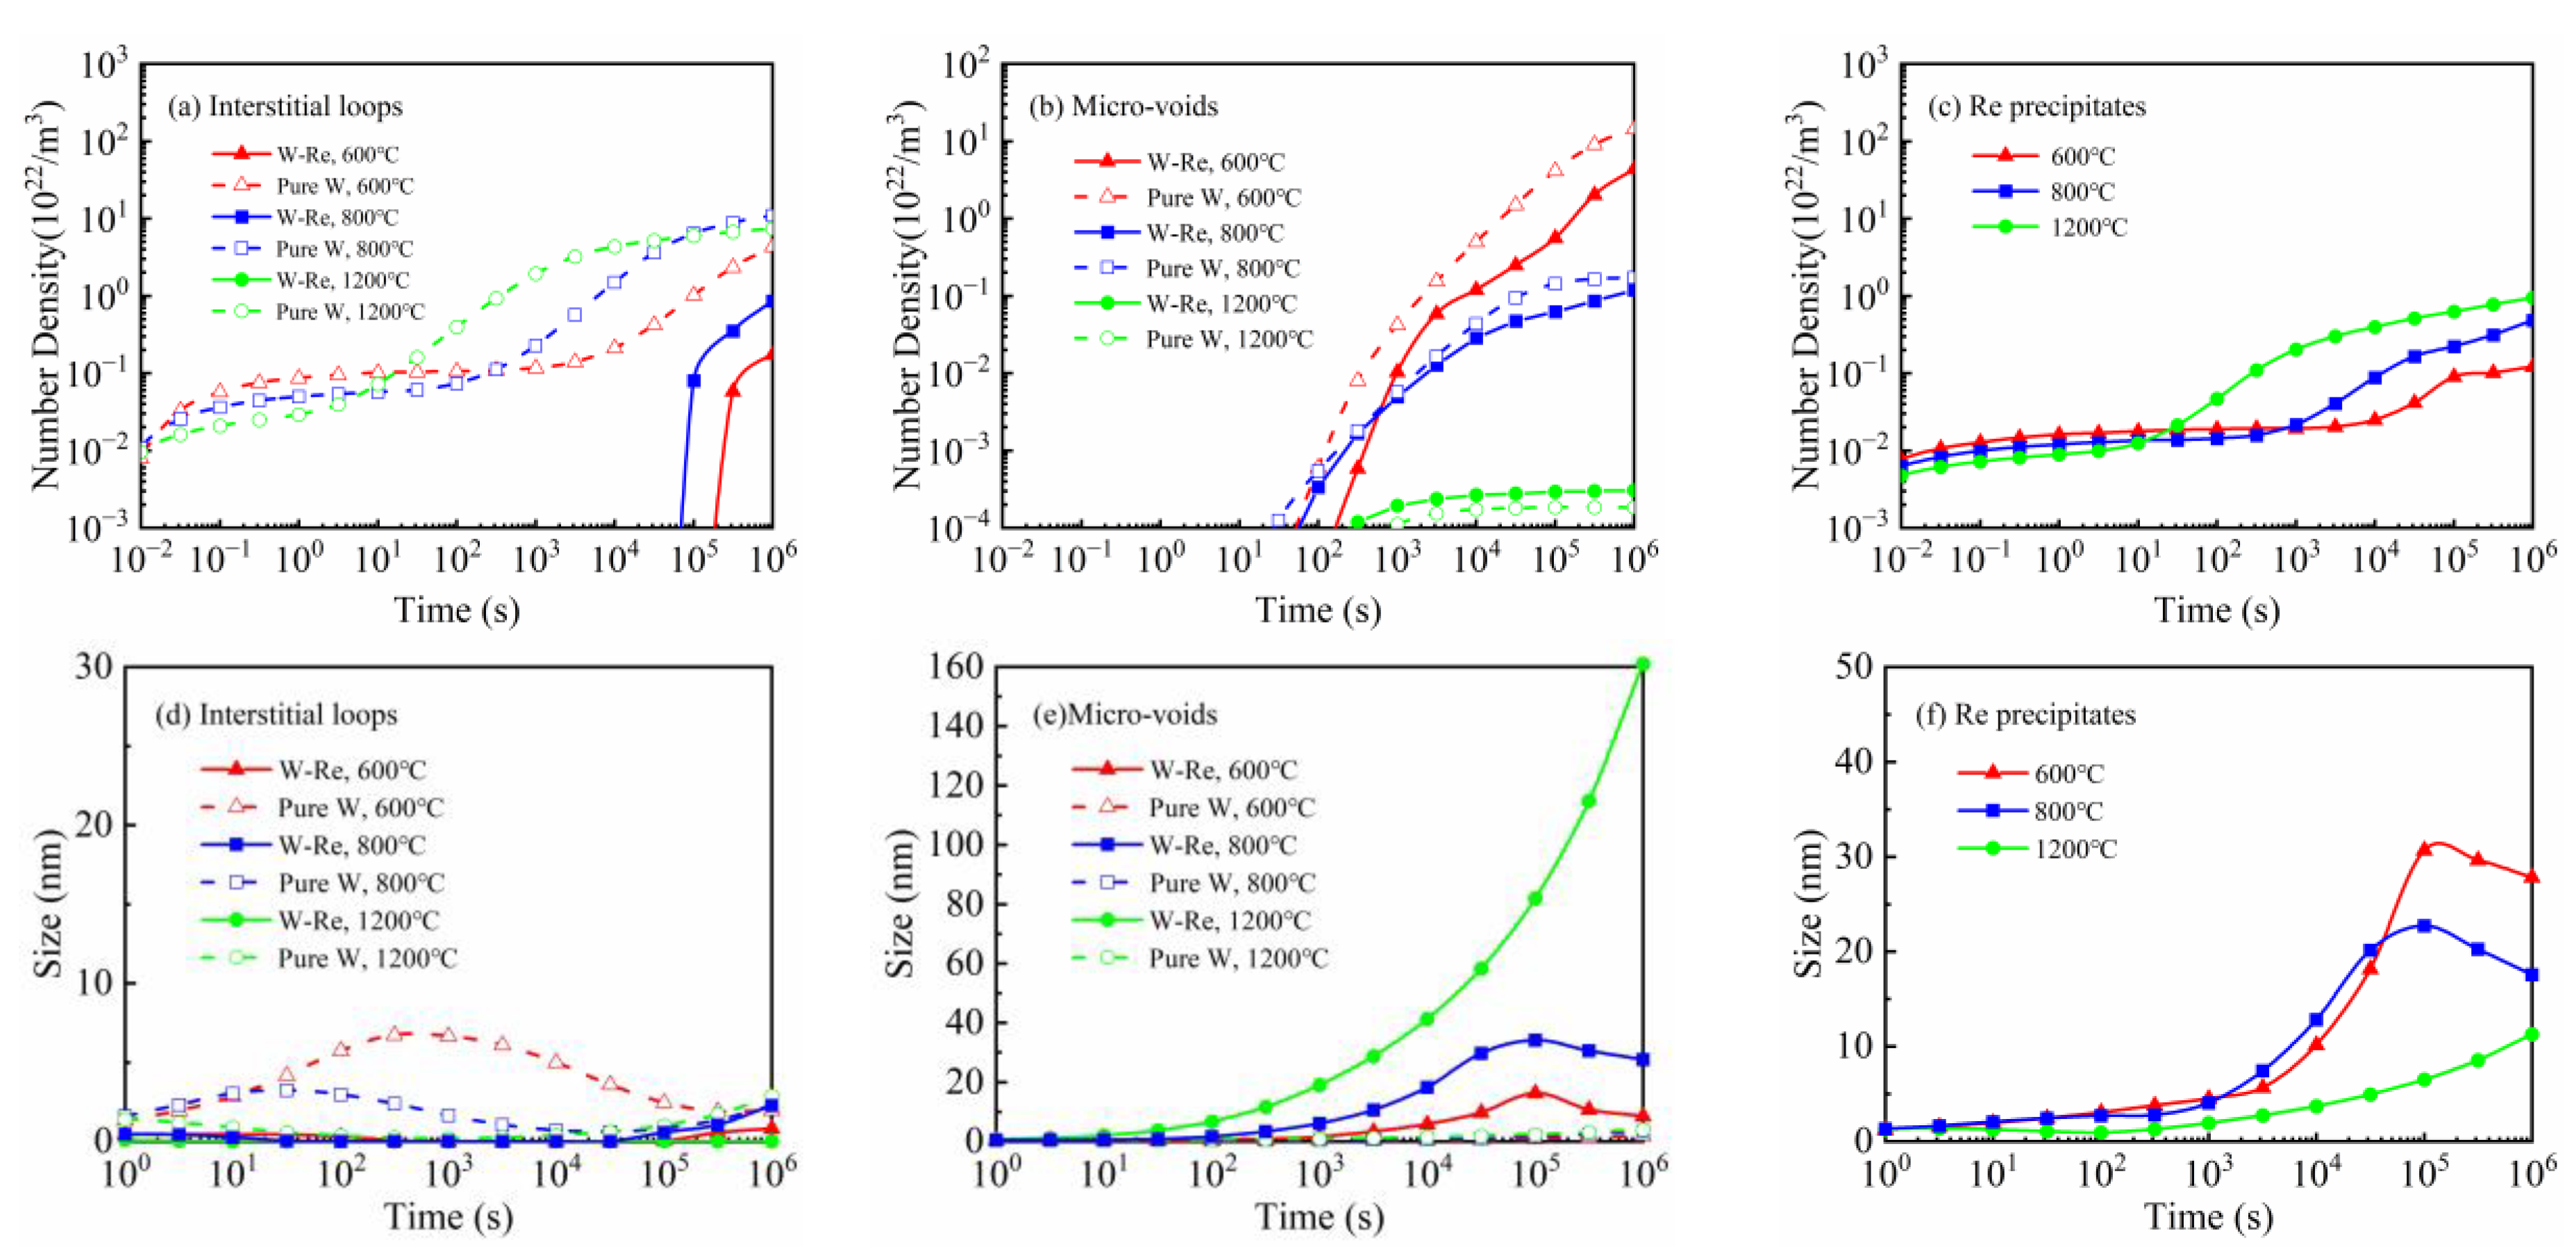
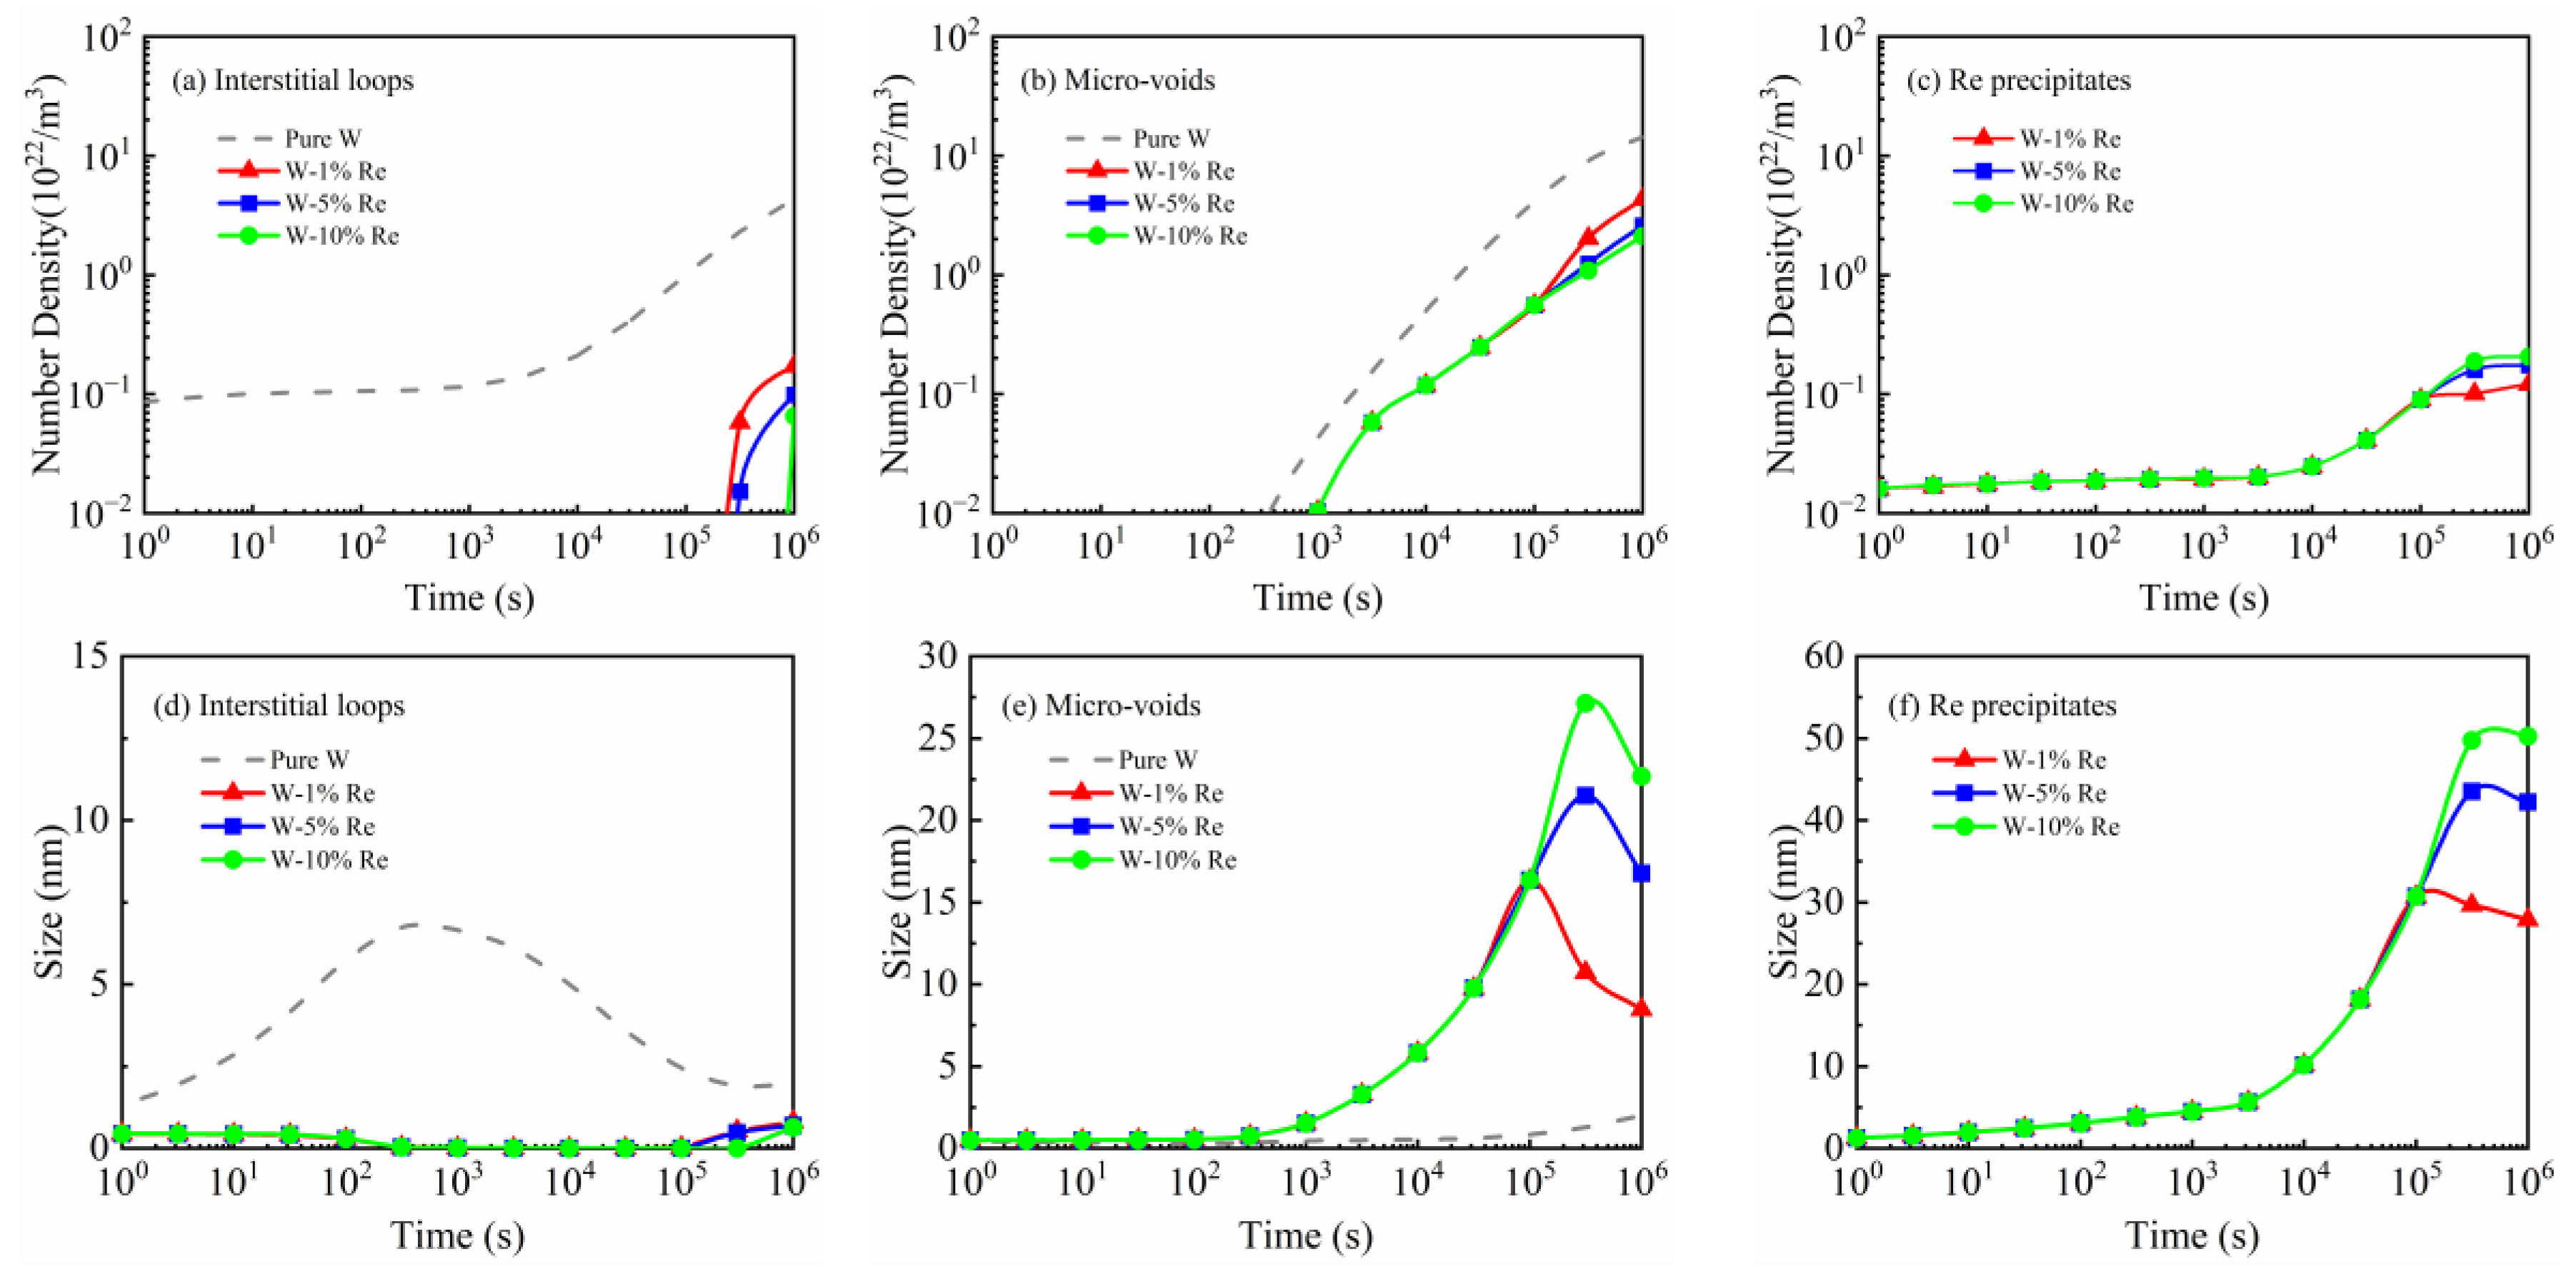
3.4. Rate Theory Calculation for W-Re
4. Conclusions
Author Contributions
Funding
Data Availability Statement
Acknowledgments
Conflicts of Interest
References
- Litnovsky, A.; Klein, F.; Schmitz, J.; Kreter, A.; Rasinski, M.; Coenen, J.; Linsmeier, C.; Gonzalez-Julian, J.; Povstugar, I.; Morgan, T.; et al. Advanced plasma-facing materials for a first wall of DEMO, THERMEC; EU: Viena, Austria, 2021. [Google Scholar]
- Maisonnier, D.; Cook, I.; Pierre, S.; Lorenzo, B.; Luigi, D.P.; Luciano, G.; Prachai, N.; Aldo, P. DEMO and fusion power plant conceptual studies in Europe. Fusion Eng. Des. 2006, 81, 1123–1130. [Google Scholar] [CrossRef]
- Luo, C.; Xu, L.; Zong, L.; Shen, H.; Wei, S. Research status of tungsten-based plasma-facing materials: A review. Fusion Eng. Des. 2023, 190, 113487. [Google Scholar] [CrossRef]
- Riesch, J.; Feichtmayer, A.; Coenen, J.W.; Curzadd, B.; Gietl, H.; Höschen, T.; Manhard, A.; Schwarz-Selinger, T.; Neu, R. Irradiation effects in tungsten—From surface effects to bulk mechanical properties. Nucl. Mater. Energy 2022, 30, 101093. [Google Scholar] [CrossRef]
- Cottrell, G.; Pampin, R.; Taylor, N. Transmutation and Phase Stability of Tungsten Armor in Fusion Power Plants. Fusion Sci. Technol. 2006, 50, 89–98. [Google Scholar] [CrossRef]
- Lapi, S.; Mills, W.J.; Wilson, J.; McQuarrie, S.; Publicover, J.; Schueller, M.; Schyler, D.; Ressler, J.J.; Ruth, T.J. Production cross-sections of 181–186Re isotopes from proton bombardment of natural tungsten. Appl. Radiat. Isot. 2007, 65, 345–349. [Google Scholar] [CrossRef]
- Gilbert, M.R.; Sublet, J.C.; Dudarev, S.L. Spatial heterogeneity of tungsten transmutation in a fusion device. Nucl. Fusion 2017, 57, 044002. [Google Scholar] [CrossRef]
- Tanno, T.; Fukuda, M.; Nogami, S.; Hasegawa, A. Microstructure Development in Neutron Irradiated Tungsten Alloys. Mater. Trans. 2011, 52, 1447–1451. [Google Scholar] [CrossRef]
- Williams, R.K.; Wiffen, F.W.; Bentley, J.; Stiegler, J.O. Irradiation induced precipitation in tungsten based, W-Re alloys. Metall. Trans. A 1983, 14, 655–666. [Google Scholar] [CrossRef]
- Johnson, R.A.; Lam, N.Q. Solute segregation under irradiation. J. Nucl. Mater. 1978, 69–70, 424–433. [Google Scholar] [CrossRef]
- Hasegawa, A.; Fukuda, M.; Tanno, T.; Nogami, S. Neutron Irradiation Behavior of Tungsten. Mater. Trans. 2013, 54, 466–471. [Google Scholar] [CrossRef]
- Liu, Y.; Song, Y.; Zhang, P.; Wang, S.; Zhu, T.; Jin, S.; Lu, E.; Cao, X.; Wang, B. The influence of rhenium addition on the distribution of vacancy-type defects in tungsten. J. Nucl. Mater. 2021, 553, 153045. [Google Scholar] [CrossRef]
- Hu, X.; Koyanagi, T.; Fukuda, M.; Kumar, N.A.P.K.; Snead, L.L.; Wirth, B.D.; Katoh, Y. Irradiation hardening of pure tungsten exposed to neutron irradiation. J. Nucl. Mater. 2016, 480, 235–243. [Google Scholar] [CrossRef]
- Tanno, T.; Hasegawa, A.; He, J.C.; Fujiwara, M.; Nogami, S.; Satou, M.; Shishido, T.; Abe, K. Effects of Transmutation Elements on Neutron Irradiation Hardening of Tungsten. Mater. Trans. 2007, 48, 2399–2402. [Google Scholar] [CrossRef]
- Hasegawa, A.; Tanno, T.; Nogami, S.; Satou, M. Property change mechanism in tungsten under neutron irradiation in various reactors. J. Nucl. Mater. 2011, 417, 491–494. [Google Scholar] [CrossRef]
- Klimenkov, M.; Jäntsch, U.; Rieth, M.; Schneider, H.C.; Armstrong, D.E.J.; Gibson, J.; Roberts, S.G. Effect of neutron irradiation on the microstructure of tungsten. Nucl. Mater. Energy 2016, 9, 480–483. [Google Scholar] [CrossRef]
- Lloyd, M.J.; London, A.J.; Haley, J.C.; Gilbert, M.R.; Becquart, C.S.; Domain, C.; Martinez, E.; Moody, M.P.; Bagot, P.A.J.; Nguyen-Manh, D.; et al. Interaction of transmutation products with precipitates, dislocations and grain boundaries in neutron irradiated W. Materialia 2022, 22, 101370. [Google Scholar] [CrossRef]
- Suzudo, T.; Yamaguchi, M.; Hasegawa, A. Stability and mobility of rhenium and osmium in tungsten: First principles study. Model. Simul. Mater. Sci. Eng. 2014, 22, 075006. [Google Scholar] [CrossRef]
- Gharaee, L.; Marian, J.; Erhart, P. The role of interstitial binding in radiation induced segregation in W-Re alloys. J. Appl. Phys. 2016, 120, 025901. [Google Scholar] [CrossRef]
- Huang, C.H.; Gilbert, M.R.; Marian, J. Simulating irradiation hardening in tungsten under fast neutron irradiation including Re production by transmutation. J. Nucl. Mater. 2017, 499, 204–215. [Google Scholar] [CrossRef]
- Huang, C.-H.; Gharaee, L.; Zhao, Y.; Erhart, P. Mechanism of nucleation and incipient growth of Re clusters in irradiated W-Re alloys from kinetic Monte Carlo simulations. Phys. Rev. B 2017, 96, 094108. [Google Scholar] [CrossRef]
- Li, Z.-Z.; Li, Y.-H.; Terentyev, D.; Castin, N.; Bakaev, A.; Bonny, G.; Yang, Z.; Liang, L.; Zhou, H.-B.; Gao, F.; et al. Investigating the formation mechanism of void lattice in tungsten under neutron irradiation: From collision cascades to ordered nanovoids. Acta Mater. 2021, 219, 117239. [Google Scholar] [CrossRef]
- Hu, X. Recent progress in experimental investigation of neutron irradiation response of tungsten. J. Nucl. Mater. 2022, 568, 153856. [Google Scholar] [CrossRef]
- Becquart, C.S.; Domain, C.; Sarkar, U.; DeBacker, A.; Hou, M. Microstructural evolution of irradiated tungsten: Ab initio parameterisation of an OKMC model. J. Nucl. Mater. 2010, 403, 75–88. [Google Scholar] [CrossRef]
- Ventelon, L.; Willaime, F.; Fu, C.-C.; Heran, M.; Ginoux, I. Ab initio investigation of radiation defects in tungsten: Structure of self-interstitials and specificity of di-vacancies compared to other bcc transition metals. J. Nucl. Mater. 2012, 425, 16–21. [Google Scholar] [CrossRef]
- Li, Y.-H.; Zhou, H.-B.; Deng, H.; Lu, G.; Lu, G.-H. Towards understanding the mechanism of rhenium and osmium precipitation in tungsten and its implication for tungsten-based alloys. J. Nucl. Mater. 2018, 505, 30–43. [Google Scholar] [CrossRef]
- Huang, G.-Y.; Juslin, N.; Wirth, B.D. First-principles study of vacancy, interstitial, noble gas atom interstitial and vacancy clusters in bcc-W. Comput. Mater. Sci. 2016, 123, 121–130. [Google Scholar] [CrossRef]
- Gilbert, M.R.; Arakawa, K.; Bergstrom, Z.; Caturla, M.J.; Dudarev, S.L.; Gao, F.; Goryaeva, A.M.; Hu, S.Y.; Hu, X.; Kurtz, R.J.; et al. Perspectives on multiscale modelling and experiments to accelerate materials development for fusion. J. Nucl. Mater. 2021, 554, 153113. [Google Scholar] [CrossRef]
- Fock, V. Approximation method for the solution of the quantum mechanical multibody problems. Z. Fur Phys. 1930, 61, 126–148. [Google Scholar] [CrossRef]
- Jnsson, H.; Mills, G.; Jacobsen, K.W. Nudged elastic band method for finding minimum energy paths of transitions. In Classical and Quantum Dynamics in Condensed Phase Simulations; World Scientific: Singapore, 1998. [Google Scholar]
- Watanabe, Y.; Morishita, K.; Nakasuji, T.; Ando, M.; Tanigawa, H. Helium effects on microstructural change in RAFM steel under irradiation: Reaction rate theory modeling. Nucl. Instrum. Methods Phys. Res. Sect. B Beam Interact. Mater. At. 2015, 352, 115–120. [Google Scholar] [CrossRef]
- Carlberg, M.H.; Münger, E.P.; Hultman, L. Dynamics of self-interstitial structures in body-centred-cubic W studied by molecular dynamics simulation. J. Phys. Condens. Matter 2000, 12, 79. [Google Scholar] [CrossRef]
- Frank, F.C.; Turnbull, D. Mechanism of Diffusion of Copper in Germanium. Phys. Rev. 1956, 104, 617–618. [Google Scholar] [CrossRef]
- Krasnochtchekov, P.; Averback, R.S.; Bellon, P. Precipitate stability and morphology in irradiation environments. JOM 2007, 59, 46–50. [Google Scholar] [CrossRef]
- Watanabe, H.; Aoki, A.; Murakami, H.; Muroga, T.; Yoshida, N. Effects of phosphorus on defect behavior, solute segregation and void swelling in electron irradiated FeCrNi alloys. J. Nucl. Mater. 1988, 155, 815–822. [Google Scholar] [CrossRef]
- Xu, Q.; Yoshiie, T.; Sato, K. Dose dependence of Cu precipitate formation in Fe-Cu model alloys irradiated with fission neutrons. Phys. Rev. B 2006, 73, 134115. [Google Scholar] [CrossRef]
- Gilbert, M.R.; Marian, J.; Sublet, J.C. Energy spectra of primary knock-on atoms under neutron irradiation. J. Nucl. Mater. 2015, 467, 121–134. [Google Scholar] [CrossRef]
- Gilbert, M.R.; Sublet, J.C. PKA distributions: Contributions from transmutation products and from radioactive decay. Nucl. Mater. Energy 2016, 9, 576–580. [Google Scholar] [CrossRef]
- Watanabe, Y.; Iwakiri, H.; Yoshida, N.; Morishita, K.; Kohyama, A. Formation of interstitial loops in tungsten under helium ion irradiation: Rate theory modeling and experiment. Nucl. Instrum. Methods Phys. Res. Sect. B Beam Interact. Mater. At. 2007, 255, 32–36. [Google Scholar] [CrossRef]
- Gear, C.W. Numerical Initial Value Problems in Ordinary Differential Equations. Prentice-Hall Ser. Autom. Comput. 1971, 1, 1–304. [Google Scholar]
- Dubinko, A.; Terentyev, D.; Yin, C.; Renterghem, W.V.; Bonny, G. Microstructure and hardening induced by neutron irradiation in single crystal, ITER specification and cold rolled tungsten. Int. J. Refract. Met. Hard Mater. 2021, 98, 105522. [Google Scholar] [CrossRef]
- Papadakis, D.; Dellis, S.; Mergia, K.; Chatzikos, V.; Pintsuk, G. The competing effects of temperature and neutron irradiation on the microstructure and mechanical properties of ITER grade tungsten. Fusion Eng. Des. 2021, 168, 112608. [Google Scholar] [CrossRef]
- Wang, Z.; Gao, L.; Zhu, X.-L.; Yuan, Y.; Wang, S.; Cheng, L.; Lu, G.-H. Effect of rhenium on defects evolution behavior in tungsten under irradiation. Nucl. Fusion 2021, 61, 036037. [Google Scholar] [CrossRef]
- Duerrschnabel, M.; Klimenkov, M.; Jäntsch, U.; Rieth, M.; Schneider, H.-C.; Terentyev, D. New insights into microstructure of neutron-irradiated tungsten. Sci. Rep. 2021, 11, 7572. [Google Scholar] [CrossRef]
- Stanisz, P.; Oettingen, M.; Cetnar, J. Development of a Trajectory Period Folding Method for Burnup Calculations. Energies 2022, 15, 2245. [Google Scholar] [CrossRef]
- Cetnar, J.; Stanisz, P.; Oettingen, M. Linear Chain Method for Numerical Modelling of Burnup Systems. Energies 2021, 14, 1520. [Google Scholar] [CrossRef]
- Sublet, J.C.; Eastwood, J.W.; Morgan, J.G.; Gilbert, M.R.; Fleming, M.; Arter, W. FISPACT-II: An Advanced Simulation System for Activation, Transmutation and Material Modelling. Nucl. Data Sheets 2017, 139, 77–137. [Google Scholar] [CrossRef]
- Edmondson, P.D.; Gault, B.; Gilbert, M.R. An atom probe tomography and inventory calculation examination of second phase precipitates in neutron irradiated single crystal tungsten. Nucl. Fusion 2020, 60, 126013. [Google Scholar] [CrossRef]
- Papadakis, D.; Dellis, S.; Chatzikos, V.; Manios, E.; Stamatelatos, I.E.; Messoloras, S.; Mergia, K. Neutron irradiation effects in different tungsten microstructures. Phys. Scr. 2021, 96, 124041. [Google Scholar] [CrossRef]
- Terentyev, D.; Yin, C.; Dubinko, A.; Chang, C.C.; You, J.H. Neutron irradiation hardening across ITER diverter tungsten armor. Int. J. Refract. Met. Hard Mater. 2021, 95, 105437. [Google Scholar] [CrossRef]
- Terentyev, D.; Chang, C.-C.; Yin, C.; Zinovev, A.; He, X.-F. Neutron irradiation effects on mechanical properties of ITER specification tungsten. Tungsten 2021, 3, 415–433. [Google Scholar] [CrossRef]
- Akiyoshi, M.; Garrison, L.M.; Geringer, J.W.; Wang, H.; Hasegawa, A.; Nogami, S.; Katoh, Y. Thermal diffusivity of irradiated tungsten and tungsten-rhenium alloys. J. Nucl. Mater. 2021, 543, 152594. [Google Scholar] [CrossRef]


| Symbol | Definition |
|---|---|
| I | Self-interstitial atoms |
| L2 | Interstitial clusters |
| Ln | Interstitial loops |
| V | Vacancies |
| Void2 | Vacancy clusters |
| Voidn | Micro-voids |
| S | Sinks |
| ReV | Re substitutes |
| Rei | Re interstitials |
| Re2 | Re clusters |
| Rei(n) | Precipitates |
| Parameters | Symbol | Value |
|---|---|---|
| Temperature | T | 600–1200 °C |
| Dose rate | P | 10−8~10−6 dpa/s |
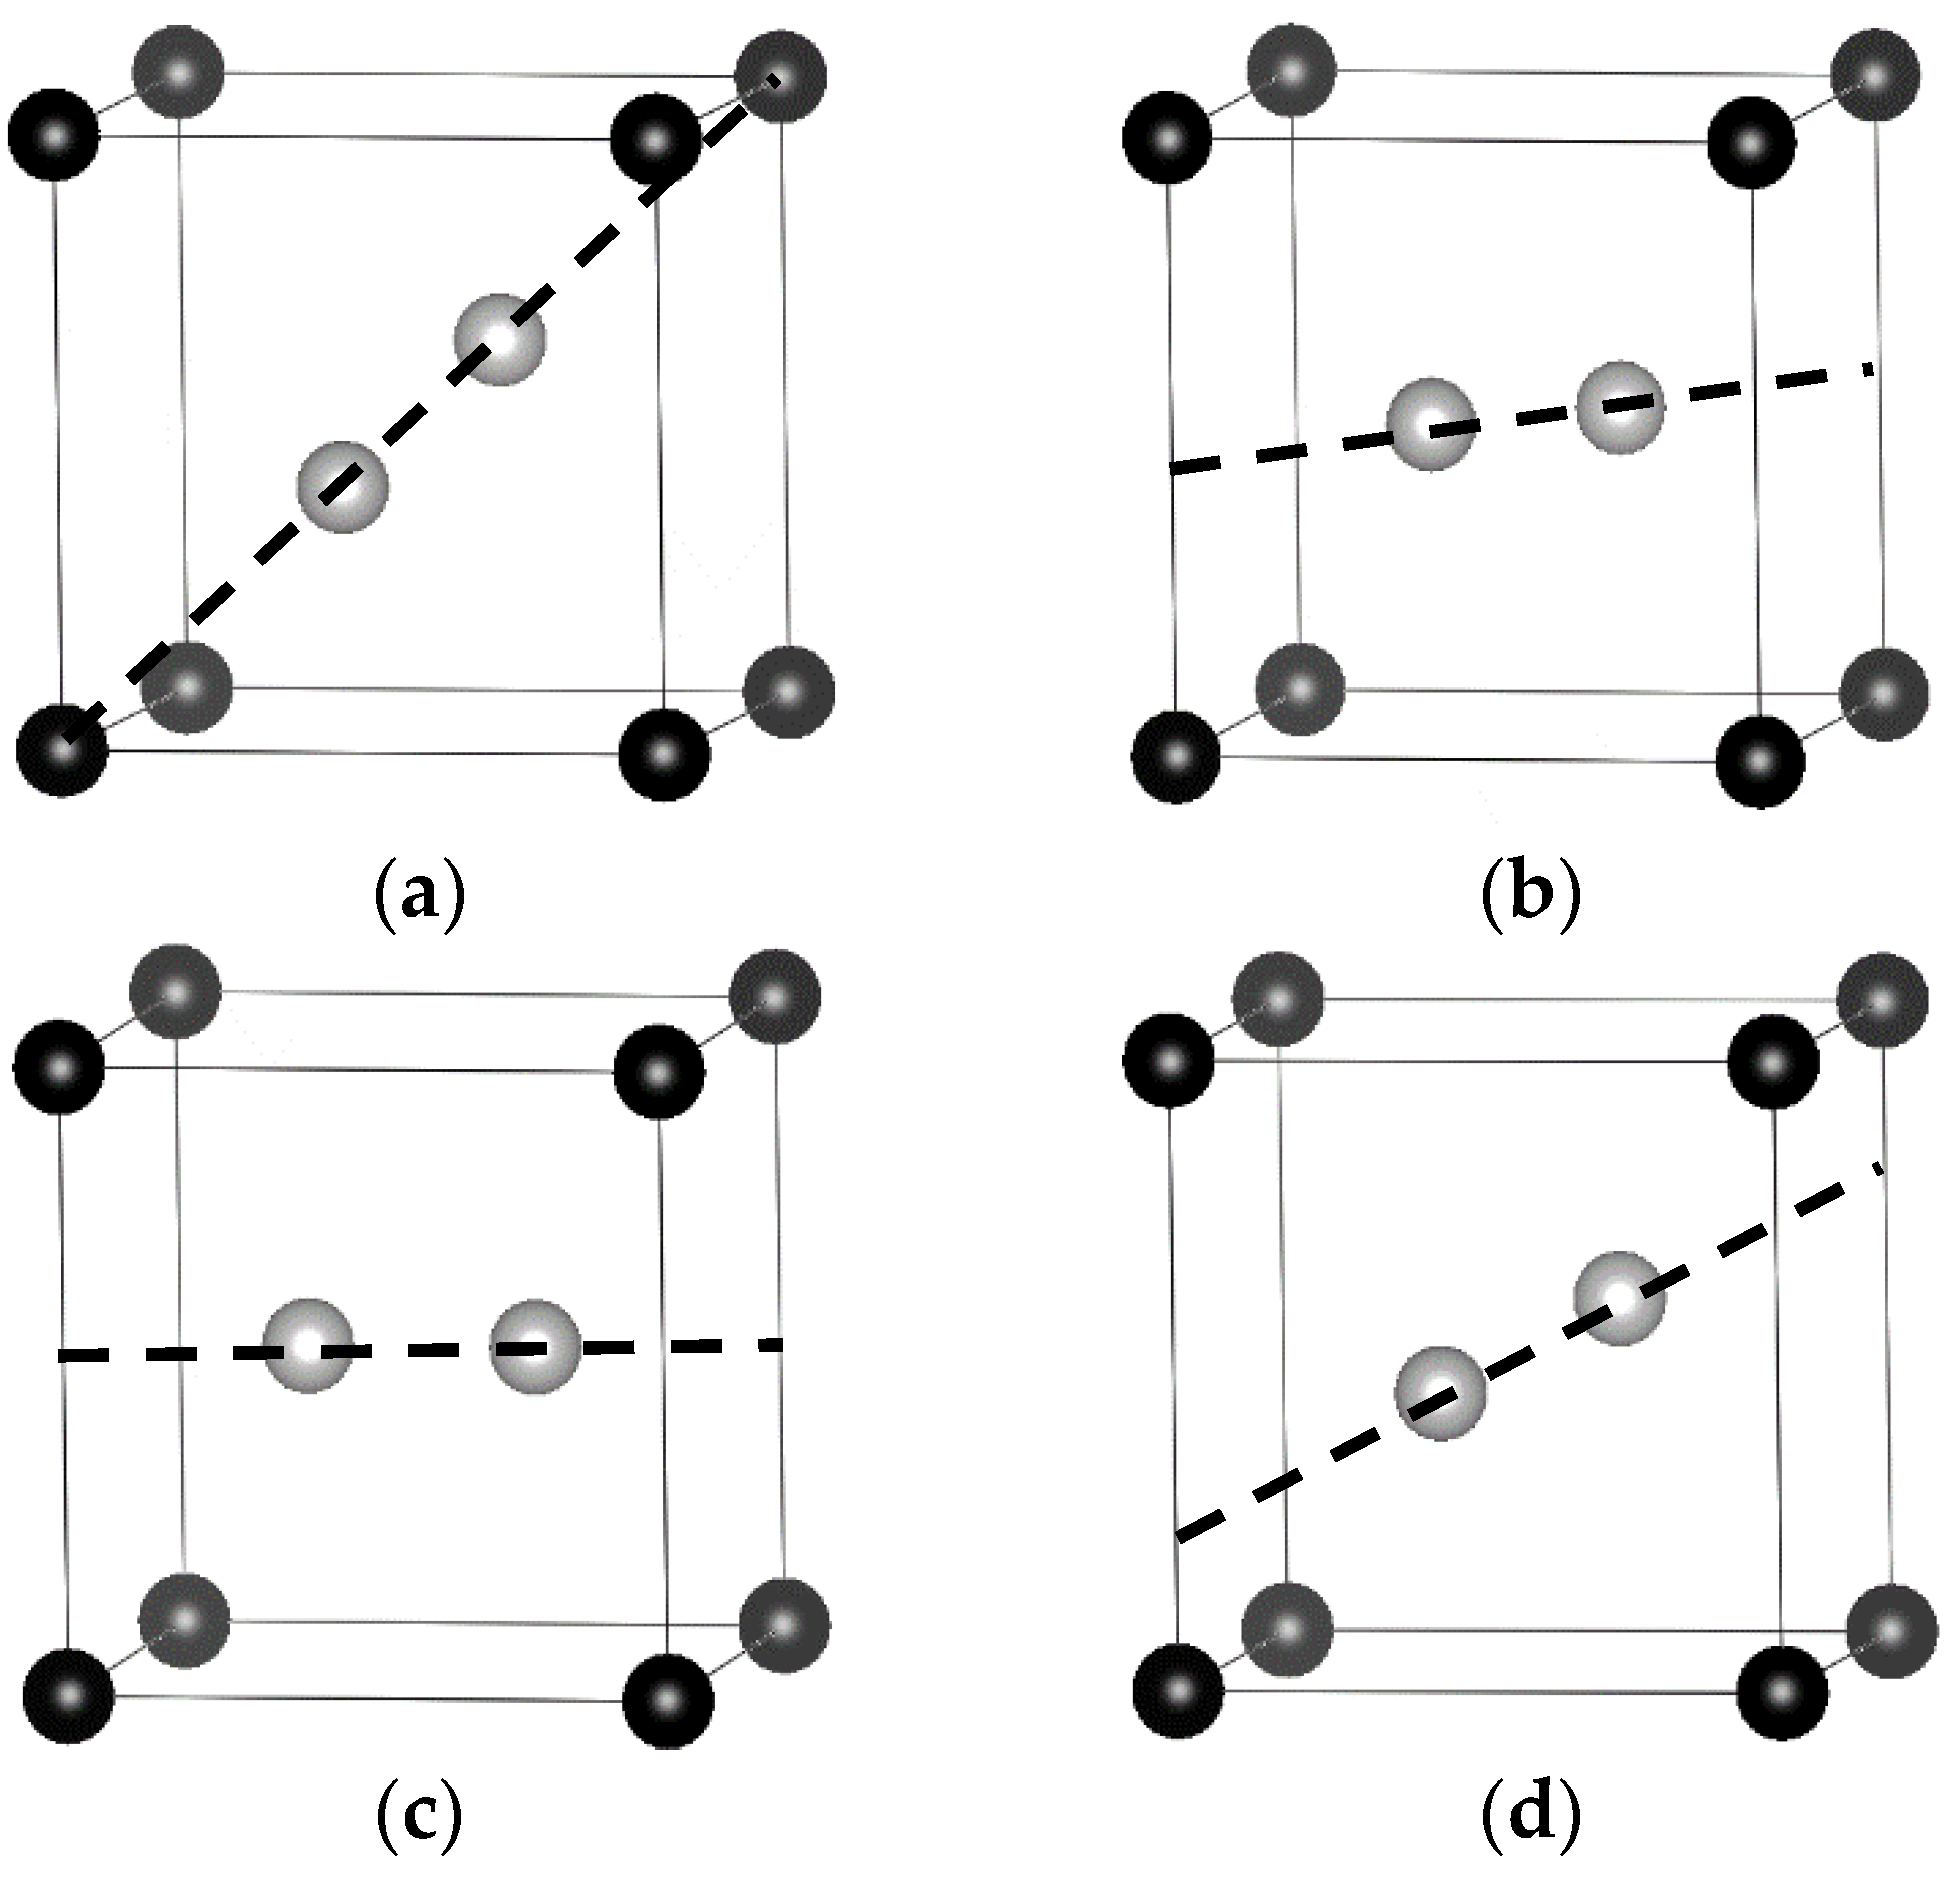
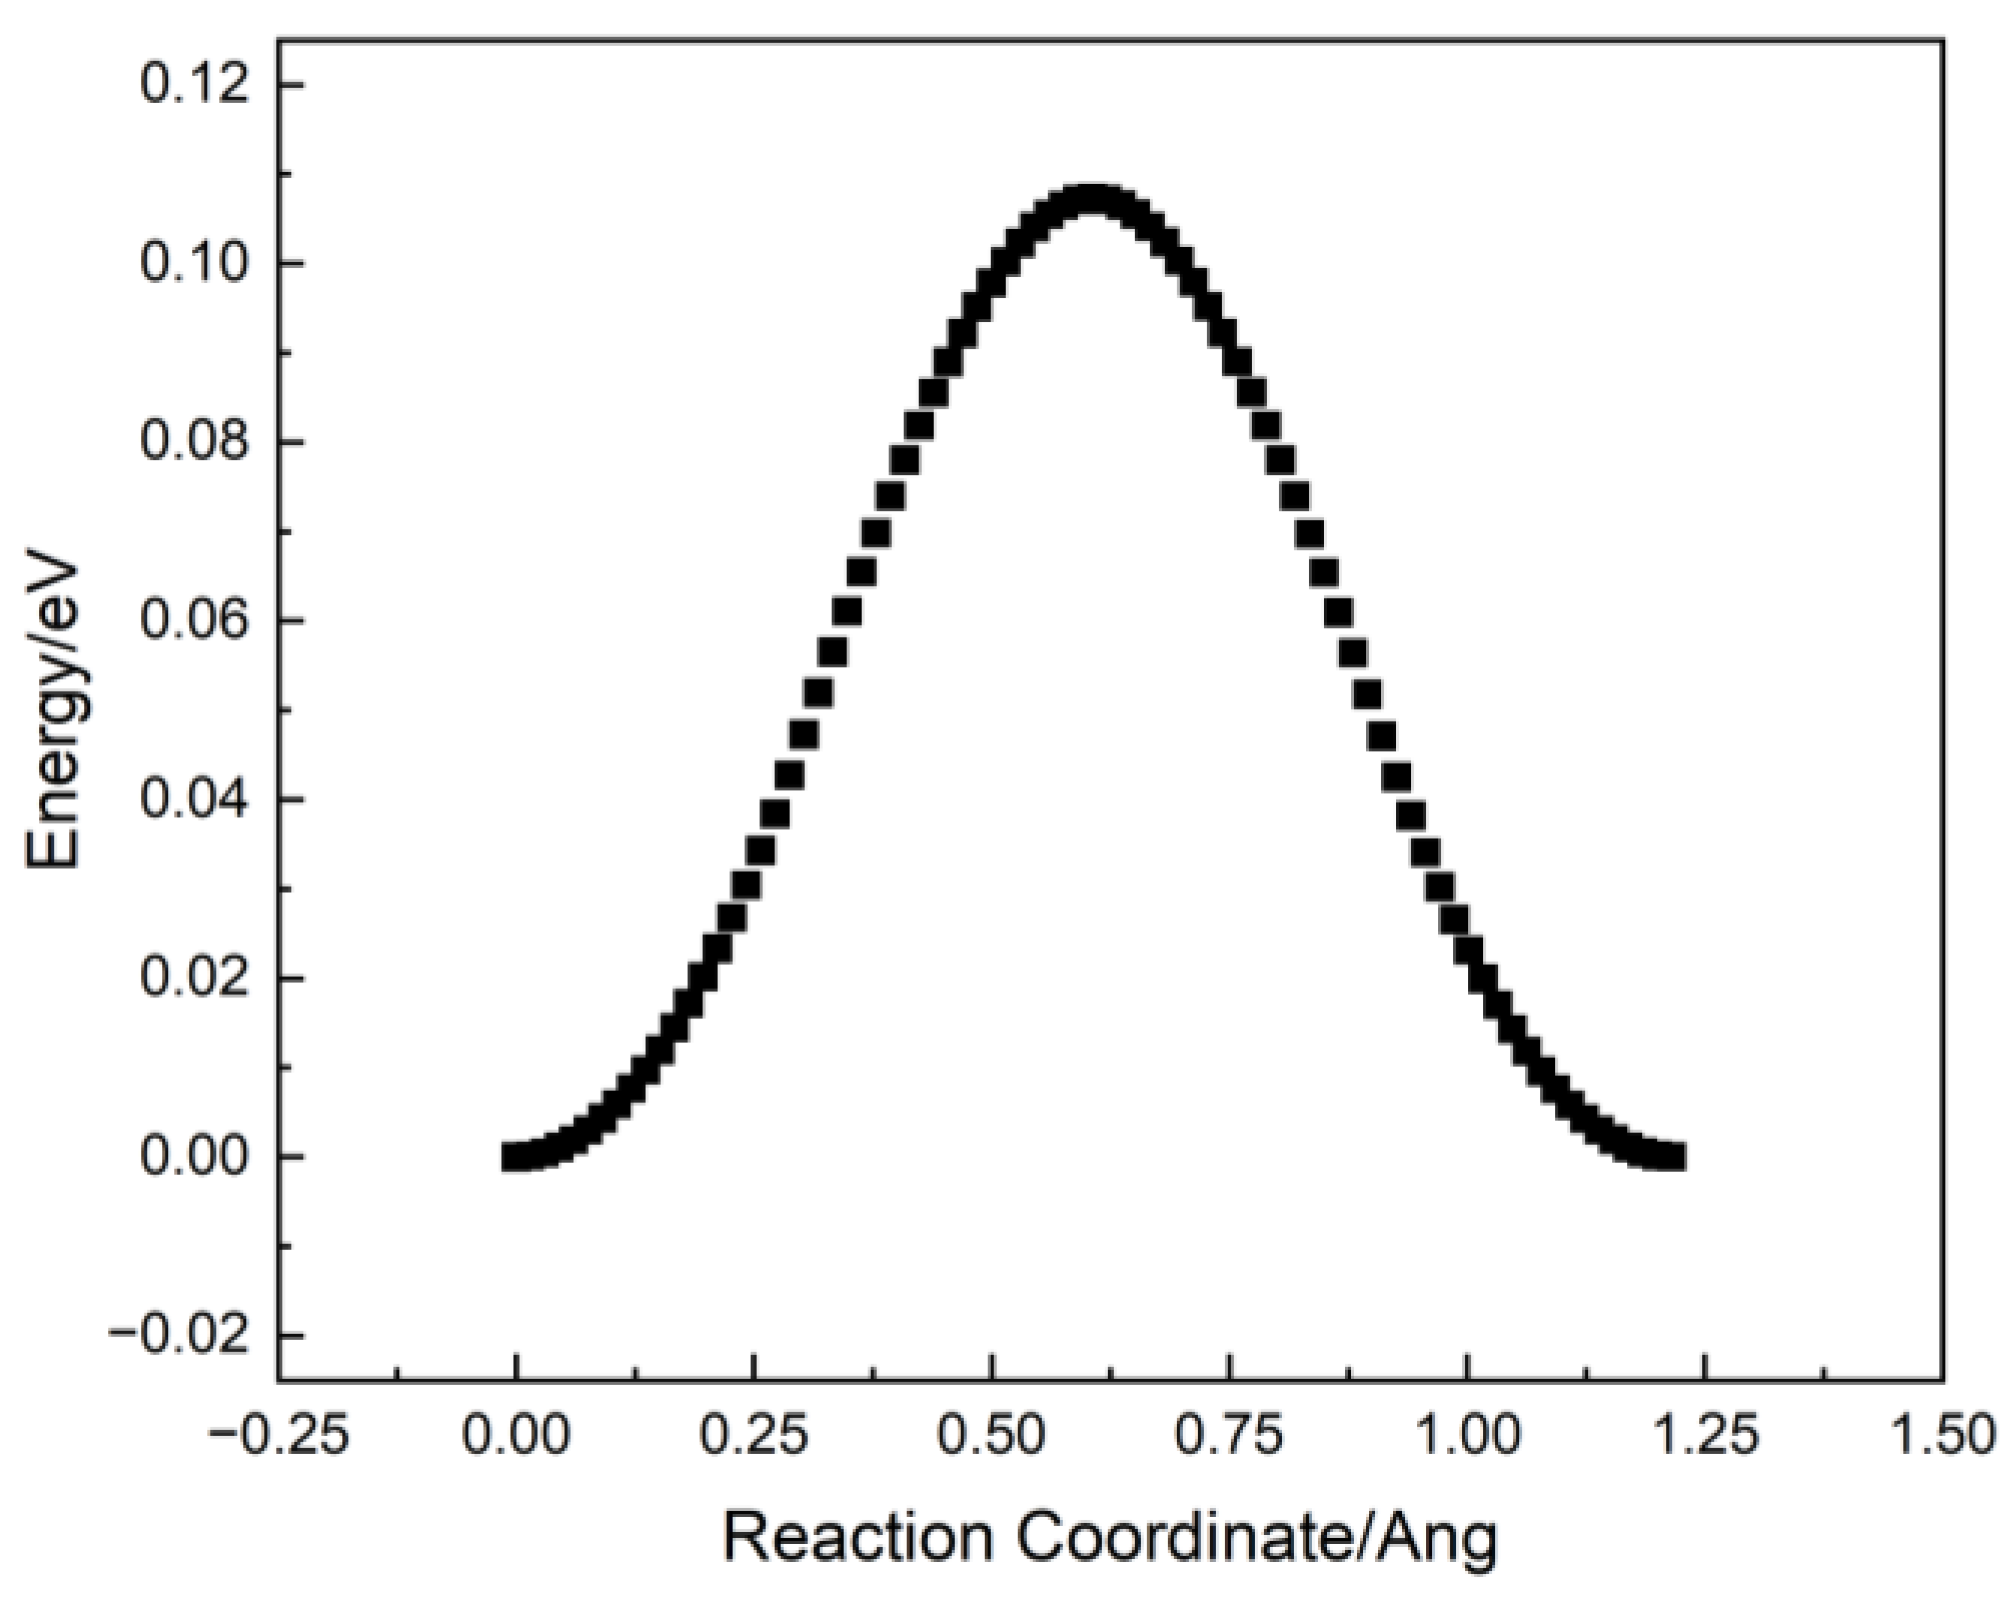
| SIA migration energy | 0.11 eV [this work] | |
| SIA rotation energy | 0.38 eV [this work] | |
| Vacancy migration energy | 1.66 eV [24] | |
| Alloy content in W-Re systems | x | 1~10 at.% |
| W-Re mixed interstitial atomsmigration energy | 0.24 eV [this work] | |
| W-Re mixed interstitial atomsrotation energy | 0.13 eV [this work] | |
| Density of sinks | Cs | 10−10 [36] |
| Atomic vibration frequency | υ | 1013 [39] |
| Lattice constant | a | 3.176 × 10⁻¹⁰ m |
Disclaimer/Publisher’s Note: The statements, opinions and data contained in all publications are solely those of the individual author(s) and contributor(s) and not of MDPI and/or the editor(s). MDPI and/or the editor(s) disclaim responsibility for any injury to people or property resulting from any ideas, methods, instructions or products referred to in the content. |
© 2023 by the authors. Licensee MDPI, Basel, Switzerland. This article is an open access article distributed under the terms and conditions of the Creative Commons Attribution (CC BY) license (https://creativecommons.org/licenses/by/4.0/).
Share and Cite
Xin, T.; Yang, Y.; Wang, Y.; Wu, L.; Pan, R.; Xu, Q.; Wu, X. Evolution of Irradiation Defects in W and W-Re Systems: A Density Functional Theory and Rate Theory Study. Metals 2023, 13, 1990. https://doi.org/10.3390/met13121990
Xin T, Yang Y, Wang Y, Wu L, Pan R, Xu Q, Wu X. Evolution of Irradiation Defects in W and W-Re Systems: A Density Functional Theory and Rate Theory Study. Metals. 2023; 13(12):1990. https://doi.org/10.3390/met13121990
Chicago/Turabian StyleXin, Tianyuan, Yiying Yang, Yuexia Wang, Lu Wu, Rongjian Pan, Qiu Xu, and Xiaoyong Wu. 2023. "Evolution of Irradiation Defects in W and W-Re Systems: A Density Functional Theory and Rate Theory Study" Metals 13, no. 12: 1990. https://doi.org/10.3390/met13121990