Article

Effect of Grain Size on Dynamic Compression Behavior and Deformation Mechanism of ZK60 Magnesium Alloy

1
School of Materials Science and Engineering, Shenyang University of Technology, Shenyang 110870, China
2
Key Laboratory of Mg Alloys and the Processing Technology of Liaoning Province, Shenyang 110870, China
*
Authors to whom correspondence should be addressed.
Metals 2023, 13(2), 314; https://doi.org/10.3390/met13020314
Submission received: 6 January 2023 / Revised: 29 January 2023 / Accepted: 1 February 2023 / Published: 3 February 2023

Abstract

:
The dynamic compression deformation of 3 µm, 15 µm and 25 µm grain size ZK60 alloys under high-strain-rate compression is systematically studied. Dynamic compression experiments at a strain rate of 1700 s−1 were conducted using a split Hopkinson pressure bar, and the microstructure of the specimen was characterized via electron backscatter diffraction and transmission electron microscopy, as well as via the calculation of Schmid factors. The results showed that the alloy exhibited the decrease in yield strength and peak stress as the grain size increased under dynamic compression. The grain refinement in the alloy was conducive to the activation of basic slip. In turn, an increase in the grain size caused the transition in the main deformation mechanism from pyramidal <a> slip to {10−12} tensile twinning and pyramidal <a> slip. Based on these deformation mechanisms, the Johnson-Cook constitutive equation with different grain sizes was modified, and the fitting results were in accordance with the experimental data.

1. Introduction

With the introduction of the concept of lightweight, the research on the properties of lightweight magnesium (Mg) alloys for green engineering materials in the 21st century has become of great importance from academia to industrial production [1,2,3,4]. In order to expand the application range of Mg alloys in the field of engineering, various attempts have been made to improve the mechanical properties of alloys in term of strength and plasticity. The influencing factors mainly include grain size [5], deformation temperature [6], external force characteristics [7], initial orientation [8] and so on [9,10,11,12,13]. Among them, grain size is the inherent characteristic of the material, which makes it different from other external impact factors, thus attracting widespread attention of researchers [14,15].
In recent years, more and more works have been dedicated to exploring the effects of grain size on the mechanical properties of Mg alloys. For instance, Kula et al. [16] studied the deformation behavior of Mg-Sc alloys with varying grain size under uniaxial compression. According to the results, the yield stress depends on the grain size and obeys Hall-Petch relationship. Meanwhile, the activation of basal and non-basal slip is more feasible in large grains. Liu et al. [17] investigated the compression deformation behavior of Mg-4Zn-1Y alloys, revealing that the main deformation mechanism of specimens with 5 μm and 1.5 μm grains were pyramidal <c+a> and pyramidal <a> slip modes. Zhu et al. [18] found that the yield strength of Mg-3Al-3Sn alloy could be improved after grain refinement, whereas the pyramidal <a> and pyramidal <c+a> slip modes were easier initiated in alloys with coarser grains. Luo et al. [19] established that as the grain size of Mg-3Gd alloys decreased, the yield strength changed from continuous flow to discontinuous flow, while the main deformation mechanism was transformed from <a> slip and twinning to <a> and <c+a> slips. As of now, most of research on deformed Mg alloys with different grain sizes focus on tensile or static compression [20,21,22,23]. However, less attention has been paid to the effect of grain size on the evolution microstructure, mechanical properties and deformation mechanism at high speed impact. Compared with tensile or static compression, Mg alloys are likely to exhibit different deformation mechanisms and microstructure characteristic under dynamic compression. The understanding of these scientific issues is essential to expand the practical application range of Mg alloys.
The high-strain-rate compression has the characteristics of short time and large deformation, resulting in very complex deformation behavior. In order to monitor the dynamic response of the material under high-strain-rate compression, an effective constitutive model is required to lay the foundation for subsequent numerical simulations. Among many approaches, Johnson-Cook (J-C) constitutive model is the most commonly used in the high-strain-rate compression [24,25].
In view of the above, the ZK60 alloys with different grain sizes were chosen in this work for experiments. To elucidate the effects of grain size on the mechanical properties and deformation mechanism of ZK60 alloys, their microstructures were characterized via electron backscattering diffraction (EBSD) and transmission electron microscopy (TEM). The constitutive relationship of ZK60 alloys was established through optimization of the J-C constitutive model.

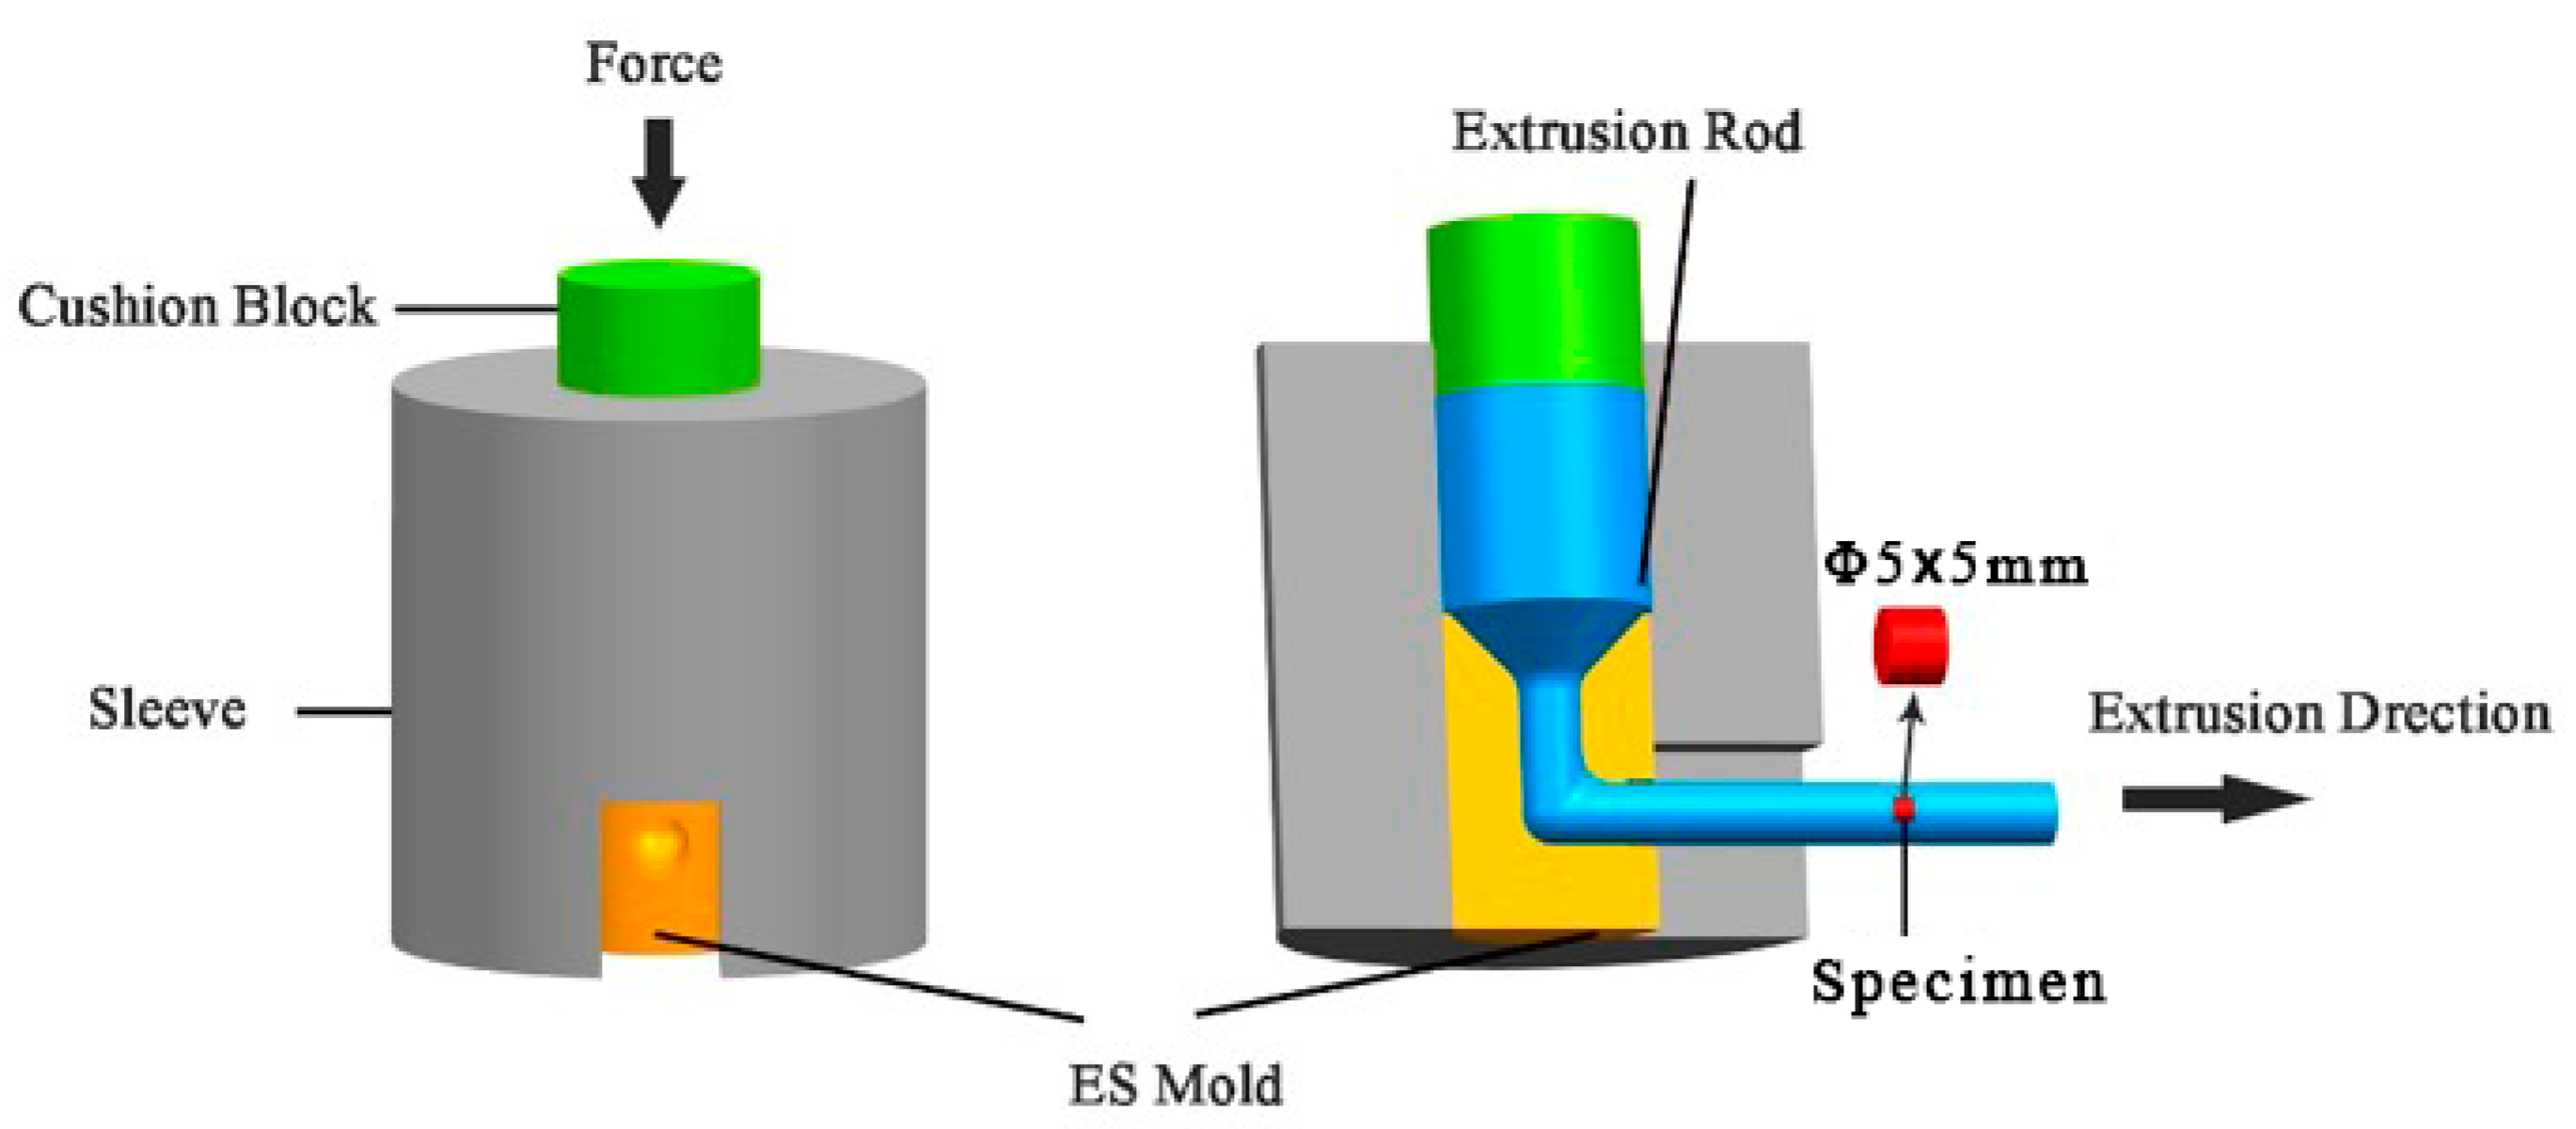
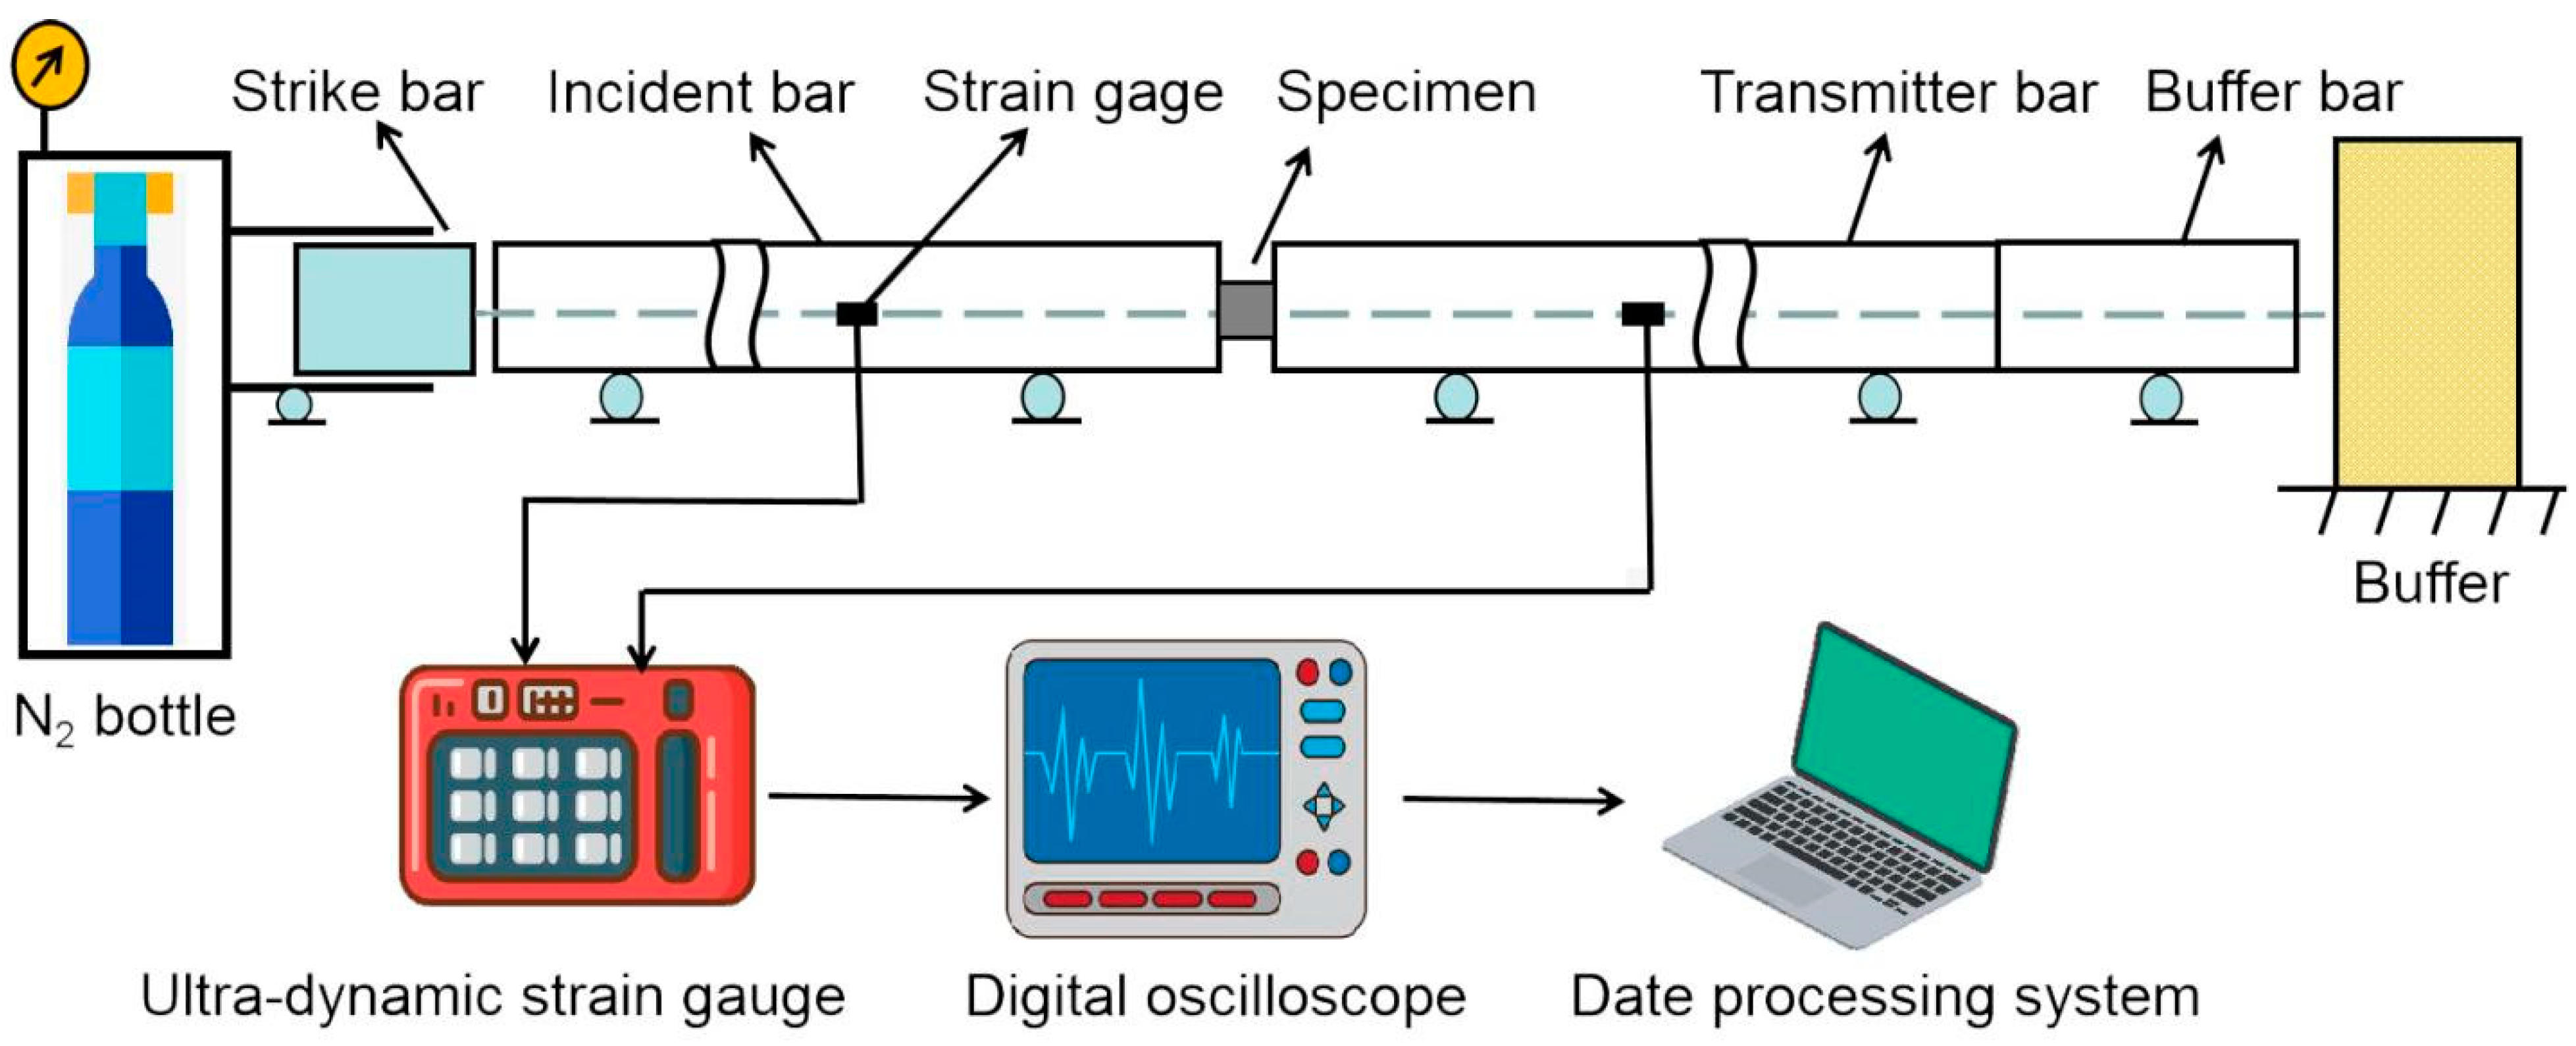
2. Experimental Material and Method

The commercial extruded ZK60 (Mg-6Zn-0.6Zr) alloy was used in the experiments. Before the ES (extrusion shearing) process, the homogenized ZK60 cylindrical billets (φ70 × 70 mm) and ES mold were preheated at 450 °C for 2 h. The ZK60 cylindrical billets after extrusion shearing turned into bars with the diameter of 20 mm (the extrusion ratio was 12.5). The ES mold and the sampling position of the ZK60 test specimen are shown in Figure 1.
The microstructure of ZK60 alloy after hot extrusion is shown in Figure 2a. The grains of the ZK60 alloy after ES were small and uniform, and no twins were observed. The ZK60 alloy after ES was exposed to heat treatment at 400 °C for 12 h and 430 °C for 12 h, and then cooled at room temperature to obtain two ZK60 alloy microstructures with different grain sizes (see Figure 2b,c).
The high-strain-rate compression tests were performed using a split Hopkinson pressure bar (SHPB), as shown in Figure 3. Once the compression strain rate enriched a value of about 1700 s−1, the specimen was broken. A more detailed description of the test procedures can be found in Ref. [26]. In order to ensure accuracy of the results, the compression testing at a curtain strain was repeated three times.
After compression, the specimens were cut along the loading direction, and their longitudinal cross-sections were observed via optical microscopy (MR-2000). The etching solution was composed of 4.2 g of picric acid, 10 mL of acetic acid, 10 mL of H2O, and 70 mL of ethanol. As shown in Figure 2a, a sheet with a 200 µm thickness and a 3 mm diameter was cut from the core of the overlapping region via electrical discharge wire-cutting for subsequent EBSD measurements and TEM analysis. The EBSD specimens were then prepared via ion milling using a Gatan691 bombardment thinning instrument for 50 min at an incident angle of 4° and a voltage of 5 KV. The EBSD measurements were conducted by means of a SEM-300 microscope equipped with an EBSD detector system (Oxford HKL Channel 5) at 20 kV. The step size of the EBSD mapping was set to 0.2 μm. The TEM samples were also prepared via ion milling at an incident angle of 6° and a voltage of 3.5 kV. Milling was performed until a pinhole appeared at the center of the specimen.

3. Results and Discussion

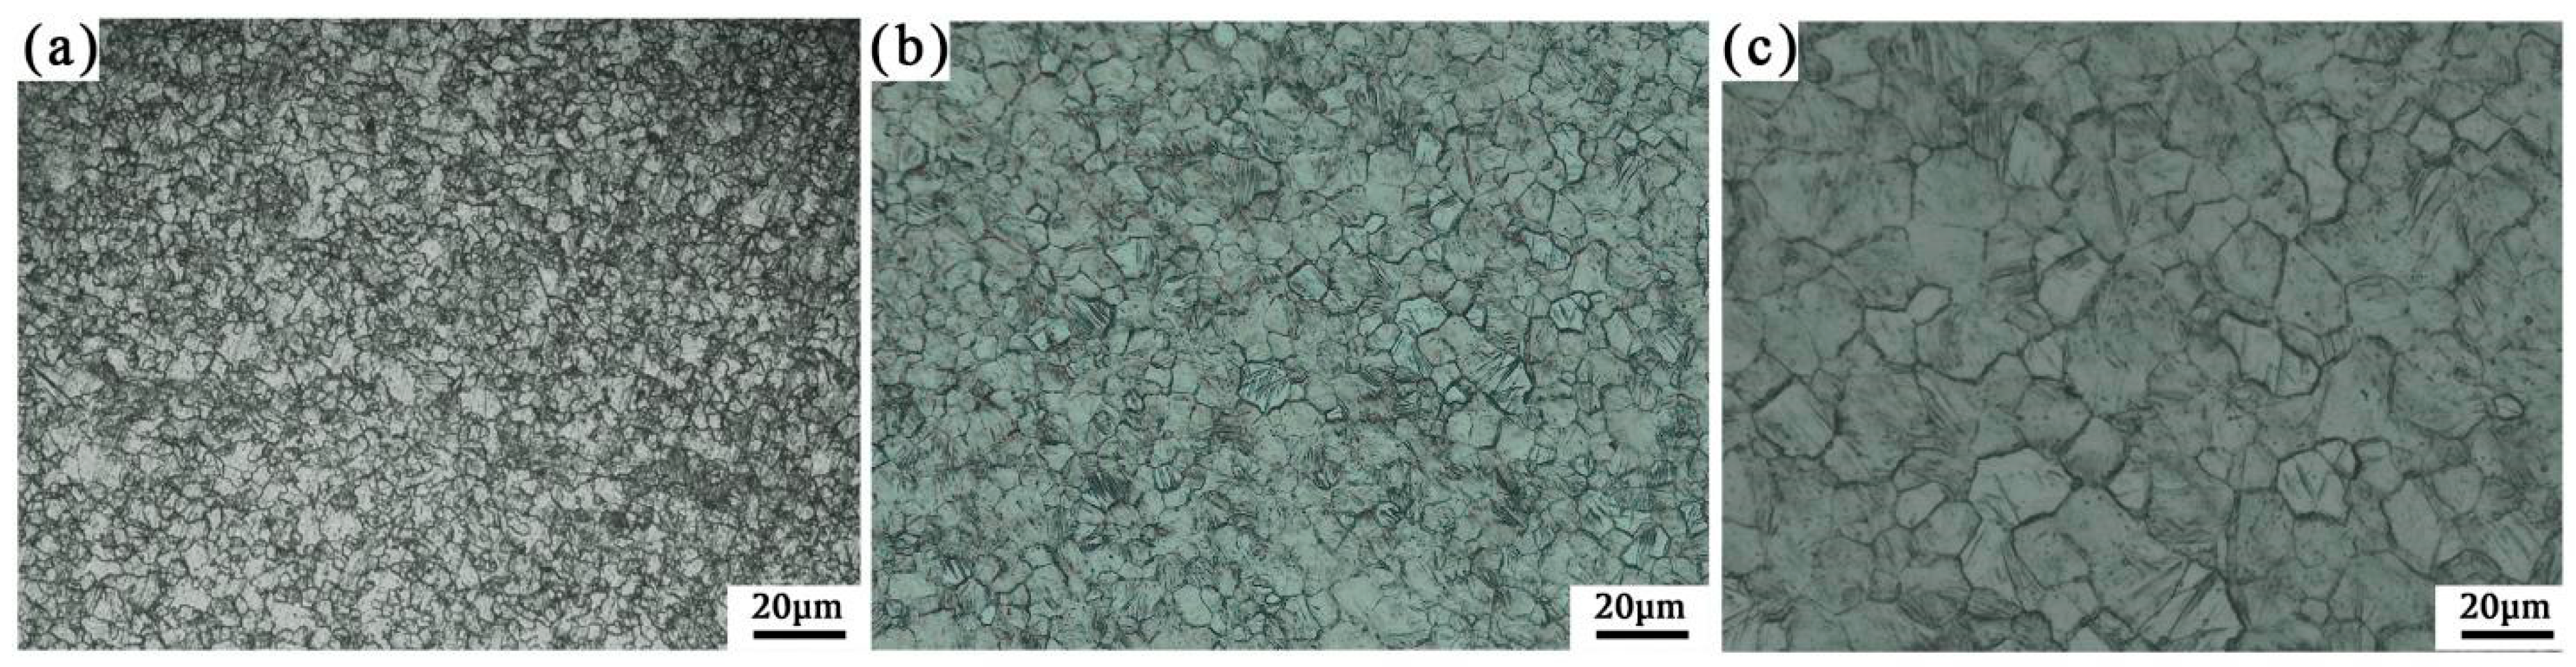
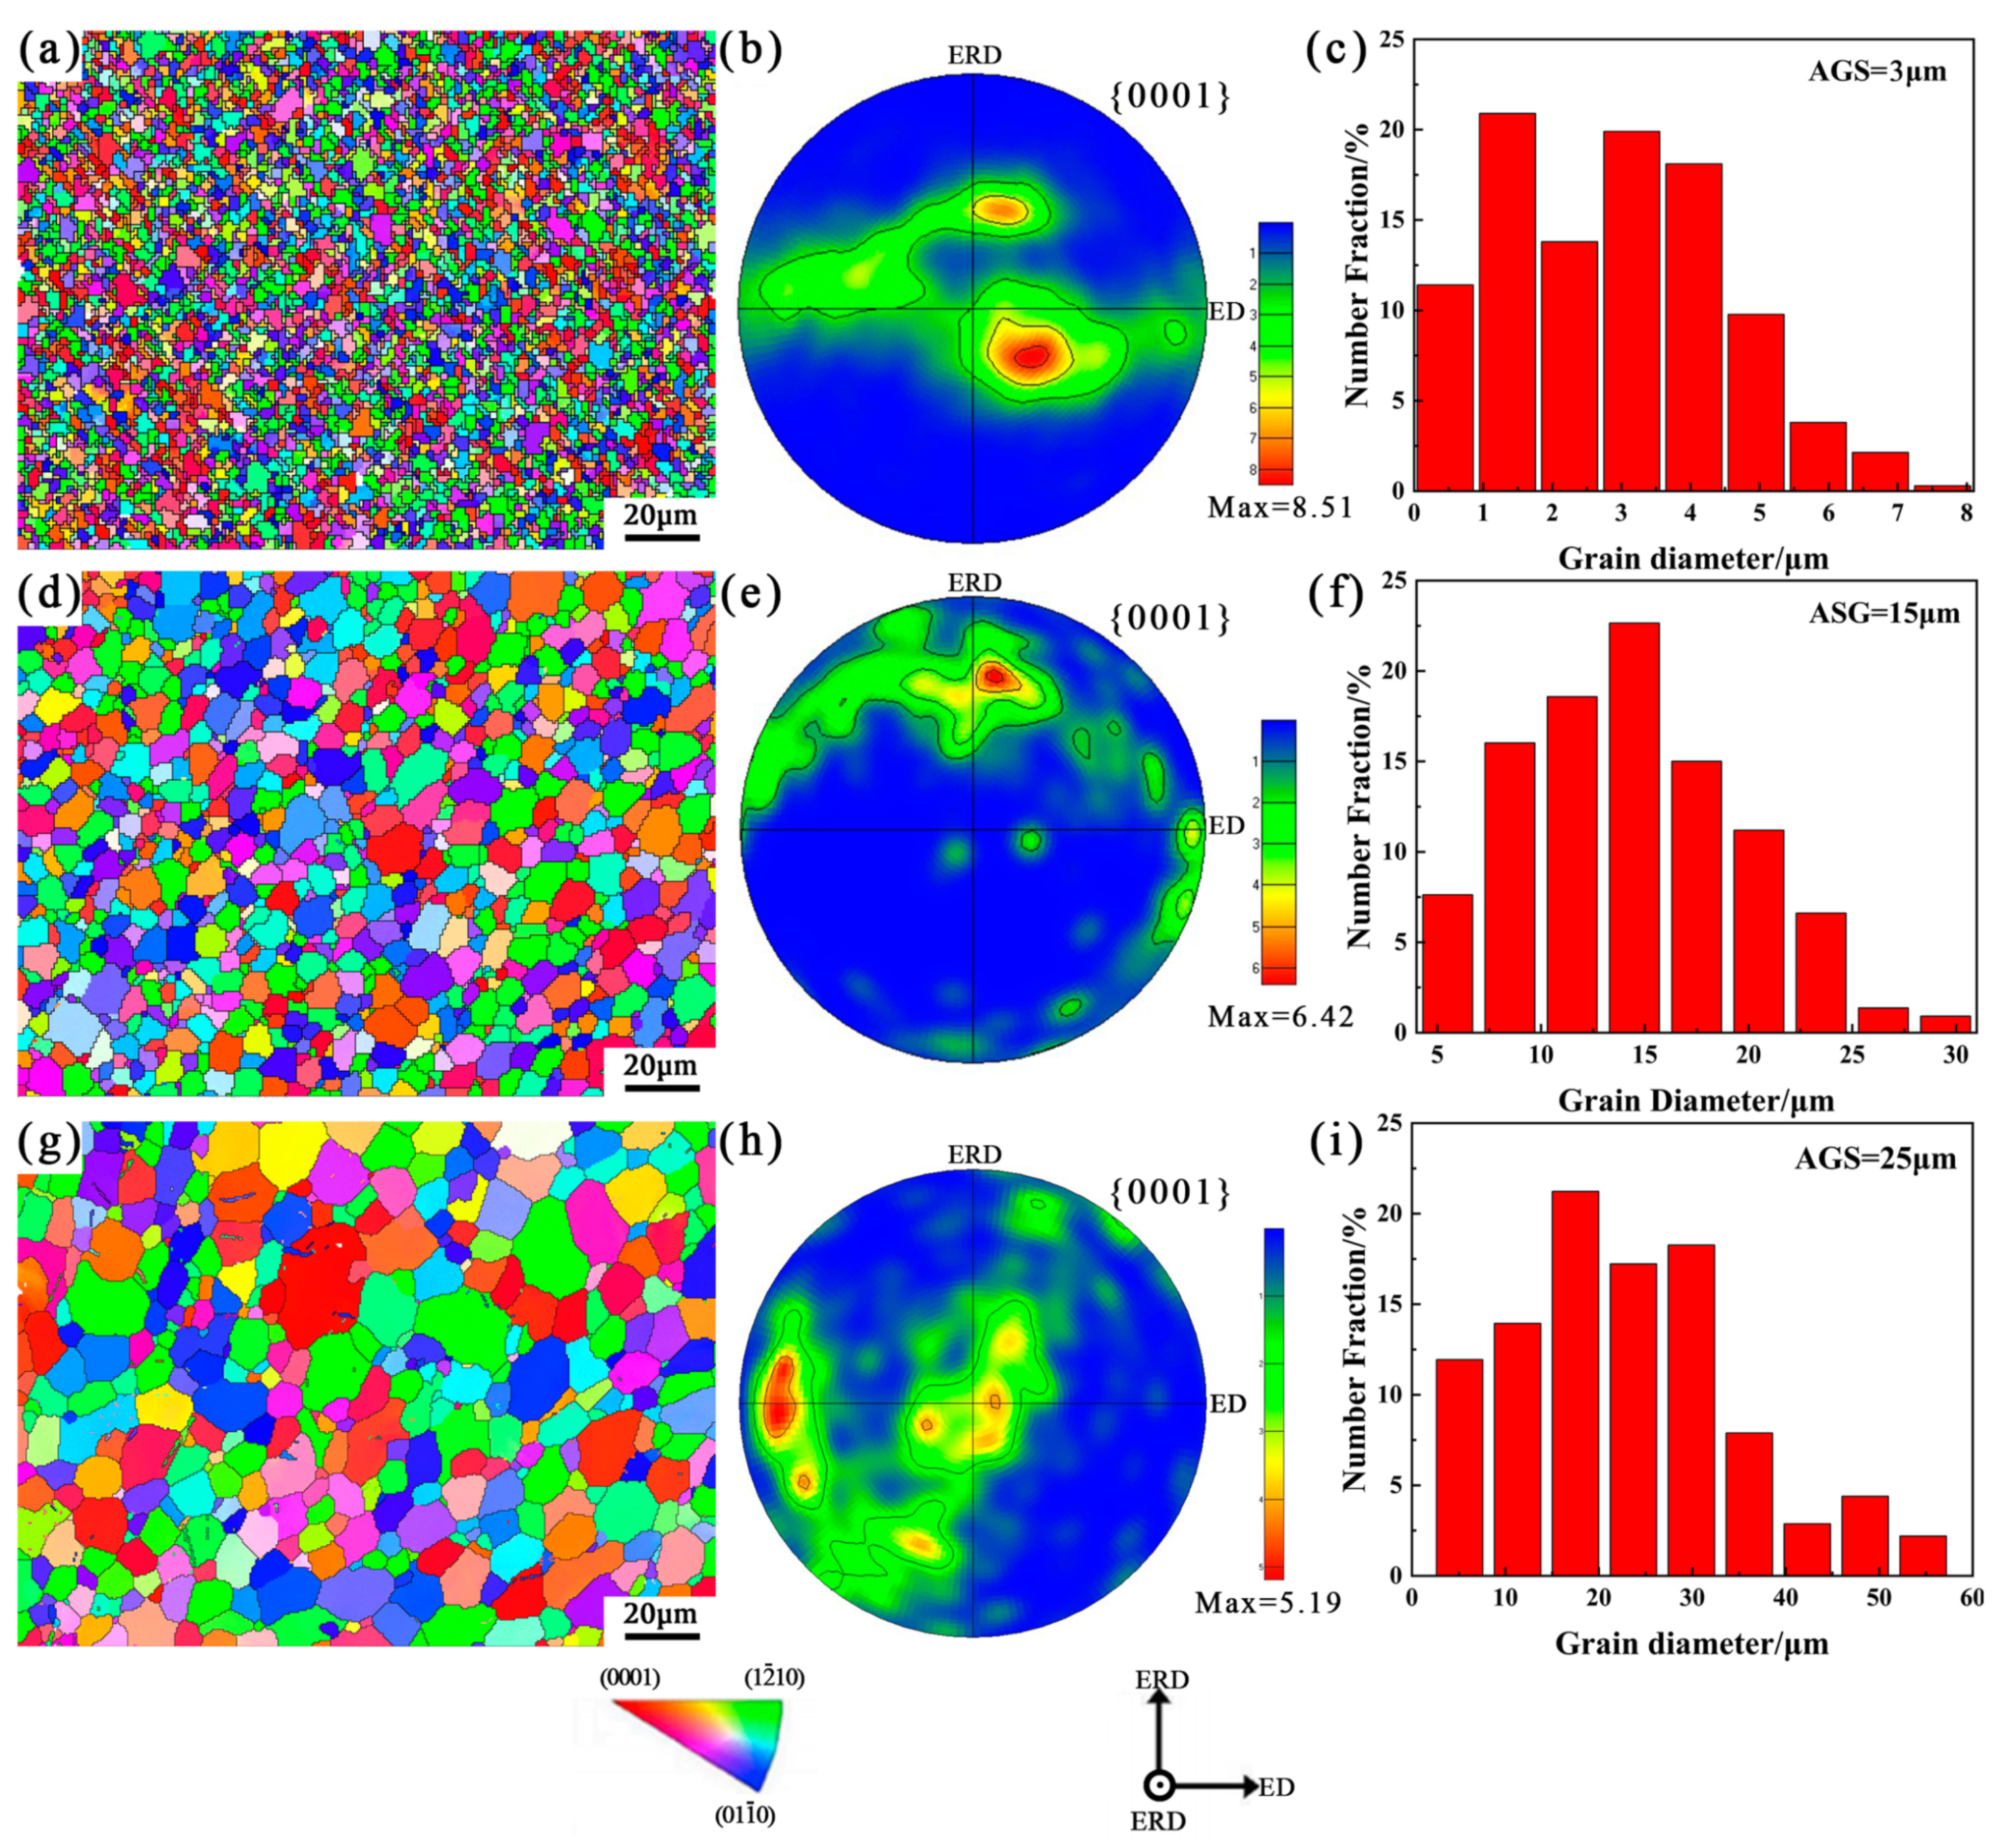
3.1. Initial Microstructure of ZK60 Alloys with Different Grain Sizes

Figure 4a–i depict the orientation maps, the pole figures and the grain size distribution histograms of ZK60 alloys with different grain sizes at the initial state. According to the histograms obtained via EBSD, the average grain sizes (AGS) of three ZK60 alloys were determined to be 3 μm, 15 μm and 25 μm, respectively. In the orientation maps (Figure 4a,d,g), different colors represent various grain orientations that become more dispersed as the grain size increases. This is also confirmed by the pole figure (Figure 4b,e,h) in which the texture strength is gradually weakened with increasing grain size. This is due to preferred orientation of the 3 μm grains as a result of extrusion shearing, which increases the texture strength (the Max value is 8.51). The 15 μm and 25 μm specimens are through heat treatment to unloading the stress caused by extrusion shearing, and high temperature conditions promoted the deflection and growth of grains in the corresponding alloys, so as to decrease the strength of the (0001) basal texture (the Max values for these systems are 6.42 and 5.19, respectively) [27].

3.2. Mechanical Response of ZK60 Alloys with Different Grain Sizes

The specimens with different grain sizes were compressed at a strain rate of 1700 s−1, the 3 µm specimen was compressed, while the 15 µm specimen and 25 µm specimen were fractured, and the corresponding true stress-strain curves are displayed in Figure 5a. The curves under the high-speed impact state possessed the “S” shape, which might be owing to the activation of numerous {10–12} tension twins during deformation [28]. As the grain size decreased, the yield stress of the ZK60 alloy specimen increased from 67 MPa to 172 MPa, the peak stress rose from 322 MPa to 441 MPa. According to the stress-strain curves shown in the Figure 5a, the deformation rates (DR) of 3 µm, 15 µm and 25 µm specimens were 10.3%, 9.7% and 8.6%, respectively. The variation of strain and stress at different grain sizes under high-strain-rate compression directly affected the deformation energy of the material, which corresponded to the energy required for crack expansion per unit area in the material under impact. The deformation energy of the material in dynamic compression can be derived from the following equations [29]:
σ = σ c 2 ε ε c ε ε c 2
E = σ c 2 ε c 2 ε ε c 2
U c = σ c 2 2 E
ρ = 0 ε c σ d ε U c
A = H ρ
where ε represents the material strain; εc is the strain corresponding to the peak stress; E is the elastic modulus; Uc, ρ, H, and A are the elastic strain energy density, deformation energy density, height, and deformation energy of the specimen under the peak stress, respectively.
The deformation energies of alloys with 3 µm, 15 µm and 25 µm specimens were 8588.24 J, 8013.66 J, and 7965.63 J, respectively. It can be seen that the deformation energy has decreased with increasing grain size, indicating that the latter exerts a considerable effect on the high-strain-rate deformation behavior of the material.
The difference in the true stress-strain curves of the specimens was also reflected by the strain hardening curves (Figure 5b). The overall trend of the plots in Figure 5b at any grain size remained consistent, exhibiting a drastic decrease at first, then slowly increasing, and finally decreasing again. The strain hardening curves are usually divided into three stages, different deformation mechanisms cause different strain hardening characteristic [17].
In stage I, the strain hardening curves declined to a large extent, which could be due to the activation of basal slip [6]. In stage II, all three curves showed an upward trend, which is a typical strain hardening behavior dominated by {10–12} tensile twinning [30]. It can be seen from Figure 6 that there are the statistics of the grains whose c-axis is in a state of favor to activation tension (70°–110°) in the three grain size specimens [17]. According to statistical calculations, the volume fractions of grains conducive to the activation of {10–12} tensile twins in the 3 μm, 15 μm and 25 μm specimens were 12%, 29% and 42%, respectively. Therefore, the strain hardening rate of the 25 μm specimen was the highest in stage II. As the deformation proceeded, the strain hardening rate curve reached a peak in stage II. This is due to the high stress concentration at which the ability of twin boundaries to hinder the dislocation motion is reduced, and the ZK60 alloy further deformation requires activation non-basal slip [31,32,33]. In turn, the 3 μm specimen possessed a high grain boundary density, which induced the non-basal slip, resulting in a longer strain in stage III of the curve.

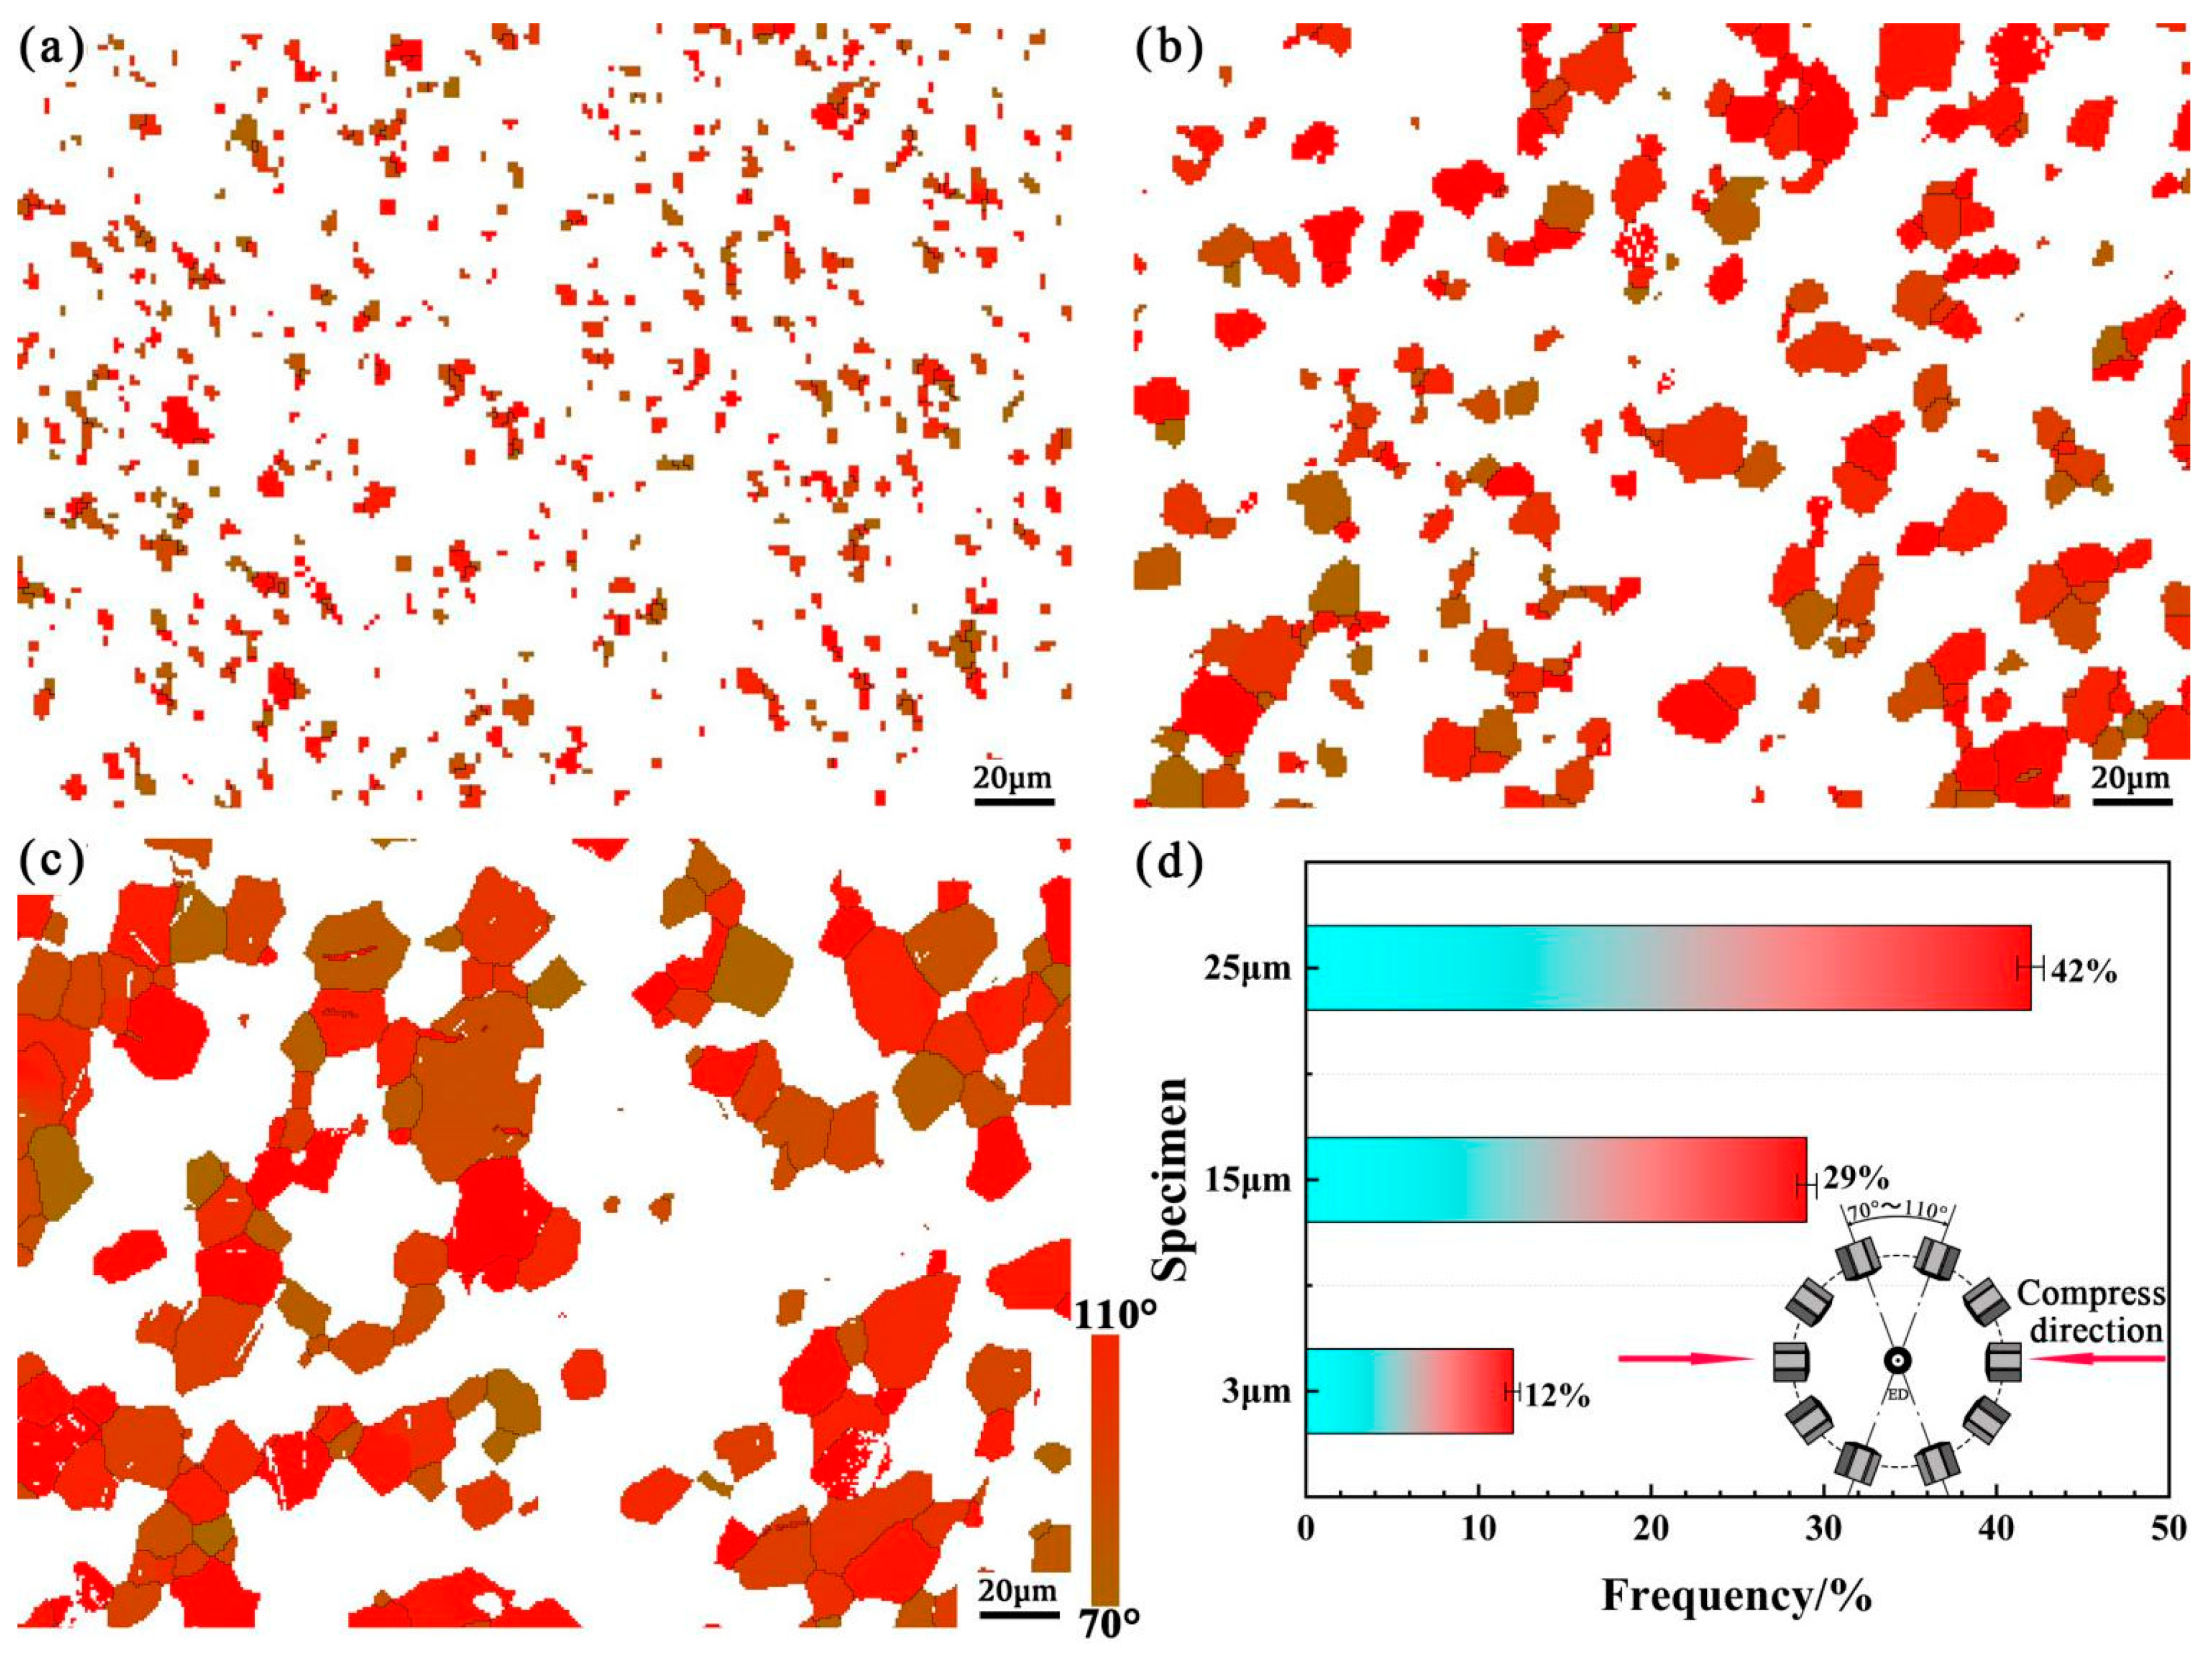
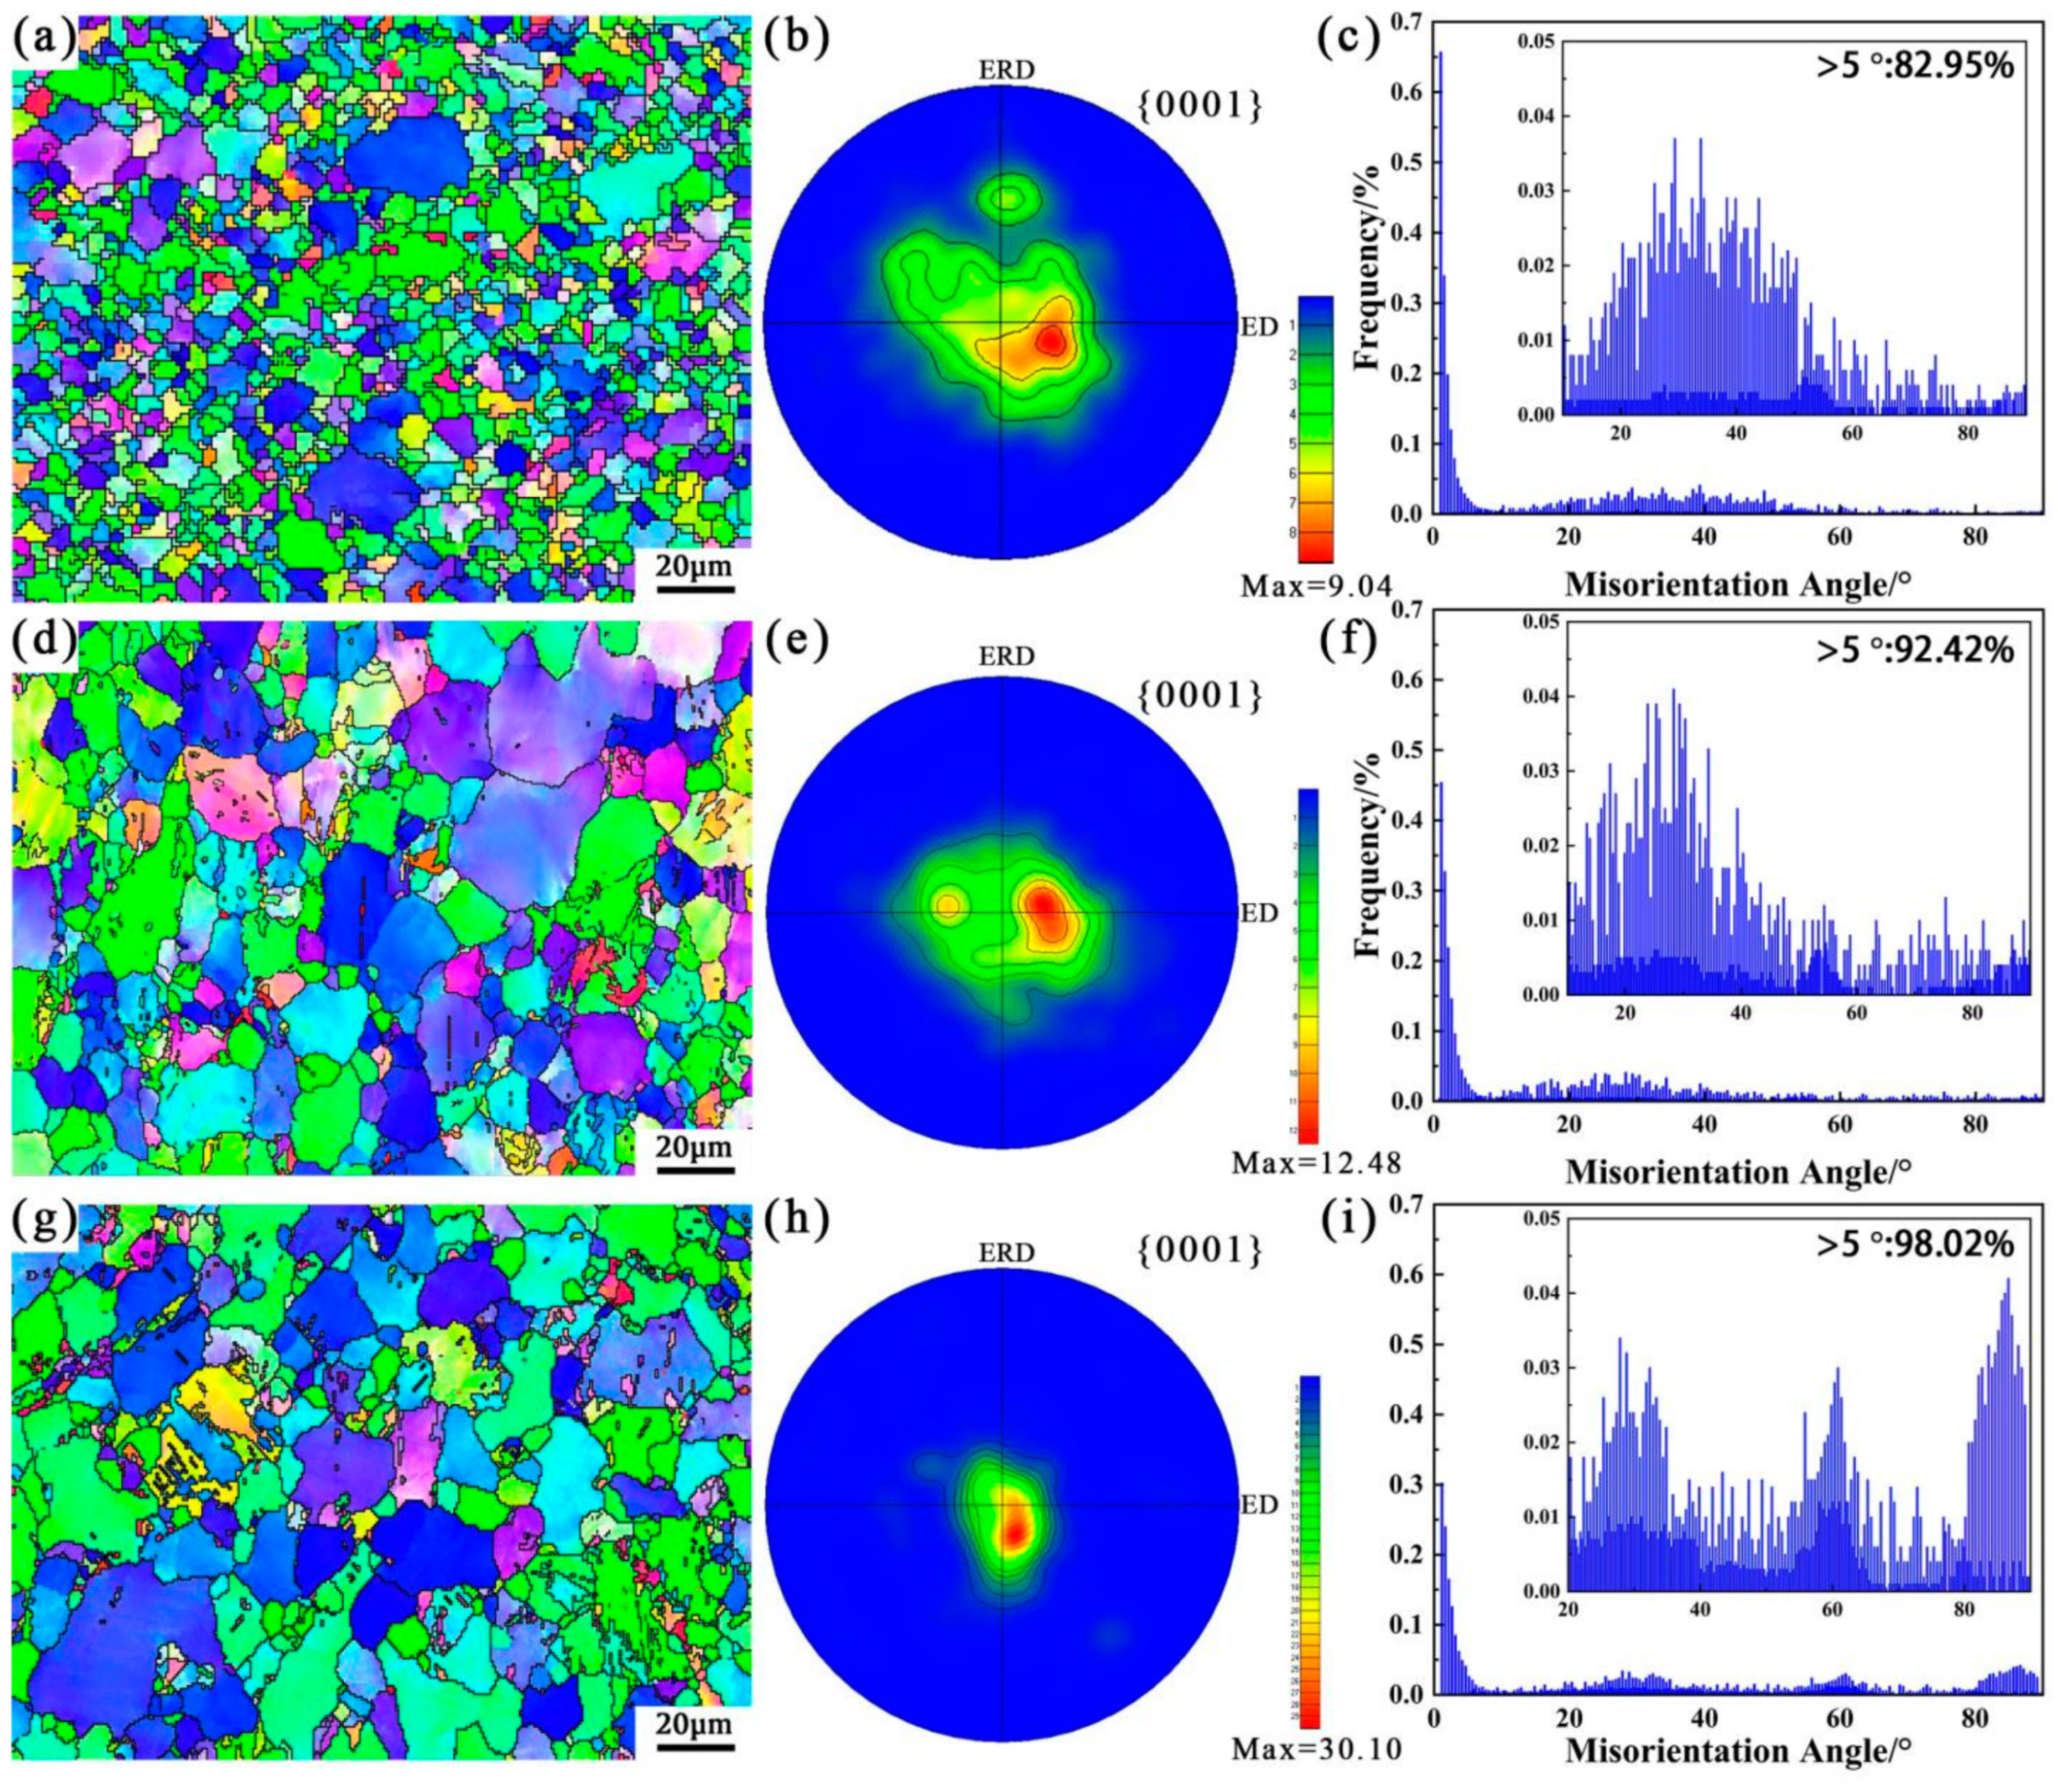
3.3. Microstructure Evolution of ZK60 Alloys with Different Grain Sizes

Figure 7a,d,g depicts the microstructures of 3 µm, 15 µm and 25 µm specimens after compressive loading at a strain rate of 1700 s−1. Compared to the data in Figure 4, it can be seen that the microstructure and texture in Figure 7 have changed significantly after high-strain-rate deformation. In particular, the coarse deformed grains coexisted with recrystallized grain refinement under dynamic loading. As shown in Figure 7b,e,h, the textures of the three specimens exhibited preferred orientations under high-strain-rate deformation. According to Figure 7c,f,i, the misorientation angle distributions of the specimens under high-strain-rate deformation. As the grain size increased, abundant DRX grain boundaries with the orientation difference above 5° appeared [17]. Tang et al. [6] showed that the change in orientation difference distribution could be mainly caused by the nucleation and growth of DRX, indicating that the large grain size specimens were more prone to DRX under the same condition of dynamic compression. In addition, the local magnification of the misorientation angle distributions (Figure 7c,f,i) revealed the low-intensity peaks at about 30°. These peaks were attributed to the 30°<0001> due to the fact that the symmetry of the hexagonal structure could have limited the effective increase in the grain misorientation angle during the DRX process [34,35]. In Figure 7i, there are two obvious misorientation angle peaks at ~60° and ~90°. The higher peak at about 90° indicated the tensile twin formation, while the lower one at 60° implied the interaction between different twin variants of tensile twins [36].

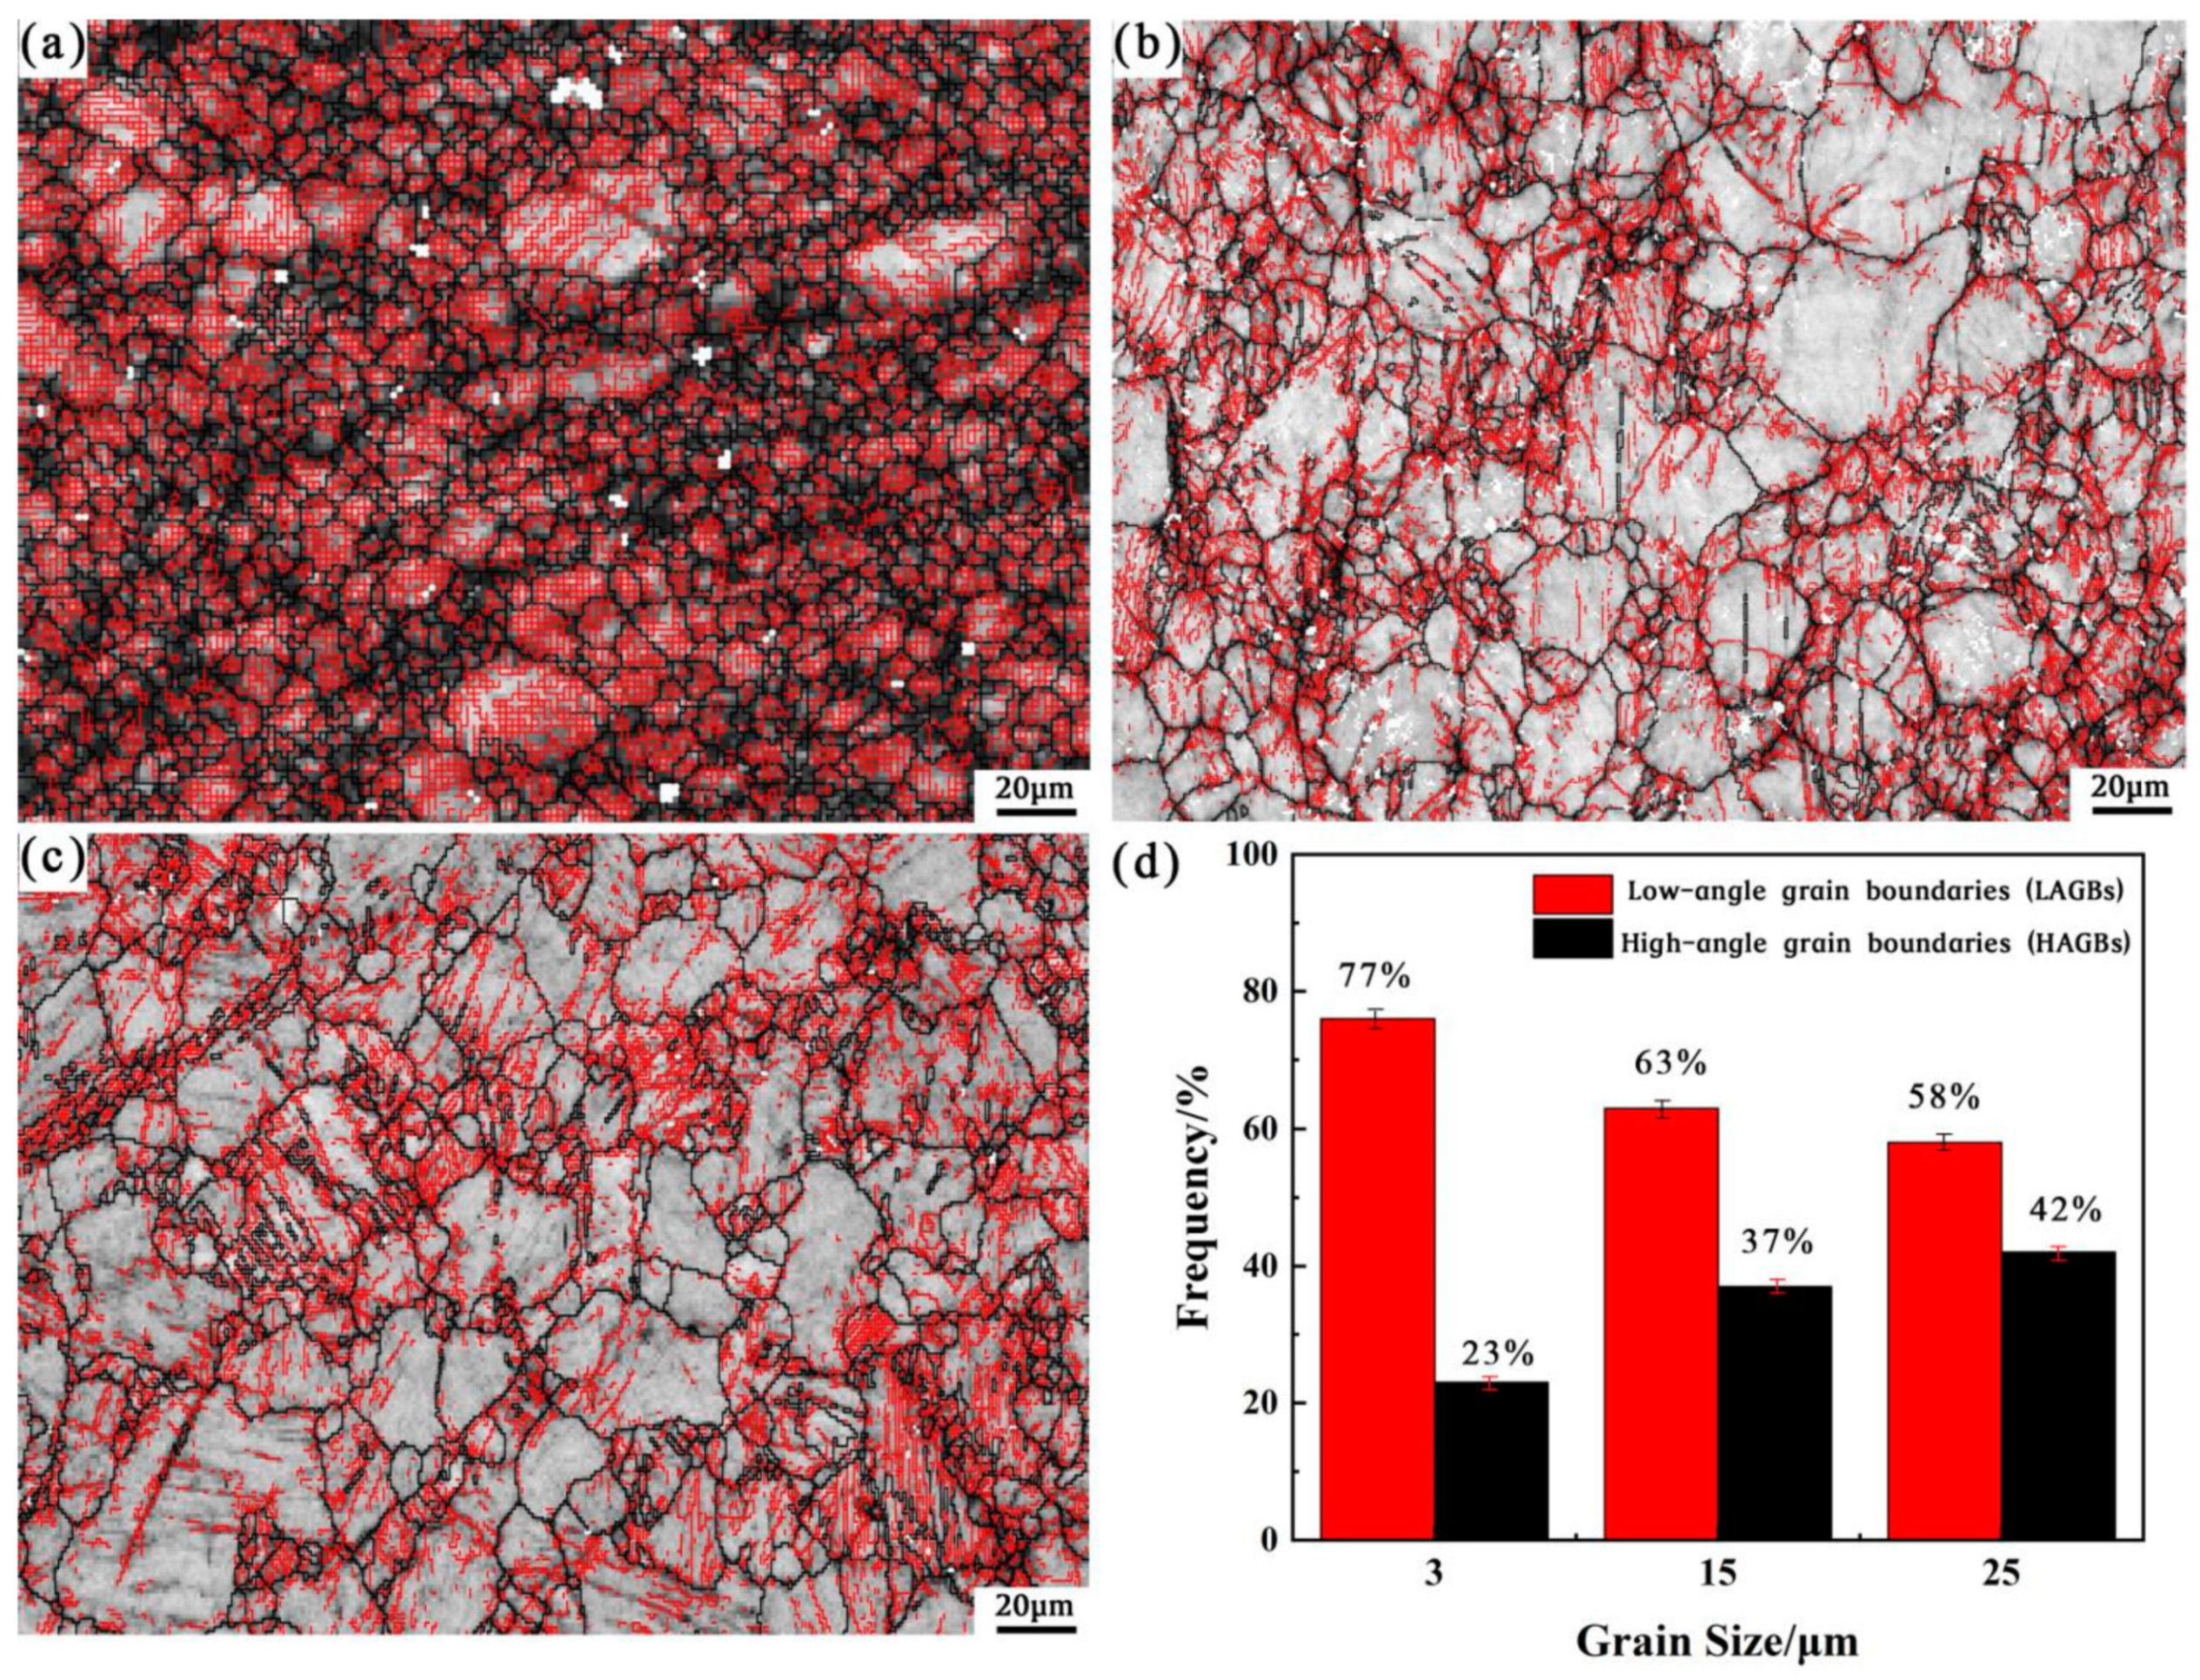
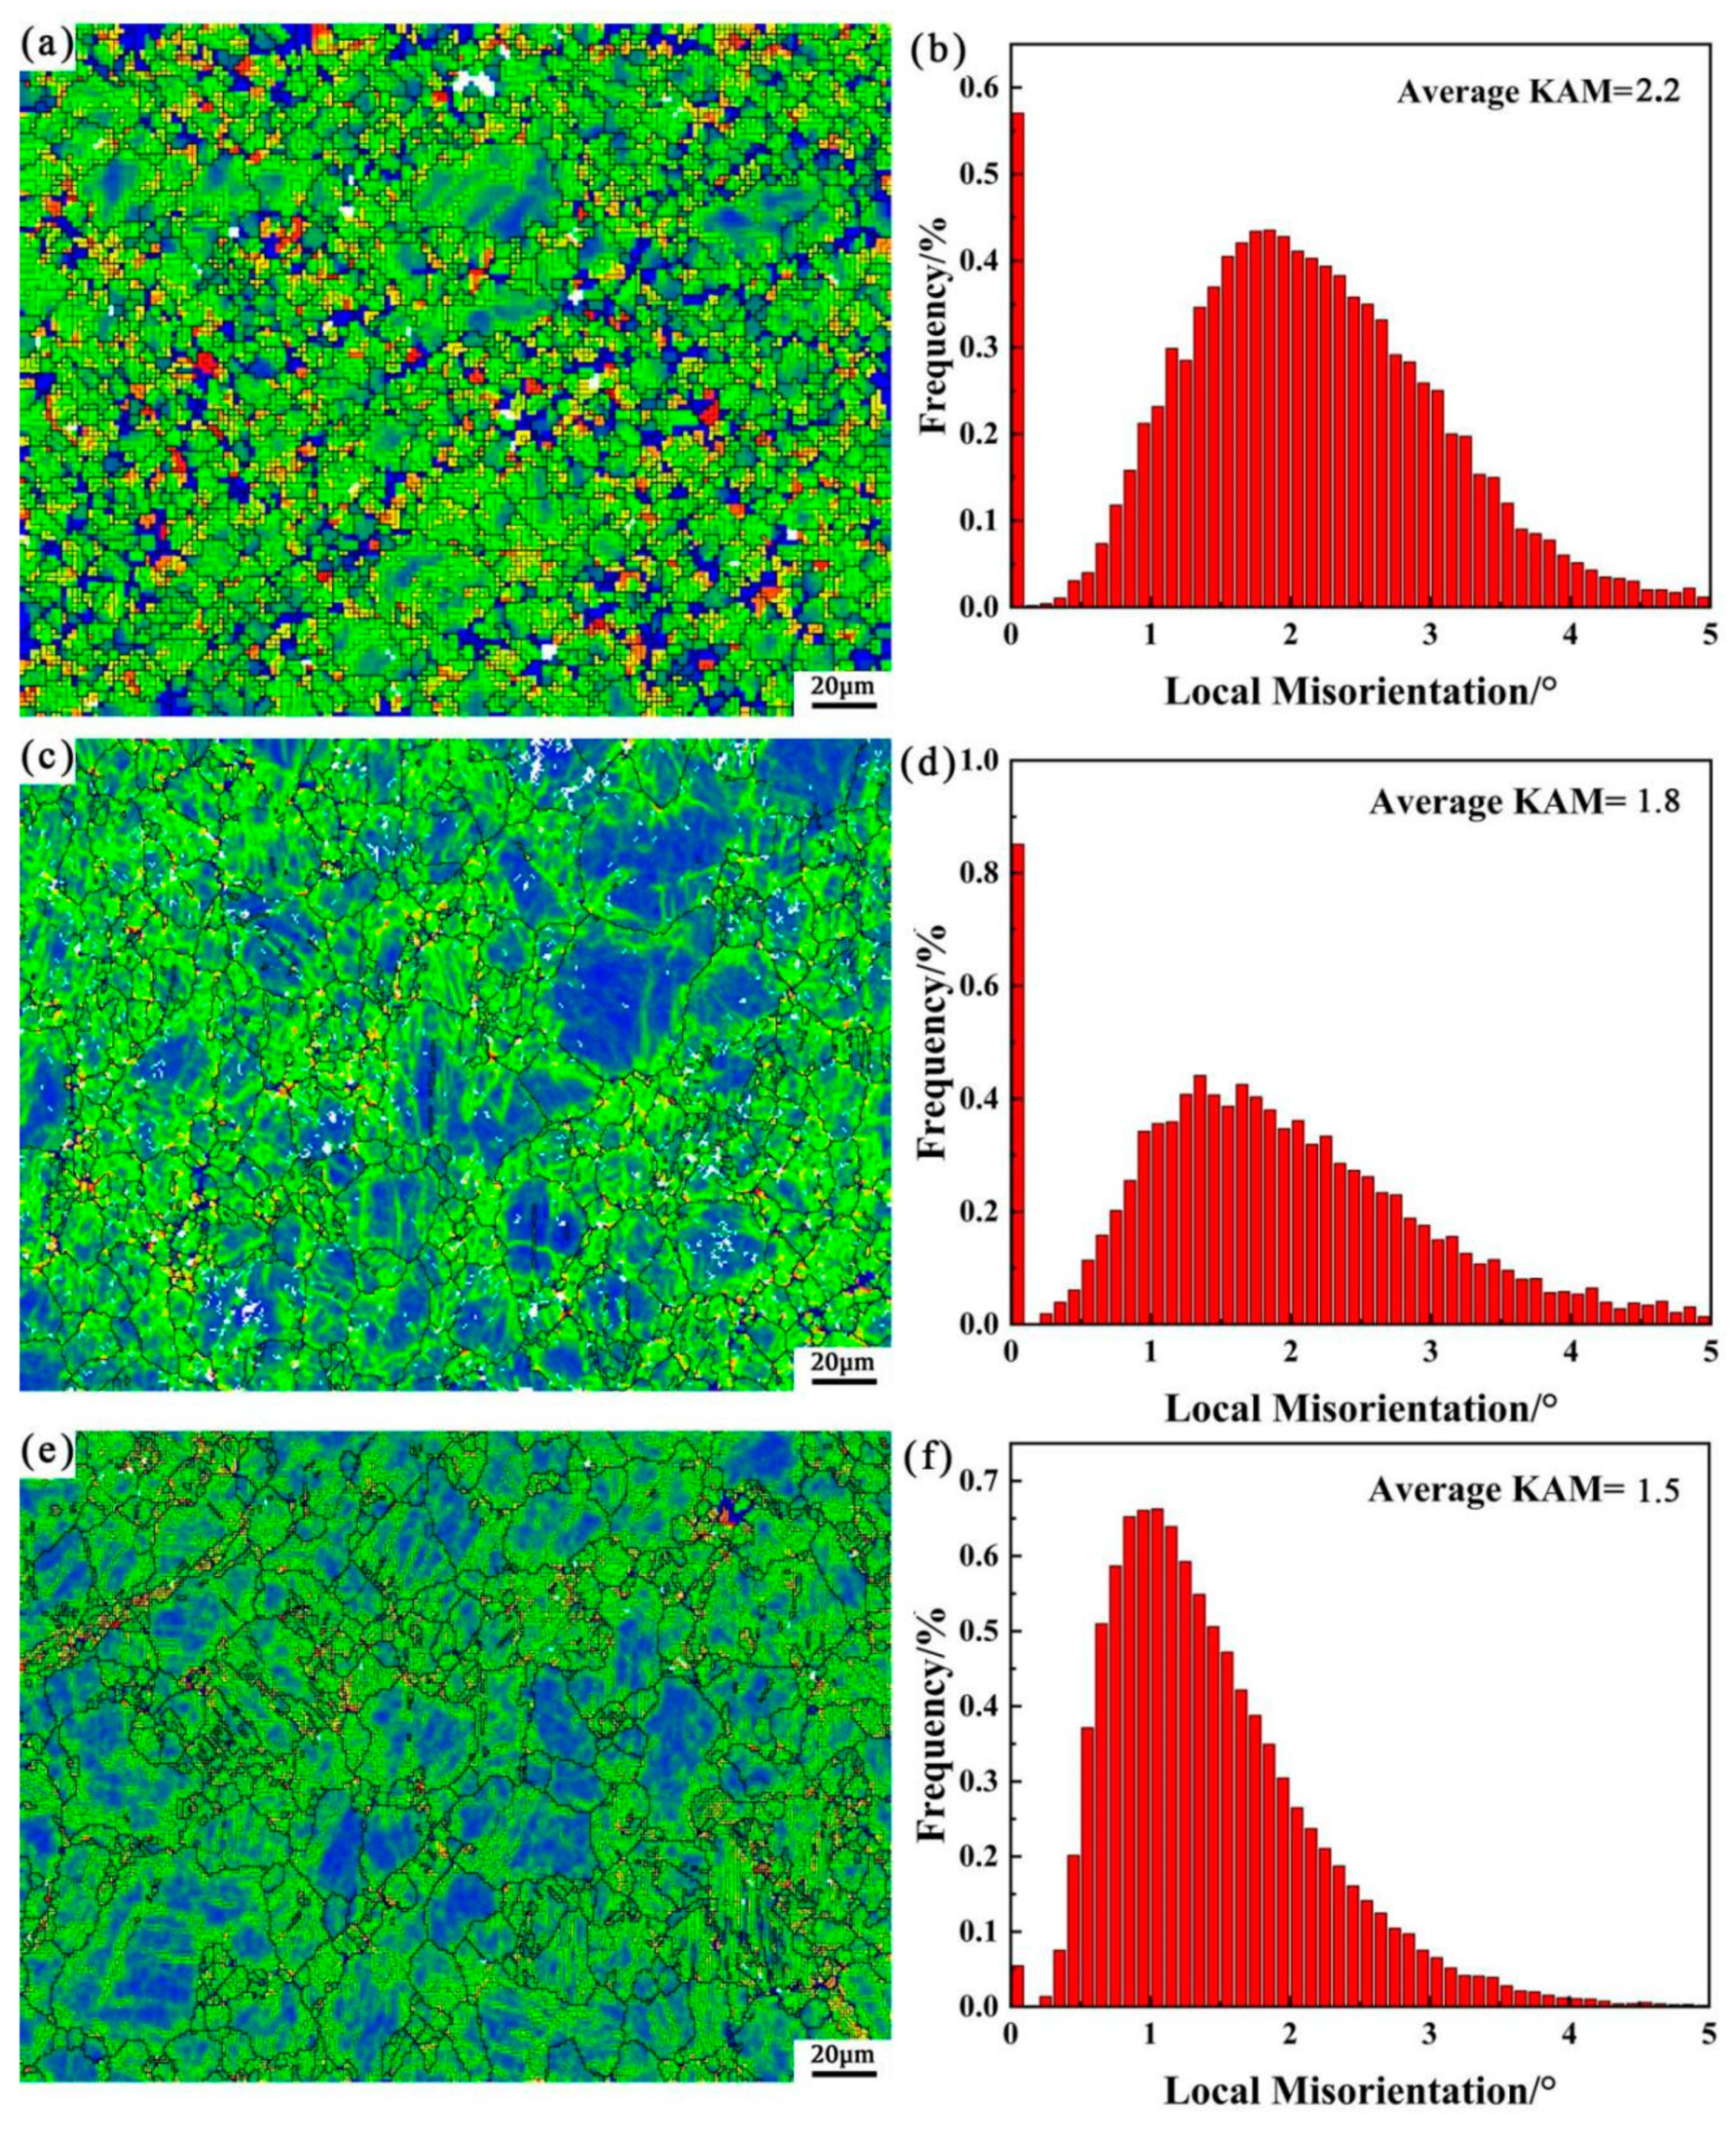
3.4. Distribution Grain Boundaries in ZK60 Alloys with Different Grain Sizes

As shown in Figure 8a–d, plenty of LAGBs were found in the specimens, whose amount gradually increased with the decrease of grain size. It was earlier found that the increase of LAGBs could be related to the dislocation slip, thereby indicating a significant dislocation buildup in the 3 μm specimen during loading [37].

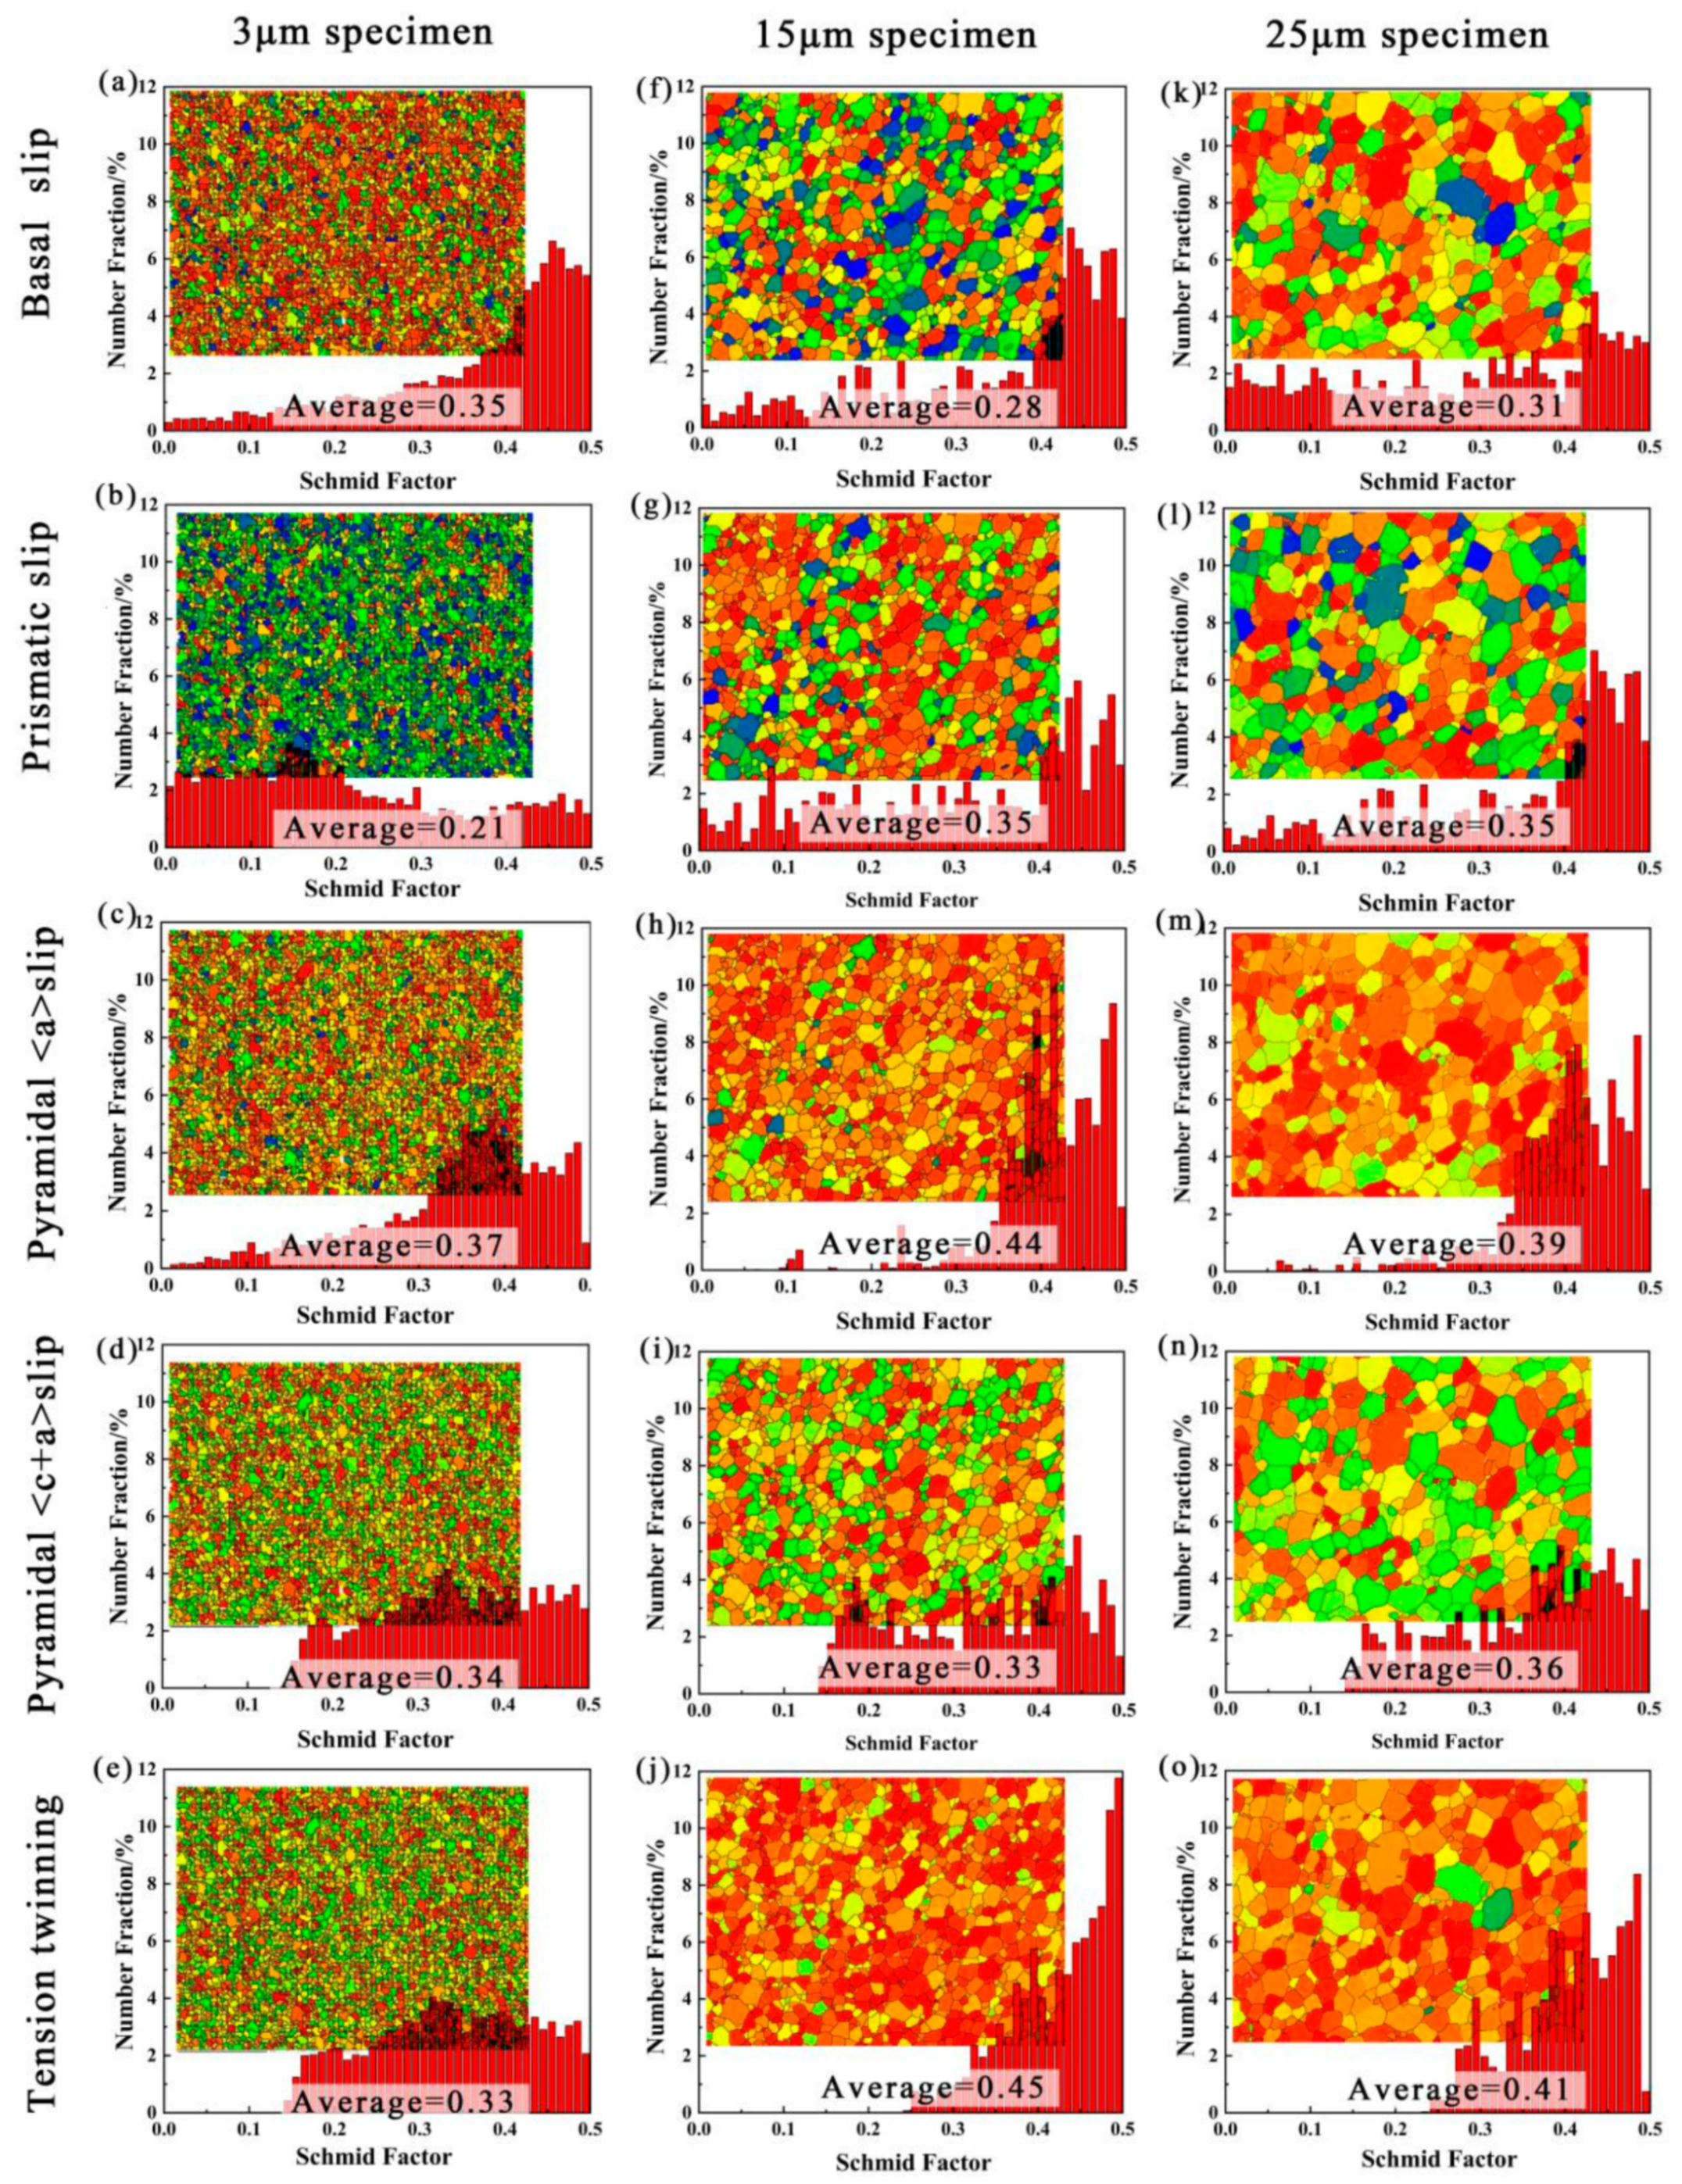
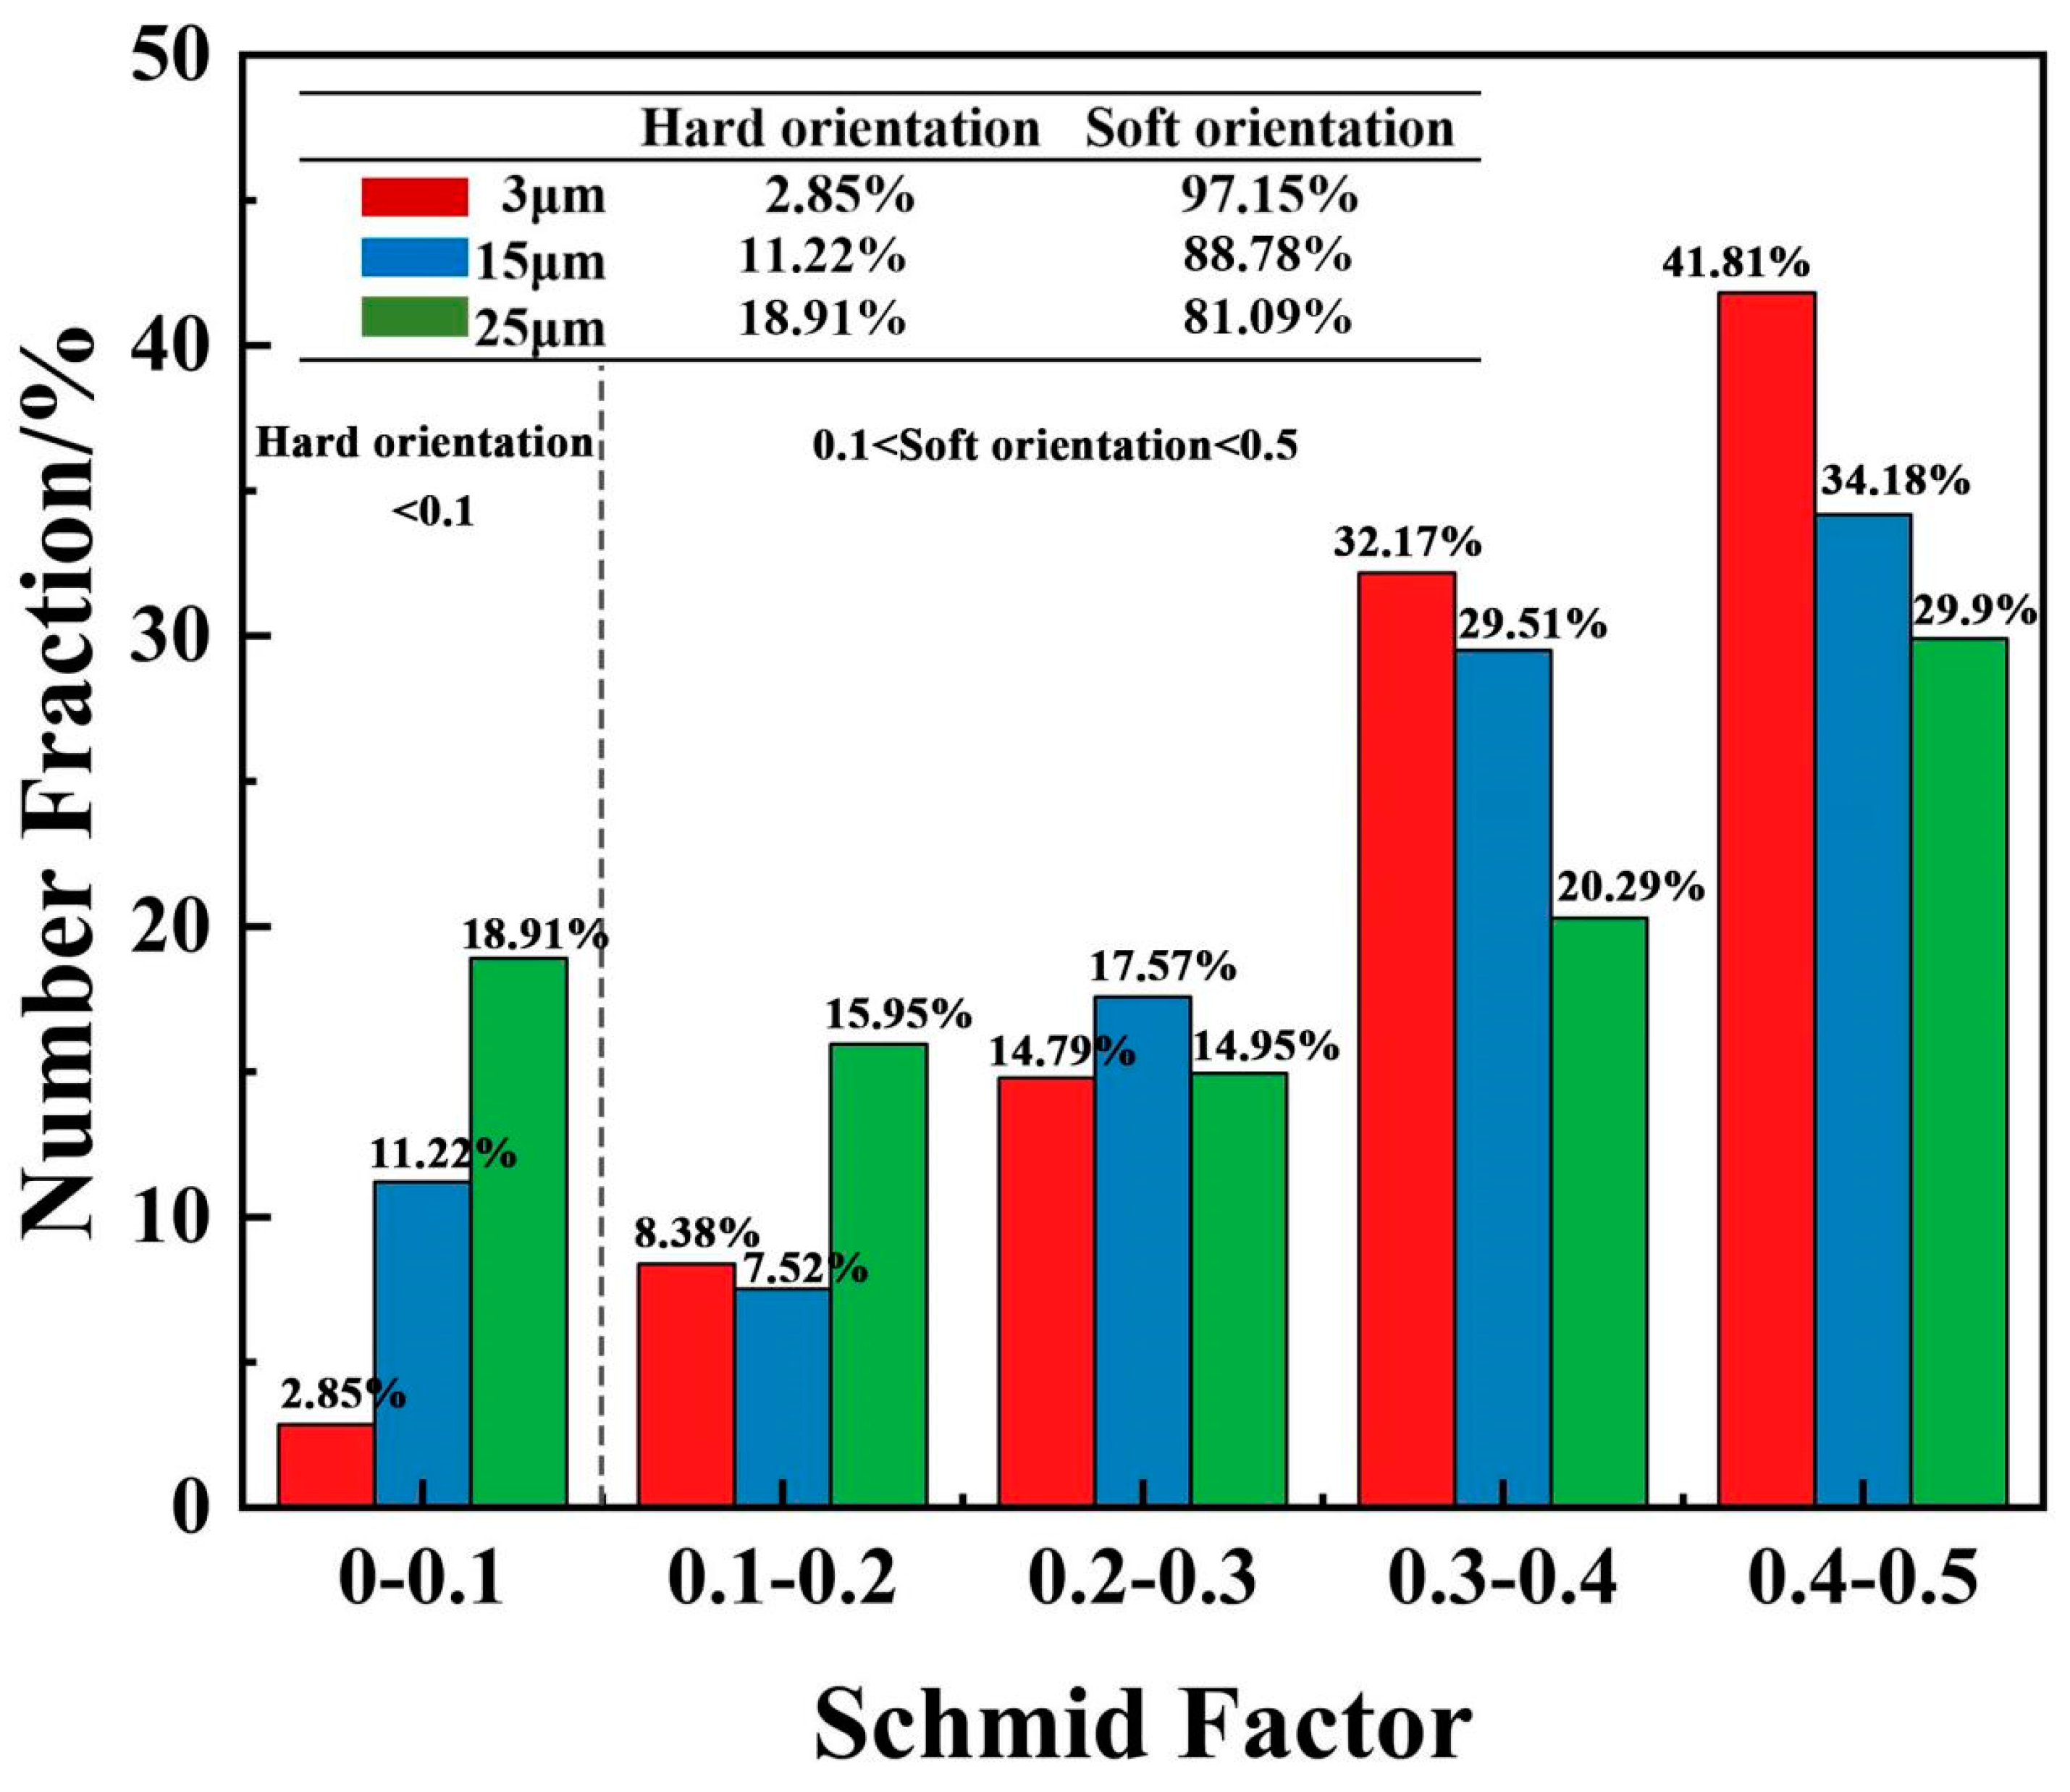
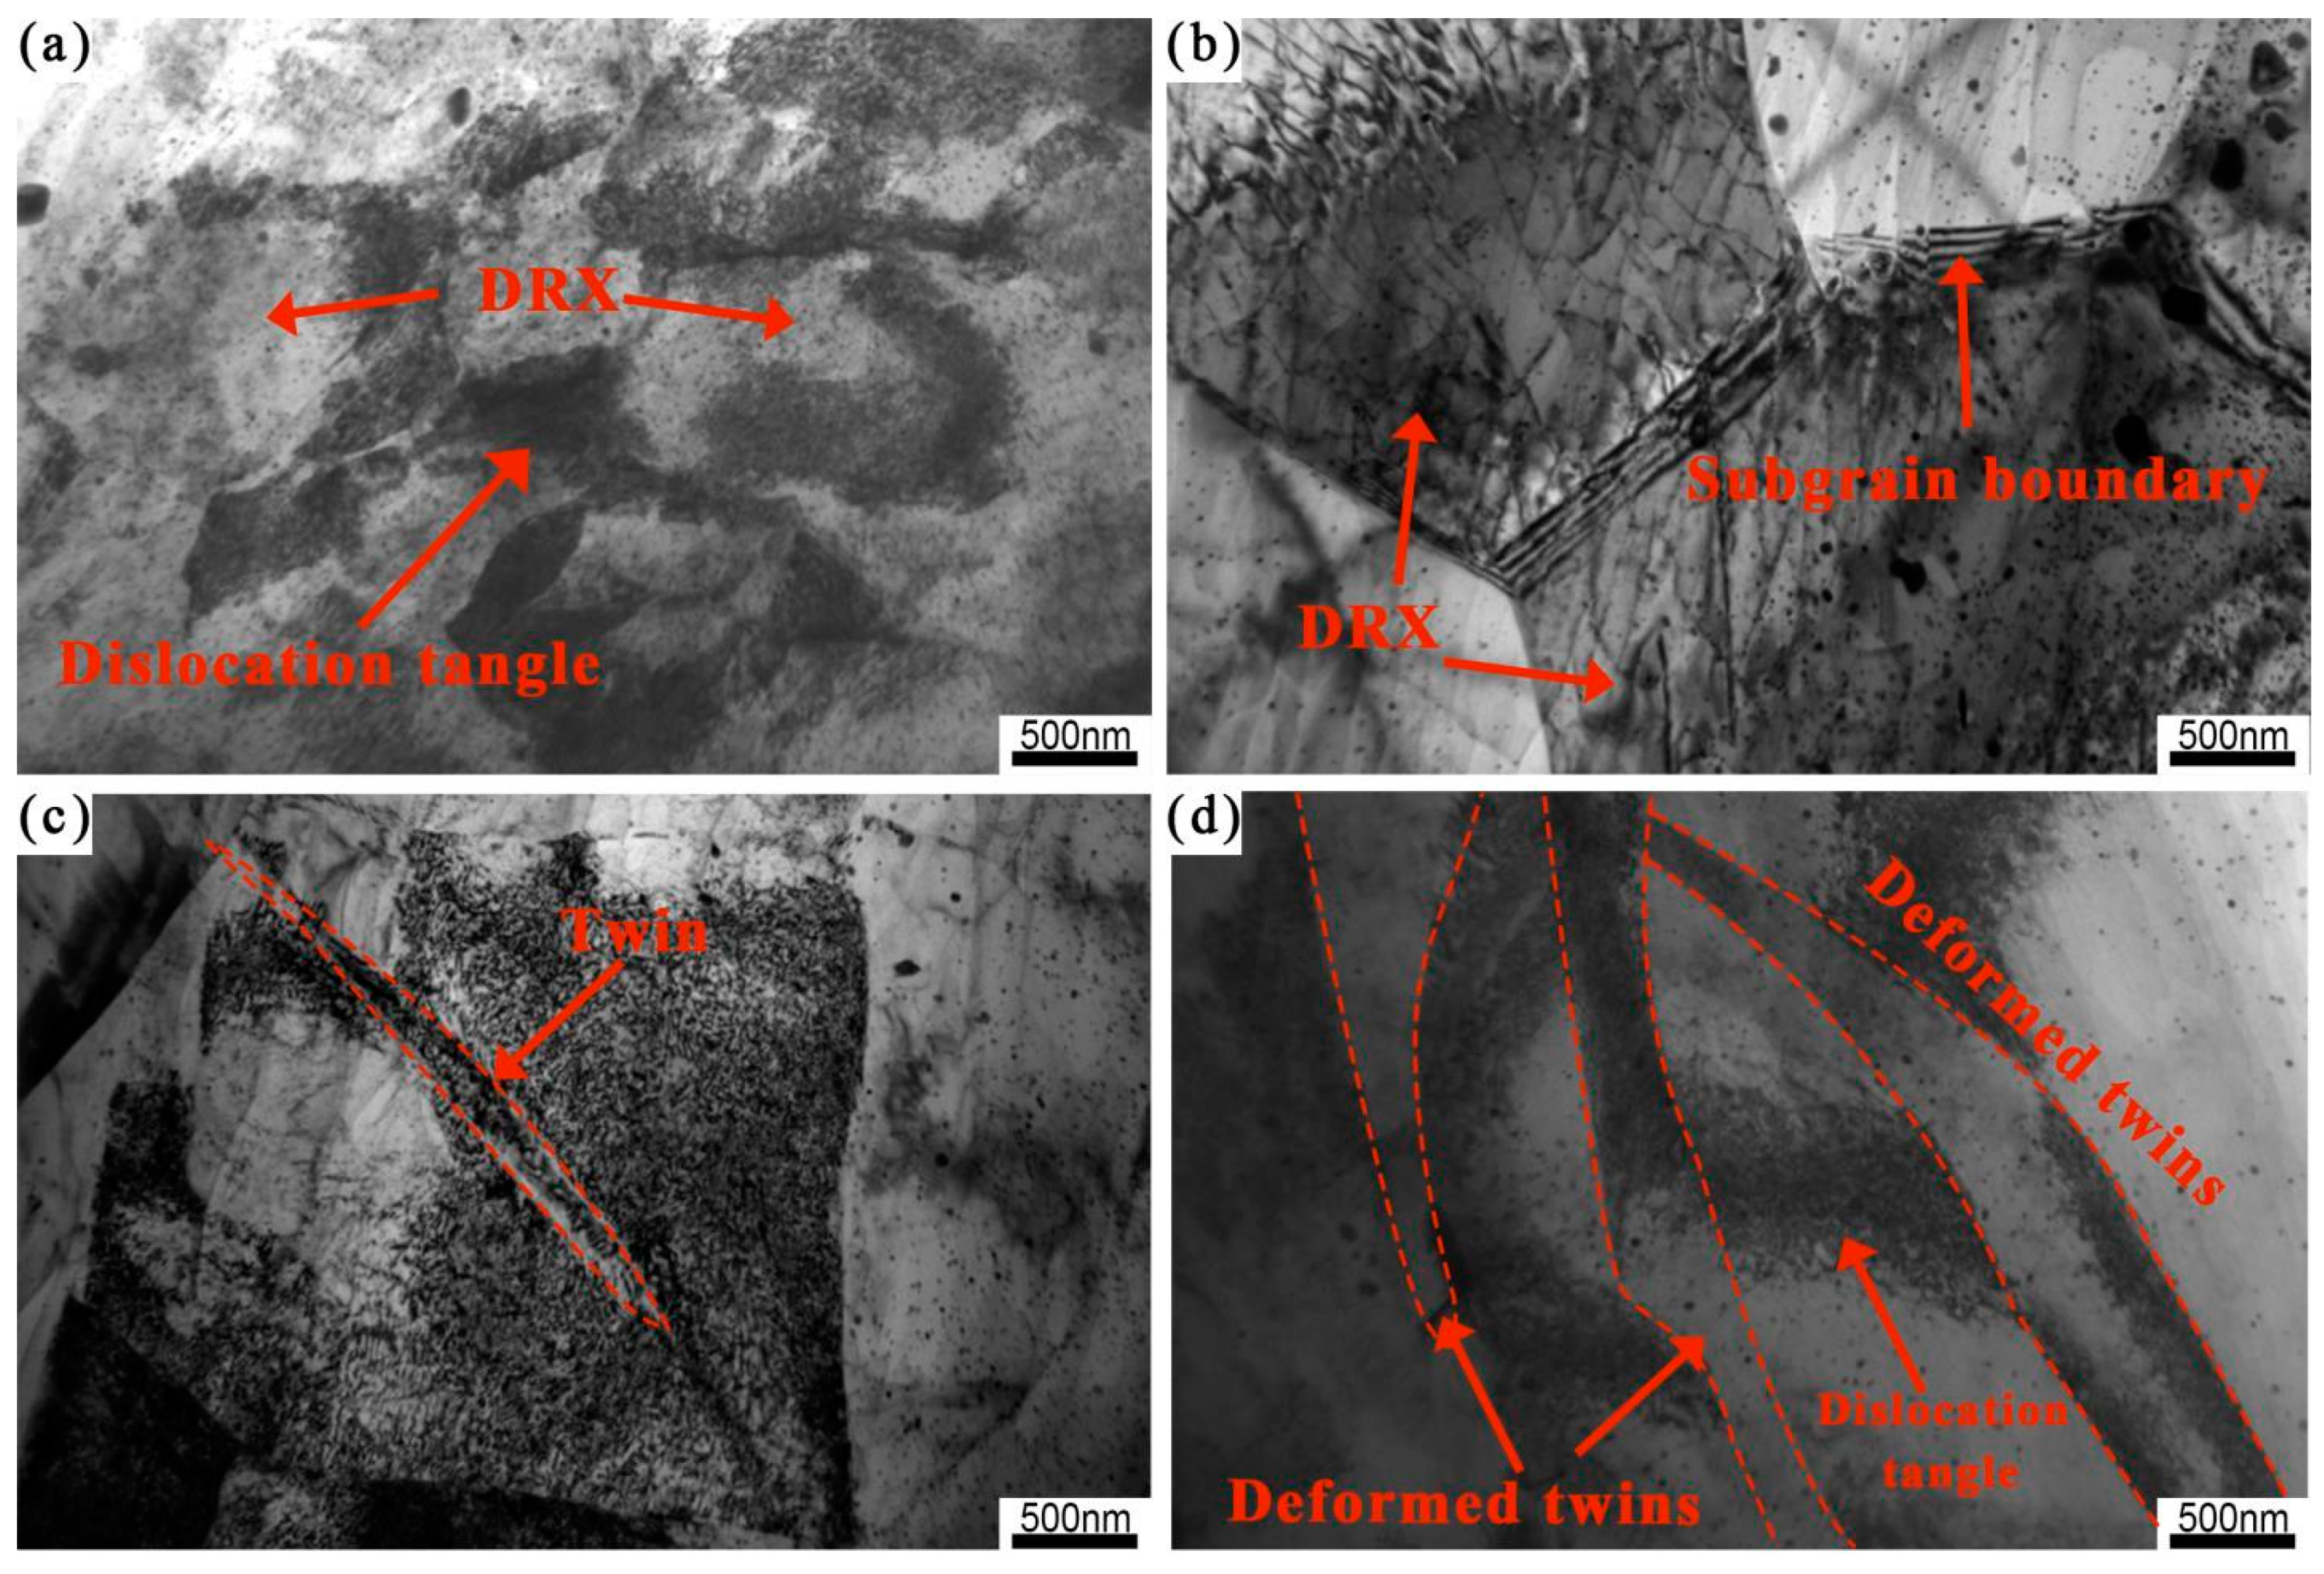
3.5. Deformation Mechanism of ZK60 Alloys with Different Grain Sizes

In order to elucidate the deformation mechanism of ZK60 alloys with various grain sizes under dynamic compression, the Figure 9 depicts the Schmid factor (SF) distributions as well as the average SF values in different slip systems and tension twinning for 3 μm, 15 μm and 25 μm specimens. From blue to red in the SF figures, which represents the difficulty of slip system activation. As seen from Figure 9a–d,f–i,k–n, the maximum average SFs of the slip systems for the 3 μm, 15 μm, 25 μm specimens were 0.37, 0.44, and 0.39, respectively, corresponding to the pyramidal <a> slip. In a word, this kind of slip was the main deformation mechanism in the above specimens under dynamic compression. Since the specimens were selected along the ED of the bars, the C-axes of the grains were in a tensile favor to activate state, and the compression twining was not easy to activate due to the high critical shear stress [38]. Therefore, the next step of the study consisted in comparing the SFs of the tensile twinning of the three specimens. As shown in Figure 9e,j,o, the SFs related to the tensile twinning of the 15 μm and 25 μm specimens were higher than those of the slip system, meaning that the tensile twinning exerted a greater influence on their dynamic compression deformation behavior. Hence, as the grain size increased, the deformation mechanism of the ZK60 alloy specimens changed from pyramidal <a> slip to tensile twinning and pyramidal <a> slip.
Li et al. [39] identified the types of slip systems activated in Mg alloy grains by slip trace analysis. It was found that the deformation dominated by the basal slip accounted for 50% of the total material strain during the deformation process of Mg alloys. Therefore, the differences between the basal plane slip hard orientation and soft orientation of ZK60 alloys with different grain sizes were further compared. In this study, the SF of basal slip less than 0.1 is defined as hard orientation, i.e., the basal slip is considered not favoured to activate, while the part with SF greater than 0.1 is soft orientation. The more SF distribution in the soft orientation, the slip system is favour to activate [7]. As shown in Figure 10, as the grain size decreased, the more SFs were distributed in the soft orientation and the proportion with an overall gradual increase. This clearly indicated that the finer the grain size is, the basal slip is more favored to activate.

3.6. Dislocation Analysis of ZK60 Alloys with Different Grain Sizes

Kernel average misorientation (KAM) can reflect the degree of homogenization of plastic deformation. The higher is the KAM value, the greater is the degree of plastic deformation and the larger is the dislocation density [40]. Figure 11 displays the KAM maps and KAM distribution histograms of ZK60 alloys with different grain sizes. After dynamic compression, the KAM value of the 3 μm specimen was 2.2. As the grain size increased, the KAM values of 15 μm and 25 μm samples decreased to 1.8 and 1.5, respectively, which was due to the formation of abundant twins, reducing stress concentration and dislocation accumulations [41].
Figure 12 depicts the TEM images of 3 μm, 15 μm and 25 μm specimens under dynamic compression. As shown in Figure 12a, there were almost no deformation twins in the 3 μm specimen, which was consistent with the above results revealing the dislocation entanglement and the formation of a new cellular microstructure called DRX in this alloy [42]. Figure 12b,c show the DRX and subgrain boundaries in the 15 μm specimen. The appearance of subgrain boundaries reduced the total energy of material deformation, resulting in scarce DRX grains. Moreover, deformation twins grew from the grain boundaries to the interior of the grains and through the cut parent grains, leading to grain refinement and the formation of microstructure large and fine grains in 15 μm specimens after dynamic compression deformation. Figure 12d show abundant deformation twins in the 25 μm specimen, which divide grains in parallel and intersecting ways to refine the grains. As the deformation progressed, one could observe the emergence and accumulation of dislocations around the twins, which were mainly determined as <a> type.

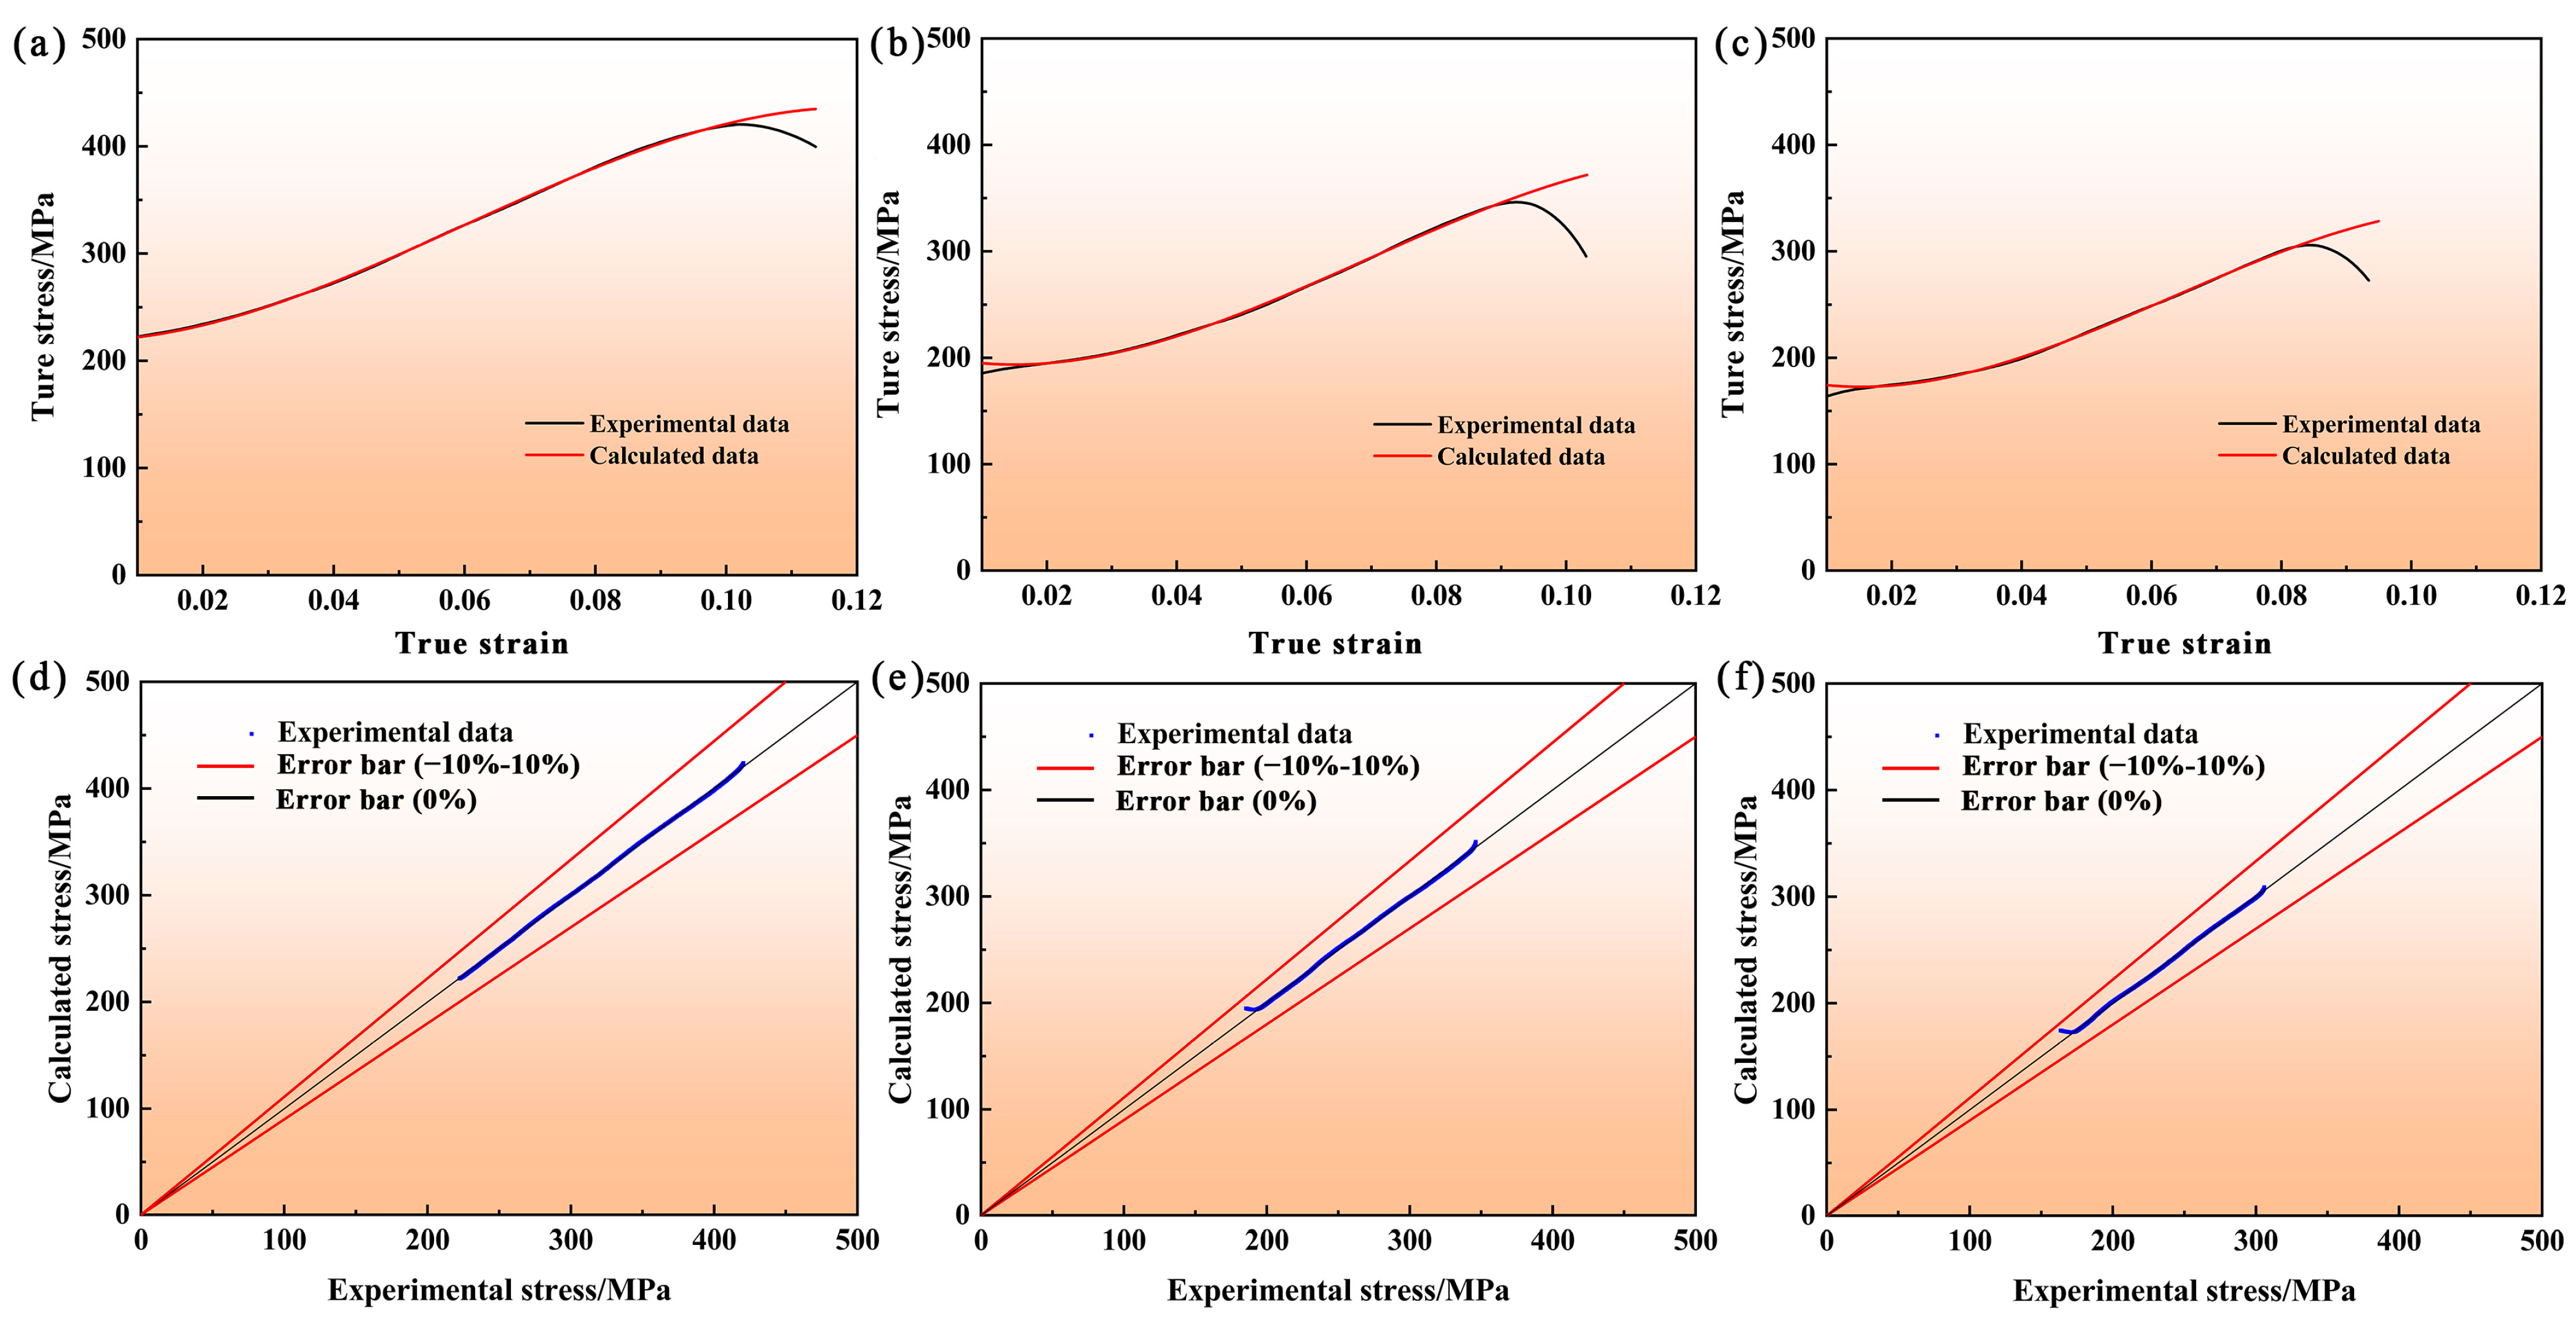
3.7. Constitutive Relation of Dynamic Compression

A standard form of the J-C constitutive model is described by the equation below [7]:
σ p = A + B ε p n 1 + C ln ε / ε r 1 T T r T m T r m
where the three terms represent strain, strain rate, and temperature, respectively. The yield stress (A), strain hardening coefficient (B), strain rate sensitivity coefficient (C) and strain hardening index (n) are the major parameters to be solved. The rest parameters, namely σ p , ε p , ε ˙ , ε ˙ r , Tm and Tr, represent the equivalent stress, equivalent plastic strain, plastic strain rate, reference strain rate, melting temperature and reference temperature, respectively [17].
Prior to the application, the J-C constitutive model needs to be modified according to the actual situation. When the dynamic deformation behavior of the material at the reference temperature, the temperature part of the J-C constitutive model is approximately neglected, as shown in the following equation [42]:
σ p = A + B ε p n 1 + C ln ε / ε r
Since the elastic deformation phase of the material is not considered in Equation (7), so the strain hardening part of Equation (7) should be corrected to a multiple times functional form [7]. Therefore, the modified J-C constitutive model can be written as follows:
σ p = A + B 1 ε p + B 1 ε p 2 + B 1 ε p 3 1 + C ln ε / ε r
where A, B1, B2, B3 and C are the parameters to be solved, which are attributed to the yield stress, strain hardening coefficient, and strain rate sensitivity coefficient, respectively.
When ε = ε r , Equation (8) takes the form of
σ p = A + B 1 ε p + B 2 ε p 2 + B 3 ε p 3
At ε ε r , Equation (8) can be rewritten as:
σ p = A + B 1 ε p + B 2 ε p 2 + B 3 ε p 3 1 + C ln ε / ε r
It follows from Equation (10) that
C = A + B 1 ε p + B 2 ε p 2 + B 3 ε p 3 1 / ln ε / ε r
The modified J-C constitutive model parameters are shown in Table 1.
The experimental and fitted stress-strain curves for the 3 µm, 15 µm and 25 µm ZK60 alloys at a strain rate of 1700 s−1 are shown in Figure 13a–c. The coefficient of determination R2 was used to evaluate the fitting degree, as shown in the following Equation (12) [43]:
R 2 = 1 i y ^ i y i 2 i y ¯ i y i 2
where y ^ i , y i , y ¯ i are the fitted value, the measured value, and the average, respectively.
The larger is the value of R2, the higher is the fitting degree of the model. The correlation between the fitted and experimental results is illustrated in Figure 13d–f. Almost all data points are distributed within the error range of −10%~10%. The coefficient of determination R2 of the 3 µm, 15 µm and 25 µm specimens were 0.9998, 0.9987 and 0.9983, respectively. Therefore, the results indicated the high accuracy and reliability of the modified J-C constitutive model for prediction and analysis of the problems concerning the dynamic compression of ZK60 alloys with different grain sizes.

4. Conclusions

The mechanical response, microstructure evolution and deformation mechanism of ZK60 alloys with different grain sizes under dynamic compression were studied. Based on the findings, the main conclusions can be drawn as follows.
(1)
The ZK60 alloy exhibited the decrease in yield strength and peak stress as the grain size increased under dynamic compression.
(2)
According to the Schmid factor analysis, the grain refinement in ZK60 alloys was conducive to the activation of basic slip under dynamic compression, so that the main deformation mechanism of alloys transformed from pyramidal <a> slip to {10–12} tensile twinning and pyramidal <a> slip.
(3)
The fitting results obtained using the modified J-C constitutive equation were consistent with experimental data, thereby proving the validity of the model proposed for accurate prediction of the deformation of ZK60 alloys with different grain sizes under dynamic compression.

Author Contributions

Conceptualization, X.L., P.M. and X.W.; methodology, X.L., P.M., X.W. and F.W.; investigation, X.L., X.W. and L.Z.; data curation, X.L.; writing—original draft preparation, X.L.; writing—review and editing, X.L., P.M. and Z.W. (Ziqi Wei); supervision, P.M., Z.L., Z.W. (Zhi Wang) and F.W. All authors have read and agreed to the published version of the manuscript.

Funding

This work was supported by High level innovation team of Liaoning Province (XLYC1908006), Project of Liaoning Education Department (LZGD2020003), and Liaoning Revitalization Talents Program (No. XLYC1807021 and 1907007).

Data Availability Statement

The raw and processed data are not available for sharing at the time of submission because they are part of our ongoing research work.

Conflicts of Interest

The authors declare no conflict of interest.

References

  1. Alvarez-Lopez, M.; Pereda, M.D.; Valle, J.A.; Fernandez-Lorenzo, M.; Garcia-Alonso, M.C.; Ruano, O.A. Corrosion behaviour of AZ31 Mg alloy with different grain sizes in simulated biological fluids. Acta Biomater. 2009, 6, 1763–1771. [Google Scholar] [CrossRef]
  2. Liu, S.M.; Wei, Z.Q.; Liu, Z.; Mao, P.L.; Wang, F.; Wang, Z.; Zhou, L.; Yin, X.N. Effect of Zn content on hot tearing susceptibility of LPSO enhanced Mg-Znx-Y2-Zr0.06 alloys with different initial mold temperatures. J. Alloys Compd. 2022, 904, 16393. [Google Scholar] [CrossRef]
  3. Bernard, J.D.; Jordon, J.B.; Lugo, M.; Hughes, J.M.; Rayborn, D.C.; Horstemeyer, M.F. Observations and modeling of the small fatigue crack behavior of an extruded AZ61 Mg alloy. Int. J. Fatigue 2013, 52, 20–29. [Google Scholar] [CrossRef]
  4. Wei, Z.Q.; Mu, W.P.; Liu, S.M.; Wang, F.; Zhou, L.; Wang, Z.; Mao, P.L.; Liu, Z. Effects of Gd on hot tearing susceptibility of as-cast Mg96.94-Zn1-Y(2−x)-Gdx-Zr0.06 alloys reinforced with LPSO phase. J. Alloys Compd. 2022, 926, 16895. [Google Scholar] [CrossRef]
  5. Peng, J.H.; Zhang, Z.; Liu, Z.; Li, Y.Z.; Guo, P.; Zhou, W.; Wu, Y.C. The effect of texture and grain size on improving the mechanical properties of Mg-Al-Zn alloys by friction stir processing. Sci. Rep. 2018, 8, 4196. [Google Scholar] [CrossRef]
  6. Tang, W.R.; Liu, Z.; Liu, S.M.; Zhou, L.; Mao, P.L.; Guo, H.; Sheng, X.F. Deformation mechanism of fine grained Mg-7Gd-5Y-1.2Nd-0.5Zr alloy under high temperature and high-strain-rates. J. Magnes. Alloy. 2020, 8, 1144–1153. [Google Scholar] [CrossRef]
  7. Zhang, F.; Liu, Z.; Yang, M.M.; Su, G.Y.; Zhao, R.F.; Mao, P.L. Microscopic mechanism exploration and constitutive equation construction for compression characteristics of AZ31-TD Mg alloy at high-strain-rate. Mater. Sci. Eng. A 2019, 771, 138571. [Google Scholar] [CrossRef]
  8. Lu, L.; Huang, J.W.; Fan, D.; Bie, B.X.; Sun, T.; Fezzaa, K.; Gong, X.L.; Luo, S.N. Anisotropic deformation of extruded Mg alloy AZ31 under uniaxial compression: A study with simultaneous in situ synchrotron X-ray imaging and diffraction. Acta Mater. 2016, 120, 86–94. [Google Scholar] [CrossRef]
  9. Dai, Y.X.; Xiao, M.H.; Hu, Y.B.; Yang, Y.; Jiang, B.; Zheng, T.X. Effect of extrusion parameters on microstructure and mechanical properties of Mg-0.12Ca-0.08Ba alloy. J. Mater. Res. Technol. 2022, 20, 1570–1579. [Google Scholar] [CrossRef]
  10. Yang, M.B.; Li, H.L.; Duan, C.Y.; Zhang, J. Effects of minor Ti addition on as-cast microstructure and mechanical properties of Mg-3Sn-2Sr (wt.%) Mg alloy. J. Alloys Compd. 2013, 579, 92–99. [Google Scholar] [CrossRef]
  11. Lv, C.L.; Liu, T.M.; Liu, D.J.; Jiang, S.; Zeng, W. Effect of heat treatment on tension-compression yield asymmetry of AZ80 Mg alloy. Mater. Des. 2012, 33, 529–533. [Google Scholar] [CrossRef]
  12. Wang, J.F.; Gao, S.; Song, P.F.; Huang, X.F.; Shi, Z.Z.; Pan, F.S. Effects of phase composition on the mechanical properties and damping capacities of as-extruded Mg-Zn-Y-Zr alloys. J. Alloys Compd. 2011, 509, 8567–8572. [Google Scholar] [CrossRef]
  13. Dogan, E.; Vaughan, M.W.; Wang, S.J.; Karaman, I.; Proust, G. Role of starting texture and deformation modes on low-temperature shear formability and shear localization of Mg-3Al-1Zn alloy. Acta Mater. 2015, 89, 408–422. [Google Scholar] [CrossRef]
  14. Yuan, W.; Panigrahi, S.K.; Su, J.Q.; Mishra, R.S. Influence of grain size and texture on Hall-Petch relationship for a Mg alloy. Scripta. Mater. 2011, 65, 994–997. [Google Scholar] [CrossRef]
  15. Yu, H.H.; Li, C.Z.; Xin, Y.C.; Chapuis, A.; Huang, X.X.; Liu, Q. The mechanism for the high dependence of the Hall-Petch slope for twinning/slip on texture in Mg alloys. Acta Mater. 2017, 128, 313–326. [Google Scholar] [CrossRef]
  16. Kula, A.; Silva, C.J.; Niewczas, M. Grain size effect on deformation behaviour of Mg-Sc alloys. J. Alloys Compd. 2017, 727, 642–657. [Google Scholar] [CrossRef]
  17. Liu, X.Y.; Mao, P.L.; Wu, X.X.; Liu, Z.; Zhou, L.; Wang, Z.; Wang, F. Dynamic compression behaviour and constitutive description of fine-grain Mg-4Zn-1Y alloy. Mater. Sci. Tech-Lond. 2022, 38, 1605–1616. [Google Scholar] [CrossRef]
  18. Zhu, G.M.; Wang, L.Y.; Sun, Y.J.; Shang, X.Q.; Wang, J.; Wang, H.M.; Zeng, X.Q. Grain-size effect on the deformation of Mg3Al3Sn alloy: Experiments and elastic-viscoplastic self-consistent modeling. Int. J. Plast. 2021, 143, 103018. [Google Scholar] [CrossRef]
  19. Luo, X.; Feng, Z.Q.; Yu, T.B.; Luo, J.Q.; Huang, T.L.; Wu, G.L.; Hansen, N.; Huang, X.X. Transitions in mechanical behavior and in deformation mechanisms enhance the strength and ductility of Mg-3Gd. Acta Mater. 2020, 183, 398–407. [Google Scholar] [CrossRef]
  20. Barnett, M.R.; Keshavarz, Z.; Beer, A.G.; Atwell, D. Influence of grain size on the compressive deformation of wrought Mg-3Al-1Zn. Acta Mater. 2004, 52, 5093–5103. [Google Scholar] [CrossRef]
  21. Zhou, S.J.; Liu, H.Q.; Huang, N. Effect of original grain size on microstructure and properties of extruded Mg-2Zn-0.2Mn biomedical alloy. Integr. Ferroelectr. 2019, 201, 231–240. [Google Scholar]
  22. Lu, K. Making strong nanomaterials ductile with gradients. Science 2014, 345, 1455–1456. [Google Scholar] [CrossRef] [PubMed]
  23. Chen, H.Z.; Wang, J.; Meng, X.C.; Xie, Y.M.; Li, Y.M.; Wan, L.; Huang, Y.X. Ultrafine-grained Mg-Zn-Y-Zr alloy with remarkable improvement in superplasticity. Mater. Lett. 2021, 303, 130524. [Google Scholar] [CrossRef]
  24. Li, A.W.; Li, W.; Mei, L.; Yu, H.M.; Sun, Y.D.; Liang, Y.L. Effect of grain size on the microstructure and deformation mechanism of Mg-2Y-0.6Nd-0.6Zr alloy at a high strain rate. Mater. Sci. Eng. A 2021, 824, 141774. [Google Scholar] [CrossRef]
  25. Lei, C.; Wang, Q.D.; Tang, H.P.; Liu, T.W.; Li, Z.Y.; Jiang, H.Y.; Wang, K.; Ebrahimi, M.; Ding, W.J. Hot deformation constitutive model and processing maps of homogenized Al-5Mg-3Zn-1Cu alloy. J. Mater. Res. Technol. 2021, 14, 324–339. [Google Scholar] [CrossRef]
  26. Yuqing, E.; Mao, P.; Liu, X.; Wu, X.; Wang, F.; Wang, Z.; Zhou, L.; Liu, Z. Adiabatic shear behaviour of AZ31 alloy with different grain size under high-strain-rate. Mater. Sci. Tech-Lond. 2022, 38, 1070–1080. [Google Scholar] [CrossRef]
  27. Zhang, G.H.; Chen, J.H.; Yan, H.G.; Su, B. Effects of solution heat treatment on microstructure and mechanical properties of the Mg-4.5Zn-4.5Sn-2Al-0.6Sr alloy. J. Mater. Eng. Perform. 2014, 23, 3831–3841. [Google Scholar] [CrossRef]
  28. Li, X.; Mao, P.; Liu, Y.; Liu, Z.; Wang, Z.; Wang, F. Anisotropy and deformation mechanisms of as-extruded Mg-3Zn-1Y magnesium alloy under high-strain-rates. Acta Metall. 2018, 54, 557–565. [Google Scholar]
  29. Wang, X.B. Size effect of shear fracture energy of concrete in uniaxial compression based on gradient-dependent plasticity. Key Eng. Mat. 2006, 312, 299–304. [Google Scholar] [CrossRef]
  30. Bhattacharyya, J.J.; Wang, F.; Wu, P.D.; Whittington, W.R.; Kadiri, H.E.; Agnew, S.R. Demonstration of alloying, thermal activation, and latent hardening effects on quasi-static and dynamic polycrystal plasticity of Mg alloy, WE43-T5, plate. Int. J. Plast. 2016, 81, 123–151. [Google Scholar] [CrossRef]
  31. Dobron, P.; ChmelIk, F.; Yi, S.B. Grain size effects on deformation twinning in an extruded Mg alloy tested in compression. Scripta. Mater. 2011, 65, 424–427. [Google Scholar] [CrossRef]
  32. Hou, D.W.; Liu, T.M.; Luo, L.J.; Lu, L.W.; Chen, H.C.; Shi, D.F. Twinning behaviors of a rolled AZ31 Magnesium alloy under multidirectional loading. Mater. Charact. 2017, 124, 122–128. [Google Scholar] [CrossRef]
  33. Guo, L.L.; Chen, Z.C.; Li, G. Effects of grain size, texture and twinning on mechanical properties and work-hardening behavior of AZ31 Magnesium alloys. Mater. Sci. Eng. A 2013, 528, 8537–8545. [Google Scholar] [CrossRef]
  34. Zhang, Q.; Chen, Z.Y.; Li, Q.A.; Chen, X.Y.; Zhao, J.X.; Bao, J. Deformation behavior characterized by reticular shear bands and long chain twins in Mg-Gd-Nd(-Zn)-Zr alloys. J. Mater. Res. Technol. 2021, 15, 5326–5342. [Google Scholar] [CrossRef]
  35. Yan, Z.F.; Wang, D.H.; Dong, P.; Li, C.H.; Li, H.; Zhou, J.; Liu, Z.; Sun, L.Y. Deformation behaviors and cyclic strength assessment of AZ31B Mg alloy based on steady ratcheting effect. Mater. Sci. Eng. A 2018, 723, 212–220. [Google Scholar] [CrossRef]
  36. Li, N.L.; Huang, G.J.; Xin, R.L.; Liu, Q. Effect of initial texture on dynamic recrystallization and deformation mechanisms in AZ31 Mg alloy extruded at 573K. Mater. Sci. Eng. A 2013, 569, 18–26. [Google Scholar] [CrossRef]
  37. Wu, W.X.; Jin, L.; Dong, J.; Ding, W.J. Deformation behavior and texture evolution in an extruded Mg-1Gd alloy during uniaxial compression. Mater. Sci. Eng. A 2014, 593, 48–54. [Google Scholar] [CrossRef]
  38. Zhou, L.; Zhang, J.P.; Li, Y.T.; Wang, Z.; Liu, S.M.; Wang, F.; Mao, P.L.; Liu, Z. Microstructural evolution of Mg-6Zn-0.6Zr alloy during high-strain-rate compression deformation. Mater. Sci. Technol. 2021, 37, 258–268. [Google Scholar] [CrossRef]
  39. Li, W.; Wang, L.; Zhou, B.; Liu, C.; Zeng, X. Grain-scale deformation in a Mg-0.8wt% Y alloy using crystal plasticity finite element method. J. Mater. Sci. Technol. 2019, 35, 2200–2206. [Google Scholar] [CrossRef]
  40. Zhao, Z.B.; Wang, Q.J.; Liu, J.R.; Yang, R. Characterizations of microstructure and crystallographic orientation in a near-alpha titanium alloy billet. J. Alloys Compd. 2017, 712, 179–184. [Google Scholar] [CrossRef]
  41. Wang, R.F.; Mao, P.L.; Liu, Y.Y.; Chen, Y.; Wang, Z.; Wang, F.; Zhou, L.; Liu, Z. Influence of pre-twinning on high-strain-rate compressive behavior of AZ31 Mg-alloys. Mater. Sci. Eng. A 2019, 742, 309–317. [Google Scholar] [CrossRef]
  42. Tang, W.R.; Liu, S.M.; Liu, Z.; Kang, S.; Mao, P.L.; Guo, K. High-strain-rate compression deformation mechanism and constitutive equation of fine grained Mg-7Gd-5Y-l.2Nd-0.5Zr alloy at different temperatures. Mater. Sci. Eng. A 2020, 780, 139208. [Google Scholar] [CrossRef]
  43. Mitsui, T.; Okuyama, S. Measurement data selection using multiple regression analysis for precise quantitative analysis. Bunseki. Kagaku. 2011, 60, 163–170. [Google Scholar] [CrossRef] [Green Version]
Figure 1. Schematic of ES mold and sampling position of ZK60 test specimen.
Metals 13 00314 g001
Figure 2. Microstructures of ZK60 alloy with different grain sizes: (a) primary extrusion shearing; (b) heating at 400 °C for 12 h; (c) heating at 430 °C for 12 h.
Metals 13 00314 g002
Figure 3. Schematic of the SHPB apparatus.
Metals 13 00314 g003
Figure 4. Initial microstructure of 3 µm specimen, 15 µm specimen and 25 µm specimen: (a,d,g) EBSD maps; (b,e,h) pole figures; (c,f,i) grain size distribution histograms.
Metals 13 00314 g004
Figure 5. (a) True stress-strain curves and (b) strain hardening curves of 3 μm specimen, 15 μm specimen and 25 μm specimen during shear deformation at a strain rate of 1700 s−1.
Metals 13 00314 g005
Figure 6. Distribution of grains conducive to the activation of tensile twinning in (a) 3 μm specimen (DR: 10.3%), (b) 15 μm specimen (DR: 9.7%) and (c) 25 μm specimen (DR: 8.6%); (d) volume fraction statistics on these grains.
Metals 13 00314 g006
Figure 7. EBSD maps, pole figure, and misorientation angle distributions of specimens at the strain rate of 1700 s−1 with (ac) 3 µm specimen (DR: 10.3%), (df) 15 µm specimen (DR: 9.7%), and (gi) 25 µm specimen (DR: 8.6%).
Metals 13 00314 g007
Figure 8. Grain boundary distribution in ZK60 alloys at the strain rate of 1700 s−1 with (a) 3 μm specimen (DR: 10.3%), (b) 15 μm specimen (DR: 9.7%) and (c) 25 μm specimen (DR: 8.6%); (d) frequency statistics on grain boundaries.
Metals 13 00314 g008
Figure 9. Distribution of Schmid factors in ZK60 alloys with different grain sizes: (ae) 3 μm specimen (DR: 10.3%); (fj) 15 μm specimen (DR: 9.7%); (ko) 25 μm specimen (DR: 8.6%).
Metals 13 00314 g009
Figure 10. SF distribution of soft orientation and hard orientation of basal slip in ZK60 alloys with different grain sizes.
Metals 13 00314 g010
Figure 11. The local misorientation distributions of ZK60 alloys at the strain rate of 1700 s−1 with different grain sizes: (a,b) 3 μm specimen (DR: 10.3%); (c,d) 15 μm specimen (DR: 9.7%); (e,f) 25 μm specimen (DR: 8.6%).
Metals 13 00314 g011
Figure 12. TEM images of ZK60 alloys with different grain sizes at the strain rate of 1700 s−1: (a) dislocation entanglement and DRX in the 3 μm specimen; (b) DRX and subgrain boundaries in the 15 μm specimen; (c) twins in cut parent grains in the 15 μm specimen; (d) deformation twins in the 25 μm specimen.
Metals 13 00314 g012
Figure 13. True stress-strain curves and fitted curves at a strain rate of 1700 s−1, and the fitting degree relative to the actual value for (a,d) 3 µm specimen; (b,e) 15 µm specimen and (c,f) 25 µm specimen.
Metals 13 00314 g013
Table 1. Calculation values of the modified J-C constitutive model.
Grain SizeParameter Names
A/MPaB1/MPaB2/MPaB3/MPaC
3 µm218.89−149.4248,447.06−267,832.587.34 × 10−6
15 µm206.06−1730.1164,634.08−313,013.639.89 × 10−6
25 µm187.05−1969.4973,198.44−387,416.251.21 × 10−6
Disclaimer/Publisher’s Note: The statements, opinions and data contained in all publications are solely those of the individual author(s) and contributor(s) and not of MDPI and/or the editor(s). MDPI and/or the editor(s) disclaim responsibility for any injury to people or property resulting from any ideas, methods, instructions or products referred to in the content.

