Abstract
This article proposes using recycled aluminum, generating hydrogen in situ at low pressure, to power a 250 W electric bicycle with a fuel cell (FC), to increase the average speed and autonomy compared to a conventional electric bicycle with a battery. To generate hydrogen, the aluminum–water reaction with a 6 M NaOH solution is used as a catalyst. This article details the parts of the generation system, the electronic configuration used, the aluminum- and reagent-loading procedure and the by-products obtained, as well as the results of the operation without pedaling, with a resistance equivalent to a flat terrain and at maximum power of the accelerator for one and two loads of about 100 g of aluminum each. This allows us to observe different hybrid strategies, with a low-capacity battery in each case. The goal is to demonstrate that it is possible to store energy in a long-lasting, transportable, low-pressure, and sustainable manner, using recycled-aluminum test tubes, and to apply this to mobility.
1. Introduction
There is currently a lot of interest in using green hydrogen [1]—that is, hydrogen produced without CO2 emissions—in FCEV vehicles [2]. To generate said hydrogen, the most used systems are those that carry out the electrolysis of water through renewable energies, although it can also be obtained from biogas or industrial processes—for example, from NH3 or methanol [3]. The problem with these systems is that they are usually carried out far from the area of consumption, and the gas, which is of very low density, must be stored and transported to the distribution points [4]. The transport of hydrogen can be carried out in trucks, in pressure tanks or cryogenized, in a liquid state, in pressure pipes, in metal hydrides (LH2) or with the hydrogenation of organic liquids (LOHC) [5] at a cost that increases depending on the distance, with LOHC having the lowest cost for distances greater than 20 km (0.0023 EUR/kg H2 km) [4]. When hydrogen is compressed and transported at high pressure, stringent safety measures must be followed, due to its flammability [6]. At the distribution point, the hydrogen must be processed, in the case of LOHC, and pressurized with tanks in cascade by means of ionic liquid or membrane compressors at a pressure above that of the vehicle’s tank of 700 bar—typically 900 bar, and with a consumption of between 2.5% and 4% of the energy loaded in the vehicle [7]. Pressure tanks inside the vehicle have a gravimetric ratio of 5.2%—that is, if they contain 5 kg of hydrogen at 700 bar, their weight is approximately 100 kg [8]. In the vehicle, the hydrogen that acts in the fuel cell works in very low-pressure conditions, between 0.5 bar and 4 bar [9], so it is not necessary to compress the gas for its operation, and it is necessary to use a pressure regulator.
One solution would be to use recycled-aluminum test tubes and water to generate hydrogen, taking advantage of the metals left over from industrial or consumer processes, since recycled aluminum is usually close to distribution areas and can be transported at low cost and safely. With these test tubes, hydrogen can be produced in situ at low pressure in low-weight reactors, and with greater safety. Another advantage is that the residue produced in the aluminum–water reaction, alumina Al(OH)3, can be transformed back into aluminum with renewable energy, and the caustic soda, NaOH, can be recovered without the need for additional energy, so it closes the cycle sustainably [10,11].
There are multiple methods to produce hydrogen with the aluminum–water reaction. One of the main drawbacks is that the reaction residue, Al(OH)3, is deposited on the aluminum surface, preventing its reaction with water [12]. There are several ways to ensure that the water continues to react with the aluminum surface [13]: (1) destroying the passivating layer, once created, so that the water reaches the surface metal; (2) avoiding the formation of the compact layer of the oxidation products so that water transport is constant; and (3) facilitating the dispersion of the metal, for example by decreasing the size of the particles, to increase the active contact surface between the metal and the reagent. The layer does not form if you work with nanoparticles [14], certain alloys [15,16] or Ga, In, Sn [17,18,19]. In these cases, the problem is that the product is more expensive, as you need to work at a certain temperature, and it precipitates solid alumina that could clog the ducts. Promoters such as oxides [20] and salts [21,22], and the small amounts of caustic-soda impurities that are created, allow the reaction to occur continuously, but a certain temperature is needed to guarantee the flow of hydrogen and alumina precipitates. Finally, with NaOH solutions with a high molarity, whose maximum flow rate is achieved with 6 M [23], the alumina layer can react and be transformed into an aqueous solution of sodium aluminate without the need to initially heat the reactor; the generated flow rate is suitable for the fuel cell, and the by-product generated is not solid, so it cannot clog the ducts and is easy to extract at the end of the reaction. Into this aqueous solution are mixed the solid impurities, which are easily separated out of the reactor afterwards by mechanical filtration. The Al(OH)3 residue is separated by a precipitate, and is of very high quality; the liquid that does not precipitate is caustic soda, which can be recycled [24].
To demonstrate that it is possible to use recycled aluminum in a sustainable way in mobility and at low pressure, a generation system has been implemented in a 250 W electric bicycle, and a maximum speed of 25 km/h adapted to the European regulation EU (2002/24/CE) [25]. Today’s electric bikes are mostly powered by batteries, and there are some hybrids with fuel cells and an auxiliary battery or supercapacitors. Those that work with a fuel cell usually store hydrogen in LH2 metal-hydride cartridges [26]. The advantage of metal cartridges is that they can store large amounts of hydrogen at low pressure, 5–12 bar, and safely, at a lower price than pressure bottles. The disadvantage is that currently, at a commercial level, they have a high cost; they need to be charged for several minutes at pressures of about 10–30 bar with pressure bottles or hydrogen generators; the volumetric density is low, especially under normal conditions; and they need to absorb heat to maintain the flow. Therefore, in the following, we will compare the two systems.
2. Experimental Section
2.1. Aluminum Test Tube, Caustic Soda and Drying Agent for Hydrogen Moisture
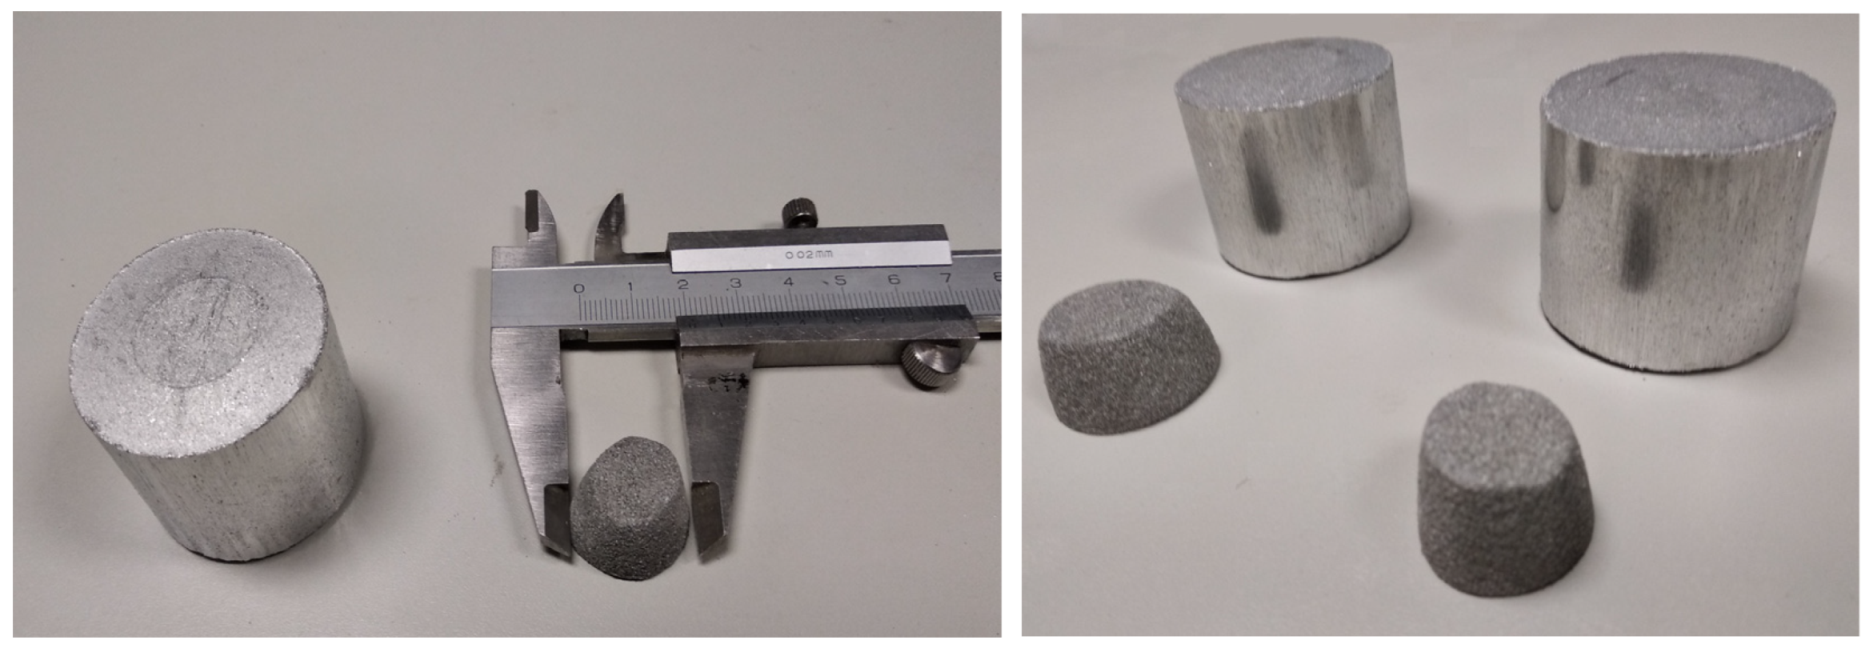
Several test tubes of recycled-aluminum powder, ground by mechanical grinding to between 0.1 and 0.8 mm thick, and pressed with the following characteristics, were used for the tests. The test tubes’ composition is analyzed in Table 1. The shape was cylindrical, as shown in Figure 1, and the weight was variable, but close to 100 g.

Table 1.
Chemical composition of the aluminum of the test tubes.
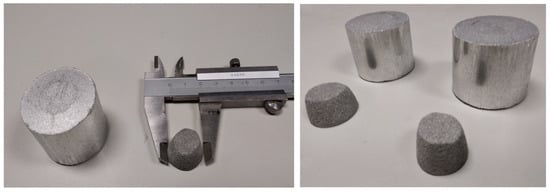
Figure 1.
Initial probe of recycled aluminum and final residue.
The dimensions of the specimen and the residues of the first and second tests are given in Table 2 and Table 3.
Table 2.
Dimensions of the aluminum test piece and the residue from the first test.
Table 3.
Dimensions of the aluminum test piece and the residue from the second test.
One liter of 6 M caustic-soda solution at 25 °C was used in the tests. Initially, 5 or 10 mL of alcohol iso-propanol was added to each reactor. The blotter used was drying-pearls silica gel with a blue moisture indicator.
2.2. Fuel cell, Auxiliary Battery and Electronic Circuits
The fuel cell used was a 300 W Horizon H-300 PEM fuel-cell stack, with an electronic control to control the inlet and outlet valves, maximum temperature, and minimum voltage. For the conditions of this article, a hybrid system with a battery could be used, while for terrain without a slope at maximum speed, a fuel cell of lower power (150 W) could be used.
The auxiliary battery used to power the fuel-cell controller, with a DC–DC buck-step-down-converter voltage regulator at 12 V, and to move the motor in the hybrid system, was a 4.4 Ah and 36 V battery, used in electric scooters.
To connect the fuel cell with the motor and with the battery in parallel, a DC/DC boost-step-up-converter voltage regulator was used, with a variable voltage between 41 and 32 V and a DC/DC buck-stepdown converter at 42 V, so as not to exceed the maximum voltage allowed by the motor and the battery. A diode was added between the circuitry and the battery.
2.3. Bicycle and Rolling Resistance
The system was assembled on a Lithium Berlin commercial bicycle from KAOS, to take advantage of the 250 W motor and the assisted-pedaling system that limits the maximum speed to 27.5 km/h when the accelerator is used. This bicycle originally had a 10.4 Ah 36 V battery, and the same test was carried out on this, to make the comparison. To simulate in the laboratory the resistance conditions of the ground on the bicycle, the bicycle was placed on a 500 W BTWIN in-ride-100 roller in position L, where resistance in the form of electrical power required was between 140 W at 27.5 km/h and 80 W at 21 km/h. As to the characteristics of the bicycle, its autonomy was set at 70 km, and it was determined, after several tests, that it approximately met the working conditions described in this article.
2.4. Assembly of the Hydrogen-Generation System from Aluminum Waste
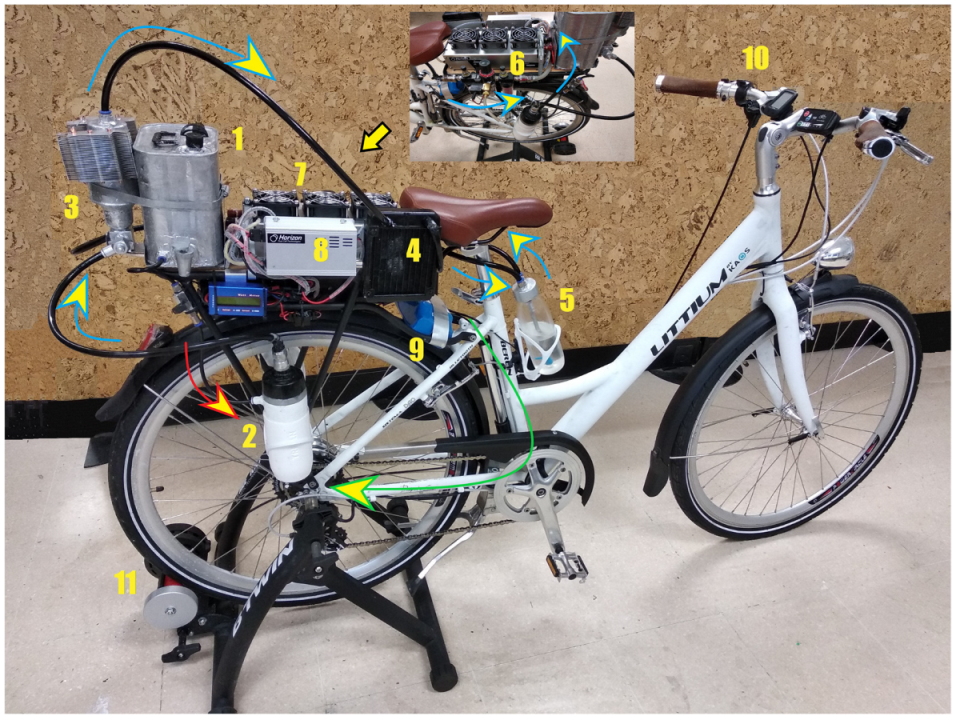
This section describes the different parts of the system, without delving into its operation. Figure 2 lists the different elements and the path taken by caustic soda (red arrow), hydrogen (blue arrow), and electricity (green arrow).

Figure 2.
First prototype, with the elements involved in the generation of hydrogen.
The caustic soda was initially introduced into the tank (1). The amount was 3 L, which allowed us to work with two test tubes or loads. The tank contained an inlet with a screw cap, a waste-collection tap, and a non-return valve. The two reactors were located on both sides of the bicycle (2) and were initially disconnected from the tank with a stopcock. The reactor was opened with a thread, and 10 mL of isopropanol alcohol and the aluminum test tube were introduced inside. These reactors are independent, so one can work with one or both. When the aluminum reacted with the caustic soda, hydrogen was created, which initially went to a condenser (3), at the entrance of which there was a non-return valve that worked independently with the two reactors. This condenser was used to condense the alcohol and water vapor generated; it had a tap to eliminate the condensate at the end of the experiment. The tank, the reactors, and the condenser must be made of AISI 304 stainless steel. The hydrogen went from the condenser to an exchanger (4) with a copper tube and aluminum fins to cool the gas. From there, the hydrogen went to a water bubbler (5) with glycerin oil. The function was to eliminate any remains of caustic soda, so that the gas could drag, and to create an aesthetic effect that gives a distinct identity to the bicycle. The gas went to some filters (6) that contain drying-pearls silica gel to eliminate moisture. The filters also had a safety-pressure regulator, calibrated at 0.5 bar, to protect the fuel cell from overpressure. It also had an initial-purging system to eliminate air from the circuit. Hydrogen entered the fuel cell (7) through an inlet valve (included in the H-300 PEM FC pack). In the fuel cell, hydrogen was converted into electricity. The fuel-cell controller, ECU (8), controlled the hydrogen inlet and outlet valves, the fans, and the system, for its protection. The auxiliary battery (9) was connected to the fuel cell in parallel with several DC/DC circuits described in Section 2.2, which allows the system to work in a hybrid way. There was also a circuit with several switches that initially regulate the system. An accelerator (10) was placed on the handlebar of the bicycle to give power to the bicycle without the need to pedal. In addition, a speedometer, voltmeters, and ammeters were included for data collection.
2.5. Operation of the Hydrogen-Generation System
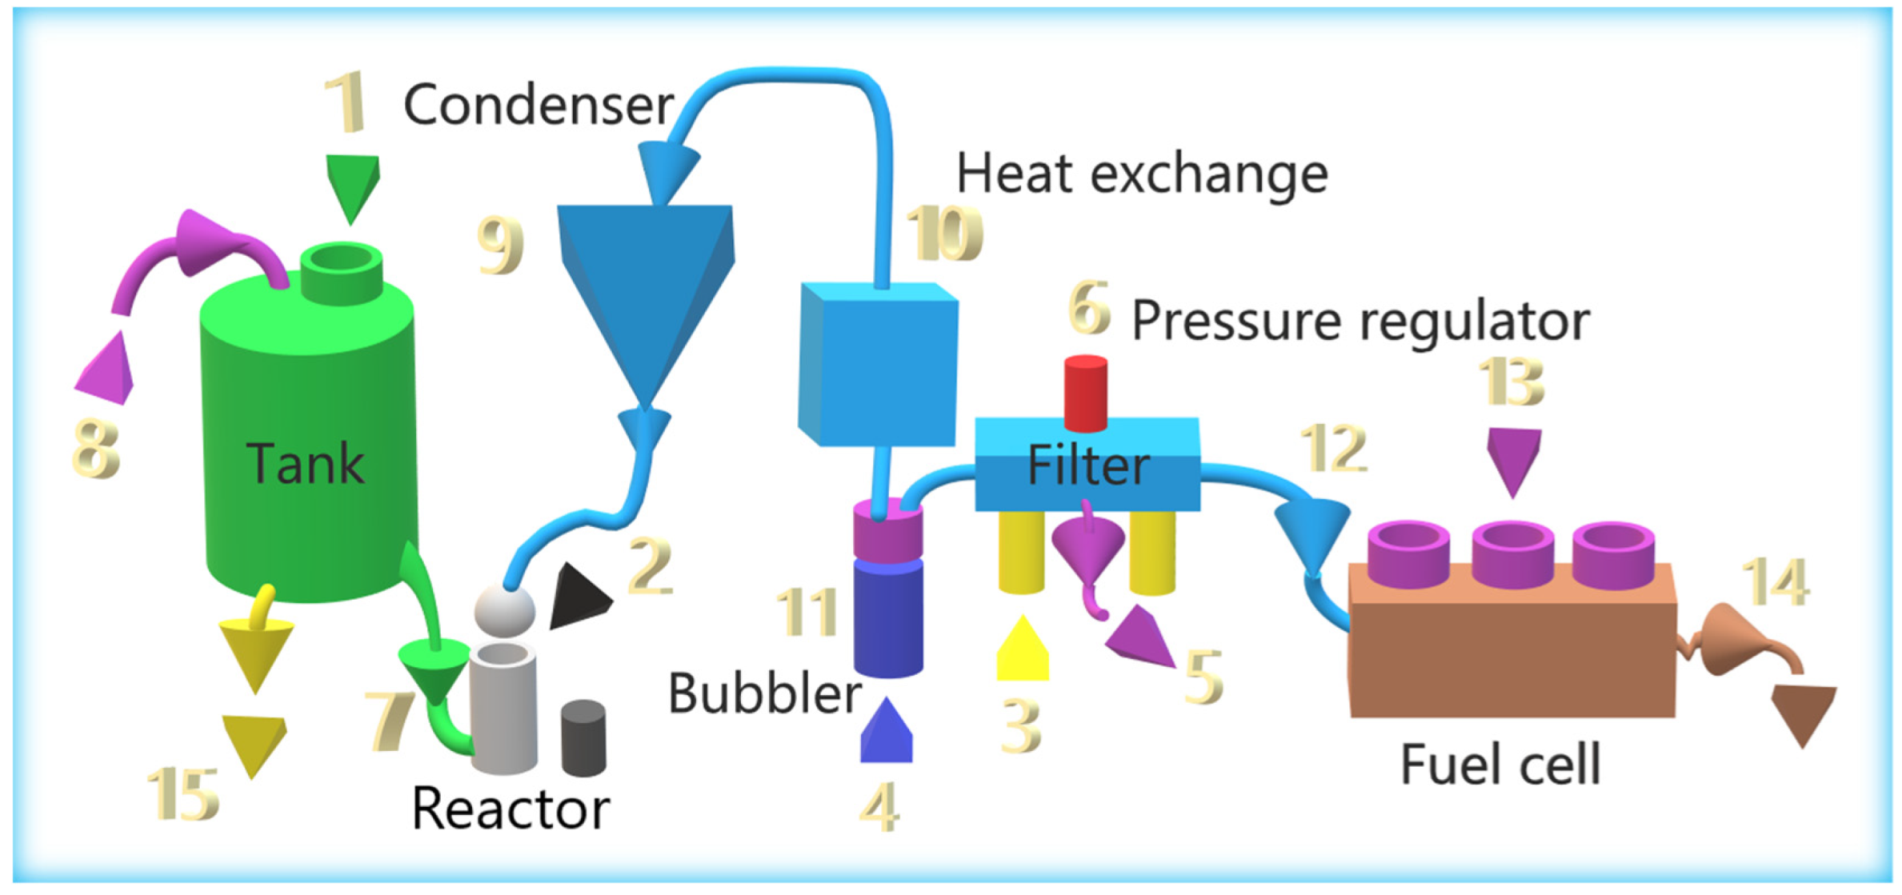
Figure 3 shows the parts of the hydrogen-generation system and the process of obtaining electrical energy through a fuel cell.
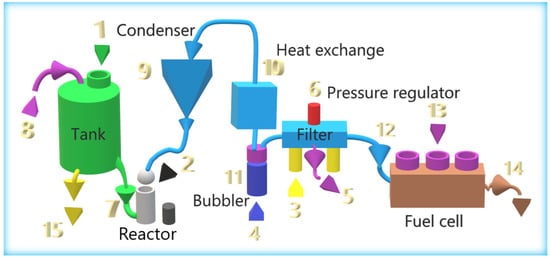
Figure 3.
Parts of the hydrogen- and electricity-generation system of the electric bicycle.
2.5.1. Loading Consumables
The steps that must be followed, as indicated in Figure 3, are the following: Fill the 3-L tank with 1 L of 6 M NaOH, and close the stopper to seal the system (1). An aluminum test tube of approximately 100 g is placed in the reactor with 10 mL of isopropyl alcohol (2), and the reactor is sealed. The filters are introduced, with drying-beads silica gel (3). Then 100 mL of distilled water and 20 mL of glycerin oil (4) are introduced into the bubbler. In the case of working with two test tubes, two reactors will be used.
2.5.2. System Initialization
The air-bleed solenoid valve (5) opens. Check that the pressure regulation system is set to 0.5 bar, to avoid overpressure in the fuel cell (6). The valve connecting the tank and the reactor is opened so that the caustic soda reacts with the aluminum test tube, and hydrogen is generated (7). The tank has a non-return valve that allows the passage of outside air, to facilitate the flow of soda (8). When the bleed system is open, the circuit is emptied of air. After a few minutes, the purge valve (5) closes; it should be checked that the purge has been carried out correctly, with a hydrogen detector.
2.5.3. Fuel-cell Power
After purging, the fuel cell can now be connected. The inlet valve (12) opens and begins to demand and consume hydrogen, to produce electricity. Hydrogen, H2 (g), is generated in the reactor by the reaction of aluminum Al (s) and caustic-soda solution NaOH(aq), generating sodium aluminate NaAl(OH)4 (aq).
The hydrogen reaches the condenser (9), where the water and alcohol are condensed. The alcohol filters the hydrogen from caustic soda. Next, the hydrogen reaches a heat exchanger (10), where it is cooled. Subsequently, the gas is purified in a bubbler, where the soda and alcohol that it may carry are dissolved in the water. The oil prevents the alcohol from spreading because, due to its low density, it creates an interface. Finally, the hydrogen reaches the fuel cell after passing through a silica-gel filter that removes moisture. In the fuel cell, it is combined with oxygen from the air (13) to produce water, electricity, and, depending on the performance of the fuel cell, heat, which will be released. At the outlet of the fuel cell there is an outlet valve (14) that allows it to purge air and water. The half reaction [27] that occurs in the FC is:
The final balance is:
Al (s) + 3 H2O (l) + 3/4 O2 (g) →3e− Al(OH)3 (s) + 3/2 H2O (v).
Depending on the amount of electricity demanded, it will consume hydrogen. If the amount of hydrogen demanded is less than that generated, then the pressure in the circuit will increase, and part of the caustic-soda solution will move from the reactor to the tank, decreasing the reaction. On the other hand, if the amount of hydrogen demanded is greater, the soda will move from the tank to the reactor, increasing the reaction. Acting as a Kipp apparatus [28], the generated hydrogen will be regulated without the need for additional energy. If the fuel cell does not work, all the soda returns to the tank, and the reaction stops.
2.5.4. Hybrid-System Operation
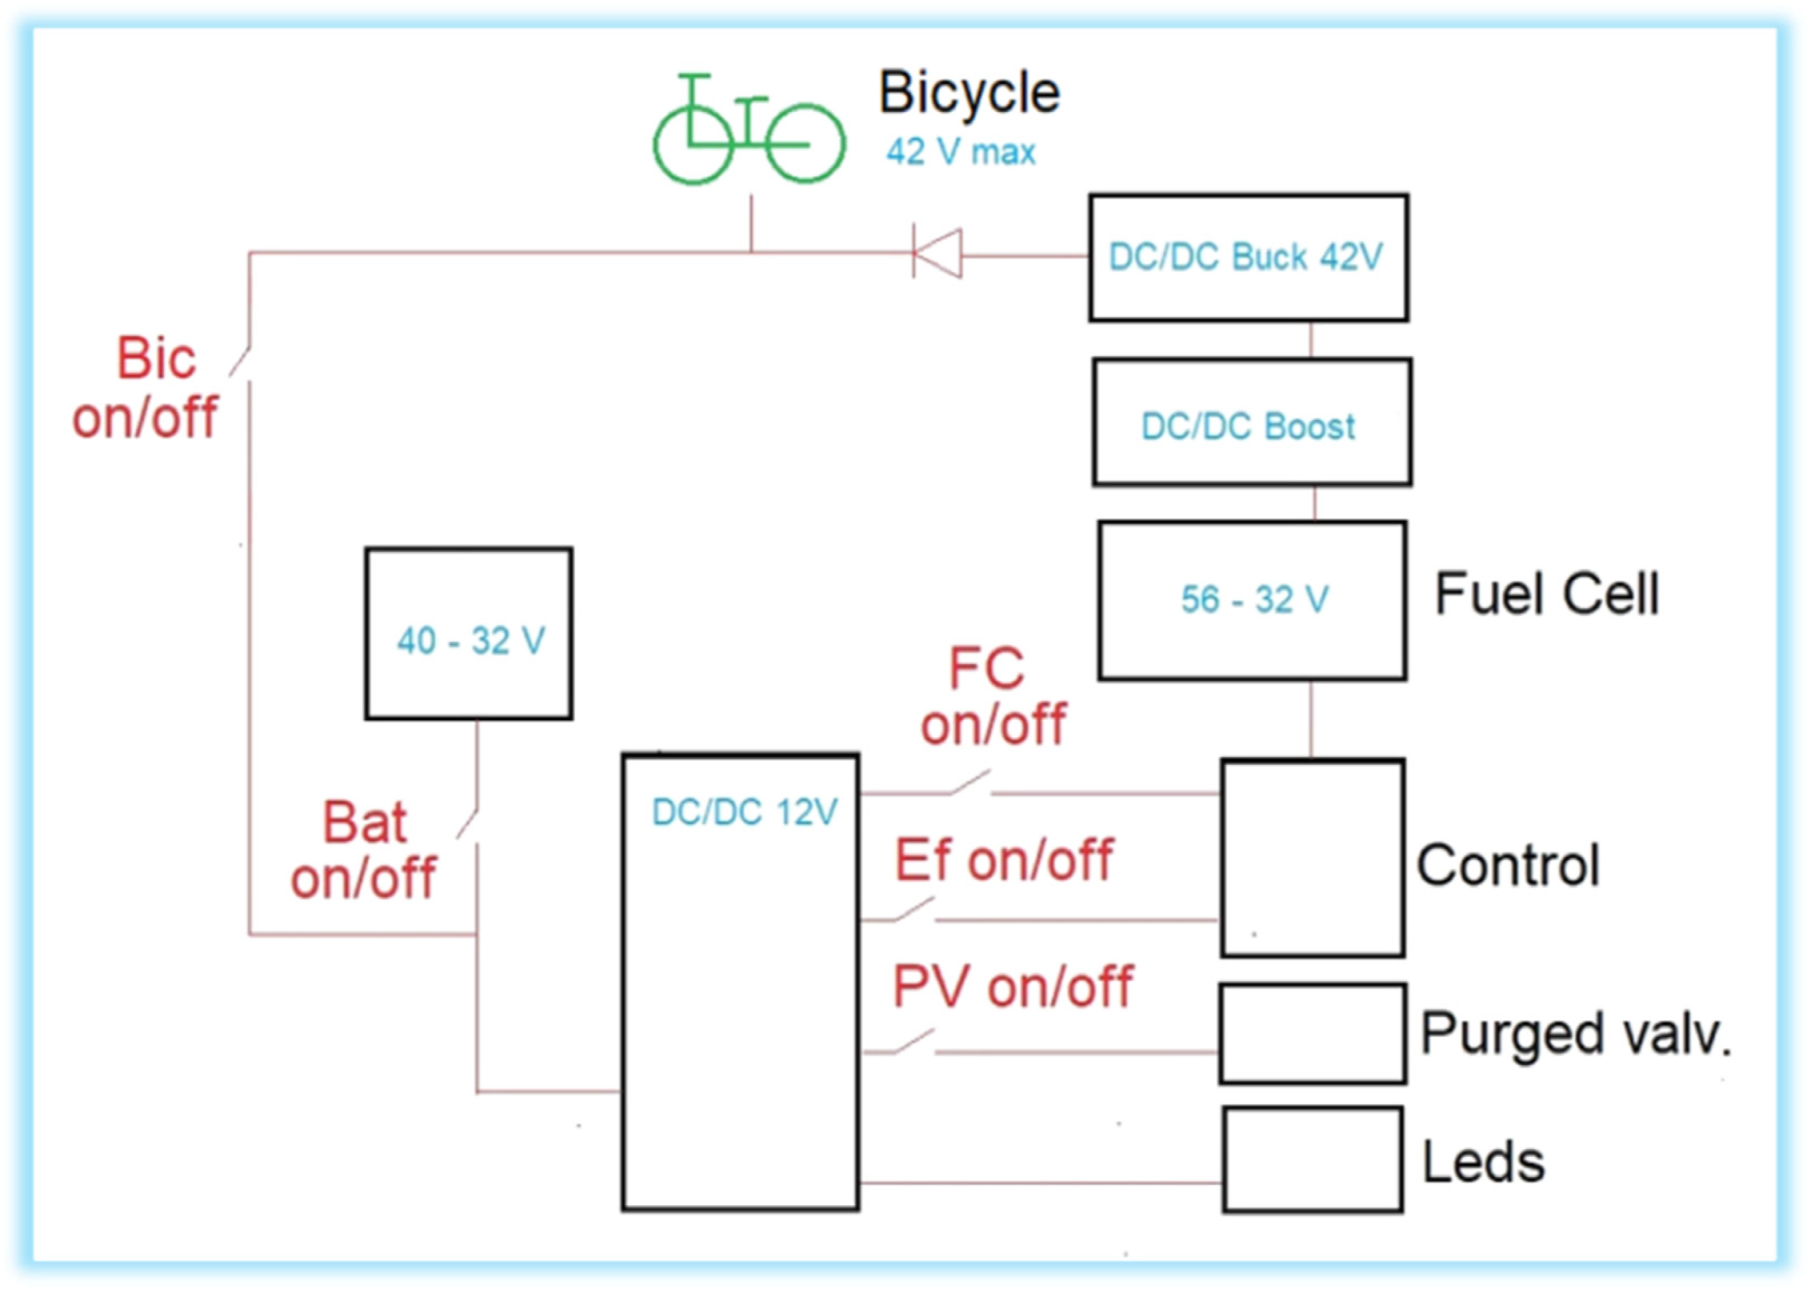
The fuel cell and auxiliary battery work in a hybrid way, as shown in Figure 4. If the bicycle is running, both contribute power to the motor, regulating the percentage of said contribution from Boost [29] with the minimum voltage setting given by the battery; to work properly, this voltage must be variable [30,31]. In this case, the auxiliary battery also provides an average of 8.2 W of power to feed the FC controller. When the bike is stationary or the energy required is small, such as in the case of pedaling by the user or when speed conditions are low, the fuel cell recharges the battery and powers its controller. This research assumes that there is full throttle throughout the experiment, so the battery will not be charged.
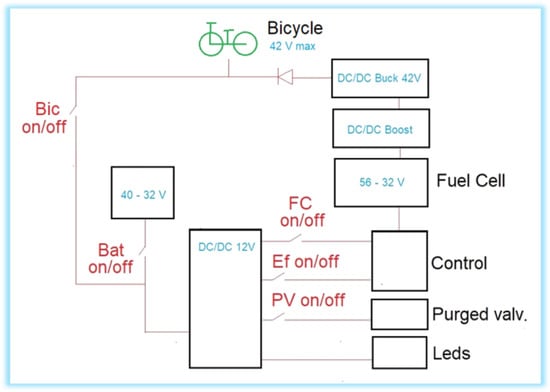
Figure 4.
Single-line diagram of the electrical circuit of the electric bicycle.
There are also warning LEDs in the system. When the battery is connected, some blue LEDs light up on the luggage rack and on the bubbler. These are kept on throughout the journey. When the system is purging, some red LEDs on the luggage rack light up, which must be turned off during the journey, since only the circuit is purged initially. When power arrives from the battery (Bic on) or from the fuel cell (FC on), the front and rear lights of the bicycle turn on.
3. Assays and Methodology Used in Tests
3.1. General Methodology
The same general methodology was used in all trials, so that the results were comparable. During the tests, the bicycle was anchored on its rear axle to the roller, so the weight did not influence the results. Therefore, the first hypothesis was that the weight would be the same on the HR bike and the battery bike. The rehearsal was without a cyclist and there was no pedaling. The same resistance conditions were used: position L of the 500 W BTWIN in-ride-100 roller, with a tire-inflation pressure of 4 bar.
The test started when the system was already in working condition. In the case of the FC, when the tank was full the reactor was already loaded and working, the circuit was purged, and the hydrogen had reached the FC. This process usually takes about 5 min when the batteries are fully charged.
Initially, the bicycle was started, and the accelerator was placed at the maximum point. From this moment on, data on speed and distance traveled were collected with a BTWIN 500 speedometer. During the test, the voltage and currents supplied by the battery and the FC at the input of the bicycle, just at the input of the controller, were measured. It must be considered that, after this, power must be supplied to the motor, but also to the lights and the integrated circuits of the bicycle, which represents approximately 5 W.
When the bike stopped, the test ended, even though the battery was in the red zone, where it might be working at a capacity of less than 20%. At the end of the test, the reactors were opened, and the residues were removed to be cleaned, dried, measured, and weighed. These residues could be used for another test because they contained aluminum.
3.2. Battery Tests
A test was carried out with only the original 10.4 Ah 36 V battery of the bicycle and with only the 4.4 Ah 36 V auxiliary battery that we will use in the hybrid system with the FC, to make the comparison later. In both cases, no diode was used.
3.3. Test with a Single Reactor and Hybrid FC System and 4.4 A hAuxiliary Battery
In this test, a test tube with the characteristics indicated in Table 2 was used. The test tube was placed in one of the reactors and the other was left empty. In this configuration, the flow of hydrogen generated was not enough for the FC to supply the necessary power to the bicycle, so in the hybrid FC + 4.4 Ah battery system, the FC provided additional power, to try to maintain constant voltage. Therefore, the minimum voltage in the boost was small, so that the contribution of the battery was greater. To optimize the system, it is recommended that the voltage be adjusted proportionally to the battery voltage.
3.4. Test with Two Reactors and Hybrid FC System and 4.4 Ah Auxiliary Battery
Two test tubes with the characteristics indicated in Table 2 were used in the test. Test tubes were placed in one of the two reactors. In this configuration, the flow of hydrogen generated was sufficient for the FC to supply the necessary power to the bicycle, so in the hybrid FC + 4.4 Ah battery system, the FC provided most of the power, which was complemented by that from the battery. Therefore, the minimum voltage in the boost was higher, so that the contribution of the FC was greater than that of the battery. To optimize the system, it is recommended that the voltage be adjusted proportionally over time, due to the decrease in the active surface of the aluminum and therefore the flow of hydrogen delivered.
4. Results and Discussion
4.1. Results with a Single Reactor and Hybrid FC System and 4.4 Ah Auxiliary Battery
The maximum theoretical flow of hydrogen that the test tube can deliver depends on its mass, the active surface, the molarity of the NaOH solution, and the temperature. Since the specimen is made of pressed powder, its active surface is difficult to determine, because its active surface is different from how it would be if it were totally solid, as can be seen in Figure 5, and it also decreases over time. In addition, the temperature of the reactor and the liquid that is in the reactor at each moment are variable.
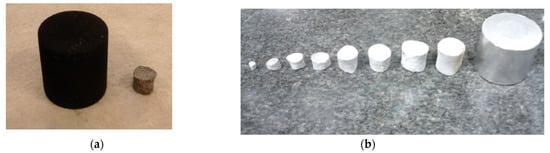
Figure 5.
(a) Comparison between the residue of a totally solid specimen and that of pressed powder after approximately 2 h in a 6 M solution at 60 °C (0.015 mm/min surface [24]). (b) Evolution of a pressed-powder specimen fully submerged in a 6 M solution at 60 °C.
The mass of aluminum used was the initial 111.4 g minus the final residue of 10 g (see Table 2). The purity of the recycled aluminum, 97%, must be considered. Therefore, the mass of aluminum used was 98.4 g. The reaction time was 2.07 h. The theoretical yield of hydrogen according to Equation (1) was 10.9 g.
Since the density of hydrogen is 0.0893 g/L at room temperature (25 °C), the total volume of theoretical hydrogen generated was 123.43 L. The reaction time was 2.07 h. Therefore, the average flow was:
The manufacturer’s specifications for the FC H-300 indicate a consumption of 3.9 L/min (234 L/h) of H2 for a power of 300 W, so the power obtained based on the flow rate supplied will be proportional. Therefore, the theoretical average power of the FC would be 76.3 W. This theoretical power is lower than what the bicycle needs in these conditions, which is between 140 and 80 W, so the FC needs the battery throughout the trial.
The voltage supplied by the FC is subject to the critical voltage, below which the cells could be damaged due to an excessive increase in the current supplied. This voltage is approximately 32 V, and the FC controller will disconnect the circuit whenever it is less than this value. Therefore, the circuit must be calculated so that this does not happen. The circuit, shown in Figure 4, consists of the FC, which can be represented as a voltage source and an internal resistance in series [32] connected to a Boost-type voltage regulator [33], a diode, a battery in parallel, and the circuit of the bicycle in parallel. The Boost gain will be optimized to maximize the intensity delivered by the HR. However, the input voltage is never less than 32 V. In this way, the relationship between the voltage delivered by the FC and by the battery is stabilized. In this case, the FC gives more intensity when the battery voltage is lower.
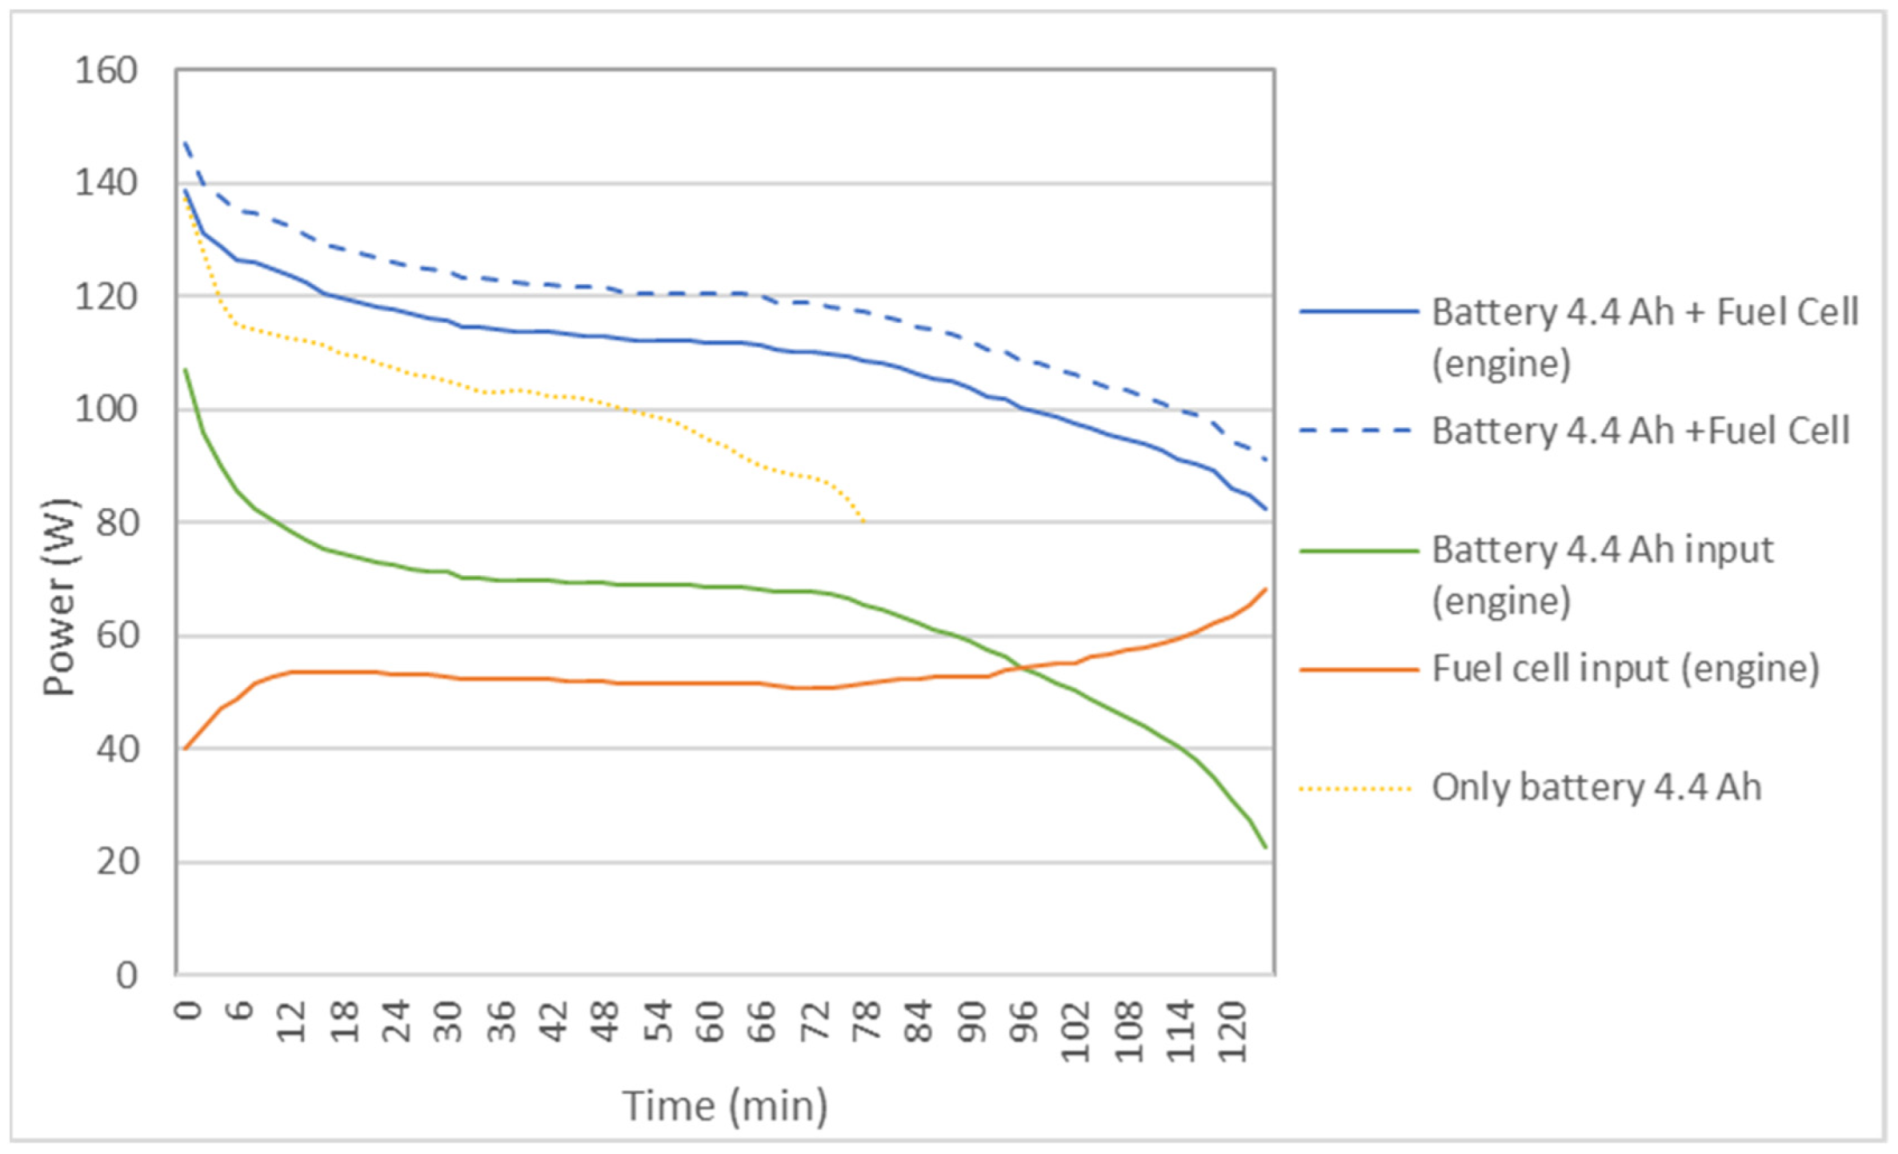
Figure 6 shows the results of the power delivered to the bicycle by the battery separately (only battery: 4.4 Ah) and by the hybrid system with FC and a reactor (battery: 4.4 Ah + fuel cell). The power supplied to the bike by the battery and by the FC is also shown. It is observed that in the auxiliary battery the power decreases rapidly over time, while in the hybrid system it is more constant, especially in the first sections.
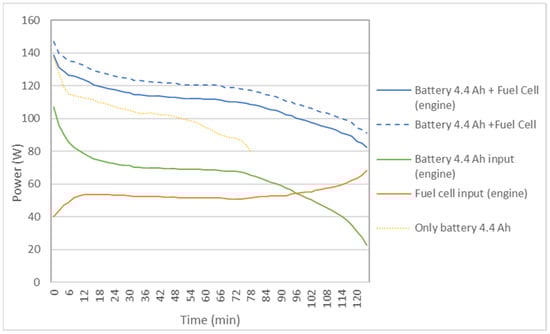
Figure 6.
Comparison of the power delivered to the bicycle by the 4.4 Ah auxiliary battery, acting alone or in a hybrid way with the FC, in the case of a reactor.
In the hybrid system, as seen in Table 4, there is an increase in average speed, operating time, and autonomy compared to a single battery of 4.4 Ah.
Table 4.
Comparison of results between batteries and the hybrid system with FC.
The equivalent capacity (Wh) can be calculated from the sum of the product of the current and the average voltage in n intervals of 1 min divided by 60. The theoretical equivalent capacity is 157.9 Wh.
The equivalent capacity is also higher in the hybrid system, with the amount delivered to the bicycle being 226.1 Wh. The total, 243.1 Wh, would be the sum of what is delivered to the bicycle plus what feeds the FC control. Comparing this system with a bicycle and FC with the same characteristics working with a 200-L metal-hydride cartridge, it is observed, in Table 4, that the behavior is like that described in present research although the operating time is longer in this article (160 min) [26].
The average power generated by the FC in Figure 5 is 53.4 W, which, multiplied by the operating time of 2.07 h, gives an equivalent capacity of 110.3 Wh. According to the manufacturer, for an average flow rate of 1 L/min H2, the FC could generate 76.3 W, but since 53.4 W is generated, we deduce that the performance of the REACTOR-FC-DC/DC-DIODO generation system is 70%. The auxiliary battery used has a performance of 83% between the theoretical capacity (4.4 Ah, 36 V) of 158.4 Wh and the actual capacity of 132.1 Wh.
4.2. Results with Two Reactors and FC Hybrid System (4.4 Ah Auxiliary Battery)
The theoretical total volume of hydrogen can be calculated analogously to the previous section. The aluminum mass used will be the initial 108 g and 109 g, minus the final residues of 14.8 g and 12.5 g, respectively (see Table 2). The purity of the recycled aluminum must be considered, and is 97%, so the mass of aluminum used will be 184 g. The total volume of theoretical hydrogen generated is 230.9 L; see Equation (4). Since the total operating time is 2.67 h, the average flow according to Equation (5) is 1.44 L/min. According to the manufacturer, in theory, for an average flow rate of 1.44 L/min H2, the FC could generate 110.77 W. This average power is necessary for the working conditions of the bicycle, so the intensity supplied will be greater than that given by the auxiliary battery, since the FC output voltage is greater than 32 V.
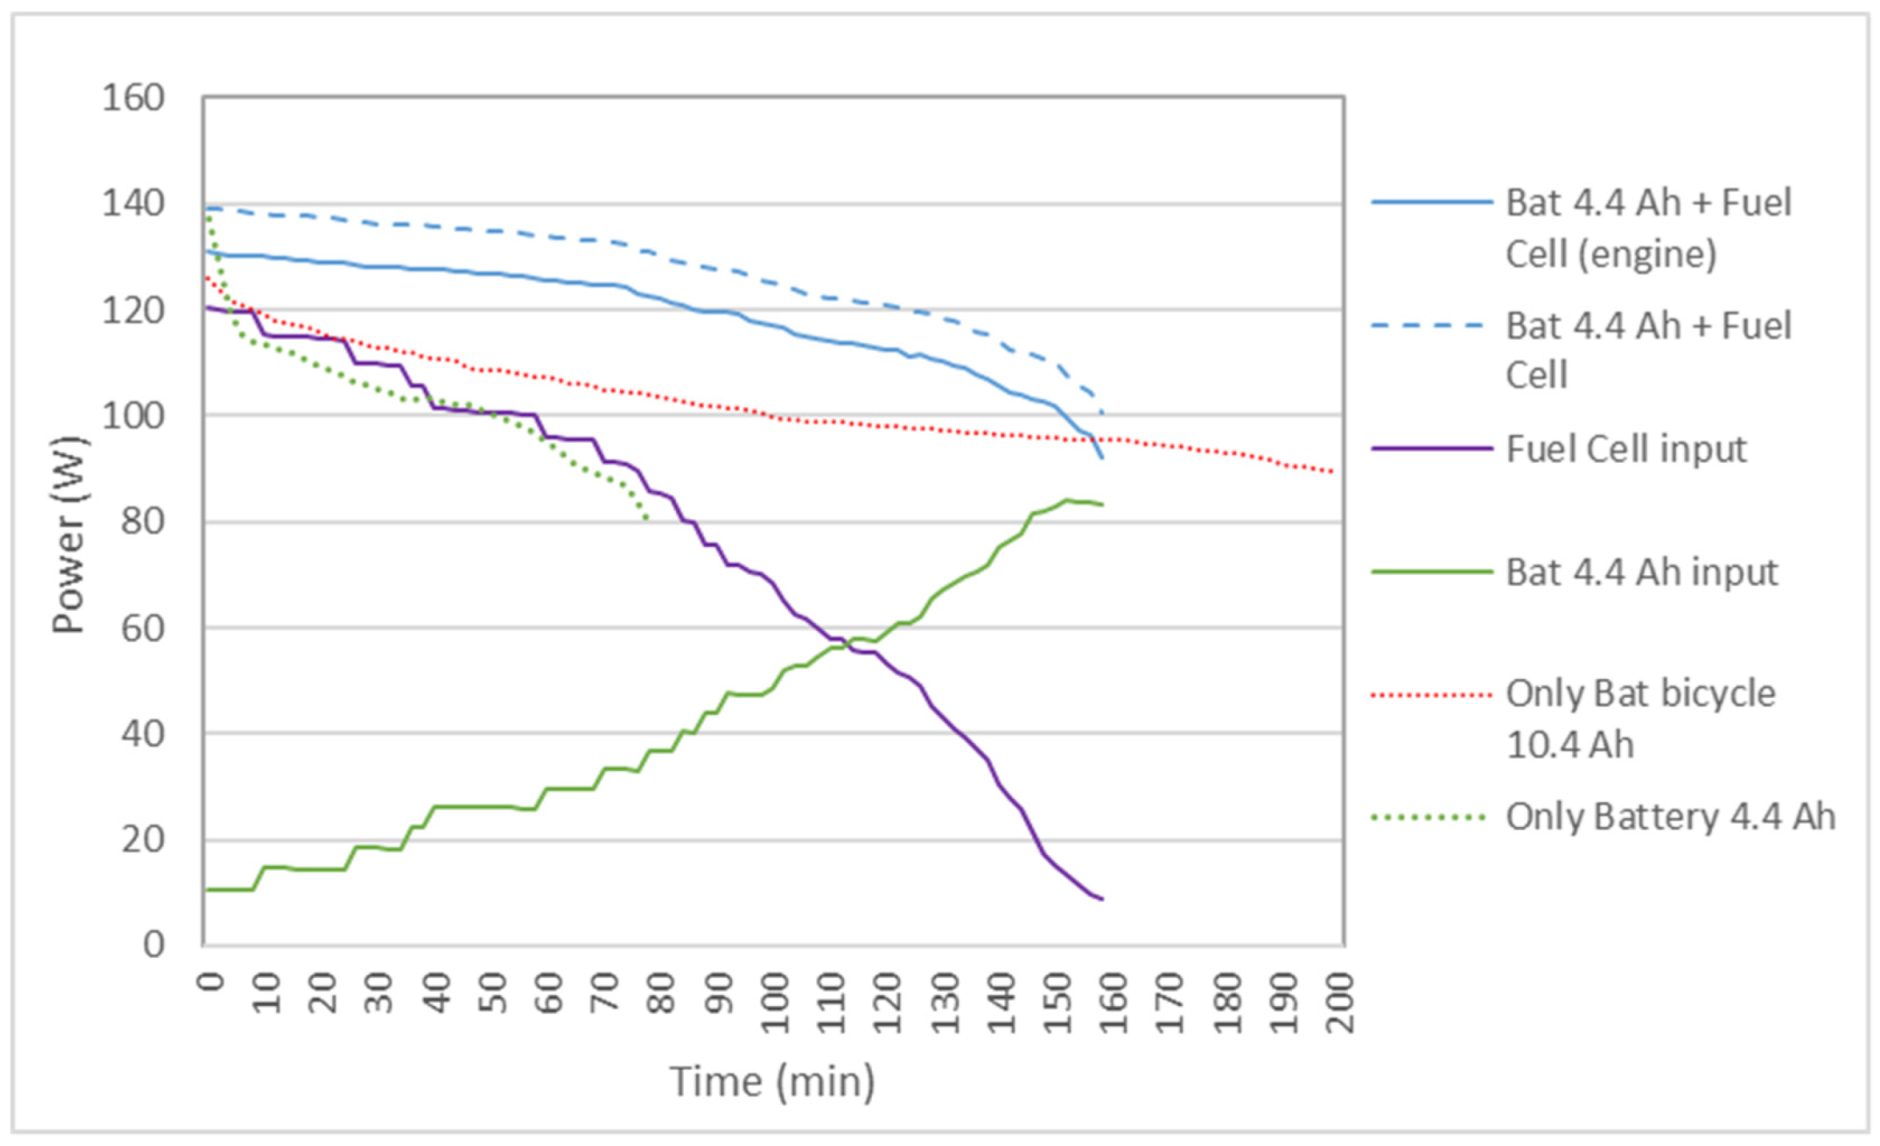
Figure 7 shows the results of the power delivered to the bicycle by the 4.4 Ah battery and the original 10.4 Ah bicycle battery, as well as the 4.4 Ah battery + FC hybrid system. It is observed that, in the hybrid system, the power is greater than with the batteries separately, so the speed of the bicycle is maintained for a longer distance above the maximum speed allowed in some countries, which is 25 km/h, as shown in Figure 8. It is also observed that the voltage during the journey is higher in the hybrid system. Although in Table 4 the battery autonomy of 10.4 Ah is greater than the hybrid system, it must be understood that, in the hybrid cycle at the end of the cycle, the reactors can be recharged with new test tubes and can continue the journey.
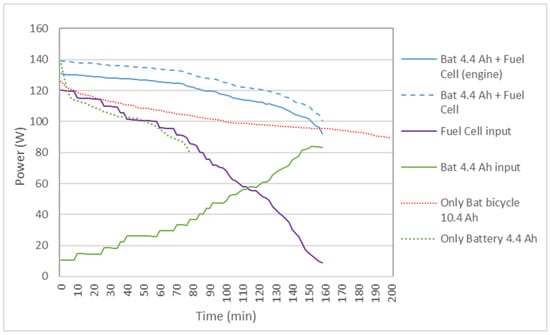
Figure 7.
Comparison of the power delivered to the bicycle by the 4.4 Ah auxiliary battery and the 10.4 Ah battery acting alone, or the 4.4 Ah FC-battery hybrid system in the case of two reactors.
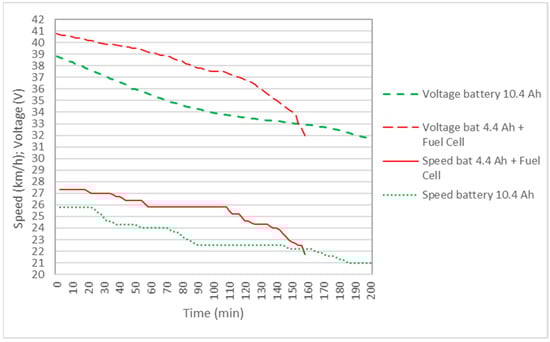
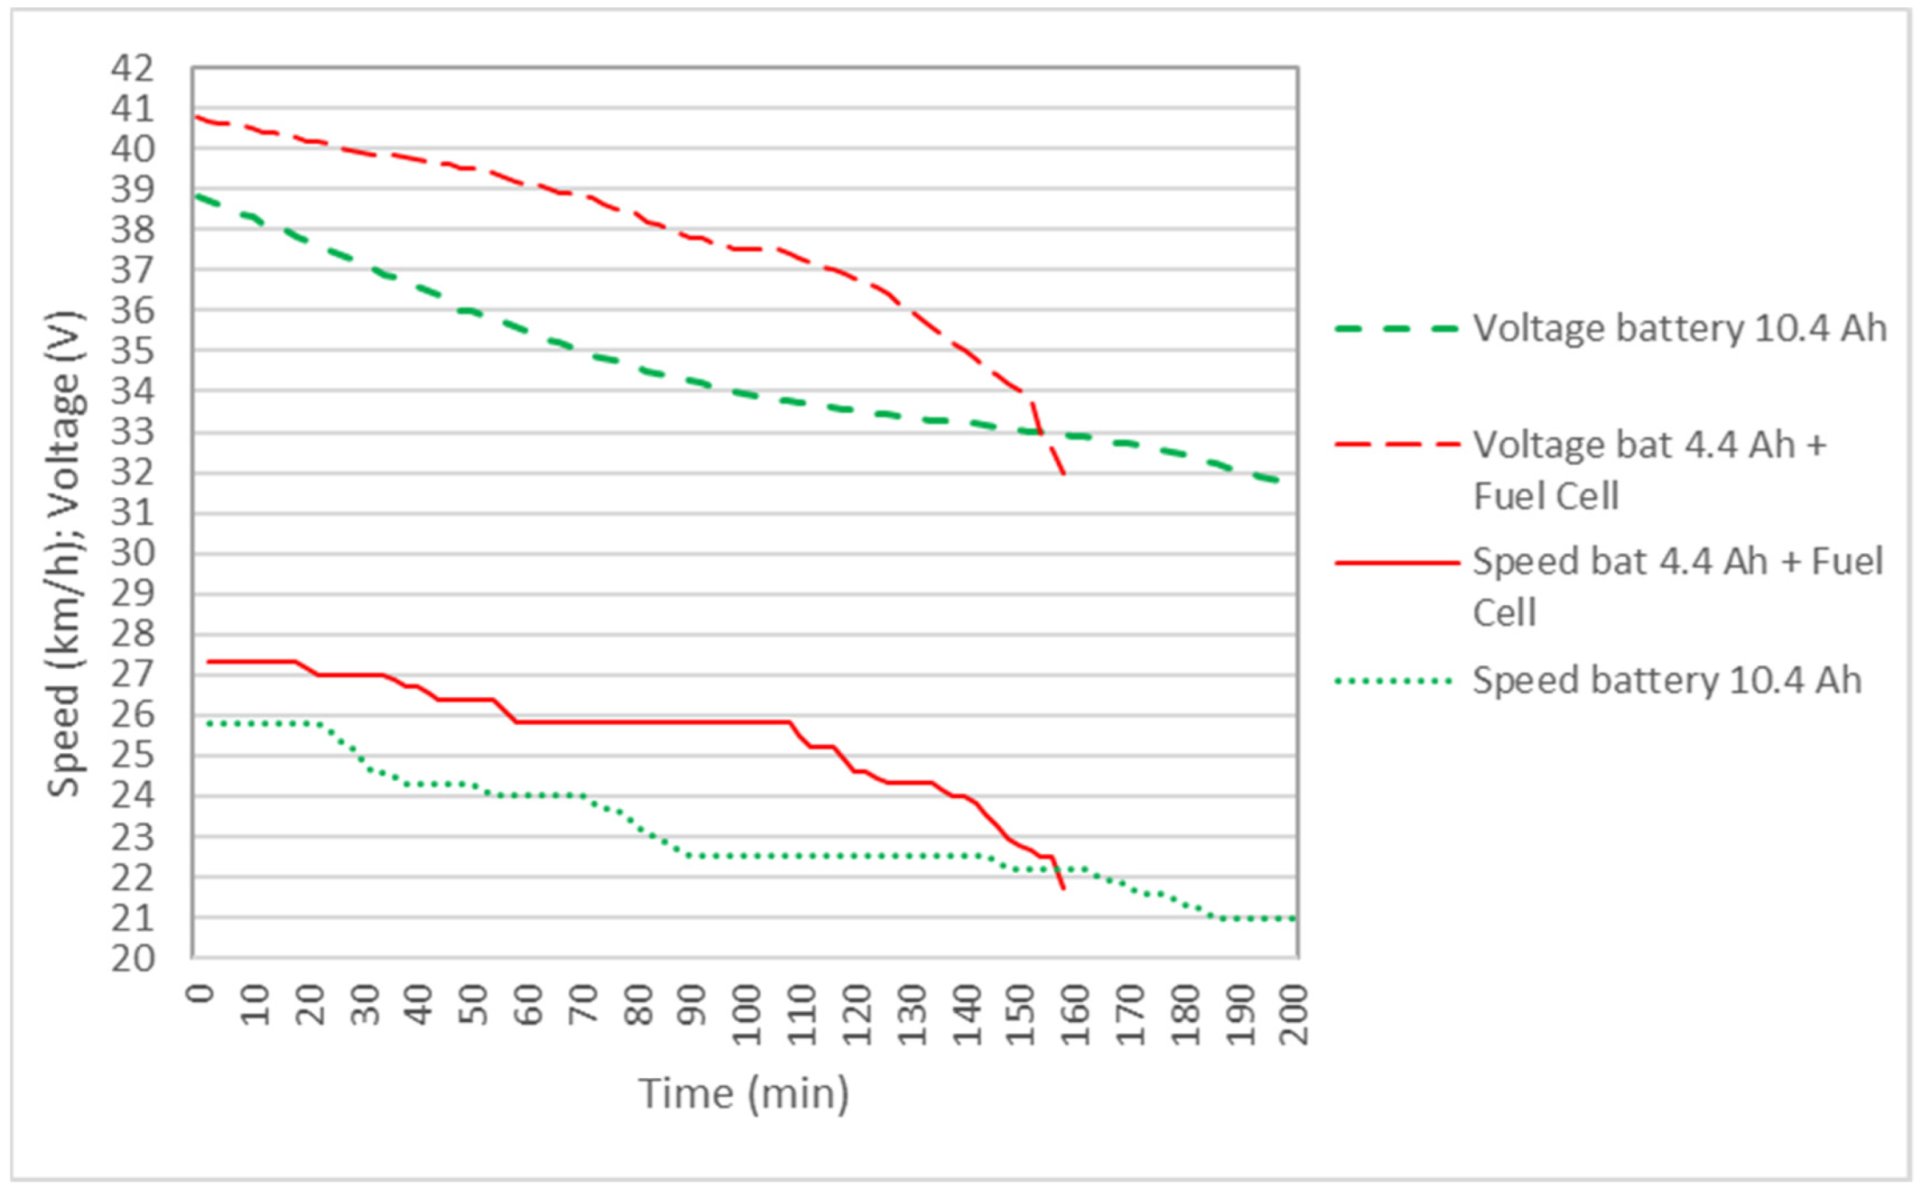
Figure 8.
Comparison of motor voltage and bicycle speed for the 10.4 Ah battery and the 4.4 Ah battery + fuel-cell hybrid system in the case of two reactors.
The problem is that the probe decreases in size, as can be seen in Figure 5, as well as the active surface and, therefore, the flow rate and the power delivered. Therefore, the current delivered by the battery increases over time. The stabilization of the current delivered by the FC and the battery is given by the regulation and optimization of the Boost.
4.3. Advantages, Problems and Improvements related to the Electric-Bicycle System with Aluminum Waste
The main advantage of this system is being able to use the FC with a very low-pressure hydrogen-generation system, without the need for chargers and at a very low cost. Another advantage is that the autonomy of the bicycle can be increased by recharging the test tubes once they are spent, and that the speed remains stable. Finally, waste can be converted into new aluminum through renewable energy, and caustic soda can be recovered in a totally sustainable cycle. This system is ideal if one uses the bicycle in economy mode, so that the necessary power is small, thanks to the user’s pedaling, and stops along the way, due to traffic lights, for example, since the test tubes will wear out less and stops will be used to charge the battery. However, there are several problems that have been encountered in conducting the trials and analyzing the results.
The first problem was with the hybrid system itself since the fuel cell and its control depend directly on the battery. It would be more convenient to use supercapacitors to make the fuel cell self-sufficient. The advantage of this system is that, when the aluminum test tubes break down, they can be replaced by others, changing the liquid, and continuing the journey, thus increasing the autonomy of the bicycle. However, when the batteries run down this would be impossible, and charging the batteries with the fuel cell takes too much time.
Another drawback that has been found is that the system has reduced dimensions to work at flow rates greater than those of the experiment, since the liquid from the reactor can be dragged beyond the condenser. Another problem is that on a bicycle an anti-tip system is needed to stop the reactor in the event of a fall from the bicycle.
Finally, the safety of the system must be increased since, although pressurized hydrogen is not generated, which reduces the risk of explosion, caustic soda can cause redness and burning of the skin, so measures must be taken to avoid contact with the user.
From the user’s point of view, this should make the system much easier to use. One way would be through cartridges containing caustic soda and aluminum test tubes that could be easily put on and taken off. Longer-duration filters could be studied. A loss of hydrogen production has been detected, due to a gradual decrease in the active surface. This problem could be solved by using smaller test tubes in the form of tablets.
5. Conclusions
It has been shown that it is possible to use recycled aluminum to generate green hydrogen in vehicles, in a simple way and avoiding accumulations of pressurized gas. Regarding the battery system, the hybrid system with FC increases the power delivered and allows one to maintain constant voltage and speed. In the same way, the autonomy of the vehicle can be increased by replacing the test tubes and the liquid and saving the liquid waste generated to regenerate the aluminum and caustic soda in a sustainable way. The equivalent capacity in the system studied from the fuel cell is 112 Wh for every 100 g of pure aluminum and 700 mL of 6 M NaOH solution; this allows the reactor to be designed based on the power demand. Theoretically, the equivalent capacity obtained should be higher, since for every 100 g of aluminum, 220 Wh should be obtained. The purging system and the FC-power control should certainly be improved, and the auxiliary battery should be replaced by supercapacitors. Another aspect to improve is an increased volume of the reactor and a resizing of the test tubes, since a decrease in power is observed over time, due to a change in the active surface of the test tubes.
Author Contributions
X.S.B.: conceptualization, methodology, formal analysis, supervision, project administration, funding acquisition. M.M.-G.: software, validation, visualization, writing—original draft preparation, writing—review & editing; J.M.D.-M.: investigation, resources, data curation. All authors have read and agreed to the published version of the manuscript.
Funding
This research received no external funding.
Acknowledgments
We thank the company UPRA S.L for the support received.
Conflicts of Interest
The authors declare no conflict of interest.
References
- Barbara, W. Renewable Hydrogen implementations for combined energy storage, transportation, and stationary application. Therm. Sci. Eng. Prog. 2020, 16, 100460. [Google Scholar]
- Li, Y.; Taghizadeh-Hesary, F. The economic feasibility of green hydrogen and fuel cell electric vehicles for road transport in China. Energy Policy 2022, 160, 112703. [Google Scholar] [CrossRef]
- Ahmed IOsman Neha Mehta Ahmed, M.E. Hydrogen production, storage, utilisation and environmental impacts: A review. Environ. Chem. Lett. 2022, 20, 153–188. [Google Scholar]
- Song, P.; Sui, Y.; Shan, T.; Hou, J.; Wang, X. Assessment of hydrogen supply solutions for hydrogen fueling station: A Shanghai case study. Int. J. Hydrogen Energy 2020, 45, 32884–32898. [Google Scholar] [CrossRef]
- Jorschick, H.; Preuster, P.; Bösmann, A.; Wasserscheid, P. Hydrogenation of aromatic and heteroaromatic compounds—A key process for future logistics of green hydrogen using Liquid Organic Hydrogen Carrier systems. Sustain. Energy Fuels 2021, 5, 1311–1346. [Google Scholar] [CrossRef]
- Jeon, J.; Kim, S.J. Recent Progress in Hydrogen Flammability Prediction for the Safe Energy Systems. Energies 2020, 13, 6263. [Google Scholar] [CrossRef]
- Rothuizen, E.; Rokni, M. Optimization of the overall energy consumption in cascade fueling stations for hydrogen vehicles. Int. J. Hydrogen Energy 2014, 39, 582–592. [Google Scholar] [CrossRef]
- Durbin, D.J.; Malardier-Jugroot, C. Review of hydrogen storage techniques for on board vehicle applications. Int. J. Hydrogen Energy 2013, 38, 14595–14617. [Google Scholar] [CrossRef]
- Hoeflinger, J.; Hofmann, P. Air mass flow and pressure optimisation of a PEM fuel cell range extender system. Int. J. Hydrogen Energy 2020, 45, 29246–29258. [Google Scholar] [CrossRef]
- Wang, H.Z.; Leung, D.Y.C. A review on hydrogen production using aluminum and aluminum alloys. Renew. Sustain. Energy Rev. 2009, 13, 845–853. [Google Scholar] [CrossRef]
- Xu, S.; Yang, X.-H.; Tang, S.-S.; Liu, J. Liquid metal activated hydrogen production from waste aluminum for power supply and its life cycle assessment. Int. J. Hydrogen Energy 2019, 44, 17505–17514. [Google Scholar] [CrossRef]
- Teng, H.-T.; Lee, T.-Y.; Chen, Y.-K.; Wang, H.-W.; Cao, G. Effect of Al(OH)3 on the hydrogen generation of aluminum-water system. J. Power Sources 2012, 219, 16–21. [Google Scholar] [CrossRef]
- Shaytura, N.S.; Laritchev, M.N.; Laritcheva, O.O.; Shkolnikov, E.I. Study of texture of hydroxides formed by aluminum oxidation with liquid water at various activation techniques. Curr. Appl. Phys. J. 2010, 10, S66–S68. [Google Scholar] [CrossRef]
- Hu, H.; Qiao, M.; Pei, Y.; Fan, K.; Li, H.; Zong, B.; Zhang, X. Kinetics of hydrogen evolution in alkali leaching of rapidly quenched Ni–Al alloy. Appl. Catal. A Gen. 2003, 252, 173–183. [Google Scholar] [CrossRef]
- Woodall, J.M.; Ziebarth, J.T.; Allen, C.R.; Jeon, J.; Choi, G.; Kramer, R. Generating hydrogen on demand by splitting water with Al rich alloys. Clean Technol. 2008, 5, 313–315. [Google Scholar]
- Fan, M.-Q.; Xu, F.; Sun, L.-X. Studies on hydrogen generation characteristics of hydrolysis of the ball milling Al-based materials in pure water. Int. J. Hydrogen Energy 2007, 32, 2809–2815. [Google Scholar] [CrossRef]
- Lin, Y.; Genzer, J.; Dickey, M.D. Attributes, Fabrication and Applications of Gallium-Based Liquid Metal Particles. Adv. Sci. 2020, 7, 2000192. [Google Scholar] [CrossRef]
- Tan, S.-C.; Gui, H.; Yang, X.-H.; Yuan, B.; Zhan, S.-H.; Liu, J. Comparative study on activation of aluminum with four liquid metals to generate hydrogen in alkaline solution. Int. J. Hydrogen Energy 2016, 41, 22663–22667. [Google Scholar] [CrossRef]
- Yuan, B.; Tan, S.; Liu, J. Dynamic hydrogen generation phenomenon of aluminum fed liquid phase Ga–In alloy inside NaOH electrolyte. Int. J. Hydrogen Energy 2016, 41, 1453–1459. [Google Scholar] [CrossRef]
- Petrovic, J.; Thomas, G. Reaction of Aluminum with Water to Produce Hydrogen. In A Study of Issues Related to the Use of Aluminum for On-Board Vehicular Hydrogen Storage; U.S. Department of Energy: Washington, DC, USA, 2008. [Google Scholar]
- Macanás, J.; Soler, L.; Candela, A.M.; Muñoz, M.; Casado, J. Hydrogen generation by aluminium corrosion in aqueous alkaline solutions of inorganic promoters. The Alhydrox process. Energy 2011, 36, 2493–2501. [Google Scholar] [CrossRef]
- Fan, M.-Q.; Xu, F.; Sun, L.-X.; Zhao, J.-N.; Jiang, T.; Li, W.-X. Hydrolysis of ball milling Al–Bi–hydride and Al–Bi–salt mixture for hydrogen generation. J. Alloy. Compd. 2008, 460, 125–129. [Google Scholar] [CrossRef]
- Parmuzina, A.V.; Kravchenko, O.V.; Bulychev, B.M.; Shkolnikov, E.I.; Burlakova, A.G. Oxidation of activated aluminium with water as a method for hydrogen generation. Russ. Chem. Bull. 2009, 58, 493–498. [Google Scholar] [CrossRef]
- Salueña-Berna, X.; Marín-Genescà, M.; Massagués Vidal, L.; Dagà-Monmany, J.M. Waste Aluminum Application as Energy Valorization for Hydrogen Fuel Cells for Mobile Low Power Machines Applications. Materials 2021, 14, 7323. [Google Scholar] [CrossRef] [PubMed]
- Available online: Eur-lex.europa.eu/LexUriServ/LexUriServ.do?uri=CONSLEG:2002L0024:20070101:EN:PDF (accessed on 15 December 2022).
- Hung, N.B.; Lim, O. A review of history, development, design and research of electric bicycles. Appl. Energy 2020, 260, 114323. [Google Scholar] [CrossRef]
- Moreira, M.V.; da Silva, G.E. A practical model for evaluating the performance of proton exchange membrane fuel cells. Renew. Energy 2009, 34, 1734–1741. [Google Scholar] [CrossRef]
- Najdoski, M. Gas Chemistry: A Microscale Kipp Apparatus. Chem. Educ. 2011, 16, 295–298. [Google Scholar]
- Kabalo, M.; Blunier, B.; Bouquain, D.; Miraoui, A. State-of-the-art of DC-DC converters for fuel cell vehicles. In Proceedings of the 2010 IEEE Vehicle Power and Propulsion Conference, Lille, France, 1–3 September 2010; pp. 1–6. [Google Scholar] [CrossRef]
- Alavi, O.; Rajabloo, T.; De Ceuninck, W.; Daenen, M. Non-Isolated DC-DC Converters in Fuel Cell Applications: Thermal Analysis and Reliability Comparison. Appl. Sci. 2022, 12, 5026. [Google Scholar] [CrossRef]
- Kheirandish, A.; Kazemi, M.S.; Dahari, M. Dynamic performance assessment of the efficiency of fuel cell-powered bicycle: An experimental approach. Int. J. Hydrogen Energy 2014, 39, 13276–13284. [Google Scholar] [CrossRef]
- Zhang, Z.; Huang, X.; Jiang, J.; Wu, B. An improved dynamic considering effect of temperature and equivalent internal resistance for PEM fuel cell power modules. J. Power Sources 2006, 161, 1062–1068. [Google Scholar] [CrossRef]
- Abdel-Rahim, O.; Chub, A.; Blinov, A.; Vinnikov, D.; Peftitsis, D. An efficient non-inverting buck-boost converter with improved step up/down ability. Energies 2022, 15, 4550. [Google Scholar] [CrossRef]

Disclaimer/Publisher’s Note: The statements, opinions and data contained in all publications are solely those of the individual author(s) and contributor(s) and not of MDPI and/or the editor(s). MDPI and/or the editor(s) disclaim responsibility for any injury to people or property resulting from any ideas, methods, instructions or products referred to in the content. |
© 2023 by the authors. Licensee MDPI, Basel, Switzerland. This article is an open access article distributed under the terms and conditions of the Creative Commons Attribution (CC BY) license (https://creativecommons.org/licenses/by/4.0/).