

Microstructures and Hardening Mechanisms of a 316L Stainless Steel/Inconel 718 Interface Additively Manufactured by Multi-Material Selective Laser Melting
 , , , , and
Abstract
:1. Introduction
2. Materials and Methods
2.1. Material and Sample Preparation
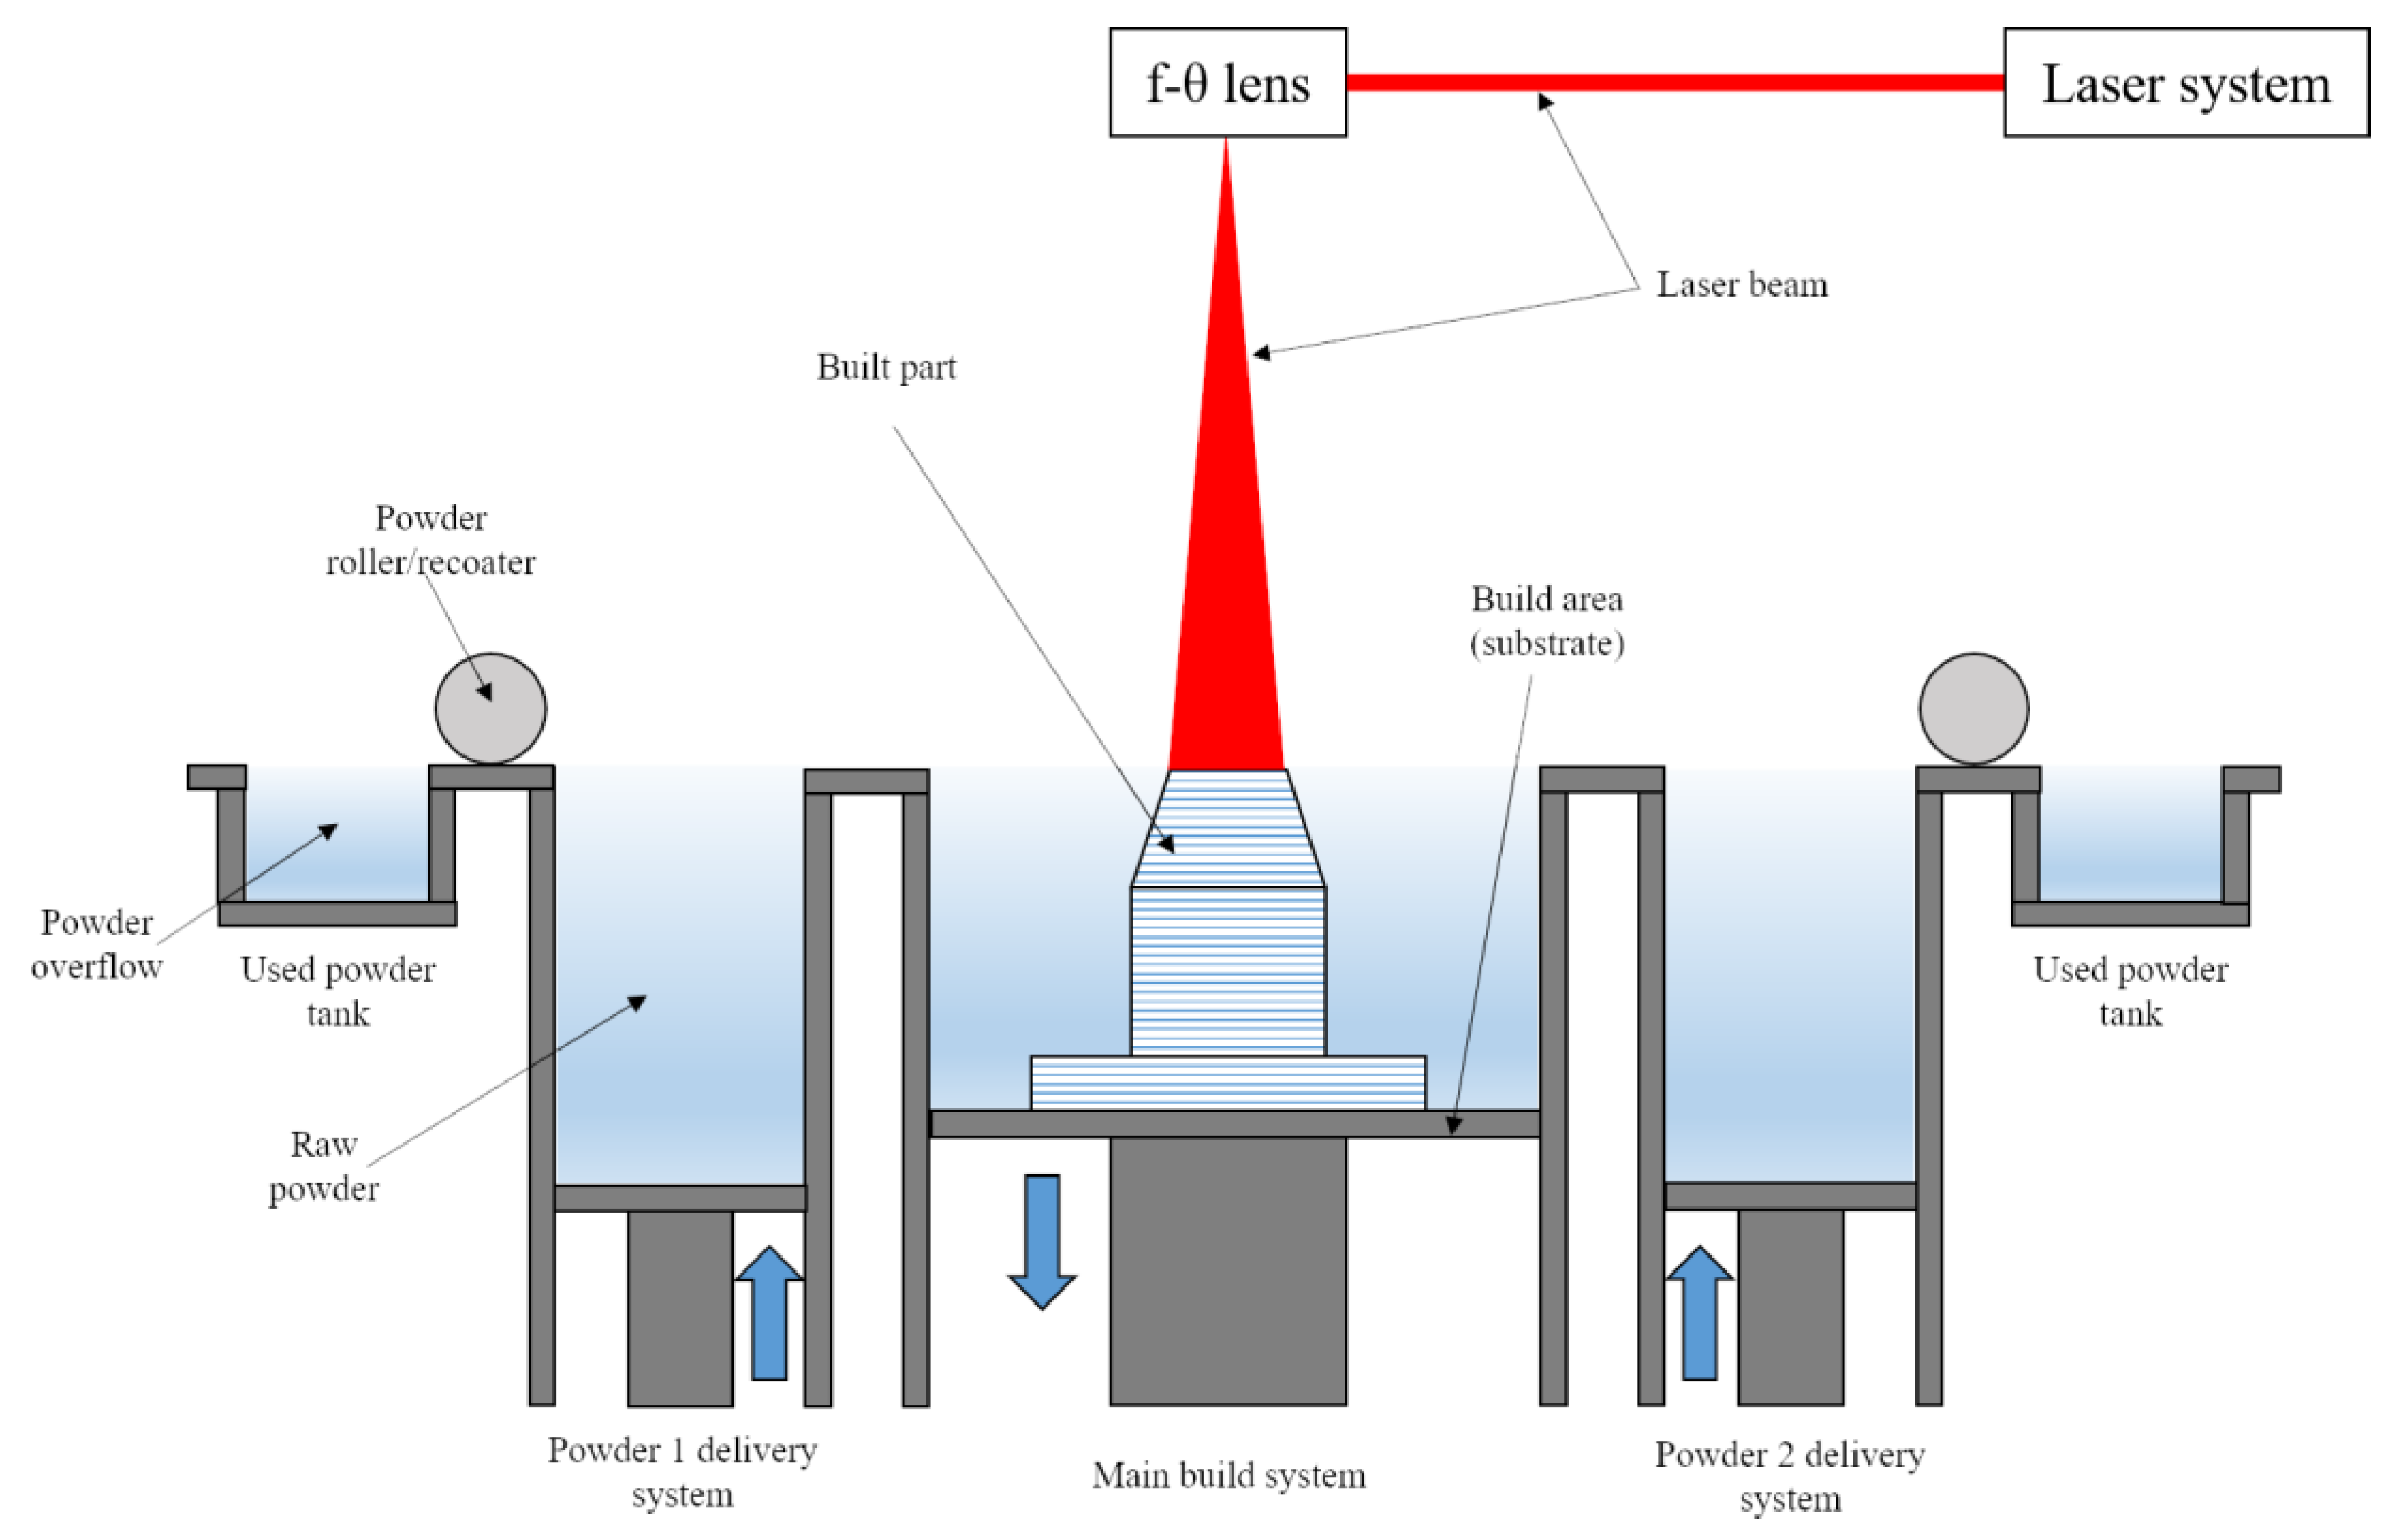
2.2. Multi-Material SLM System and Processing Parameters
2.3. Microstructural Characterisation
2.4. Hardness and Nanoindentation Measurements
3. Results
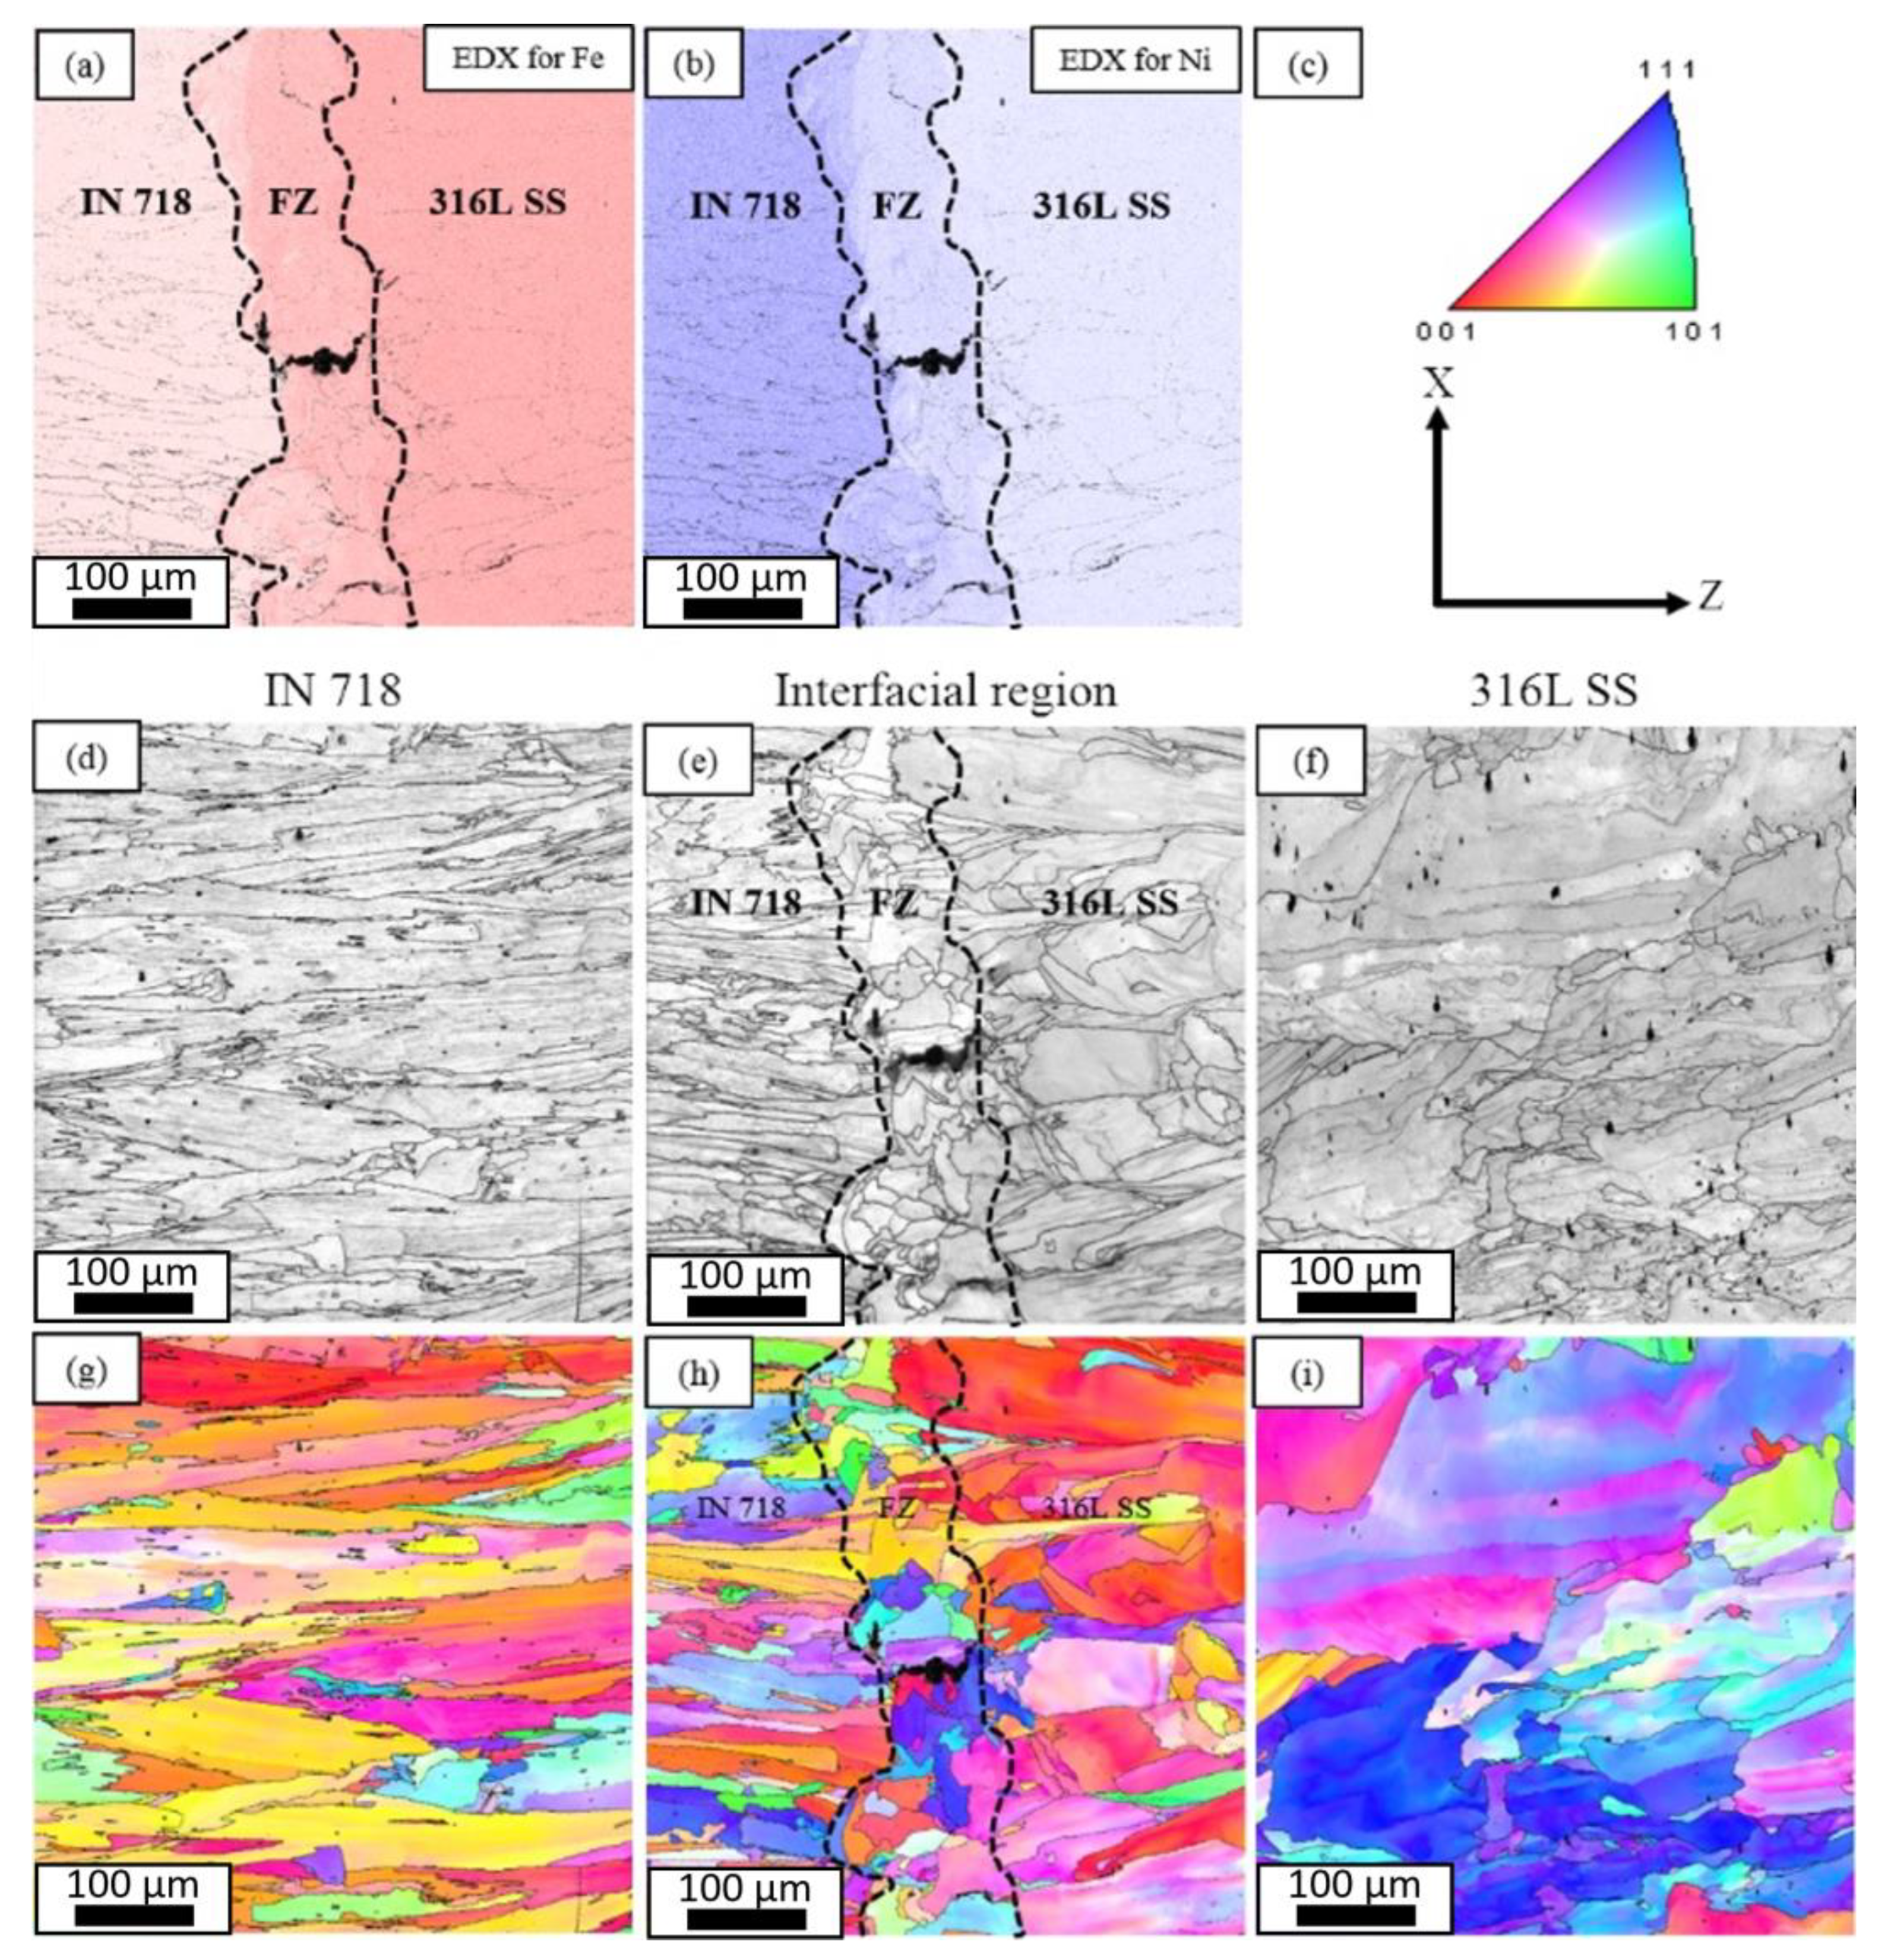
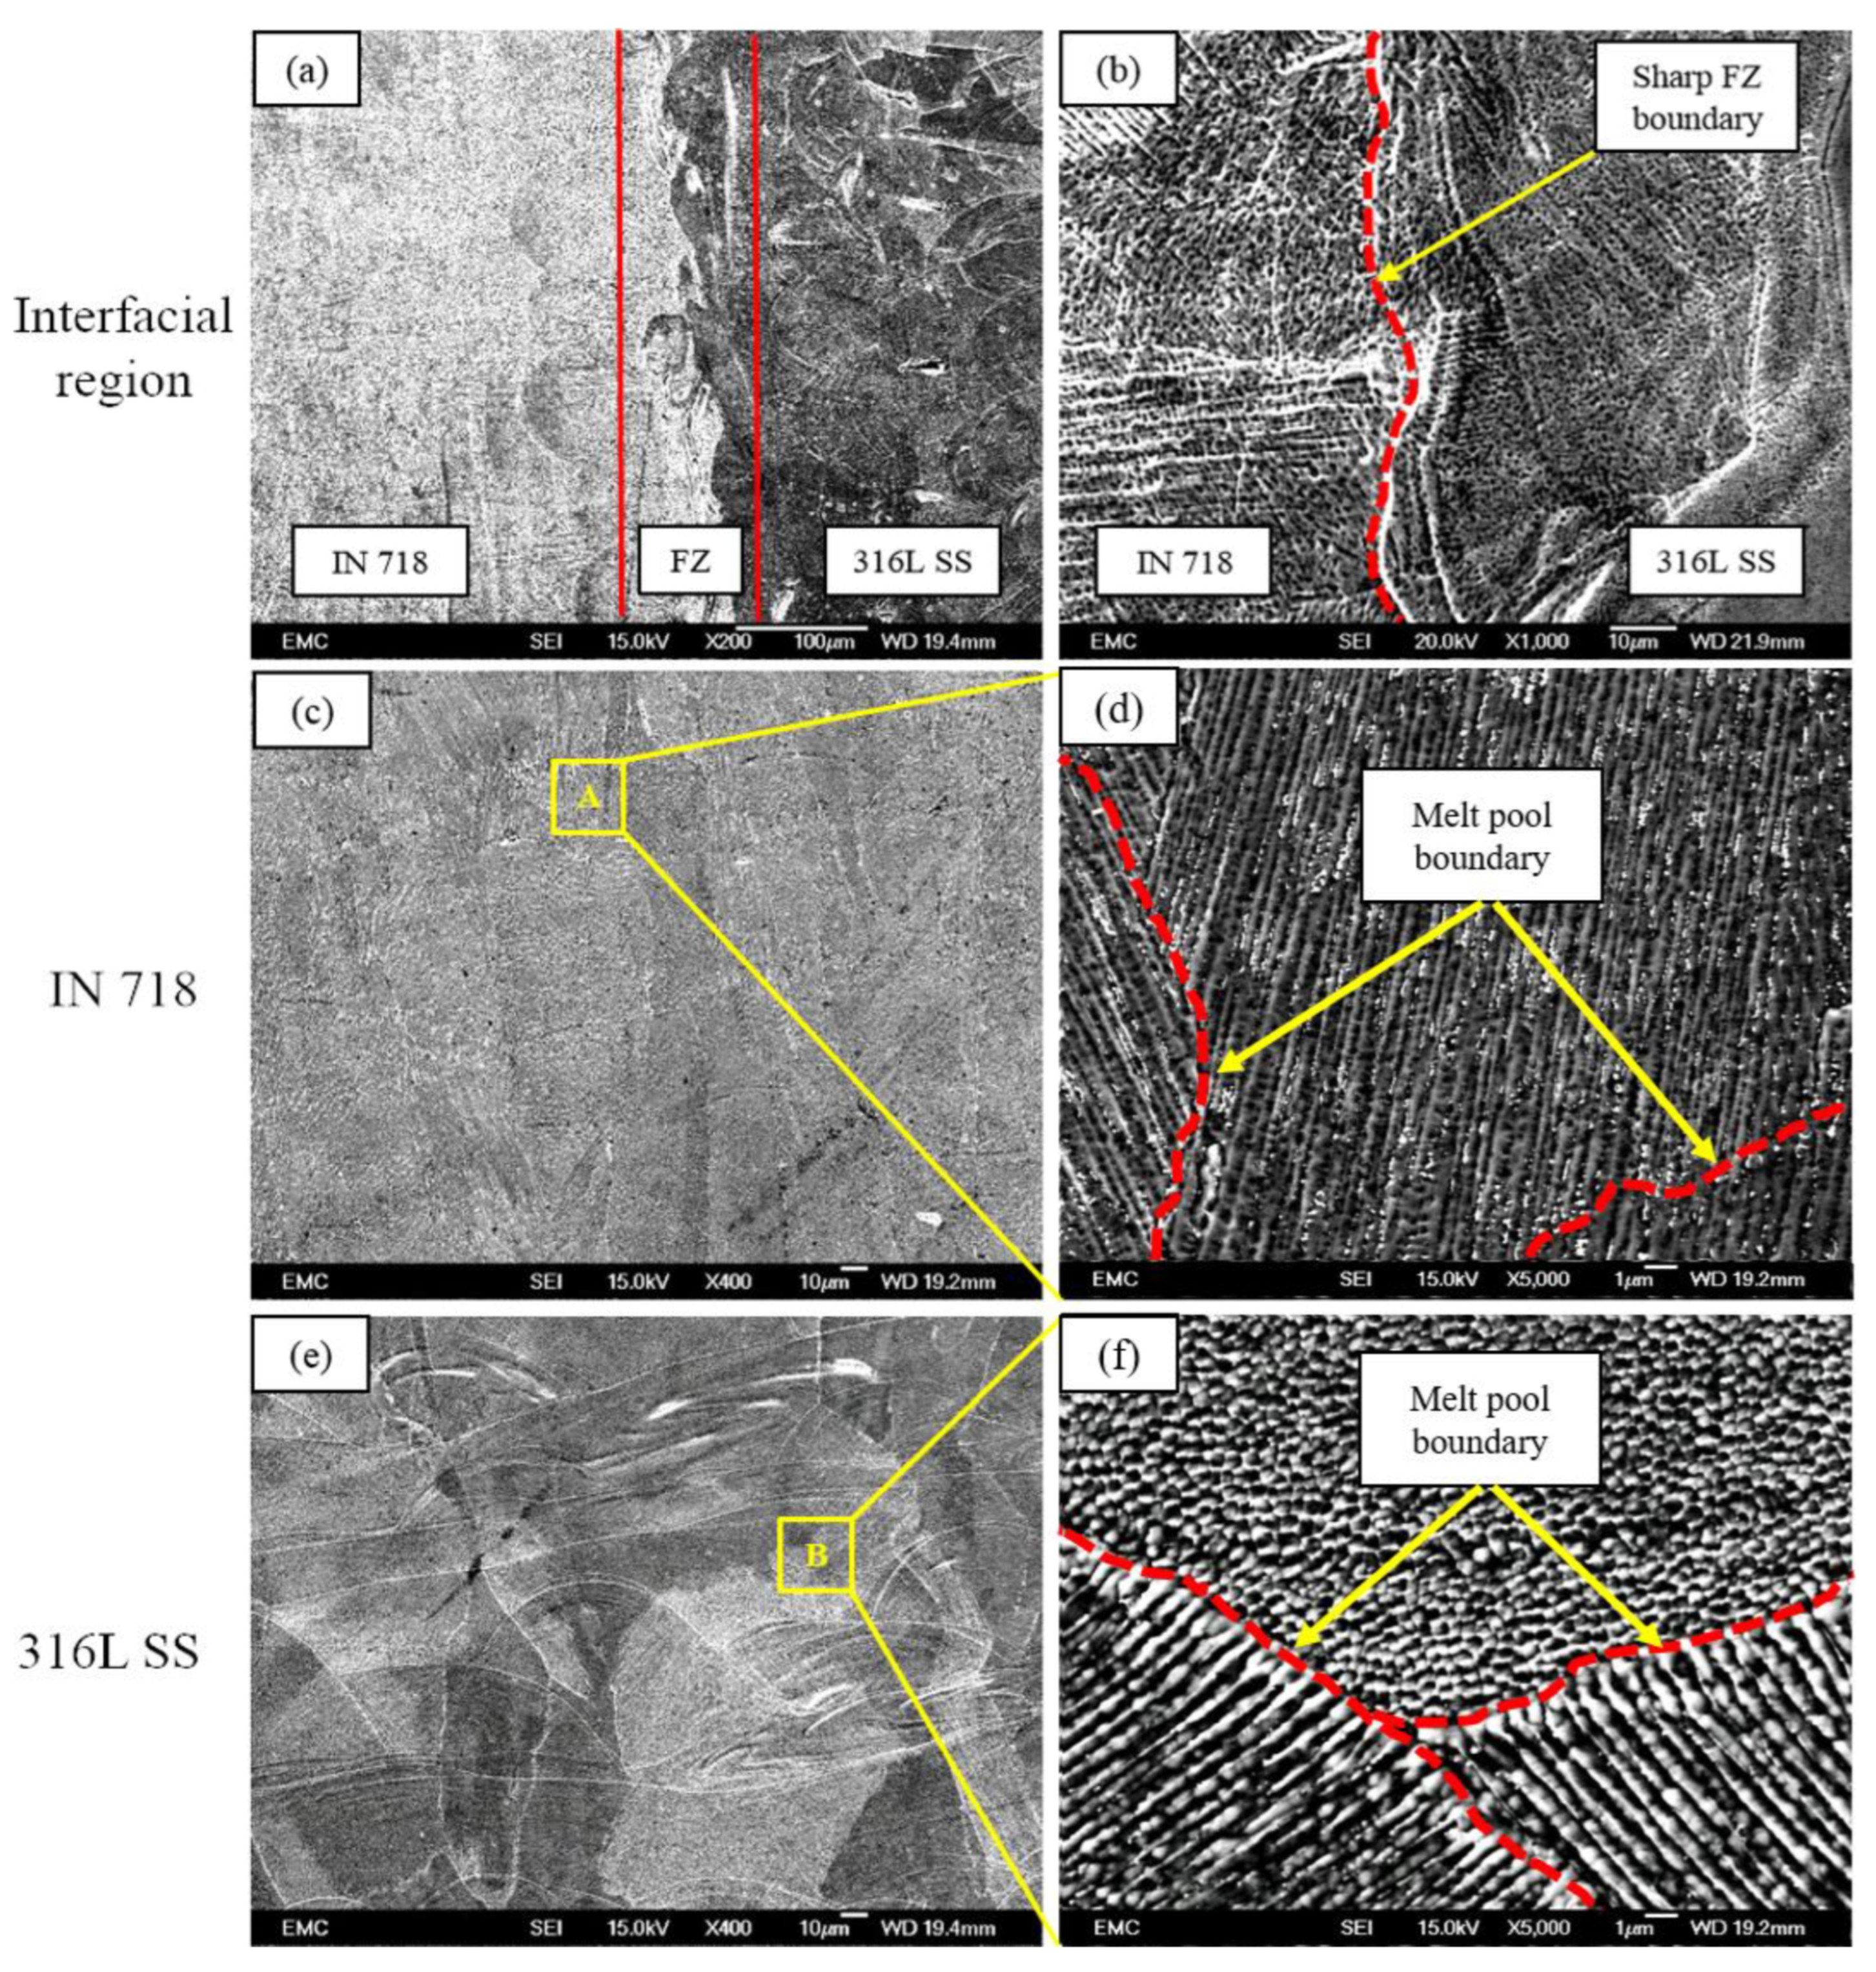
3.1. Interfacial Microstructures
3.2. XRD Analysis
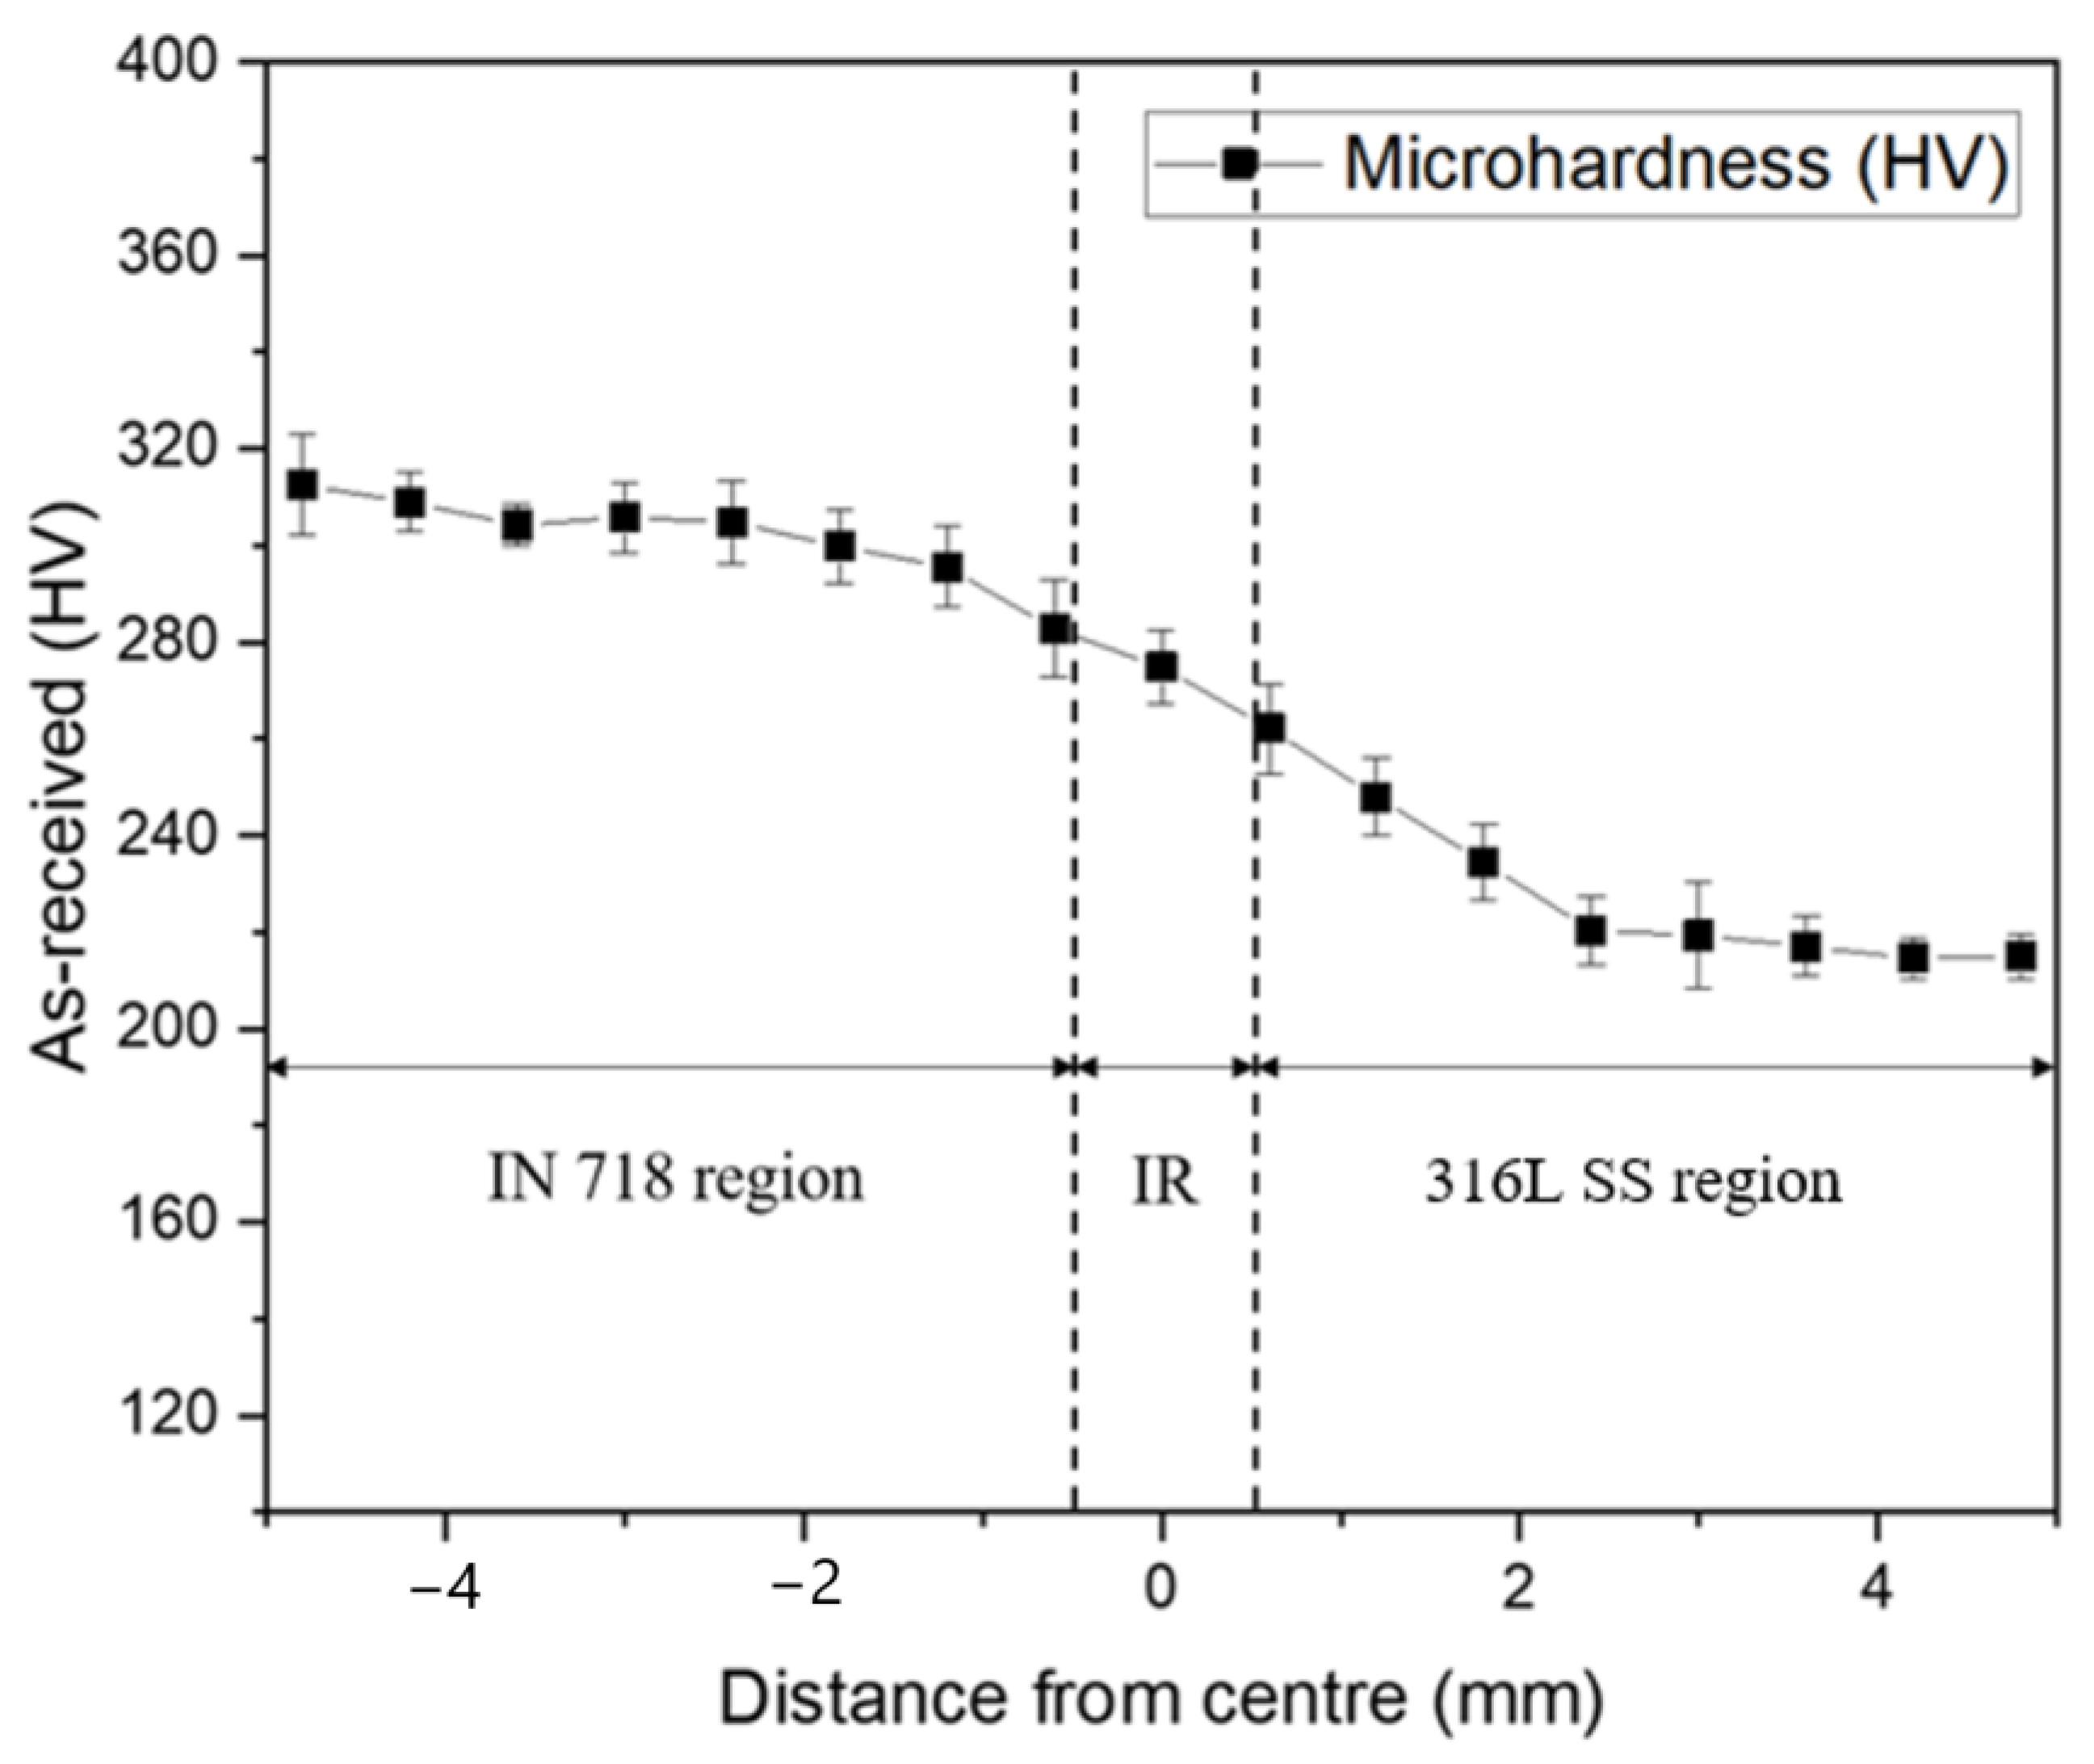
3.3. Hardness
4. Discussion
4.1. Interfacial Microstructures
4.2. Hardening Mechanisms
5. Conclusions
- Multi-material 316L SS/IN 718 parts with high densification levels and low porosity content (>99% and ~0.81%, respectively) have been successfully manufactured using the in-house-developed MM SLM system.
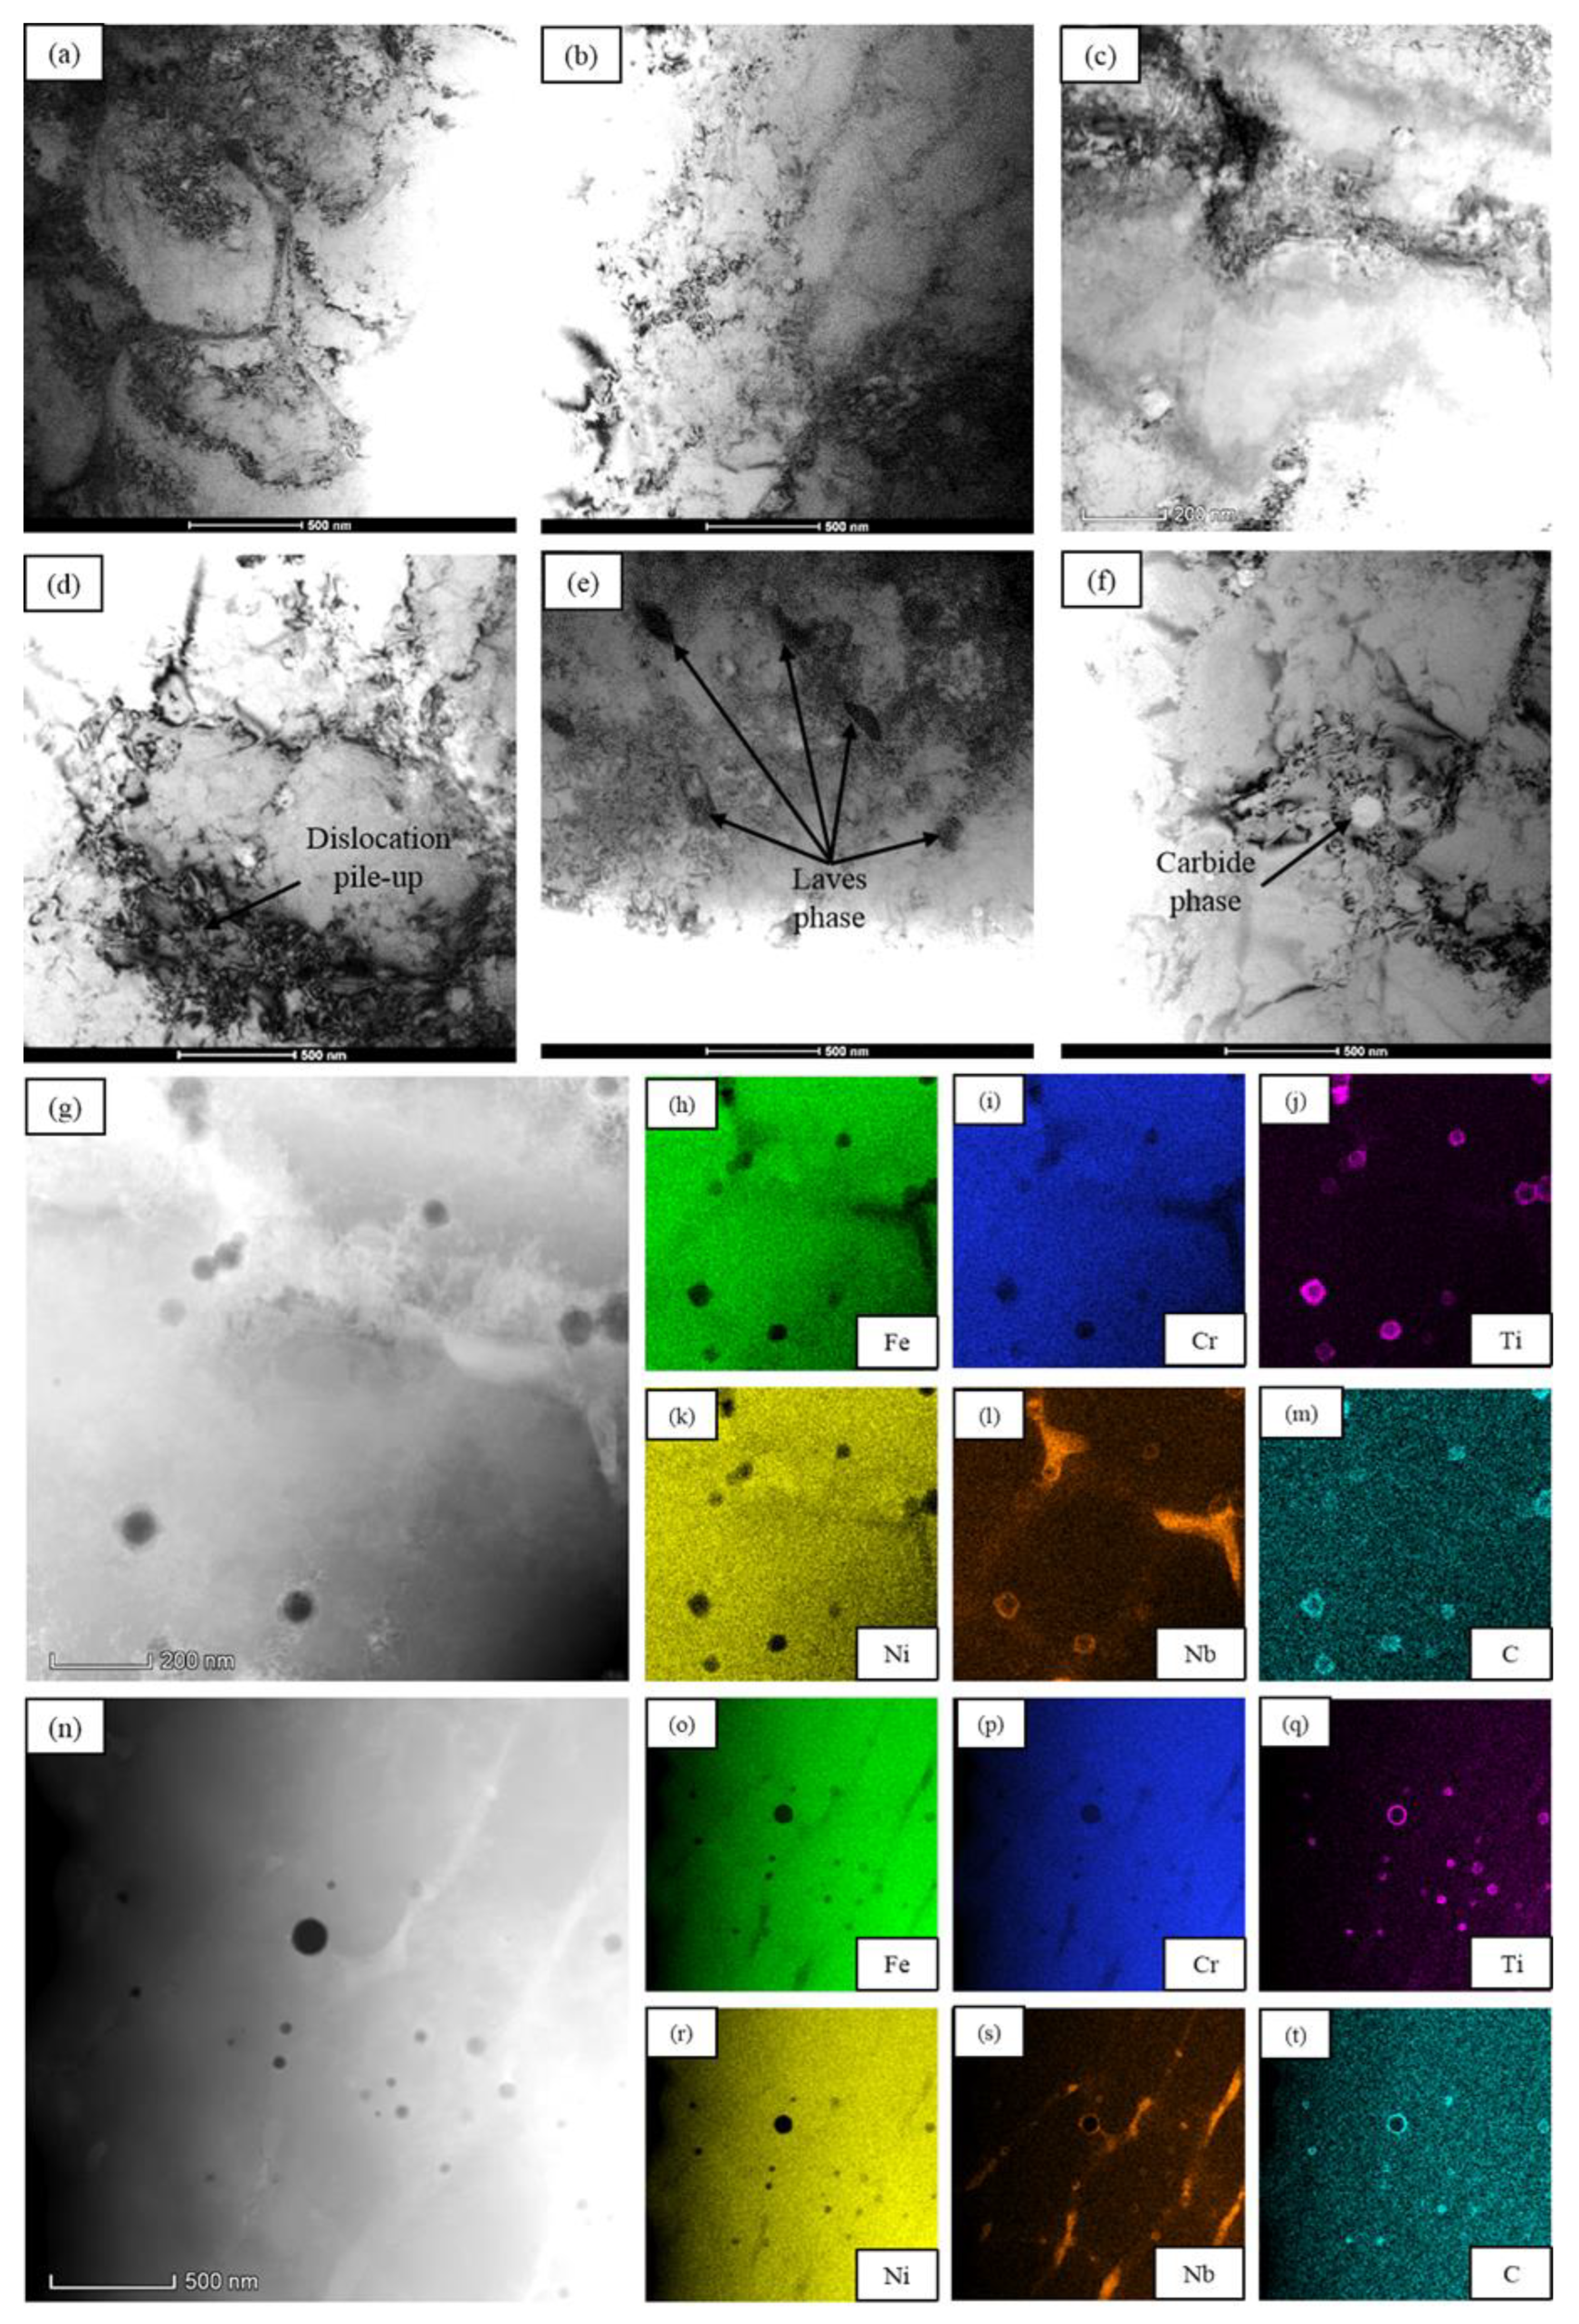
- Nb- and Ti-rich carbides and Laves phase precipitates can be observed in the interfacial region of the MM SLM specimen based on TEM observations and EDX analysis.
- HV and nanoindentation measurements indicate that the interfacial hardness is between that of the individual IN 718 region (highest) and that of the individual 316L SS region (lowest).
- The hardening model built based on the linear additive theory suggests that the overall interfacial hardness is primarily provided by grain boundary hardening, followed by dislocation and solid solution hardening mechanisms. Precipitation hardening and intrinsic hardness contribute the least towards the overall interfacial hardness.
Author Contributions
Funding
Data Availability Statement
Conflicts of Interest
References
- Kah, P.; Martikainen, M.S.J. Trends in Joining Dissimilar Metals by Welding. Adv. Mater. Sport. Equip. Des. 2014, 440, 269–276. [Google Scholar] [CrossRef]
- Wei, C.; Zhang, Z.; Cheng, D.; Sun, Z.; Zhu, M.; Li, L. An overview of laser-based multiple metallic material additive manufacturing: From macro: From micro-scales. Int. J. Extrem. Manuf. 2021, 3, 012003. [Google Scholar] [CrossRef]
- Bandyopadhyay, A.; Heer, B. Additive manufacturing of multi-material structures. Mater. Sci. Eng. R Rep. 2018, 129, 1–16. [Google Scholar] [CrossRef]
- Chen, J.; Yang, Y.; Song, C.; Zhang, M.; Wu, S.; Wang, D. Interfacial microstructure and mechanical properties of 316L /CuSn10 multi-material bimetallic structure fabricated by selective laser melting. Mater. Sci. Eng. A 2019, 752, 75–85. [Google Scholar] [CrossRef]
- Liu, Z.H.; Zhang, D.Q.; Sing, S.L.; Chua, C.K.; Loh, L.E. Interfacial characterization of SLM parts in multi-material processing: Metallurgical diffusion between 316L stainless steel and C18400 copper alloy. Mater. Charact. 2014, 94, 116–125. [Google Scholar] [CrossRef]
- Chen, J.; Yang, Y.; Song, C.; Wang, D.; Wu, S.; Zhang, M. Influence mechanism of process parameters on the interfacial characterization of selective laser melting 316L/CuSn10. Mater. Sci. Eng. A 2020, 792, 139316. [Google Scholar] [CrossRef]
- Bai, Y.; Zhang, J.; Zhao, C.; Li, C.; Wang, H. Dual interfacial characterization and property in multi-material selective laser melting of 316L stainless steel and C52400 copper alloy. Mater. Charact. 2020, 167, 110489. [Google Scholar] [CrossRef]
- Wei, C. Multiple Material Selective Laser Melting: A New Approach. Laser User. 2018, 18, 18–19. [Google Scholar]
- Wei, C.; Li, L.; Zhang, X.; Chueh, Y.H. 3D printing of multiple metallic materials via modified selective laser melting. CIRP Ann. 2018, 67, 245–248. [Google Scholar] [CrossRef] [Green Version]
- Bodner, S.C.; van de Vorst, L.T.G.; Zalesak, J.; Todt, J.; Keckes, J.F.; Maier-Kiener, V.; Sartory, B.; Schell, N.; Hooijmans, J.W.; Saurwalt, J.J.; et al. Inconel-steel multilayers by liquid dispersed metal powder bed fusion: Microstructure, residual stress and property gradients. Addit. Manuf. 2020, 32, 101027. [Google Scholar] [CrossRef]
- Chen, N.; Khan, H.A.; Wan, Z.; Lippert, J.; Sun, H.; Shang, S.L.; Liu, Z.K.; Li, J. Microstructural characteristics and crack formation in additively manufactured bimetal material of 316L stainless steel and Inconel 625. Addit. Manuf. 2020, 32, 101037. [Google Scholar] [CrossRef]
- Henderson, M.B.; Arrell, D.; Larsson, R.; Heobel, M.; Marchant, G. Nickel based superalloy welding practices for industrial gas turbine applications. Sci. Technol. Weld. Join. 2004, 9, 13–21. [Google Scholar] [CrossRef] [Green Version]
- Locci, I.E.; Bowman, C.L.; Gabbs, T.P.; Rd, B.; Got, I.E.L. Development of High Temperature Dissimilar Joint Technology for Fission Surface Power Systems. In Proceedings of the 4th International Brazing and Soldering Conference (IBSC), Orlando, FL, USA, 26–29 April 2009; Volume 718, pp. 165–175. [Google Scholar]
- Ferretti, S.; Valenzano, G.; Cugno, W. International space station external active thermal control system lines manufacturing. In Proceedings of the 57th International Astronautical Congress, Valencia, Spain, 2–6 October 2006; pp. 2952–2955. [Google Scholar] [CrossRef]
- Hinojos, A.; Mireles, J.; Reichardt, A.; Frigola, P.; Hosemann, P.; Murr, L.E.; Wicker, R.B. Joining of Inconel 718 and 316 Stainless Steel using electron beam melting additive manufacturing technology. Mater. Des. 2016, 94, 17–27. [Google Scholar] [CrossRef] [Green Version]
- Wen, S.; Chen, K.; Che, Y. Tailored microstructure and robust joint of Inconel 718/316L bimetallic multi-material fabricated by selective laser melting. Chinese J. Mech. Eng. 2020, preprint. [Google Scholar] [CrossRef]
- Mei, X.; Wang, X.; Peng, Y.; Gu, H.; Zhong, G.; Yang, S. Interfacial characterization and mechanical properties of 316L stainless steel/inconel 718 manufactured by selective laser melting. Mater. Sci. Eng. A 2019, 758, 185–191. [Google Scholar] [CrossRef]
- Mohd Yusuf, S.; Zhao, X.; Yang, S.; Gao, N. Interfacial characterisation of multi-material 316L stainless steel/Inconel 718 fabricated by laser powder bed fusion. Mater. Lett. 2021, 284, 128928. [Google Scholar] [CrossRef]
- Lutterotti, L.; Gialanella, S. X-Ray Diffraction Characterization of Heavily Deformed Metallic Specimens. Acta Mater. 1998, 46, 101–110. [Google Scholar] [CrossRef]
- Mccusker, L.B.; Von Dreele, R.B.; Cox, D.E.; Louër, D.; Scardi, P. Rietveld refinement guidelines. J. Appl. Crystallogr. 1999, 32, 36–50. [Google Scholar] [CrossRef] [Green Version]
- Young, R.A.; Wiles, D.B. Profile Shape Functions in Rietveld Refinements. J. Appl. Crystallogr. 1982, 15, 430–438. [Google Scholar] [CrossRef]
- Sames, W.J.; List, F.A.; Pannala, S.; Dehoff, R.R.; Babu, S.S. The metallurgy and processing science of metal additive manufacturing. Int. Mater. Rev. 2016, 61, 315–360. [Google Scholar] [CrossRef]
- Gorsse, S.; Hutchinson, C.; Gouné, M.; Banerjee, R. Additive manufacturing of metals: A brief review of the characteristic microstructures and properties of steels, Ti-6Al-4V and high-entropy alloys. Sci. Technol. Adv. Mater. 2017, 18, 584–610. [Google Scholar] [CrossRef] [Green Version]
- Tucho, W.M.; Lysne, V.H.; Austbø, H.; Sjolyst-Kverneland, A.; Hansen, V. Investigation of effects of process parameters on microstructure and hardness of SLM manufactured SS316L. J. Alloys Compd. 2018, 740, 910–925. [Google Scholar] [CrossRef]
- Pham, M.S.; Dovgyy, B.; Hooper, P.A. Twinning induced plasticity in austenitic stainless steel 316L made by additive manufacturing. Mater. Sci. Eng. A 2017, 704, 102–111. [Google Scholar] [CrossRef]
- Cao, G.H.; Sun, T.Y.; Wang, C.H.; Li, X.; Liu, M.; Zhang, Z.X.; Hu, P.F.; Russell, A.M.; Schneider, R.; Gerthsen, D.; et al. Investigations of γ′ γ″ and δ precipitates in heat-treated Inconel 718 alloy fabricated by selective laser melting. Mater. Charact. 2018, 136, 398–406. [Google Scholar] [CrossRef] [Green Version]
- Tikhonova, M.; Enikeev, N.; Valiev, R.Z.; Belyakov, A.; Kaibyshev, R. Submicrocrystalline austenitic stainless steel processed by cold or warm high pressure torsion. Mater. Sci. Forum. 2016, 838–839, 398–403. [Google Scholar] [CrossRef]
- De Jaeger, J.; Solas, D.; Baudin, T.; Fandeur, O.; Schmitt, J.H.; Rey, C. INCONEL 718 Single and Multipass Modelling of Hot Forging. Superalloys 2012, 2012, 663–672. [Google Scholar] [CrossRef] [Green Version]
- Mohd Yusuf, S.; Chen, Y.; Yang, S.; Gao, N. Microstructural evolution and strengthening of selective laser melted 316L stainless steel processed by high-pressure torsion. Mater. Charact. 2020, 159, 110012. [Google Scholar] [CrossRef]
- Skiba, T.; Baufeld, B.; Van der Biest, O. Shaped metal deposition of 300M steel. Proc. Inst. Mech. Eng. Part B J. Eng. Manuf. 2011, 225, 831–839. [Google Scholar] [CrossRef]
- Amato, K.N.; Gaytan, S.M.; Murr, L.E.; Martinez, E.; Shindo, P.W.; Hernandez, J.; Collins, S.; Medina, F. Microstructures and mechanical behavior of Inconel 718 fabricated by selective laser melting. Acta Mater. 2012, 60, 2229–2239. [Google Scholar] [CrossRef]
- Sing, S.L.; Lam, L.P.; Zhang, D.Q.; Liu, Z.H.; Chua, C.K. Interfacial characterization of SLM parts in multi-material processing: Intermetallic phase formation between AlSi10Mg and C18400 copper alloy. Mater. Charact. 2015, 107, 220–227. [Google Scholar] [CrossRef]
- Terrazas, C.A.; Gaytan, S.M.; Rodriguez, E.; Espalin, D.; Murr, L.E.; Medina, F.; Wicker, R.B. Multi-material metallic structure fabrication using electron beam melting. Int. J. Adv. Manuf. Technol. 2013, 71, 33–45. [Google Scholar] [CrossRef]
- Gu, D.D.; Meiners, W.; Wissenbach, K.; Poprawe, R. Laser additive manufacturing of metallic components: Materials, processes and mechanisms. Int. Mater. Rev. 2012, 57, 133–164. [Google Scholar] [CrossRef]
- Deng, D.; Peng, R.L.; Brodin, H.; Moverare, J. Microstructure and mechanical properties of Inconel 718 produced by selective laser melting: Sample orientation dependence and effects of post heat treatments. Mater. Sci. Eng. A 2018, 713, 294–306. [Google Scholar] [CrossRef]
- Kuo, Y.L.; Horikawa, S.; Kakehi, K. The effect of interdendritic δ phase on the mechanical properties of Alloy 718 built up by additive manufacturing. Mater. Des. 2017, 116, 411–418. [Google Scholar] [CrossRef]
- Tucho, W.M.; Cuvillier, P.; Sjolyst-Kverneland, A.; Hansen, V. Microstructure and hardness studies of Inconel 718 manufactured by selective laser melting before and after solution heat treatment. Mater. Sci. Eng. A 2017, 689, 220–232. [Google Scholar] [CrossRef]
- Chlebus, E.; Gruber, K.; Kuźnicka, B.; Kurzac, J.; Kurzynowski, T. Effect of heat treatment on the microstructure and mechanical properties of Inconel 718 processed by selective laser melting. Mater. Sci. Eng. A 2015, 639, 647–655. [Google Scholar] [CrossRef]
- Antonsson, T.; Fredriksson, H. Effect of cooling rate on the solidification of INCONEL 718. Metall. Mater. Trans. B 2005, 36B, 85–96. [Google Scholar] [CrossRef]
- Knorovsky, G.A.; Cieslak, M.J.; Headley, T.J.; Romig, A.D.; Hammetter, W.F. INCONEL 718: A solidification diagram. Metall. Trans. A 1989, 20, 2149–2158. [Google Scholar] [CrossRef]
- Devendranath Ramkumar, K.; Patel, S.D.; Sri Praveen, S.; Choudhury, D.J.; Prabaharan, P.; Arivazhagan, N.; Xavior, M. A Influence of filler metals and welding techniques on the structure-property relationships of Inconel 718 and AISI 316L dissimilar weldments. Mater. Des. 2014, 62, 175–188. [Google Scholar] [CrossRef]
- Bansal, A.; Sharma, A.K.; Das, S.; Kumar, P. On microstructure and strength properties of microwave welded Inconel 718/ stainless steel (SS-316L). Proc. Inst. Mech. Eng. Part L J. Mater. Des. Appl. 2016, 230, 939–948. [Google Scholar] [CrossRef]
- Li, Y.F.; Hong, S.T.; Choi, H.; Han, H.N. Solid-state dissimilar joining of stainless steel 316L and Inconel 718 alloys by electrically assisted pressure joining. Mater. Charact. 2019, 154, 161–168. [Google Scholar] [CrossRef]
- Morris, D.G. Strengthening mechanisms in nanocrystalline metals. In Nanostructured Metals and Alloys Processing, Microstructure, Mechanical Properties and Applications; Woodhead Publishing Co.: Delhi, India, 2011; pp. 299–328. [Google Scholar] [CrossRef]
- Zhang, P.; Li, S.X.; Zhang, Z.F. General relationship between strength and hardness. Mater. Sci. Eng. A 2011, 529, 62–73. [Google Scholar] [CrossRef]
- Asadi, M.; Guillot, D.; Weck, A.; Hegde, S.R.; Koul, A.K.; Sawatzky, T.; Saari, H. Constructing a validated deformation mechanisms map using low temperature creep strain accommodation processes for nickel-base alloy 718. Am. Soc. Mech. Eng. Press. Vessel. Pip. Div. PVP 2012, 2, 65–73. [Google Scholar] [CrossRef] [Green Version]
- Lasalmonie, A.; Strudel, J.L. Influence of grain size on the mechanical behaviour of some high strength materials. J. Mater. Sci. 1986, 21, 1837–1852. [Google Scholar] [CrossRef]
- Goodfellow, A.J. Strengthening mechanisms in polycrystalline nickel-based superalloys. Mater. Sci. Technol. 2018, 34, 1793–1808. [Google Scholar] [CrossRef]
- Gladman, T. Precipitation-hardening of metals. Mater. Sci. Technol. 1999, 15, 30–36. [Google Scholar] [CrossRef]
- Hadadzadeh, A.; Amirkhiz, B.S.; Mohammadi, M. Contribution of Mg2Si precipitates to the strength of direct metal laser sintered AlSi10Mg. Mater. Sci. Eng. A 2019, 739, 295–300. [Google Scholar] [CrossRef]
- Chen, B.; Moon, S.K.; Yao, X.; Bi, G.; Shen, J.; Umeda, J.; Kondoh, K. Strength and strain hardening of a selective laser melted AlSi10Mg alloy. Scr. Mater. 2017, 141, 45–49. [Google Scholar] [CrossRef]
- Karavaeva, M.V.; Abramova, M.M.; Enikeev, N.A.; Raab, G.I.; Valiev, R.Z. Superior strength of austenitic steel produced by combined processing, including equal-channel angular pressing and rolling. Metals 2016, 6, 310. [Google Scholar] [CrossRef]
- Maher.Com. Alloy 718 Data Sheet. 2016. Available online: https://www.maher.com/media/pdfs/718-datasheet.pdf (accessed on 10 December 2019).
- Kim, J.G.; Enikeev, N.A.; Seol, J.B.; Abramova, M.M.; Karavaeva, M.V.; Valiev, R.Z.; Park, C.G.; Kim, H.S. Superior Strength and Multiple Strengthening Mechanisms in Nanocrystalline TWIP Steel. Sci. Rep. 2018, 8, 11200. [Google Scholar] [CrossRef] [PubMed] [Green Version]
- Gubicza, J.; El-Tahawy, M.; Huang, Y.; Choi, H.; Choe, H.; Lábár, J.L.; Langdon, T.G. Microstructure, phase composition and hardness evolution in 316L stainless steel processed by high-pressure torsion. Mater. Sci. Eng. A 2016, 657, 215–223. [Google Scholar] [CrossRef] [Green Version]
- Li Ning, J.; Courtois-Manara, E.; Kurmanaeva, L.; Ganeev, A.V.; Valiev, R.Z.; Kübel, C.; Ivanisenko, Y. Tensile properties and work hardening behaviors of ultrafine grained carbon steel and pure iron processed by warm high pressure torsion. Mater. Sci. Eng. A 2013, 581, 8–15. [Google Scholar] [CrossRef]


| Cr | Ni | Nb | Ti | Mo | Mn | Si | C | P | S | Fe | |
|---|---|---|---|---|---|---|---|---|---|---|---|
| 316L SS | 18.43 | 12.2 | - | - | 2.46 | 1.86 | 0.03 | 0.013 | 0.032 | 0.01 | Bal. |
| IN 718 | 18.6 | 50.7 | 5.01 | 0.89 | 3.1 | 0.04 | 0.09 | 0.016 | 0.013 | - | Bal. |
| Cr | Ni | Nb | Mo | Ti | Mn | Fe |
|---|---|---|---|---|---|---|
| 20.34 | 32.7 | 9.55 | 3.6 | 1.21 | 0.02 | Bal. |
| Precipitates | Cr | Ni | Fe | Nb | Mo | Ti |
|---|---|---|---|---|---|---|
| Laves Carbide | 17.54 10.56 | 45.23 6.55 | 12.22 3.38 | 19.13 39.82 | 4.72 1.64 | 1.16 38.05 |
| Hardening Mechanism | Symbol | Value | References |
|---|---|---|---|
| Ci | 3 | [56] | |
| M | 3.05 | [52] | |
| b | 0.26 nm | [27,28,46] | |
| G | 77,000 GPa | [52,53] | |
| α1 | 0.3 | [54] | |
| Solid solution | kCr | 6.96 MPa/at. %2/3 Cr | [48] |
| kNb | 10.58 MPa/at. %2/3 Nb | [48] | |
| kMo | 10.05 MPa/at. %2/3 Mo | [48] | |
| kTi | 9.18 MPa/at. %2/3 Ti | [48] | |
| Orowan (precipitation) | fppt. | 1.43 vol. % | This work (TEM) |
| rppt. | 15.0 nm | This work (TEM) | |
| Dislocation | ρtotal | 0.942 × 10¹³ m−2 | This work (XRD) |
| DC | 280 nm | This work (XRD) | |
| Grain boundary | KHP | 2.8 MPa m−1/2 | [52,55] |
| d | 45 µm | This work (EBSD) |
| HV0 | HVSS | HVORO | HVρ | HVGB | HVPredicted | HVMeasured | Error (%) |
|---|---|---|---|---|---|---|---|
| 6 | 43 | 14 | 55 | 133 | 251 | 260 | 3.5 |
Disclaimer/Publisher’s Note: The statements, opinions and data contained in all publications are solely those of the individual author(s) and contributor(s) and not of MDPI and/or the editor(s). MDPI and/or the editor(s) disclaim responsibility for any injury to people or property resulting from any ideas, methods, instructions or products referred to in the content. |
© 2023 by the authors. Licensee MDPI, Basel, Switzerland. This article is an open access article distributed under the terms and conditions of the Creative Commons Attribution (CC BY) license (https://creativecommons.org/licenses/by/4.0/).
Share and Cite
Mohd Yusuf, S.; Mazlan, N.; Musa, N.H.; Zhao, X.; Chen, Y.; Yang, S.; Nordin, N.A.; Mazlan, S.A.; Gao, N. Microstructures and Hardening Mechanisms of a 316L Stainless Steel/Inconel 718 Interface Additively Manufactured by Multi-Material Selective Laser Melting. Metals 2023, 13, 400. https://doi.org/10.3390/met13020400
Mohd Yusuf S, Mazlan N, Musa NH, Zhao X, Chen Y, Yang S, Nordin NA, Mazlan SA, Gao N. Microstructures and Hardening Mechanisms of a 316L Stainless Steel/Inconel 718 Interface Additively Manufactured by Multi-Material Selective Laser Melting. Metals. 2023; 13(2):400. https://doi.org/10.3390/met13020400
Chicago/Turabian StyleMohd Yusuf, Shahir, Nurainaa Mazlan, Nur Hidayah Musa, Xiao Zhao, Ying Chen, Shoufeng Yang, Nur Azmah Nordin, Saiful Amri Mazlan, and Nong Gao. 2023. "Microstructures and Hardening Mechanisms of a 316L Stainless Steel/Inconel 718 Interface Additively Manufactured by Multi-Material Selective Laser Melting" Metals 13, no. 2: 400. https://doi.org/10.3390/met13020400