Article

Elemental Fluctuation in Gd3Al2Ga3O12:Ce Crystals Imposed by Li+ and Mg2+ Co-Doping: The Impact on Defects, Luminescence, and Scintillation Properties

by
Karol Bartosiewicz
Faculty of Physics, Kazimierz Wielki University, Powstańców Wielkopolskich 2, 85090 Bydgoszcz, Poland
Metals 2023, 13(2), 422; https://doi.org/10.3390/met13020422
Submission received: 25 January 2023 / Revised: 10 February 2023 / Accepted: 15 February 2023 / Published: 17 February 2023
(This article belongs to the Section Crystallography and Applications of Metallic Materials)

Abstract

:
This research revealed the response of Ga and Al sublattices to the incorporation of mismatching substituents in Gd3Al2Ga3O12:Ce single crystals. Incompatible in size and charge, Li+ and Mg2+ substituents violated configurational entropy. This led to lattice distortion and triggered structural rearrangements. The radial fluctuation of the Ga and Al elements was proven by multi-elemental energy-dispersive X-ray spectroscopy mapping and elemental composition analysis. Further evidence was observed by the shift of the exciton creation energy toward higher energy in the vacuum ultraviolet excitation spectra recorded with synchrotron radiation. In the Li+ and Mg2+ co-doped samples, the crystal core was depleted with Ga atoms and enriched with Al elements. The crystal rim showed the opposite behavior. The change in thermoluminescence peak positions revealed a different mechanism for the formation of localized traps. As a result, Li+ co-doping slightly improved the light yield value, but at the same time decelerated the scintillation decay time. On the contrary, Mg2+ co-doping markedly diminished scintillation parameters.

Graphical Abstract

1. Introduction

Investigation of the structure–property relationship plays an important role in the development of new functional materials and provides new physical insights. Crystal engineering strategies are the basis for the tuning and understanding of material properties, as well as the discovery and structural design of new luminescent materials for emerging applications [1]. RE3M5O12 (RE = Lu, Y, Gd, Tb; M = Al, Ga, Sc) simple or complex garnets form a wide range of inorganic compounds. Their physical and chemical properties are closely related to the structure, composition, and synthesis methods [2,3,4,5,6,7]. Composition flexibility is a unique feature of RE3M5O12 garnets, as it allows extreme variations in the design of structure and composition in relation to applications. Recently, complex Ce3+ doped garnets have received a lot of attention as promising scintillators for medical imaging [4], phosphors for light-emitting laser/diode applications [6], and persistent phosphors [8]. Such intense research on aluminum garnets resulted in the invention of a complex Gd3Al2Ga3O12:Ce (GAGG:Ce) single crystal with an excellent light yield (LY) of 46,000 ph/MeV [9]. The further development of GAGG:Ce crystals resulted in achieving an extremely high LY of around 55,000 ph/MeV with a scintillation decay time of about 90–120 ns [10]. The GAGG host lattice, on the other hand, features several structural defects that degrade scintillation performance and lead to the rise time, the slow component of scintillation decay time, and afterglow. These drawbacks exclude the use of the GAGG:Ce single crystal in medical imaging applications [11,12]. Further research efforts have focused on improving the scintillation timing performance for the GAGG:Ce crystal. This was achieved by aliovalent co-doping with Mg2+ or Ca2+ ions. Owing to the charge imbalance, the Ce4+ centers are formed to maintain the charge neutrality in the crystal. Stable Ce4+ ions are characterized by the presence of a distinctive wide charge transfer absorption band in the 320–200 nm spectral region [13]. Furthermore, stable Ce4+ ions are also an excellent electron trap that prevents electron capture in various intrinsic defects, creating an alternative channel for fast radiative recombination. This significantly reduces the slow component in scintillation decay and suppresses afterglow [11]. However, at the same time, a significant decrease in light yield is observed [11]. Another optimization based on monovalent Li+ co-doping was applied to improve both timing parameters and LY [14,15,16]. However, Li+ co-doping, similar to Mg2+, imposed the formation of stable Ce4+ ions [14,15,17]. The appearance of additional Ce4+ related broad charge transfer absorption below 320 nm and the reduction in Ce3+ absorption strength with the increasing Li+ content indicated the change in the Ce valence state from +3 to +4 [14,15]. Furthermore, the acceleration in the scintillation decay time and improvement in timing resolution along with simultaneous reduction in the light yield were also reported. However, this effect was much weaker compared with Mg2+ co-doping. Recent research [17] revealed that the incorporation of aliovalent and mismatched Mg2+ ions into the GAGG:Ce lattice imposed the formation of specific types of defects that significantly changed radial elemental homogeneity in the crystal. This significantly influenced the luminescence and scintillation properties of GAGG:Ce,Mg crystals. Similarly, the recent EPR and NMR study [15] revealed a detailed mechanism of charge imbalance compensation in Li+ co-doped YAG:Ce single crystals.
The spectral and temporal properties of emission centers strongly depend on the host lattice composition. Much research is devoted to how doping and co-doping concentration levels change optical and luminescence parameters and impose asymmetric crystal field perturbation and defect formation. In such research, the investigation of how doping or co-doping imposes structural rearrangement and a change in elemental homogeneity in the crystal is quite often omitted. The elemental distribution significantly influences the spectral properties of the emission centers in the crystals. Therefore, this research is devoted to studying the influence of the co-doping of Li+ and Mg2+ ions on the radial distribution of the Gd, Ga, Al, and O atoms in Gd3Ga3Al2O12:Ce3+ single crystals grown using the μ-PD method. The changes in atom distributions imposed by Li+ and Mg2+ co-doping are compared and discussed. The optical, luminescence, and scintillation features are compared and discussed on the elemental inhomogeneity imposed by co-doping. The change in elemental homogeneity is additionally confirmed by photoluminescence properties measured with synchrotron radiation. Thermally stimulated luminescence (TSL) measurements between 10 and 670 K revealed the formation of different types of defects in Li+ and Mg2+ co-doped crystals.

2. Methodology

2.1. Crystal Growth

The powders of Gd2O3, α-Al2O3, Ga2O3, CeO2, Li2CO3, and MgCO3 (99.99%, Iwatani Corporation, Tokyo, Japan) were mixed stoichiometrically and added directly to the Ir crucible according to the nominal melt compositions: Gd2.9925Ce0.0075Al2Ga3O12, Gd2.9925Ce0.0075Al2Ga2.995Mg0.005O12, and Gd2.9895CeLi0.003Al2Ga3O12. Therefore, the nominal concentration for Ce3+ was 0.25 at. % (with respect to Gd, at. %—the abbreviation ‘at.’ is now skipped), and Li+ and Mg2+ concentrations were 1000 ppm with respect to Gd and Ga, respectively. The concentrations of Ce, Li, and Mg atoms were chosen to provide a good compromise between a fast scintillation response and sufficient light yield value. The crystals were grown at the Institute for Materials Research, Tohoku University, Japan. The crystals were grown in an iridium crucible (Furuya Metal Co., Ltd. Tokyo, Japan) of ~2.5 mm in diameter using the micro-pulling down method (μ-PD) [18]. Growth was carried out in an atmosphere of argon mixed with 2% of oxygen. The <100> orientated GAGG:Ce single crystal was used as a seed with a 0.1 mm/min pulling down speed. To compensate for Ga evaporation, a 1.0 wt.% excess of Ga2O3 oxide was optimized and added to the stoichiometric compositions.

2.2. Powder X-ray Diffraction and Energy-Dispersive X-ray Spectroscopy Analysis

In a mortar, a small portion of the grown crystal was crushed and ground to a powder. The Bruker D8 DISCOVER-HS diffractometer (Billerica, MA, United States) was used to perform powder X-ray diffraction (PXRD) investigations in the 2θ 15–65° range. CuK-α-radiation with a wavelength of about 1.54 Å and a photon energy of E = 8.04 keV was used for diffraction measurements. A field emission scanning electron microscope, type FEI Nova NanoSEM 230 (Field Electron and Ion Company, Hillsboro, OR, United States), with an Apollo X Silicon Drift Detector and EDAX Genesis Software (Version 4.5) was used for the morphology and chemical composition analysis. The conditions of sample preparation were described in [17]. The Ce, Li, and Mg concentrations in the crystals were beyond the EDAX detector’s detection limit. As a result, neither the EDS mapping nor the analysis of EDS elemental compositions was measured or discussed.

2.3. Optical, Luminescence, and Scintillation Characteristics

The optical absorption spectra at 300 K were measured using a Shimadzu 3101PC spectrometer (Shimadzu Corporation, Kyoto, Japan). Photoluminescence excitation and emission spectra in the vacuum ultraviolet (VUV) spectral range were recorded at 300 K using synchrotron radiation (SR) at the National Institutes of Natural Sciences, Institute for Molecular Science, Okazaki, Japan. The liquid helium cryostat was used for temperature dependence measurements. Correction of these spectra for the wavelength-dependent excitation intensity was performed with the use of sodium salicylate as a standard. Excitation spectra in the UV/Vis range were measured at 300 K using Edinburgh Instruments FLS920 (Edinburgh Instruments Ltd, 2 Bain Square, Kirkton Campus, United Kingdom) equipped with a xenon lamp as an excitation source. Pulsed Diode Lasers (Edinburgh Instruments Ltd, 2 Bain Square, Kirkton Campus, United Kingdom) was used for fast decay kinetic measurements using the same spectrofluorometer. X-ray excited measurements were performed under soft X-ray excitation (40 mA and kV, model RINT2000, Rigaku Corporation, Tokyo, Japan). The scintillation measurements were described in [17].

2.4. Thermoluminescence Properties

Thermally stimulated luminescence was recorded between 10 and 350 Kelvins at the National Institutes of Natural Sciences, Institute for Molecular Science, Okazaki, Japan. The liquid helium cryostat was used. Crystals were irradiated at the liquid helium temperature or room temperature with vacuum ultraviolet radiation with an energy of 12.4 eV. The heating rate was 1 K per second. In the thermally stimulated luminescence measurements between 350 and 760 Kelvins, the crystals were irradiated with vacuum ultraviolet radiation with an energy of 12.4 eV. The heating rate was 1 Kelvin per second. The measurements were performed with a Risø DA-15 TL reader (Risø DTU National Laboratory, Kongens Lyngby, Denmark).

3. Results and Discussion

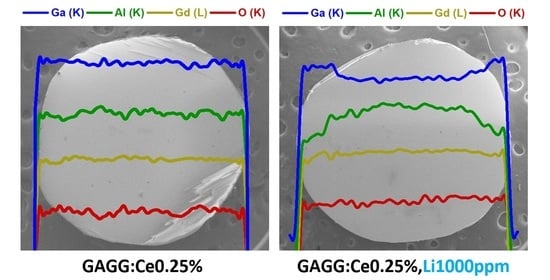
3.1. Impact of Li+ and Mg2+ on Atom Distribution and Crystal Phase by XRD and SEM-EDS Analysis

Figure 1 shows as-grown rods and polished cross-sectional plates of Li+ (1000 ppm) and Mg2+ (1000 ppm) co-doped Gd3Al2Ga3O12:Ce0.25% crystals. Each crystal shows a regular shape with a plain surface. This can indicate that the crystallization process was not disturbed by Li+ and Mg2+ co-doping. To minimize any concentration discrepancies resulting from atom segregation during crystal growth, the cross-section plates were cut from the same position in each crystal rod. Cross-sectional plates show good transparency throughout the surface.
Figure 2 shows the powder X-ray diffraction (PXRD) patterns for the Li+ and Mg2+ co-doped GAGG:Ce single crystals. The crystals show a pure garnet phase with an Ia-3d space group (No. 230). This confirms that both Li+ and Mg2+ ions enter the garnet structure and do not influence the thermodynamical stability of the garnet phase. The SEM-EDS technique is used to specify the changes in the cross-sectional distribution of atoms imposed by the co-doping with Li+ and Mg2+ ions.
Multielemental EDS mapping images and EDS elemental analysis for atom distribution analyses allow for a precise study of the impact of co-doping with Mg2+ and Li+ ions on the radial distribution of atoms in GAGG:Ce crystals. The EDS mapping images were recorded for Ga, Al, Gd, and O atoms. Whereas, EDS elemental analysis was performed for Ga, Al, and Gd atoms. The sensitivity of the EDAX detector is not sufficient for the precise detection of Mg2+, Li+, and Ce3+ ions. Hence, the EDS mapping images and EDS elemental analysis are not discussed for those elements. Figure 3a shows the EDS mapping images for Ce3+, Ce3+:Li+, and Ce3+:Mg2+ doped GAGG single crystals. The mapping of Ga, Al, Gd, and O atoms in the Ce3+ doped GAGG crystal confirms the elemental homogeneity in the entire cross section. The Li+ and Mg2+ co-doping significantly disturbed the distribution of the Ga and Al atoms, while the distribution of the Gd and O elements is unchanged. In both crystals, the EDS mapping images for the Al element show a dark shade on the crystal rim and a brighter shade on the crystal core, while the EDS mapping images for the Ga element show the opposite behavior (see Figure 3a). The brightening reflects an increase in the concentration of atoms, whereas the darkening is related to a decrease in the concentration of the element. Therefore, in both Li+ and Mg2+ co-doped GAGG:Ce crystals, the Ga atoms enrich the rim of the crystal, while the Al elements are concentrated in the core of the crystal. Furthermore, the EDS elemental mapping images show a distinct impact of the Ga and Al distribution imposed by the Li+ and Mg2+ co-doping. Specifically, in the Mg2+ co-doped sample, the crystal core enriched with Al has a smaller area and is brighter than in the Li+ co-doped crystal. This may suggest that Mg2+ co-doping reduces crystal uniformity to a greater extent than Li+ co-doping. To deeply understand such differences, it is necessary to compare and discuss the EDS elemental distribution of Al, Ga, and Gd atoms in all crystals; see Figure 3b and Table 1. The EDS elemental distribution is consistent with the EDS mapping images. In the GAGG:Ce:Li crystal, there is a slight gradient between the content of Ga and Al atoms in the crystal core and rim. The Mg2+ co-doping imposed a significantly stronger gradient between the content of Ga and Al atoms in the crystal core and rim. Furthermore, the variation in Ga and Al elements across the cross section is greater in Li+ co-doped samples than in the Mg2+ crystal. The radial variation in the Ga and Al atoms is complex and can be caused by a few effects. The first effect can be due to the process of the charge compensation mechanism. The crystal lattice to incorporate charge mismatching Li+ and Mg2+ ions needs to compensate for the charge imbalance to maintain crystal neutrality. As a result, Li+ and Mg2+ ions impose the formation of specific types of neutral Li+-based defects and neutral Mg2+-based defects [14,15,17,19]. These defect clusters violated configurational entropy [20]. This led to lattice distortion and triggered structural rearrangements [20]. Considering Al and Ga atoms in the tetrahedral and octahedral coordination, it is obvious that the smaller Al atoms prefer to segregate to the core and the larger Ga atoms to the crystal rim. It is believed that both Li+ and Mg2+ ions show low solubility because charge compensation is required. Consequently, segregations of Li+-based and Mg2+-based defect complexes to the crystal rim are inevitable. This enhances the perturbation of the host lattice and violates configurational entropy. As a result, the radial distribution of Al and Ga atoms changes significantly [21]. Additionally, the Marangoni melt flow, which happens at the melt’s outer surface in the molten zone, can strengthen this effect. Photoluminescence and scintillation analyses provide evidence of host lattice disturbance.

3.2. Optical and Photoluminescence Characterization under Synchrotron Radiation

Figure 4 shows the effect of Li+ and Mg2+ co-doping on the concentration of stable Ce3+ centers and the formation of stable Ce4+ ions. The absorption bands centered at 440 and 340 nm are attributed to the inter-configurational 4f→5d1 and 4f→5d2 transitions of stable Ce3+ ions [9,10]. The strong absorption intensity below 320 nm is related to the O2−→Ce4+ charge transfer transition (CTT), that is, electron transfer between the energy levels of the O 2p and Ce 4f energy levels [14]. Furthermore, the decrease in the absorption intensity of the 4f→5d1 transition is due to the reduction in the stable content of Ce3+ ions as a result of the Ce3+→Ce4+ conversion process [14]. The Li+ co-doping does not increase the absorbance intensity below 300 nm, but the opposite does, markedly decreasing its intensity. It should be noted that absorbance below 300 nm is frequently complex owing to the overlap of Ce3+-related absorption bands and various bands related to color and impurity centers [22,23]. Furthermore, Li+ co-doping reduces the absorbance intensities of the inter-configurational 4f→5d1 and 4f→5d2 transitions. This observation leads to two important conclusions: Li+ co-doping negligibly imposes the change in the valence state of Ce from +3 to +4 and changes the distribution of Ce3+ ions between the crystal core and rim. The sharp lines at 276–282 nm and 310–315 nm are attributed to the 8S7/26IJ and 8S7/26PJ absorption transitions within the Gd3+ ions, respectively [24].
Synchrotron radiation is a kind of spectroscopy that allows to study in the vacuum ultraviolet (VUV) spectral range. A special focus of VUV spectroscopy is the investigation of wide band-gap crystals for which the edge of the intrinsic absorption lies in the VUV spectral range. Therefore, SR spectroscopy is an excellent tool for the determination of host band gap energies (i.e., exciton creation energy). Figure 5a compares normalized VUV excitation spectra for Ce3+ emission centered at 540 nm in Ce3+, Ce3+:Li+, and Ce3+:Mg2+ doped GAGG single crystals, 300 K. Spectra were recorded using synchrotron radiation between 160 and 330 nm to precisely reveal the change in the edge of the host lattice imposed by co-doping with Li+ and Mg2+ ions. The spectra show different profiles depending on the co-doping ions. The excitation spectra for GAGG:Ce and GAGG:Ce,Li crystals show very similar shapes. The spectra consist of well-separated sets of absorption lines at 276–282 nm and 310–315 nm attributed to the Gd3+ 8S7/26IJ and 8S7/26PJ intra-configurational transitions, respectively [24]. The presence of Gd3+ absorption lines on the excitation spectra of Ce3+ luminescence points to efficient non-radiative energy transfers from the Gd sublattice toward the Ce3+ ions [24]. The broad absorption bands centered at 230 nm are most probably due to the inter-configurational 4f→5d3 absorption transition of Ce3+ ions [25]. The Mg2+ co-doped GAGG:Ce crystal shows significantly different excitation characteristics. In particular, the Gd3+ lines at 276–282 nm related to the 8S7/26IJ excitation transition are very weak. Furthermore, the 8S7/26PJ excitation transition at 310–315 nm is at the level of noise. The 4f→5d3 absorption transition of Ce3+ ions shows a very low intensity at 230 nm. The VUV excitation spectra revealed a different position of the fundamental valence-to-conduction band absorption of the host lattice (i.e., exciton creation energy). The fundamental edge of host lattice absorption is at (i) GAGG:Ce ~210 nm (5.90 eV); (ii) GAGG:Ce:Li ~207 nm (5.98 eV); and (iii) GAGG:Ce:Mg ~203 nm (6.01 eV). This shift in the host lattice edge towards higher energy can be due to the variation in the Al and Ga content in the crystal imposed by Li+ and Mg2+ co-doping [26]. It is worth mentioning that the substitution of Ga for Al significantly reduces the band gap [4]. In the Li+ and Mg2+ GAGG:Ce samples, the crystal core is enriched with Al elements (depleted with Ga atoms); therefore, the band gap energy is wider than that of the GAGG:Ce crystal. The Mg2+ co-doped GAGG:Ce sample shows a stronger gradient between the Ga and Al atoms in the crystal core area than in the Li+ co-doped GAGG:Ce sample. Therefore, the Mg2+ co-doped sample has the widest band-gap energy. The shift in the fundamental valence-to-conduction band absorption of the host lattice toward higher energy in Li+ and Mg2+ co-doped crystal is in contrast with elemental EDS mapping images and EDS elemental composition analysis; see Figure 3a,b and Table 1. The reduced intensity of the excitation lines of the Gd3+ ions and Ce3+ bands in the Mg2+ co-doped sample can be explained by considering crystal chemistry and the charge compensation mechanism. Specifically, Mg2+ co-doping efficiently transforms Ce3+ into Ce4+. As a consequence, the content of stable Ce3+ ions decreases significantly. This reduces the intensity of the Ce3+ 4f→5d3 absorption transition and hampers Gd3+→Ce3+ energy transfer [25]. Furthermore, the strong CT of stable Ce4+ below 350 nm overlaps with the energy levels of 6I (~275 nm) and 6P (310 nm) in Gd3+ ions. This can enable efficient energy transfer from Gd3+ ions to Ce4+, where energy is lost [25].
Figure 5b shows the excitation spectra for three single crystals. Excitation spectra were recorded for Ce3+ emission at 540 nm related to the inter-configurational 5d1→4f transition. The bands centered at 345 and 440 nm correspond to the inter-configurational 4f→5d2 and 4f→5d1 transitions of Ce3+ ions, respectively [4]. The excitation features below 330 nm are consistent with Figure 5a. The band located at 265 nm corresponds to the inter-configurational 4f→5d1 transition of Tb3+ ions [7]. The intensity of Tb3+ inter-configurational 4f→5d1 transition in Mg2+ and Li+ co-doped crystals is reduced, most probably because of a change in the Tb valence state from +3 to +4 [17]. The absorption strength of the Ce3+ 4f→5d2 excitation transition is significantly reduced in Li+ and Mg2+ co-doped crystals. The decrease in Ce3+ 4f→5d2 absorption strength can be due to two reasons. The first is the decrease in the concentration of stable Ce3+ ions. In Mg2+ co-doped crystal, this decrease is due to Ce3+→Ce4+ conversion [17,26]. In the case of the Li+ co-doped sample, this decrease is mainly due to the change in Ce3+ ions’ distribution between the crystal core and rim imposed by Li co-doping. The second reason could be due to the local distortion of CeO8 dodecahedra imposed by the formation of defect clusters to maintain crystal neutrality after co-doping with aliovalent Li+ and Mg2+ ions [15,17].
Figure 6a compares the emission spectra of GAGG:Ce and Li+ and Mg2+ co-doped GAGG:Ce single crystals excited at 200 nm, 300 K. The broad emission bands centered at 540 nm belong to the Ce3+ inter-configurational 5d1→4f transition. The lack of Gd3+ emission is due to the efficient energy transfer from the Gd sublattice to Ce3+ ions. Furthermore, owing to the higher temperature and stronger oscillations of the host lattice phonons, the Ce3+ inter-configurational 5d1→4f emission bands broaden. Therefore, the impact of Li+ and Mg2+ co-doping cannot be observed.
The impact of the Mg2+ and Li+ co-dopants on Ce3+ energy levels can be seen in the decay times of Ce3+ emission; see Figure 6b. The single exponential function was used to fit the experimental data according to Equation (1):
I(t) = Σ iIi exp[−t/τi] + B
where I—luminescence intensity, Ii—intensity at 0 ns, t—time, τi—decay time, and B—time-independent background intensity. Each decay curve was recorded under Ce3+ inter-configurational 4f→5d1 excitation at 450 nm. The decay constants vary depending on the co-doping ion. Li+ co-doping slightly decelerated the decay time to τLi+ = 58 ns, while Mg2+ co-doping slightly accelerated the decay constant to τMg2+ = 53 ns compared with the non-co-doped sample τCe3+ = 55 ns. This small change in the decay constants can be related to the radial fluctuation of the Ga and Al atoms (see Figure 3a,b and Table 1) as well as different defect structures (see Figure 7a,b).

3.3. Thermally Stimulated Luminescence Characteristics

The interband irradiation of the crystals at 10 K and 300 K allows the trapping of electrons and holes at different traps, leading to the creation of various electron and hole-type centers. The recombination of electrons and holes, thermally released from different electron traps, with the Ce3+ and Ce4+ centers results in the appearance of different peaks of the TSL glow curve. Figure 7a shows the TSL glow curves measured after irradiation at 10 K. Between 25 and 150 K, there is a complex structure of the most intense TSL peaks for the GAGG:Ce and GAGG:Ce,Li crystals. The intensity of this low-temperature peak is reduced by three and sixty times in Li+ and Mg2+ co-doped samples, respectively, compared with the GAGG:Ce crystal. Moreover, their variation in position and complex structure might be related to the radial fluctuation of the Al and Ga atoms [26]. This observation is in contrast with EDS elemental mapping and elemental composition analysis, VUV excitation spectra, and previous research in [26]. The decrease in intensity of the low-temperature glow peaks in GAGG:Ce3+ co-doped with Li+ and Mg2+ crystals is not related to the reduction in the content of shallow traps. Rather, Li+ and Mg2+ imposed defects, including Ce4+ centers, which compete more efficiently to capture electrons and holes with shallow trapping centers [15,17,26]. Furthermore, Li+ co-doping imposed the formation of a new broad peak around 310 K [14]. This trap can be responsible for the deceleration of the scintillation decay time and a slight increase in LY. The charge carriers captured in this trap can be released around room temperature and radiatively recombine with the Ce3+/Ce4+ centers, increasing the LY value. The co-doping of Mg2+ ions formed a new broad TSL glow peak around 280 K [14].
The TSL glow curves obtained after interband irradiation at 300 K are presented in Figure 7b. The TSL glow curves show very similar profiles, with different intensities and slightly different positions. Li+ co-doping slightly reduces the intensity of the peaks at ~370 K; however, it significantly increases the intensities of the peaks at 430 and 530 K, corresponding to the non-co-doped GAGG:Ce crystal. In contrast, Mg2+ co-doping markedly decreases the intensities of these TSL glow peaks. The increase in TSL intensity in the higher temperature range can be imposed by the formation of oxygen vacancies (VO••) for the excess negative (−2) charge compensation induced by Li+ [14,15]. This indicates a similar origin of the corresponding traps in all of the crystals. The TSL glow peaks <200 K can be related to shallow antisite defects [26]. Their slightly different positions in different crystals can be caused by different Ga3+ contents, as SEM-EDS multi-elemental analysis (Figure 3) and excitation spectra (Figure 5a), as well as previous research, suggest [14,17,26]. Peaks centered at 305 K and 265 K, which are absent in the GAGG:Ce crystal, could arise from the intrinsic defects associated with Li+ and Mg2+ ions, respectively [15,26]. The lower-temperature part of the 265 K peak in the Mg2+ co-doped sample can arise from a hole trapped at an oxygen ion located close to the Mg2+ ion (MgGaOO)x-type hole center [17,26]. The peak around 305 K in the Li+ co-doped sample may originate from the thermal release of holes from the (LiGdOO)′ centers [15]. The peak around 370 K, presented in all samples, is most probably connected to a single oxygen vacancy [26]. Peaks above 370 K can arise from both intrinsic defects and the electron and hole centers perturbed by Li+ and Mg2+ ions (for example, antisite defects and O type hole centers [14,15,26]). The strong decrease in the intensity of TSL in the Mg2+ co-doped GAGG:Ce is because of electron recombination with Ce4+ centers, which results in the release of photons, and recombination with Mg2+ defect clusters, which results in the release of phonons (i.e., Mg2+ defect clusters operate as quenching centers) [17,26]. These data indicate that the distribution of electrons and holes between traps in GAGG:Ce crystals depends on the Li+ and Mg2+ co-dopants [15,26].

3.4. Scintillation Characteristics

Ionization radiation (X-ray or γ-ray) can penetrate matter deeply thanks to its high penetration power. An important byproduct of ionizing radiation in solids is that electrons and holes are frequently trapped at lattice sites. Depending on the depth of the trap sites, the electron or hole may either recombine rapidly, giving a prompt luminescence or be trapped for an extended period, even many years. The release of these electrons and holes can yield delayed luminescence recombination. Moreover, the radiative recombination of electrons and holes can reveal all luminescence centers in the host lattice. The radioluminescence spectra of Ce3+, Ce3+:Li+, and Ce3+:Mg2+ doped GAGG single crystals are shown in Figure 8. The bands centered around 550 nm correspond to the inter-configurational 5d1→4f transition in Ce3+ ions. After co-doping with Li+ and Mg2+, no extra luminescence is seen. This result shows that both Li+ and Mg2+ ions do not impose additional defect-related centers that can radiatively recombine.
The kinetics of scintillation decay offers important information on defect centers and their impact on scintillation parameters. The high dynamic ranges and timing of the decay experiments allow for precise convolution of the experimental curve and simultaneous replication of the rapid and slow components. The decay curves for Ce3+, Ce3+:Li+, and Ce3+:Mg2+ doped GAGG single crystals are shown in Figure 9a. The decay curves are approximated by a double exponential function, which corresponds to radiative recombination at the Ce3+ and Ce4+ centers. Table 2 summarizes the decay constants calculated from an experimental data fit. The scintillation decays and pulse-height spectra (see Figure 9b) show the distinct influence of Li+ and Mg2+ co-doping on the scintillation properties. The Li+ co-doping markedly decelerates the scintillation response and increases the light yield values; see Table 2. The Li+-related defect can rather slowdown the e–h transport toward the Ce3+ and Ce4+ emission centers than provide quenching channels. This slowdown can be related to the appearance of the defect structure around 310 K; see Figure 7a. As a result, the charge carriers can temporarily be captured in this trap and, after some time, released back to the conduction band and delivered to the Ce3+/Ce4+ luminescence centers (i.e., delayed radiative recombination). Furthermore, the small content of Ce4+ luminescence centers could increase LY. On the contrary, Mg2+ co-doping significantly accelerated the scintillation response and reduced LY. This can be due to the formation of Mg2+-based defect clusters [17]. Another reason is the decrease in the efficiency of Gd3+→Ce3+ energy transfer [25]. This is caused by the decrease in the stable content of Ce3+ ions due to the Ce3+→Ce4+ conversion and the energy loss imposed by energy transfer from the Gd3+ sublattice to the non-luminescent charge transfer absorption transition of Ce4+ [25].

4. Conclusions

The experimental data presented in this investigation revealed that Ga and Al sublattices are very sensitive to the local distortion of the host lattice imposed by the incorporation of incompatible substituents. Incompatible in size and charge, Li+ and Mg2+ substituents violated configurational entropy. This led to lattice distortion and triggered structural rearrangements. As a result, both Li+ and Mg2+ co-dopants significantly depleted the crystal core in Ga atoms, at the same time enriching it with Al elements. The radial fluctuation of the Ga and Al elements was revealed by EDS elemental mapping and elemental composition analysis. Further evidence was observed by the shift of the fundamental host lattice edge (exciton creation energy) toward a higher energy in the VUV excitation spectra recorded with synchrotron radiation. The local host lattice disturbance was shown by the PL data. Scintillation and TSL data showed that Mg2+ ions imposed rather defect/defect clusters that acted as quenching centers, while Li+ defect clusters increased the content of deep host lattice defects. These observations showed the distinct impact of the co-doping of Li+ and Mg2+ ions on defect formation processes, atom distribution, and changing the cerium valence state from +3 to +4.

Funding

This work was supported by the National Science Center Poland (NCN) No.: 2020/39/D/ST3/02711.

Institutional Review Board Statement

Not applicable.

Informed Consent Statement

Not applicable.

Data Availability Statement

Not applicable.

Conflicts of Interest

The author declares no conflict of interest.

References

  1. Xia, Z.; Liu, Q. Progress in Discovery and Structural Design of Color Conversion Phosphors for LEDs. Prog. Mater. Sci. 2016, 84, 59–117. [Google Scholar] [CrossRef]
  2. Massey, G.A.; Yarborough, J.M. High Average Power Operation and Nonlinear Optical Generation with the Nd:YALO3laser. Appl. Phys. Lett. 1971, 18, 576–579. [Google Scholar] [CrossRef]
  3. Struve, B.; Huber, G.; Laptev, V.V.; Shcherbakov, I.A.; Zharikov, E.V. Tunable Room-Temperature Cw Laser Action in Cr3+: GdScGa-Garnet. Appl. Phys. B 1983, 30, 117–120. [Google Scholar] [CrossRef]
  4. Nikl, M.; Yoshikawa, A. Recent R&D Trends in Inorganic Single-Crystal Scintillator Materials for Radiation Detection. Adv. Opt. Mater. 2015, 3, 463–481. [Google Scholar] [CrossRef]
  5. Kanke, Y.; Navrotsky, A. A Calorimetric Study of the Lanthanide Aluminum Oxides and the Lanthanide Gallium Oxides: Stability of the Perovskites and the Garnets. J. Solid State Chem. 1998, 141, 424–436. [Google Scholar] [CrossRef]
  6. Xia, Z.; Meijerink, A. Ce3+-Doped Garnet Phosphors: Composition Modification, Luminescence Properties and Applications. Chem. Soc. Rev. 2017, 46, 275–299. [Google Scholar] [CrossRef] [Green Version]
  7. Bartosiewicz, K.; Babin, V.; Beitlerova, A.; Bohacek, P.; Jurek, K.; Nikl, M. The Temperature Dependence Studies of Rare-Earth (Dy3+, Sm3+, Eu3+ and Tb3+) Activated Gd3Ga3Al2O12 Garnet Single Crystals. J. Lumin. 2017, 189, 126–139. [Google Scholar] [CrossRef]
  8. Ueda, J.; Miyano, S.; Tanabe, S. Formation of Deep Electron Traps by Yb3+ Codoping Leads to Super-Long Persistent Luminescence in Ce3+-Doped Yttrium Aluminum Gallium Garnet Phosphors. ACS Appl. Mater. Interfaces 2018, 10, 20652–20660. [Google Scholar] [CrossRef]
  9. Kamada, K.; Yanagida, T.; Endo, T.; Tsutumi, K.; Usuki, Y.; Nikl, M.; Fujimoto, Y.; Fukabori, A.; Yoshikawa, A. 2inch Diameter Single Crystal Growth and Scintillation Properties of Ce:Gd3Al2Ga3O12. J. Cryst. Growth 2012, 352, 88–90. [Google Scholar] [CrossRef]
  10. Sibczynski, P.; Iwanowska-Hanke, J.; Moszyński, M.; Swiderski, L.; Szawłowski, M.; Grodzicka, M.; Szczęśniak, T.; Kamada, K.; Yoshikawa, A. Characterization of GAGG:Ce Scintillators with Various Al-to-Ga Ratio. Nucl. Instrum. Methods Phys. Res. A 2015, 772, 112–117. [Google Scholar] [CrossRef]
  11. Lucchini, M.T.; Babin, V.; Bohacek, P.; Gundacker, S.; Kamada, K.; Nikl, M.; Petrosyan, A.; Yoshikawa, A.; Auffray, E. Effect of Mg2+ Ions Co-Doping on Timing Performance and Radiation Tolerance of Cerium Doped Gd3Al2Ga3O12 Crystals. Nucl. Instrum. Methods Phys. Res. A 2016, 816, 176–183. [Google Scholar] [CrossRef]
  12. Auffray, E.; Augulis, R.; Fedorov, A.; Dosovitskiy, G.; Grigorjeva, L.; Gulbinas, V.; Koschan, M.; Lucchini, M.; Melcher, C.; Nargelas, S.; et al. Excitation Transfer Engineering in Ce-Doped Oxide Crystalline Scintillators by Codoping with Alkali-Earth Ions. Phys. Status Solidi 2018, 215, 1700798. [Google Scholar] [CrossRef]
  13. Lucchini, M.T.; Gundacker, S.; Lecoq, P.; Benaglia, A.; Nikl, M.; Kamada, K.; Yoshikawa, A.; Auffray, E. Timing Capabilities of Garnet Crystals for Detection of High Energy Charged Particles. Nucl. Instrum. Methods Phys. Res. A 2017, 852, 1–9. [Google Scholar] [CrossRef]
  14. Zazubovich, S.; Laguta, V.V.; Machek, P.; Kamada, K.; Yoshikawa, A.; Nikl, M. Effect of Li+ Co-Doping on the Luminescence and Defects Creation Processes in Gd3(Ga,Al)5O12:Ce Scintillation Crystals. J. Lumin. 2022, 242, 118548. [Google Scholar] [CrossRef]
  15. Laguta, V.; Buryi, M.; Babin, V.; Machek, P.; Zazubovich, S.; Bartosiewicz, K.; Kurosawa, S.; Yamaji, A.; Yoshikawa, A.; Uličná, K.; et al. Li+ Incorporation and Defect-Creation Processes Imposed by X-Ray and UV Irradiation in Li-Codoped Y3Al5O12:Ce Scintillation Crystals. J. Mater. Chem. C Mater. Opt. Electron. Devices 2023, 11, 1346. [Google Scholar] [CrossRef]
  16. Yoshino, M.; Bartosiewicz, K.; Horiai, T.; Kamada, K.; Yamaji, A.; Shoji, Y.; Yokota, Y.; Kurosawa, S.; Ohashi, Y.; Sato, H.; et al. Relationship between Li/Ce Concentration and the Luminescence Properties of Codoped Gd3 (Ga, Al)5O12:Ce. Phys. Status Solidi B Basic Res. 2020, 257, 1900504. [Google Scholar] [CrossRef]
  17. Bartosiewicz, K.; Markovskyi, A.; Horiai, T.; Szymański, D.; Kurosawa, S.; Yamaji, A.; Yoshikawa, A.; Zorenko, Y. A Study of Mg2+ Ions Effect on Atoms Segregation, Defects Formation, Luminescence and Scintillation Properties in Ce3+ Doped Gd3Al2Ga3O12 Single Crystals. J. Alloys Compd. 2022, 905, 164154. [Google Scholar] [CrossRef]
  18. Bartosiewicz, K.; Babin, V.; Kamada, K.; Yoshikawa, A.; Kurosawa, S.; Beitlerova, A.; Kucerkova, R.; Nikl, M.; Zorenko, Y. Ga for Al Substitution Effects on the Garnet Phase Stability and Luminescence Properties of Gd3GaxAl5-XO12:Ce Single Crystals. J. Lumin. 2019, 216, 116724. [Google Scholar] [CrossRef]
  19. Babin, V.; Herman, P.; Kucera, M.; Nikl, M.; Zazubovich, S. Effect of Mg2+ Co-Doping on the Photo- and Thermally Stimulated Luminescence of the (Lu,Gd)3(Ga,Al)5O12:Ce Epitaxial Films. J. Lumin. 2019, 215, 116608. [Google Scholar] [CrossRef]
  20. Song, Z.; Zhou, D.; Liu, Q. Tolerance Factor and Phase Stability of the Garnet Structure. Acta Crystallogr. C Struct. Chem. 2019, 75 Pt 10, 1353–1358. [Google Scholar] [CrossRef]
  21. Sickafus, K.E.; Melcher, C.L.; Flynn-Hepford, M.I.; Wang, Y.; Jaroslaw, G.; Smith, J.P.; Drewry, S.M.; Zhuravleva, M. Crystal Chemistry of Rare-Earth Containing Garnets: Prospects for High Configurational Entropy. J. Solid State Chem. 2022, 310, 122997. [Google Scholar] [CrossRef]
  22. Wong, C.M.; Rotman, S.R.; Warde, C. Optical Studies of Cerium Doped Yttrium Aluminum Garnet Single Crystals. Appl. Phys. Lett. 1984, 44, 1038–1040. [Google Scholar] [CrossRef]
  23. Tanner, P.A.; Fu, L.; Ning, L.; Cheng, B.-M.; Brik, M.G. Soft Synthesis and Vacuum Ultraviolet Spectra of YAG:Ce3+ nanocrystals: Reassignment of Ce3+ energy Levels. J. Phys. Condens. Matter 2007, 19, 216213. [Google Scholar] [CrossRef]
  24. Bartosiewicz, K.; Babin, V.; Kamada, K.; Yoshikawa, A.; Nikl, M. Energy Migration Processes in Undoped and Ce-Doped Multicomponent Garnet Single Crystal Scintillators. J. Lumin. 2015, 166, 117–122. [Google Scholar] [CrossRef]
  25. Khanin, V.; Venevtsev, I.; Chernenko, K.; Pankratov, V.; Klementiev, K.; van Swieten, T.; van Bunningen, A.J.; Vrubel, I.; Shendrik, R.; Ronda, C.; et al. Exciton Interaction with Ce3+ and Ce4+ Ions in (LuGd)3(Ga,Al)5O12 Ceramics. J. Lumin. 2021, 237, 118150. [Google Scholar] [CrossRef]
  26. Babin, V.; Bohacek, P.; Grigorjeva, L.; Kučera, M.; Nikl, M.; Zazubovich, S.; Zolotarjovs, A. Effect of Mg2+ Ions Co-Doping on Luminescence and Defects Formation Processes in Gd3(Ga,Al)5O12:Ce Single Crystals. Opt. Mater. 2017, 66, 48–58. [Google Scholar] [CrossRef]
Figure 1. As-grown rods of Li+ and Mg2+ co-doped GAGG:Ce with polished radial plates cut 5 mm away from the seed end of the crystals.
Metals 13 00422 g001
Figure 2. The powder XRD patterns for Li+ and Mg2+ co-doped GAGG:Ce 0.25% single crystals, 300 K.
Metals 13 00422 g002
Figure 3. (a) Multielemental EDS mapping images for oxygen (O), gadollinium (Gd), aluminium (Al), and gallium (Ga) atoms, and (b) SEM images of radial plates along with marked spots of EDS elemental analysis in Li+ and Mg2+ co-doped GAGG:Ce crystals, 300 K. Green crosses with numbers represent the locations of the EDS composition measurements.
Metals 13 00422 g003
Figure 4. Absorption spectra of Li+:Ce3+ and Mg2+:Ce3+ doped GAGG crystals, 300 K.
Metals 13 00422 g004
Figure 5. (a) Vacuum UV excitation spectra for Ce3+ emission at 540 nm (2.29 eV) measured using synchrotron radiation between 160 and 330 nm; (b) excitation spectra for Ce3+ emission measured using Xe lamp radiation between 200 and 510 nm for Ce3+, Ce3+:Li+, and Ce3+:Mg2+ doped GAGG single crystals, 300 K.
Metals 13 00422 g005
Figure 6. (a) Emission spectra excited with synchrotron radiation with an energy of 200 nm (6.20 eV); (b) photoluminescence decay kinetic curves for the Ce3+ emission (λexc = 450 nm, λemi = 540 nm) in Ce3+, Ce3+:Li+, and Ce3+:Mg2+ doped GAGG single crystals, 300 K.
Metals 13 00422 g006
Figure 7. Thermoluminescence glow curves of as-grown GAGG:Ce, GAGG:Ce,Li, and GAGG:Ce,Mg single crystals after UV irradiation (12.40 eV) at (a) 10 K and recorded between 10 and 350 K; (b) irradiated at 300 K and measured between 350 and 670 K.
Metals 13 00422 g007
Figure 8. Radioluminescence spectra of Ce3+, Ce3+:Li+, and Ce3+:Mg2+ doped GAGG single crystals, 300 K.
Metals 13 00422 g008
Figure 9. (a) Scintillation decay curves and (b) pulse-height spectra for Ce3+, Ce3+:Li+, and Ce3+:Mg2+ doped GAGG single crystals under γ-rays excitation from the 137Cs radioisotope (662 keV), 300 K.
Metals 13 00422 g009
Table 1. EDS elemental analysis of the crystal rim and core for Li+:Ce3+ and Mg2+:Ce3+ doped GAGG crystals, 300 K.
CrystalAl at.% (Kα X-ray)/Number of Atoms Ga at.% (Kα X-ray)/Number of AtomsGd at.% (Lα X-ray)/Number of Atoms
RimCoreRimCoreRimCore
GAGG:Ce3+ 0.25%25.89/2.07 26.21/2.1037.13/2.9736.89/2.9536.98/2.9636.90/2.95
GAGG:Ce3+ 0.25%,
Li+ 1000 ppm
24.93/1.9928.05/2.2438.07/3.0535.03/2.8037.00/2.9636.92/2.95
GAGG:Ce3+ 0.25%,
Mg2+ 1000 ppm
23.25/1.8628.83/2.4139.86/3.1934.11/2.7336.89/2.9537.06/2.96
Table 2. Scintillation decay constants and light yield values (shaping time 2 μs) for Ce3+, Ce3+:Li+, and Ce3+:Mg2+ doped GAGG single crystals under γ-ray excitation from 137Cs radioisotope (662 keV), 300 K.
SampleScintillation Decay ConstantsLight Yield (Phot/1 MeV) [2 μs]
τ1 [ns]/%τ2 [ns]/%
GAGG:Ce3+ 0.25%50/61225/3931,500 ± 1100
GAGG:Ce3+ 0.25%,
Li+ 1000 ppm
58/89240/1133,200 ± 1400
GAGG:Ce3+ 0.25%,
Mg2+ 1000 ppm
19/4280/5821,500 ± 800
Disclaimer/Publisher’s Note: The statements, opinions and data contained in all publications are solely those of the individual author(s) and contributor(s) and not of MDPI and/or the editor(s). MDPI and/or the editor(s) disclaim responsibility for any injury to people or property resulting from any ideas, methods, instructions or products referred to in the content.

