Article

Linear Thermal Expansion and Specific Heat Capacity of Cu-Fe System Laser-Deposited Materials

by
Konstantin I. Makarenko
1,*,
Oleg N. Dubinin
1,2 and
Igor V. Shishkovsky
1
1
Center for Materials Technologies, Skolkovo Institute of Science and Technology, 121205 Moscow, Russia
2
World-Class Research Center «Advanced Digital Technologies», Saint Petersburg State Marine Technical University, 190121 Moscow, Russia
*
Author to whom correspondence should be addressed.
Metals 2023, 13(3), 451; https://doi.org/10.3390/met13030451
Submission received: 26 January 2023 / Revised: 12 February 2023 / Accepted: 19 February 2023 / Published: 22 February 2023
(This article belongs to the Special Issue The State of the Art in Functionally Graded Materials)

Abstract

:
The coefficient of linear thermal expansion and the specific heat capacity of laser-deposited Cu-Fe alloys fabricated from tin, aluminum, chromium bronze (89–99 wt.% Cu), and SS 316L were studied. The investigated alloys had a 1:1 and a 3:1 bronze–steel ratio. The Al–bronze-based alloy showed the lowest value of linear thermal expansion coefficient: (1.212 ± 0.095)∙10−5 K−1. Contrarily, this value was the highest {[(1.878–1.959) ± 0.095]∙10−5 K−1} in the case of functionally graded parts created from alternating layers of bronze and steel. Differential scanning calorimetry provided experimental results about the specific heat capacity of the materials. In the case of Al–bronze-based specimens, it demonstrated a decrease in the specific heat capacity until ~260 °C and its further increase during a heating cycle. Exothermic peaks related to polymorphic transformations were observed in the Al–bronze-based specimens. Cooling cycles showed monotonous behavior for specific heat capacities. It had exothermic peaks in the case of Cr–bronze-based alloys. A Lennard-Jones potential equation was used for testing the relation between heat capacity and thermal expansion. A three-way interaction regression model validated the results and provided the relative thermal expansion of commercially pure DED-fabricated SS 316L. Its specific heat capacity was also studied experimentally and was 15–20% higher in comparison to the traditional method of production.

1. Introduction

Direct energy deposition (DED) is a reliable additive manufacturing technology [1,2,3], which allows the rapid accurate fabrication of parts with complicated geometry from a single material or several materials simultaneously without assembly operations [4,5,6]. Mentioned aspects are common advantages of overall additive manufacturing over conventional technologies [7]. These advantages are primarily provided by a layer-by-layer fabrication method and a high-resolution laser beam. The DED is widely used for producing new parts and repairing broken ones including the case of dissimilar materials [7]. This technology provides various applications, which can change parts’ properties by varying process parameters and reduce rheological instability [7]. Metallurgical issues such as residual stresses and cracks between dissimilar materials fabricated by the DED can be eliminated by various technological approaches [8]. They include making transitional areas in FGMs and performing post-treatment techniques [9].
Quasi-homogeneous alloys and functionally graded materials (FGMs) of the Cu-Fe system fabricated by the DED are very prospective for many practical applications. These materials combine the heat conductivity, thermal expansion, oxidation, and frictional resistance of bronze [10,11,12] with the mechanical strength, creep, and corrosion resistance of steel [13]. Hence, they are applied in aerospace, nuclear power plants (NPPs), steam turbine plants (STPs), and electronic component production [12,13,14]. The mentioned applications are commonly related to working in high-temperature conditions and conditions with rapidly changing temperatures. Therefore, the thermophysical characteristics of Cu-Fe laser-deposited materials (especially thermal expansion, heat capacity, heat conductivity, and thermal diffusivity) are essential to study specifically by experimental, analytical, and numerical methods. These characteristics play a significant role in developing and designing new 3D-printed materials. Today’s literature on the Cu-Fe system’s DED includes a poor amount of data attributed to this topic. Thermophysical characteristics of SS 316L and bronzes fabricated only by traditional methods were discussed in [15,16]. P. Hidnert [13] studied the CLTE of different kinds of bronzes (tin-zinc, leaded, aluminum, and silicon). P. Pichler et al. [15] precisely determined the thermophysical properties of SS 316L, including specific heat capacity, specific enthalpy, and thermal expansion. Still, there were a limited number of studies on the thermophysical properties of DED-fabricated Cu-Fe alloys [17]. Additionally, there are no studies today discussing the dependence between CLTE and the specific heat capacity of heterogeneous 3D-printed Cu-Fe alloys.
Differential scanning calorimetry (DSC) is a thermal analysis technique that measures the energy absorbed or released by a sample as a function of temperature or time [18] thus describing the thermophysical properties and phase transitions of various materials. In the current paper, the specific heat capacities of eight different laser-deposited Cu-Fe alloys were experimentally determined by DSC for both heating and cooling cycles. The CLTE of the mentioned materials was also empirically studied and compared with the characteristics of pure metals and their theoretically estimated values. The relationship between the energy of solid and mean interatomic distance, considering the Lennard-Jones potential derivative, provided an analysis of the correlation between CLTE and specific heat capacity. The experimental approach was verified by studying the parameters of commercially pure SS 316L using two different methods, including a three-way interaction regression numerical model. This model considered laser processing parameters to determine the CLTE of the deposited alloy.

2. Materials and Methods

2.1. Design of Experiment, Materials, and Set of Specimens

The experiment was aimed at the study of the DED-fabricated quasi-homogeneous alloys and sandwich structures of the Cu-Fe system. They were the object of interest because they could be implemented both by themselves and as transitional zones in FGMs [5,19,20,21,22,23] including the Cu-Fe system. Three common types of these structures were investigated in the research:
  • The first type—50 wt.% SS 316L + 50 wt.% bronze;
  • The second type—25 wt.% SS 316L + 75 wt.% bronze;
  • The third type—a multilayer gradient steel–bronze structure.
Simultaneous powder feed fabricated the 1st and the 2nd types. Alternated 250-μm-width layers created the 3rd type. The CLTEs of all materials were studied experimentally, analytically, and by the methods of numerical simulation. The specific heat capacity was investigated experimentally. The results were validated by the comparison of the proportionality factor A, evaluated by two methods from Grüneisen’s law.
The experimental specimens were built on a base of four materials, which were prospective for the fabrication of Cu-Fe FGMs [23]:
  • Stainless steel (SS) 316L–5520 (fraction 50–150 μm) manufactured by Höganäs Belgium SA;
  • Aluminum bronze, similar to UNS C61800 (fraction 45–125 μm), manufactured by Polema JSC (Tula, Russia);
  • Tin bronze, similar to the copper-tin alloy CuSn10-B/CB480K, (fraction 100–140 μm) manufactured by Polema JSC (Tula, Russia);
  • Chromium bronze, similar to UNS C18400 chromium copper, (fraction 63–125 μm) manufactured by Polema JSC (Tula, Russia).
Table 1 presents the chemical compositions of bronzes. The chemical composition of SS 316L is well-known and can be found in [24].
  • Therefore, 8 groups of parts were fabricated in total (the alloy of alternating layers of tin bronze and SS 316L was excluded from consideration because it showed poor laser manufacturability and did not obtain an appropriate shape during the fabrication because of low heat consumption and poor adhesion of Sn bronze and steel). The study [23] approved this methodology and tested this set of groups (Table 2). It discussed the applicability of these alloys as transitional zones of Cu-Fe FGMs fabricated via the gradient path method and the alternating layers technique [23]. Additionally, commercially pure SS 316L was studied to validate the model and results in the current research.

2.2. Operation Conditions of DED

  • The MX-1000 (InssTek, Daejeon, Republic of Korea) technological installation conducted DED in direct tooling mode [24]. In this mode, the laser power varied from low to high depending on the distance between a laser head and a melt pool. A 1 kW ytterbium fiber laser was the source of laser radiation. The scanning speed of all groups was 0.85 m/min. Gas flow rates amounted to: coaxial gas—0.85 L/min; powder gas—2.0 L/min; shield gas—10.0 L/min. Other fabrication conditions could be found in [23]. The geometrical parameters of the deposited powder beds were: bed height—300 μm; layer thickness—250 μm; bed width—800 μm; hatch spacing—300 μm.

2.3. Experimental Measurement of CLTE

CLTE was experimentally estimated using a heating plate and a hand caliper with 0.01 mm of uncertainty. Each part underwent 10 measurements of its length and width on a separate pair of prepared surfaces. A commercially pure DED-fabricated SS 316L part was analyzed by this method too. The heating cycle was from +21 (the initial temperature was equal to the room temperature) to +220 , respectively. The maximum temperature was lower than that of low-temperature bronze annealing. It was also significantly lower than the Curie temperature Tc of the SS 316L alloy. Heating over the Curie temperature significantly changes the trend of CLTE due to changes in the material’s magnetic properties [25]. The accuracy of a single CLTE calculation was estimated to be no worse than ±3·10−6 K−1. Therefore, the uncertainty of the arithmetic mean is
α B r S S = ± 3 · 10 6 / 10 ± 9.5 · 10 7 ,
where «10» was a number of calculations. Subsequent research can optimize this uncertainty via more precise measurement methods and equipment.

2.4. Analytical Estimation of CLTE

A simple rule-of-mixtures Equation (2) [26,27] analytically estimated the 1st-approximation-dependence between CLTE and concentration of bronze and steel in the alloy:
α B r S S = i α i · V i = N B r N · α B r + N S S N · α S S ,
where V i denoted a volume fraction of each binary alloy component; N B r , % was a percentage of the bronze, N S S —of stainless steel, N = 100 % , α B r and α S S were the CLTE of pure bronze and pure stainless steel, respectively. This formula did not account for the appearance of new phases following 3D printing, which had CLTE that was different from the initial materials. It also did not consider a variation in the porosity in the parts. These parameters, if necessary, can be taken into account for more precise calculations.
In the temperature range of 0–100 , αss     1.60·10−5 K−1 [28]; α B r A l 1.68 · 10 5 K−1 [28] (aluminum bronze); α B r C r 1.65 · 10 5 K−1 [28] (chromium bronze);   α B r S n 1.80 · 10 5 K−1 [29] (tin bronze). Here, αss, α B r S n , α B r A l , and α B r C r were relevant to these materials created via traditional manufacturing methods. An analytical estimation method for the 3D-printed material is provided below in this Section 2.5. The calculations considered that CLTE in the whole range from 21 . to 220 did not depend on the temperature. In general, this dependence existed and had a substantially complex form. Each binary intermetallic compound of the laser-deposited alloy could be expressed as a sum of αlat + αel + αmag [30], and α l a t   ~   T 3 was a lattice contribution. α l a t could be described in terms of the Debye theory. It became temperature independent at a level approximately above the Debye temperature. α e l   ~   T was an electronic contribution. α m a g was a magnetic contribution. α m a g was temperature-independent in the paramagnetic range and tended to zero above the Curie temperature.
For 50/50 alloys (Groups 1–3) N B r = N S S = 50%; for 75/25 alloys (Groups 4–6) N B r 75 %; N S S 25 %. In the case of alternating layer gradient structures (Groups 7–8), CLTE was also gradient. The dependence between α and the vertical coordinate z μm was defined using the modified form of the rule of mixture [27,31]:
α ( z ) = V ( z ) · α 1 + ( 1 V ( z ) ) · α 2 ,
where V(z) was a volume fraction of constituents (SS, bronze), which obeyed a piecewise-defined function (4):
V ( z ) = { 1 ,   if   500 · n < z < 250 · ( 2 · n + 1 ) , 0 ,   if   250 · ( 2 · n + 1 ) < z < 500 · ( n + 1 ) , n = 0 ,   1 ,   2 ,   3 ,     149 .
Within the certain neighborhoods of the irregular points z = 250∙n, the behavior of the function depended on the phase composition at the interface areas between steel and bronze. Most of all, it depended on the formation of intermetallic phases. If the shrinkage caused by the permeation of each sequential layer into the previous one and their partial intermixing were also considered, the V(z) equation would take on a more complicated form. However, the volume-mean average CLTE of FGMs in Groups 7 and 8 could still be estimated using Equation (2) under the assumption of N B r = N S S = 50% (same as for Groups 1–3).

2.5. Numerical Analysis of the Dependence between Thermal Expansion, Temperature, and Laser Treatment Parameters

Minitab software (Minitab Ltd., Coventry, UK) analyzed the dependence between CLTE and temperature. Parameters of PC: CPU—Intel® Core™ i7-7700HQ 2.81 GHz. RAM: 16.0 GB. OS: Windows x64. M. Yakout et al. [25] previously discussed the dependence between the CLTE, temperature, and parameters of the laser treatment regarding the pure 3D-printed SS 316L. The authors developed a three-way interaction regression model using Minitab and applied it to selective laser melting (SLM). This model provided accurate results for the DED process, too. According to it, the relative thermal expansion ε T , [μm/m] for T 279   [25] was calculated for SS 316L using the following Equations (5)–(8):
ε T = a · T 2 + b · T + c ;  
a = 0.009714 ;
b = 16.954 0.00577 · P 14.98 · h + 0.0599 · P · h ;
c = 452 3.557 · P 1.350 · v 6925 · h 0.001838 · P 2 10   399 · h 2 + + 0.005893 · P · v + 40.28 · P · h + 11.47 · v · h 0.05238 · P · v · h .
Here, P, v , and h were processing parameters. P was laser power, W; v was scanning speed, mm/s; h was hatch spacing, mm. In our case, h = 0.3 mm, Paverage = 308 W, and v = 0.85 m/min 16.67 mm/s. P, v , and h were independent variables, P2, v 2, and h2 were two-way interactions, T and T2 were the temperature variables, and P·T, v ·T, h·T, P·   v ·T, P·h·T were the interaction terms. According to [25], this model was accepted as statistically significant and had a standard deviation of S = 9.64627, coefficient of determination R2 = 99.99%, and the predicted residual error sum of squares PRESS = 11,785.3.
Equations (9) and (10) could be used to calculate CLTE from relative thermal expansion ε T :
α ( T ) = 1 L · d L d T ,  
d ε T = d L L .
The resulting Expression (11) provided the desired relation between CLTE and temperature:
α ( T ) = d ε T d T .

2.6. Measurement of Specific Heat Capacity

Netzsch DSC 214 Polyma (NETZSCH Group, Selb, Bavaria, Germany) measured the specific heat capacity of fabricated materials (8 groups + commercially pure SS 316L). They were prepared as metal shavings and pressurized with a force of 700 kg × s. A single metal «tablet» had 25 mg mass and 4 mm diameter. The mass of the specimens did not change after the experiments. Each tablet was heated from 40 to 300 at a speed of 10 /min. The measuring chamber was purged by nitrogen. Aluminum pans were used for the experiments. The precision of heat capacity measurements according to the instrument’s datasheet was ± 2.5%.

2.7. Study of the Dependence between CLTE and Heat Capacity

V.A. Drebushchak and A.I. Turkin [32] investigated the relation between linear thermal expansion and heat capacity using the relation between the energy of a solid (E) and the mean interatomic distance (R):
C p = α · R · d E d R ,  
where Cp is a constant pressure heat capacity, α—CLTE.
The values of R(dE/dR) derived from the equation of Lennard-Jones potential U(R):
U ( R ) = U 0 · ( 2 · ( R 0 R ) 6 + ( R 0 R ) 12 ) ,  
provided the sought dependence:
α ( T ) = 2 A · U 0 · C p ( T ) ,  
which was valid for copper and other substances with metal interaction types between atoms [32]. This dependence allowed the estimation of a proportionality factor A between CLTE and heat capacity. In (14), U0 was a heat (enthalpy) of sublimation at a temperature T = 0 (it equaled 337 kJ/mol for Cu and 416 kJ/mol for Fe [33]), R0—minimum point of Lennard-Jones potential. This dependence is one of the possible forms of Grüneisen’s law.
The heat of sublimation at temperature T = 0 for the binary Cu-Fe system was assumed according to the rule-of-mixtures. For 1:1 alloys and sandwich structures (Groups 1–3, 7, and 8), it was:
U 0 1 : 1 = U 0 F e + U 0 C u 2 ,  
for 3:1 alloys (Groups 4–6):
U 0 3 : 1 = U 0 F e + 3 · U 0 C u 4 .  
Relationship (17) connected specific and molar heat capacity:
C p = c p · μ ,  
where μ was a molar mass. μ C u = 0.06355 kg/mol, μ F e = 0.05585 kg/mol [33]. The molar mass of the Cu-Fe mixture according to the rule-of-mixtures was:
μ C u F e 1 : 1 = μ F e + μ C u 2    
for 1:1 alloys and sandwich structures (Groups 1–3, 7, 8);
μ C u F e 3 : 1 = μ F e + 3 · μ C u 4    
for 3:1 alloys (Groups 4–6).
Equation (20) provided an average specific heat capacity in the range of 85–213 °C. The function c p ( T ) was approximated as a linear dependence in this range.
c p = c p 85   + c p 213   2 .    
The coefficient A from Equation (14) was calculated for all groups using the average experimental values of CLTE and the average experimental specific heat capacity (20). The validation of the results was provided by the evaluation of A of commercially pure SS 316L by two methods. The first one was based on the nonlinear regression model for CLTE and experimental values of specific heat capacity at particular temperature points (85 °C and 213 °C). The second is average experimental CLTE and average specific heat capacity.

3. Results

3.1. As-Built Parts

Figure 1 reports parts from 8 experimental groups fabricated for this research. The background squares were 10 × 10 mm in size.

3.2. CLTE

3.2.1. Experimentally Measured CLTE

Figure 2 demonstrates the experimentally obtained CLTE of all groups.
The experimental CLTE for commercially pure SS 316L was equal to 1.820∙10−5 ± 9.5∙10–7 K−1.

3.2.2. Theoretically Calculated CLTE

Table 3 demonstrates estimated values of CLTE for all groups based on the CLTE of pure metals fabricated via traditional methods.

3.2.3. Calculation of Thermal Expansion Based on the Regression Models

Calculations based on the three-way interaction regression model gave the following results for SS 316L: b = 16.217600, c −125.021612, and ε T = 0.009714∙T2 + 16.217600∙T − 125.021612. They provided values of ε T of SS 316L at concrete temperature points, particularly, ε T   219.8 μm/m at room temperature (21 ), ε T   3913.0 μm/m at 220 , ε T   1323.7 μm/m at 85 , and ε T   3770.0 μm/m at 213 .
The resulting dependence α ( T ) derived from Equation (11) was as follows:
α ( T ) = ( 2 · a · T + b ) · 10 6 .  
It was valid for T 279 °C. From (21), the CLTE of SS 316L at 85 was 1.787∙10−5 K−1; CLTE at 213 —2.036∙10−5 K−1.

3.3. Specific Heat Capacity

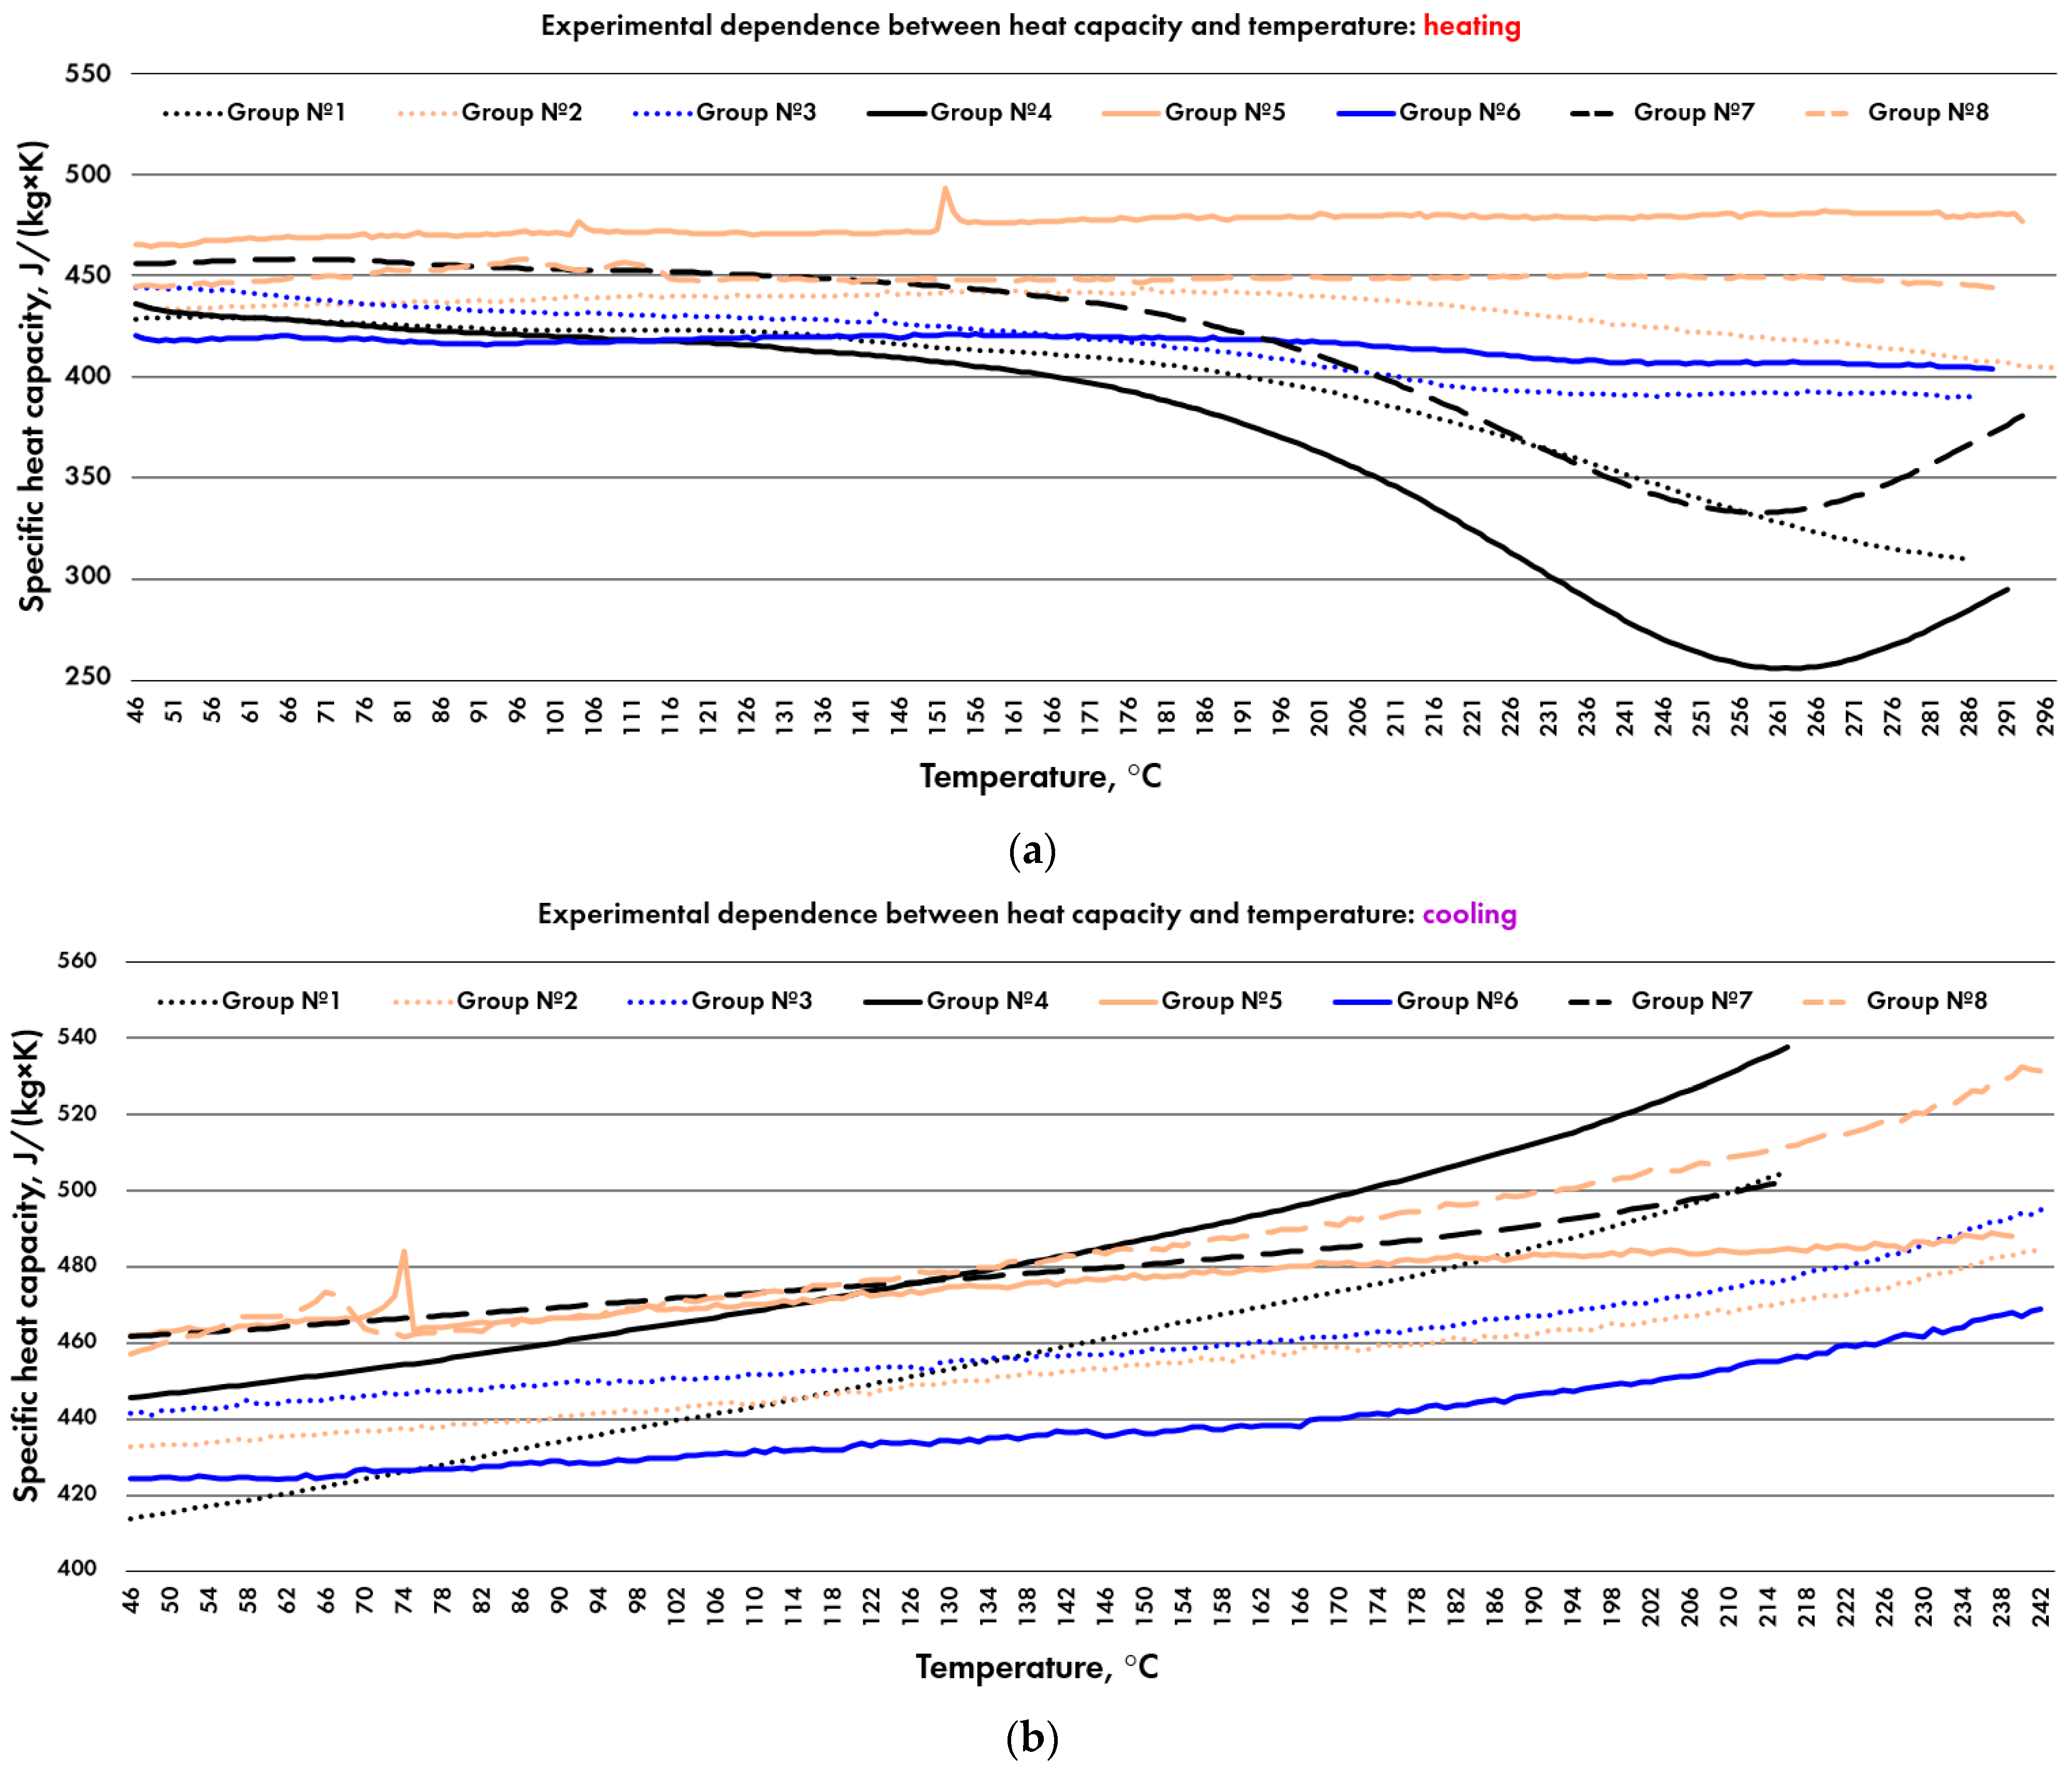
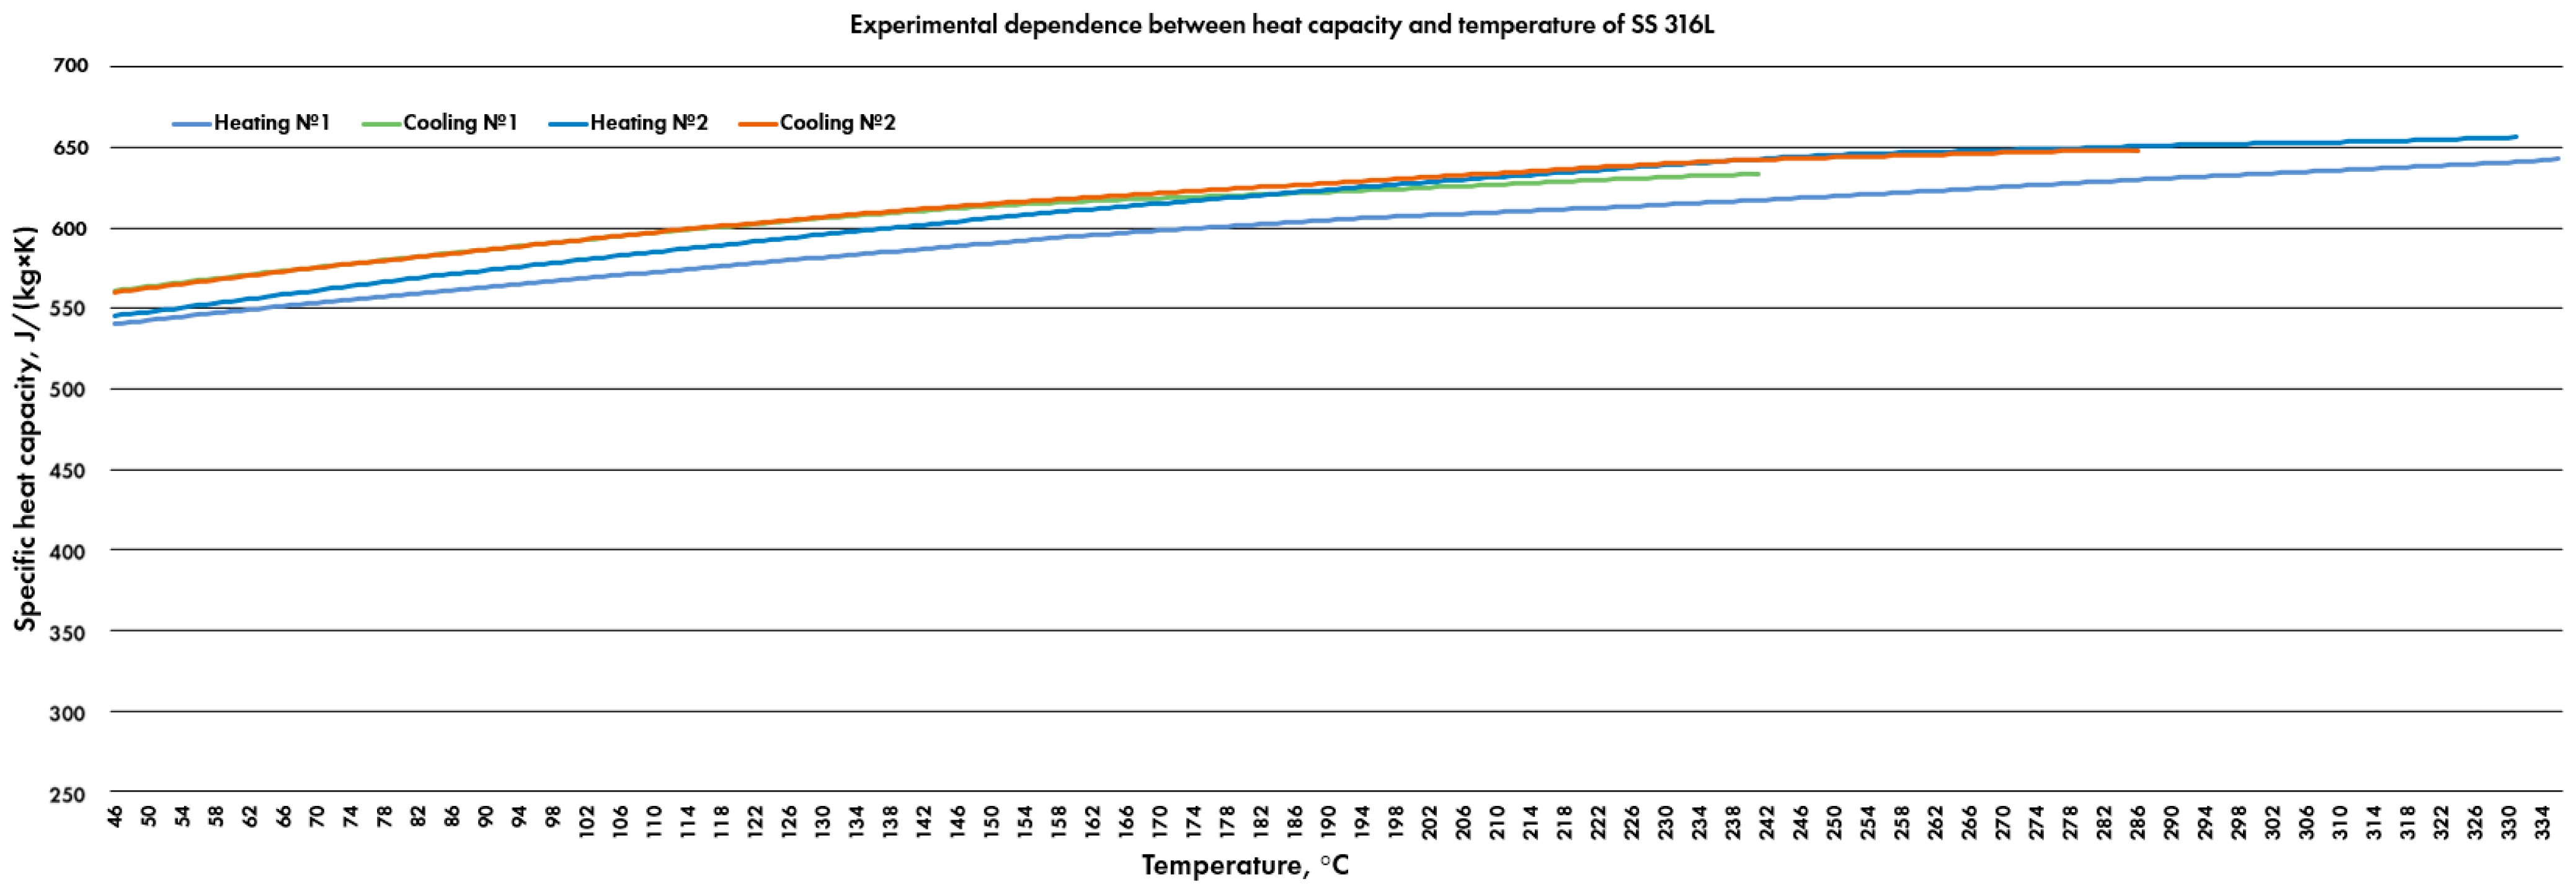
Figure 3a shows the results of specific heat capacity measurements during a heating cycle, and Figure 3b—during the cooling cycle. Figure 4 demonstrates the specific heat capacity of commercially pure SS 316L measured over two heating and two cooling cycles. Blue and light-blue curves refer to heating cycles, and green and orange refer to cooling. All the cycles were conducted sequentially in the order as follows: heating cycle No.1, cooling cycle No.1, heating cycle No.2, and cooling cycle No.2. Delay between cooling cycle No.1 and heating cycle No.2 was more than 12 h.

3.4. Dependence between CLTE and Heat Capacity

The molar mass of materials of Groups 1–3, 7, and 8 was estimated as 0.05970 kg/mol; of Groups 4–6—0.06163 kg/mol. The heat of sublimation: for Groups 1–3, 7, and 8—377 kJ/mol; for Groups 4–6—357 kJ/mol.
Table 4 contains calculated average specific heat capacity values.
Table 5 shows calculated values of average molar heat capacity.
Table 6 demonstrates the resulting values of coefficient A from Equation (11). They were also calculated for both cycles—heating, and cooling.
Coefficient A of commercially pure SS 316L estimated using a regression model and experimental specific heat capacity at two points (85 °C and 213 °C) was equal to 8.43 ± 0.63 and 8.18 ± 0.61, respectively (Method 1). Coefficient A calculated from the average experimental CLTE value and average specific heat capacity between four cycles was equal to 8.99 ± 0.67 (Method 2). The mean deviation between the results of Method 1 and Method 2 was equal to 7.6%.

4. Discussion

4.1. Discussion of As-Fabricated Parts

As was seen in Figure 1, parts from Groups 6 and 7 demonstrated the same defect. It was a small knobble on the top surface of the part. It could be associated with powder that fell on the surface of the overheated part at the end of each layer while the laser was already turned off. Nevertheless, this defect was not observed in all other groups. A reason for this behavior was not evident. Presumably, the source of such a defect could be an imperfection in the substrate of these two parts. M. Liu et al. [34] discussed the same surface satellite defect as a balled-up protrusion. This study pointed out that such a defect was typically observed at the overlapping points between the start and end points of metal deposition. This defect could be typically machined off. Another possible source of the defect was a non-optimal powder feed rate, which delivered too much powder and caused a spatter [34,35].
The part of Group 5 demonstrated agglomerations of sintered powder particles on the side surface of the part. This effect was comparable to the lack of surface powder fusion caused by an excessive powder flow rate in relation to insufficient laser energy density imparted [34,36]. Chromium bronze was the base material for this group. This material had the highest percentage of copper (about 99%, see Table 1). Therefore, it needed an excessive energy input because of the low laser radiation absorption coefficient. Higher laser energy and a lower powder rate could resolve this problem [37]. Corresponding operation conditions for defective and non-defective parts were presented in [23]. The mentioned defects did not influence the conducted experiments because the measurements of CLTE were taken on the mechanically prepared surfaces, as mentioned above.

4.2. Discussion of CLTE

Parts of Groups 4 and 6 had the lowest experimental CLTE. Both of them had the highest bronze percentage (75%). Within these two groups, a non-gradient alloy based on aluminum bronze and SS in the ratio of 3:1 wt.% (Group 4) had the lowest CLTE: (1.212 ± 0.095)∙105 K1. It indicated that this material had the best resistance to linear thermal deformation under the influence of high temperatures. Part of Group No.5 (Cr bronze + SS 316L) also had the same bronze percentage (75%). Still, it did not show such a low CLTE. The reason for it might be the formation of additional Fe-Cr phases in this alloy, and the absence of Fe-Zn, Fe-Sn, and Fe-Al.
All groups created via the alternating layers technique (No. 7–8) had the highest CLTE ([(1.878–1.959) ± 0.095]∙105 K1). It meant that they suffered the highest deformations at high temperatures. It was considered an undesirable property in many practical applications. Groups with a 50/50 steel-to-bronze ratio (No. 1–3) had intermediate (and approximately similar) CLTE, from (1.509 ± 0.095)∙105 to (1.572 ± 0.095)∙105 K1.
It was known that there was a difference between the CLTEs on the basis of a manufacturing method (traditional technologies vs. additive manufacturing). It was provided by chemical, phase, and structural composition distinctions. The resulting CLTE was compared with the characteristics of pure materials created via traditional methods. The experimental results were: for SS 316L α     (1.65–1.75)·105 K1; for tin bronze: (1.85–1.92)·105 K1; for aluminum bronze: (1.62–1.70)·105 K1; for chromium bronze: (1.64–1.70)·105 K1). Table 3 displays theoretically estimated results. It was seen that the experimental values were lower in the case of Groups 1–6 (50/50 wt.% and 75/25 wt.% alloys) and higher in the case of Groups 7–8 (gradient materials). Additionally, it was seen that the CLTE of Groups 1–2 significantly differed from Groups 7–8. Still, according to Equation (1), they were expected to be equal to each other. Epitaxial growth and the formation of new phases, i.a., intermetallics (see [24] and [38]) in the interface areas between different metals, are primarily responsible for this phenomenon. These intermetallics might have thermal characteristics (i.a., CLTE) different from the pure initial materials—steel and bronze.
The results provided by the three-way interaction regression model for SS 316L were close to the results given by SLM at the critical laser energy density in the study [25]. This study reported about ε T 3900 μm/mm at 220 . Our results were also higher than thermal expansion for SLM at the same laser power and scanning speed but lower hatch spacing (h = 120 μm, ε T 3100–3200 μm/m [25]). The CLTE of SS 316L also correlated well with the dilatometer experimental results of [21] (in that study, the measured CLTE of SS 316L was approximately 1.7–2.0∙105 K1 in the range 100–300 ).

4.3. Discussion of Specific Heat Capacity

Figure 3a demonstrates the unusual behavior of specific heat capacity. Most of the time (Groups 1, 2, 3, 4, 7, and—unclearly—Group 6), it decreased as the temperature rose. Because precise mass measurements proved that there was no mass loss during the experiments, the reason for such behavior could be long-term phase transitions, which started in the range 46–136   . The end of these phase transitions was a local extremum of specific heat capacity near 254–266 °C in the case of Groups 4 and 7. Both of them were C61800-based. The third C61800-based group (No.1) had a similar shape, but its expected local extremum was outside the temperature range investigated (46–286 °C). It is needed to check the existence of this extremum during subsequent research. We associated these transitions with the formation of lower bainite after the decay of previously undercooled austenite. Because of high cooling rates during DED, the liquid phase was undercooled below the metastable miscibility gap [19], and undercooled austenitic γ-Fe appeared. The existence of γ-Fe in these C61800-SS 316L alloys was proved in the study [23] by the results of XRD analysis. During reheating under DSC analysis, undercooled austenite decayed within approximately the 200–300 °C range, and lower bainite appeared. After this phase transition, the specific heat capacity began to increase with temperature. It should be noted that these transitions were observed only in the C61800-based alloys, which showed a {paramagnetic FCC} → {ferromagnetic BCC} transformation [39]. This transformation provided the fabrication of soft magnetic materials from paramagnetic components [39]. C18400- and CB480K-based alloys demonstrated neither this FCC→BCC transformation nor an evident specific capacity decrease.
Only Groups 5 and 8 based on C18400 did not have the mentioned heat capacity decrease. Because another C18400-based group (Group 2) had this decrease, it could be suggested that there was a transient concentration of elements in the alloy, which provoked the phase transition. Nevertheless, today’s literature did not report on the transient behavior of the Cu-Fe-Cr system in the low-temperature area [40,41,42,43]. Therefore, the reason for such an effect is not clear and needs to be studied in more detail.
It was seen that C61800-based curves had the lowest average value of specific heat capacity. C18400-based curves had the highest value, CB480K—intermediate.
The experimental curve of Group No.5 had two small exothermic peaks: the first one—near 102–106 °C, the second one—near 154–158 °C. They could be associated with polymorphic transformations [44,45,46], which appeared during heating. They changed the crystalline structure, its characteristic dimensions, and its shape. Another C18400-based group (No.8) also showed very small exothermic peaks in the area between 78 and 118 °C. CB480K-based group No.3 had a small exothermic peak near 144 °C.
Figure 3b demonstrates another behavior of specific heat capacity. All the curves were monotonous. It pointed to the absence of long-term phase transitions, which were observed during the heating cycle. Nevertheless, two C18400-based groups (No.5 and No.8) had clearly observable exothermic peaks near 66 °C and 74 °C. These two curves also had exothermic peaks during a heating cycle, but the corresponding temperature values were different.
A comparison of the obtained results of SS 316L specific heat capacity with DSC data of other studies [23,47,48,49,50,51] showed that SS 316L had 15–20%-higher heat capacity if it was fabricated by DED in comparison to traditional methods. Its reason could be rapid solidification, which leads to grain refinement and the changing of the thermal properties of the material.
DSC curves of the specific heat capacity of commercially pure SS 316L did not show phase transitions in the range of 50–330 . It pointed at the absence of undercooled austenite and the formation of lower bainite. It was expected in the presence of bronze only. Earlier studies [23,47,48,49,50,51] also did not display phase transitions of SS 316L in this temperature range.

4.4. Dependence between CLTE and Specific Heat Capacity

It was seen that the resulting values of coefficient A (Table 6) were approximately similar to the values discussed in the study [32] (A = 9.17–12.00). The validation of our model showed a positive result: the mean deviation between coefficient A of commercially pure SS 316L measured by two methods was equal to 7.6%.

5. Conclusions

This study successfully investigated the CLTE and specific heat capacity of Al/Cr/Sn-bronze and SS-316L binary alloys (50/50 and 75/25 wt.%) and FGMs fabricated via DED. These thermal characteristics of such structures were experimentally studied for the first time and compared with theoretically predicted values. The lowest CLTE was shown by 75/25 wt.% Al-bronze-based alloy: (1.212 ± 0.095)·10−5 K−1. This material was characterized by the best resistance to thermal deformations under high-temperature influence. The specific heat capacity of the DED-fabricated Cu-Fe alloys demonstrated uncommon behavior during the heating cycle. A decrease in specific heat capacity and its subsequent increase after ~260 °C in the Cu-Fe-Al system were associated with long-term phase transitions and the formation of lower bainite. Small exothermic peaks in the DSC curves of Cu-Fe-Cr alloys were attributed to rapid polymorphic transformations. The specific heat capacity of DED-fabricated commercially pure SS 316L was 15–20% higher in comparison to traditional methods. Its reason was rapid solidification, which led to grain refinement and changed the thermal properties of the material.
The proportionality factor A between CLTE and specific heat capacity was calculated for various materials using the derivative of the Lennard-Jones potential equation and the experimental data. These results were obtained for the first time and validated by measurements of CLTE and the specific heat capacity of commercially pure SS 316L. A three-way interaction regression model, which considered parameters of laser treatment, provided a comparison between proportionality factor A calculated by two methods. The mean deviation between these results was equal to 7.6%.
According to the numerical model, the relative thermal expansion ε T, [μm/m] of the DED-fabricated SS 316L ( ε T     3913 μm/mm at 220 ) was close to the results predicted for SLM. It also matched the dilatometer experimental results of SLM-fabricated SS 316L. A decrease in hatch spacing was considered a reliable method of changing the CLTE of Cu-Fe parts fabricated by additive manufacturing methods.
The findings of the conducted research can be applied to the DED of Cu-Fe system homogeneous alloys and FGMs (especially based on UNS C61800 and SS 316L), which can be used in the NPP, STP, aerospace, and electronic components industries. The future direction of the study includes:
  • The analysis of the specific heat capacity of the Cu-Fe materials in a wider temperature range (up to ~900 °C);
  • The study of the phase transitions of the Cu-Fe-Cr system in the low-temperature area;
  • The fabrication and the tests of the real functionally graded parts using the results of the conducted experiments.

Author Contributions

Conceptualization, K.I.M. and I.V.S.; methodology, K.I.M., O.N.D. and I.V.S.; validation, K.I.M.; formal analysis, K.I.M. and I.V.S.; investigation, O.N.D. and K.I.M.; writing—original draft preparation, K.I.M.; writing—review and editing, I.V.S.; supervision, I.V.S. All authors have read and agreed to the published version of the manuscript.

Funding

This research received no external funding.

Data Availability Statement

The data presented in this study are available on request from the corresponding author. The data are not publicly available due to technical limitations.

Acknowledgments

Oleg N. Dubinin is grateful to the Ministry of Science and Higher Education of the Russian Federation as part of the World-Class Research Center Program: Advanced Digital Technologies (contract No. 075-15-2020-903 of 16 November 2020). The authors are grateful to the Skoltech Center for Petroleum Science and Engineering and personally to Dmitriy Ostrizhny for his powerful help with the experimental research.

Conflicts of Interest

The authors declare no conflict of interest.

References

  1. Svetlizky, D.; Das, M.; Zheng, B.; Vyatskikh, A.L.; Bose, S.; Bandyopadhyay, A.; Schoenung, J.M.; Lavernia, E.J.; Eliaz, N. Directed energy deposition (DED) additive manufacturing: Physical characteristics, defects, challenges and applications. Mater. Today 2021, 49, 271–295. [Google Scholar] [CrossRef]
  2. Ghosal, P.; Chandra Majumder, M.; Chattopadhyay, A. Study on direct laser metal deposition. Mater. Today Proc. 2018, 5, 12509–12518. [Google Scholar] [CrossRef]
  3. Ahn, D.-G. Directed Energy Deposition (DED) Process: State of the Art. Int. J. Precis. Eng. Manuf. Green Technol. 2021, 8, 703–742. [Google Scholar] [CrossRef]
  4. Hofmann, D.C.; Roberts, S.; Otis, R.; Kolodziejska, J.; Dillon, R.P.; Suh, J.-o.; Shapiro, A.A.; Liu, K.-Z.; Borgonia, J.-P. Developing gradient metal alloys through radial deposition additive manufacturing. Sci. Rep. 2014, 4, 5357. [Google Scholar] [CrossRef] [Green Version]
  5. Feenstra, D.R.; Banerjee, R.; Fraser, H.L.; Huang, A.; Molotnikov, A.; Birbilis, N. Critical review of the state of the art in multi-material fabrication via directed energy deposition. Curr. Opin. Solid State Mater. Sci. 2021, 25, 100924. [Google Scholar] [CrossRef]
  6. Ansari, M.; Jabari, E.; Toyserkani, E. Opportunities and challenges in additive manufacturing of functionally graded metallic materials via powder-fed laser directed energy deposition: A review. J. Mater. Process. Technol. 2021, 294, 117117. [Google Scholar] [CrossRef]
  7. Farzaneh, A.; Khorasani, M.; Farabi, E.; Gibson, I.; Leary, M.; Ghasemi, A.; Rolfe, B. Sandwich structure printing of Ti-Ni-Ti by directed energy deposition. Virtual Phys. Prototyp. 2022, 17, 1006–1030. [Google Scholar] [CrossRef]
  8. Chen, B.; Wang, T.; Xi, X.; Tan, C.; Song, X. Additive manufacturing of Ti-Al functionally graded material by laser based directed energy deposition. Rapid Prototyp. J. 2022. ahead-of-print. [Google Scholar] [CrossRef]
  9. Tudu, N.; Baruah, M.; Prasad, S.B. Comparison of properties at the interface of deposited IN625 and mixture of IN625 SS304L by laser directed energy deposition and SS304L substrate. Rapid Prototyp. J. 2022. [Google Scholar] [CrossRef]
  10. Karnati, S.; Sparks, T.E.; Liou, F.; Newkirk, J.W.; Taminger, K.M.B.; Seufzer, W.J. Laser metal deposition of functionally gradient materials from elemental copper and nickel powders. In Proceedings of the 26th Solid Freeform Fabrication Symposium, Austin, TX, USA, 10–12 August 2015. [Google Scholar]
  11. Jamroziak, K.; Roik, T.A.; Gavrysh, O.A.; Vitsiuk, I.; Lesiuk, G.; Correia, J.A.F.O.; De Jesus, A.M.P. Improved manufacturing performance of a new antifriction composite parts based on copper. Eng. Fail. Anal. 2018, 91, 225–233. [Google Scholar] [CrossRef]
  12. Makarenko, K.; Dubinin, O.; Shishkovsky, I. Analytical evaluation of the dendritic structure parameters and crystallization rate of laser-deposited Cu-Fe functionally graded materials. Materials 2020, 13, 5665. [Google Scholar] [CrossRef] [PubMed]
  13. Moharana, B.R.; Sahu, S.K.; Maiti, A.; Sahoo, S.K.; Moharana, T.K. An experimental study on joining of AISI 304 SS to Cu by Nd-YAG laser welding process. Mater. Today Proc. 2020, 33, 5262–5268. [Google Scholar] [CrossRef]
  14. Makarenko, K.I.; Shishkovsky, I.V. Direct Energy Deposition of Cu-Fe System Functionally Graded Structures. IOP Conf. Ser. Mater. Sci. Eng. 2020, 969, 012104. [Google Scholar] [CrossRef]
  15. Pichler, P.; Simonds, B.J.; Sowards, J.W.; Pottlacher, G. Measurements of thermophysical properties of solid and liquid NIST SRM 316L stainless steel. J. Mater. Sci. 2020, 55, 4081–4093. [Google Scholar] [CrossRef] [PubMed] [Green Version]
  16. Hidnert, P. Thermal expansion of some bronzes. J. Res. Natl. Bur. Stand. 1943, 30, 75–88. [Google Scholar] [CrossRef]
  17. Zhang, X.; Li, L.; Pan, T.; Chen, Y.; Zhang, Y.; Li, W.; Liou, F. Additive manufacturing of copper-tool steel dissimilar joining: Experimental characterization and thermal modeling. Mater. Charact. 2020, 170, 110692. [Google Scholar] [CrossRef]
  18. Gao, N.; Starink, M.J.; Langdon, T.G. Using differential scanning calorimetry as an analytical tool for ultrafine grained metals processed by severe plastic deformation. Mater. Sci. Technol. 2013, 25, 687–698. [Google Scholar] [CrossRef] [Green Version]
  19. Makarenko, K.; Dubinin, O.; Shishkovsky, I. Direct Energy Deposition of Cu-Fe System Functionally Graded Materials: Miscibility Aspects, Cracking Sources, and Methods of Assisted Manufacturing. In Advanced Additive Manufacturing; Shishkovsky, I.V., Ed.; IntechOpen: London, UK, 2022. [Google Scholar] [CrossRef]
  20. Chen, N.; Ali Khan, H.; Wan, Z.; Lippert, J.; Sun, H.; Shang, S.-L.; Liu, Z.-K.; Li, J. Microstructural characteristics and crack formation in additively manufactured bimetal material of 316L stainless steel and Inconel 625. Addit. Manuf. 2020, 32, 101037. [Google Scholar] [CrossRef]
  21. Koga, N.; Tomono, S.; Umezawa, O. Low-temperature tensile properties of Cu-Fe laminated sheets with various number of layers. Mater. Sci. Eng. A 2021, 811, 141066. [Google Scholar] [CrossRef]
  22. Koga, N.; Zhang, W.; Umezawa, O.; Tschan, V.; Sas, J.; Weiss, K.P. Temperature dependence on tensile properties of Cu-40mass%Fe dual phase alloy. IOP Conf. Ser. Mater. Sci. Eng. 2017, 279, 012004. [Google Scholar] [CrossRef] [Green Version]
  23. Makarenko, K.I.; Konev, S.D.; Dubinin, O.N.; Shishkovsky, I.V. Mechanical characteristics of laser-deposited sandwich structures and quasi-homogeneous alloys of Fe-Cu system. Mater. Des. 2022, 224, 111313. [Google Scholar] [CrossRef]
  24. Makarenko, K.; Dubinin, O.; Shornikov, P.; Shishkovsky, I. Specific aspects of the transitional layer forming in the aluminium bronze–stainless steel functionally graded structures after laser metal deposition. Procedia CIRP 2020, 94, 346–351. [Google Scholar] [CrossRef]
  25. Yakout, M.; Elbestawi, M.A.; Veldhuis, S.C. A study of thermal expansion coefficients and microstructure during selective laser melting of Invar 36 and stainless steel 316L. Addit. Manuf. 2018, 24, 405–418. [Google Scholar] [CrossRef]
  26. Pavlovic, A.S.; Suresh Babu, V.; Seehra, M.S. High-temperature thermal expansion of binary alloys of Ni with Cr, Mo and Re: A comparison with molecular dynamics simulations. J. Phys. Condens. Matter 1996, 8, 3139–3149. [Google Scholar] [CrossRef]
  27. Ferreira, A.J.M.; Batra, R.C.; Roque, C.M.C.; Qian, L.F.; Martins, P.A.L.S. Static analysis of functionally graded plates using third-order shear deformation theory and a meshless method. Compos. Struct. 2005, 69, 449–457. [Google Scholar] [CrossRef]
  28. Large-Area Picosecond Photo-Detectors Project Database. Chapter 17. Material Expansion Coefficients. Linear Thermal Expansion Coefficients of Metals and Alloys//The University of Chicago, Argonne, Fermilab and Berkeley. Available online: https://psec.uchicago.edu/thermal_coefficients/cte_metals_05517-0143.pdf (accessed on 14 March 2022).
  29. AZo Materials. High-Leaded Tin Bronze UNS C93200. Available online: http://www.azom.com/article.aspx?ArticleID=6552 (accessed on 26 May 2022).
  30. Dubenko, I.S.; Gaidukova, I.Y.; Granovsky, S.A.; Gratz, E.; Gurjazkas, D.; Markosyan, A.S.; Müller, H. Strongly Enhanced Thermal Expansion in Binary Y-Mn Intermetallic Compounds. Solid State Commun. 1997, 103, 495–499. [Google Scholar] [CrossRef]
  31. Chung, Y.-L.; Chang, H.-X. Mechanical Behavior of Rectangular Plates with Functionally Graded Coefficient of Thermal Expansion Subjected to Thermal Loading. J. Therm. Stress. 2008, 31, 368–388. [Google Scholar] [CrossRef]
  32. Drebushchak, V.A.; Turkin, A.I. Relationship between heat capacity and thermal expansion derived from the Lennard-Jones potential. J. Therm. Anal. Calorim. 2001, 65, 745–753. [Google Scholar] [CrossRef]
  33. Oxtoby, D.W.; Gillis, H.P.; Butler, L.J. Principles of Modern Chemistry, 8th ed.; Cengage Learning: Boston, MA, USA, 2016. [Google Scholar]
  34. Liu, M.; Kumar, A.; Bukkapatnam, S.; Kuttolamadom, M. A review of the anomalies in directed energy deposition (DED) processes & potential solutions-part quality & defects. Proc. Manuf. 2021, 53, 507–518. [Google Scholar] [CrossRef]
  35. Liu, Z.; Kim, H.; Liu, W.; Cong, W.; Jiang, Q.; Zhang, H. Influence of energy density on macro/micro structures and mechanical properties of as-deposited Inconel 718 parts fabricated by laser engineered net shaping. J. Manuf. Process. 2019, 42, 96–105. [Google Scholar] [CrossRef]
  36. Attar, H.; Ehtemam-Haghighi, S.; Kent, D.; Wu, X.; Dargusch, M.S. Comparative study of commercially pure titanium produced by laser engineered net shaping, selective laser melting and casting processes. Mater. Sci. Eng. A 2017, 705, 385–393. [Google Scholar] [CrossRef]
  37. Keicher, D.M.; Miller, W.D. LENSTM moves beyond RP to direct fabrication. J. Met. Powder Rep. 1998, 12, 26–28. [Google Scholar] [CrossRef]
  38. Wang, W.; Takata, N.; Suzuki, A.; Kobashi, M.; Kato, M. Formation of multiple intermetallic phases in a hypereutectic Al-Fe binary alloy additively manufactured by laser powder bed fusion. Intermetallics 2020, 125, 106892. [Google Scholar] [CrossRef]
  39. Dubinin, O.N.; Chernodubov, D.A.; Kuzminova, Y.O.; Shaysultanov, D.G.; Akhatov, I.S.; Stepanov, N.D.; Evlashin, S.A. Gradient soft magnetic materials produced by additive manufacturing from non-magnetic powders. J. Mater. Process. Technol. 2022, 300, 117393. [Google Scholar] [CrossRef]
  40. Cui, S.; Jung, I.-H. Thermodynamic modeling of the Cu-Fe-Cr and Cu-Fe-Mn systems. Calphad 2017, 56, 241–259. [Google Scholar] [CrossRef]
  41. Raghavan, V. Cr-Cu-Fe (Chromium-Copper-Iron). J. Phase Equilibria 2002, 23, 257. [Google Scholar] [CrossRef]
  42. Fernee, H.; Nairn, J.; Atrens, A. Cu-rich corner of the Cu-Fe-Cr phase diagram. J. Mater. Sci. Lett. 2011, 20, 2213–2215. [Google Scholar] [CrossRef]
  43. Dreval, L.A.; Turchanin, M.A.; Abdulov, A.R.; Bondar, A.A. Thermodynamic assessment of the Cu–Fe–Cr phase diagram. Chem. Met. Alloy. 2010, 3, 132–139. [Google Scholar] [CrossRef]
  44. Sato, K. Polymorphic transformations in crystal growth. J. Phys. D Appl. Phys. 1993, 26, B77–B84. [Google Scholar] [CrossRef]
  45. Tsymburskaya, A.T. Polymorphic transformations of metals. Izv. Vyss. Uchebnykh Zaved. Fiz. 1971, 9, 141–144. [Google Scholar] [CrossRef]
  46. Semenov, M.Y.; Kraposhin, V.S.; Talis, A.L.; Simich-Lafitskii, N.D. Transfer of diagonals in a rhombus: Elementary act of polymorphic transformation. Analysis of the energy threshold of transformation in metals. Metalloved. Termicheskaya Obrab. Metalloved. 2020, 2, 8–17. [Google Scholar] [CrossRef]
  47. Wilthan, B.; Reschab, H.; Tanzer, R.; Schuetzenhoefer, W.; Pottlacher, G. Thermophysical properties of a chromium–nickel–molybdenum steel in the solid and liquid phases. Int. J. Thermophys. 2008, 29, 434–444. [Google Scholar] [CrossRef]
  48. Kaschnitz, E.; Kaschnitz, H.; Schleutker, T.; Guelhan, A.; Bonvoisin, B. Electrical resistivity measured by millisecond pulse-heating in comparison to thermal conductivity of the stainless steel AISI 316L at elevated temperature. High Temp. High Press. 2017, 40, 27. [Google Scholar] [CrossRef]
  49. Fetni, S.; Enrici, T.M.; Niccolini, T.; Tran, H.S.; Dedry, O.; Duchêne, L.; Mertens, A.; Habraken, A.M. Thermal model for the directed energy deposition of composite coatings of 316L stainless steel enriched with tungsten carbides. Mater. Des. 2021, 204, 109661. [Google Scholar] [CrossRef]
  50. Kumar, K.S. Numerical modeling and simulation of a butt joint welding of AISI 316L stainless steels using a pulsed laser beam. Mater. Today Proceed. 2015, 2, 2256–2266. [Google Scholar] [CrossRef]
  51. Sayman, O.; Sen, F.; Celik, E.; Arman, Y. Thermal stress analysis of WC-co/Cr-Ni multilayer coatings on 316L steel substrate during cooling process. Mater. Des. 2009, 30, 770–774. [Google Scholar] [CrossRef]
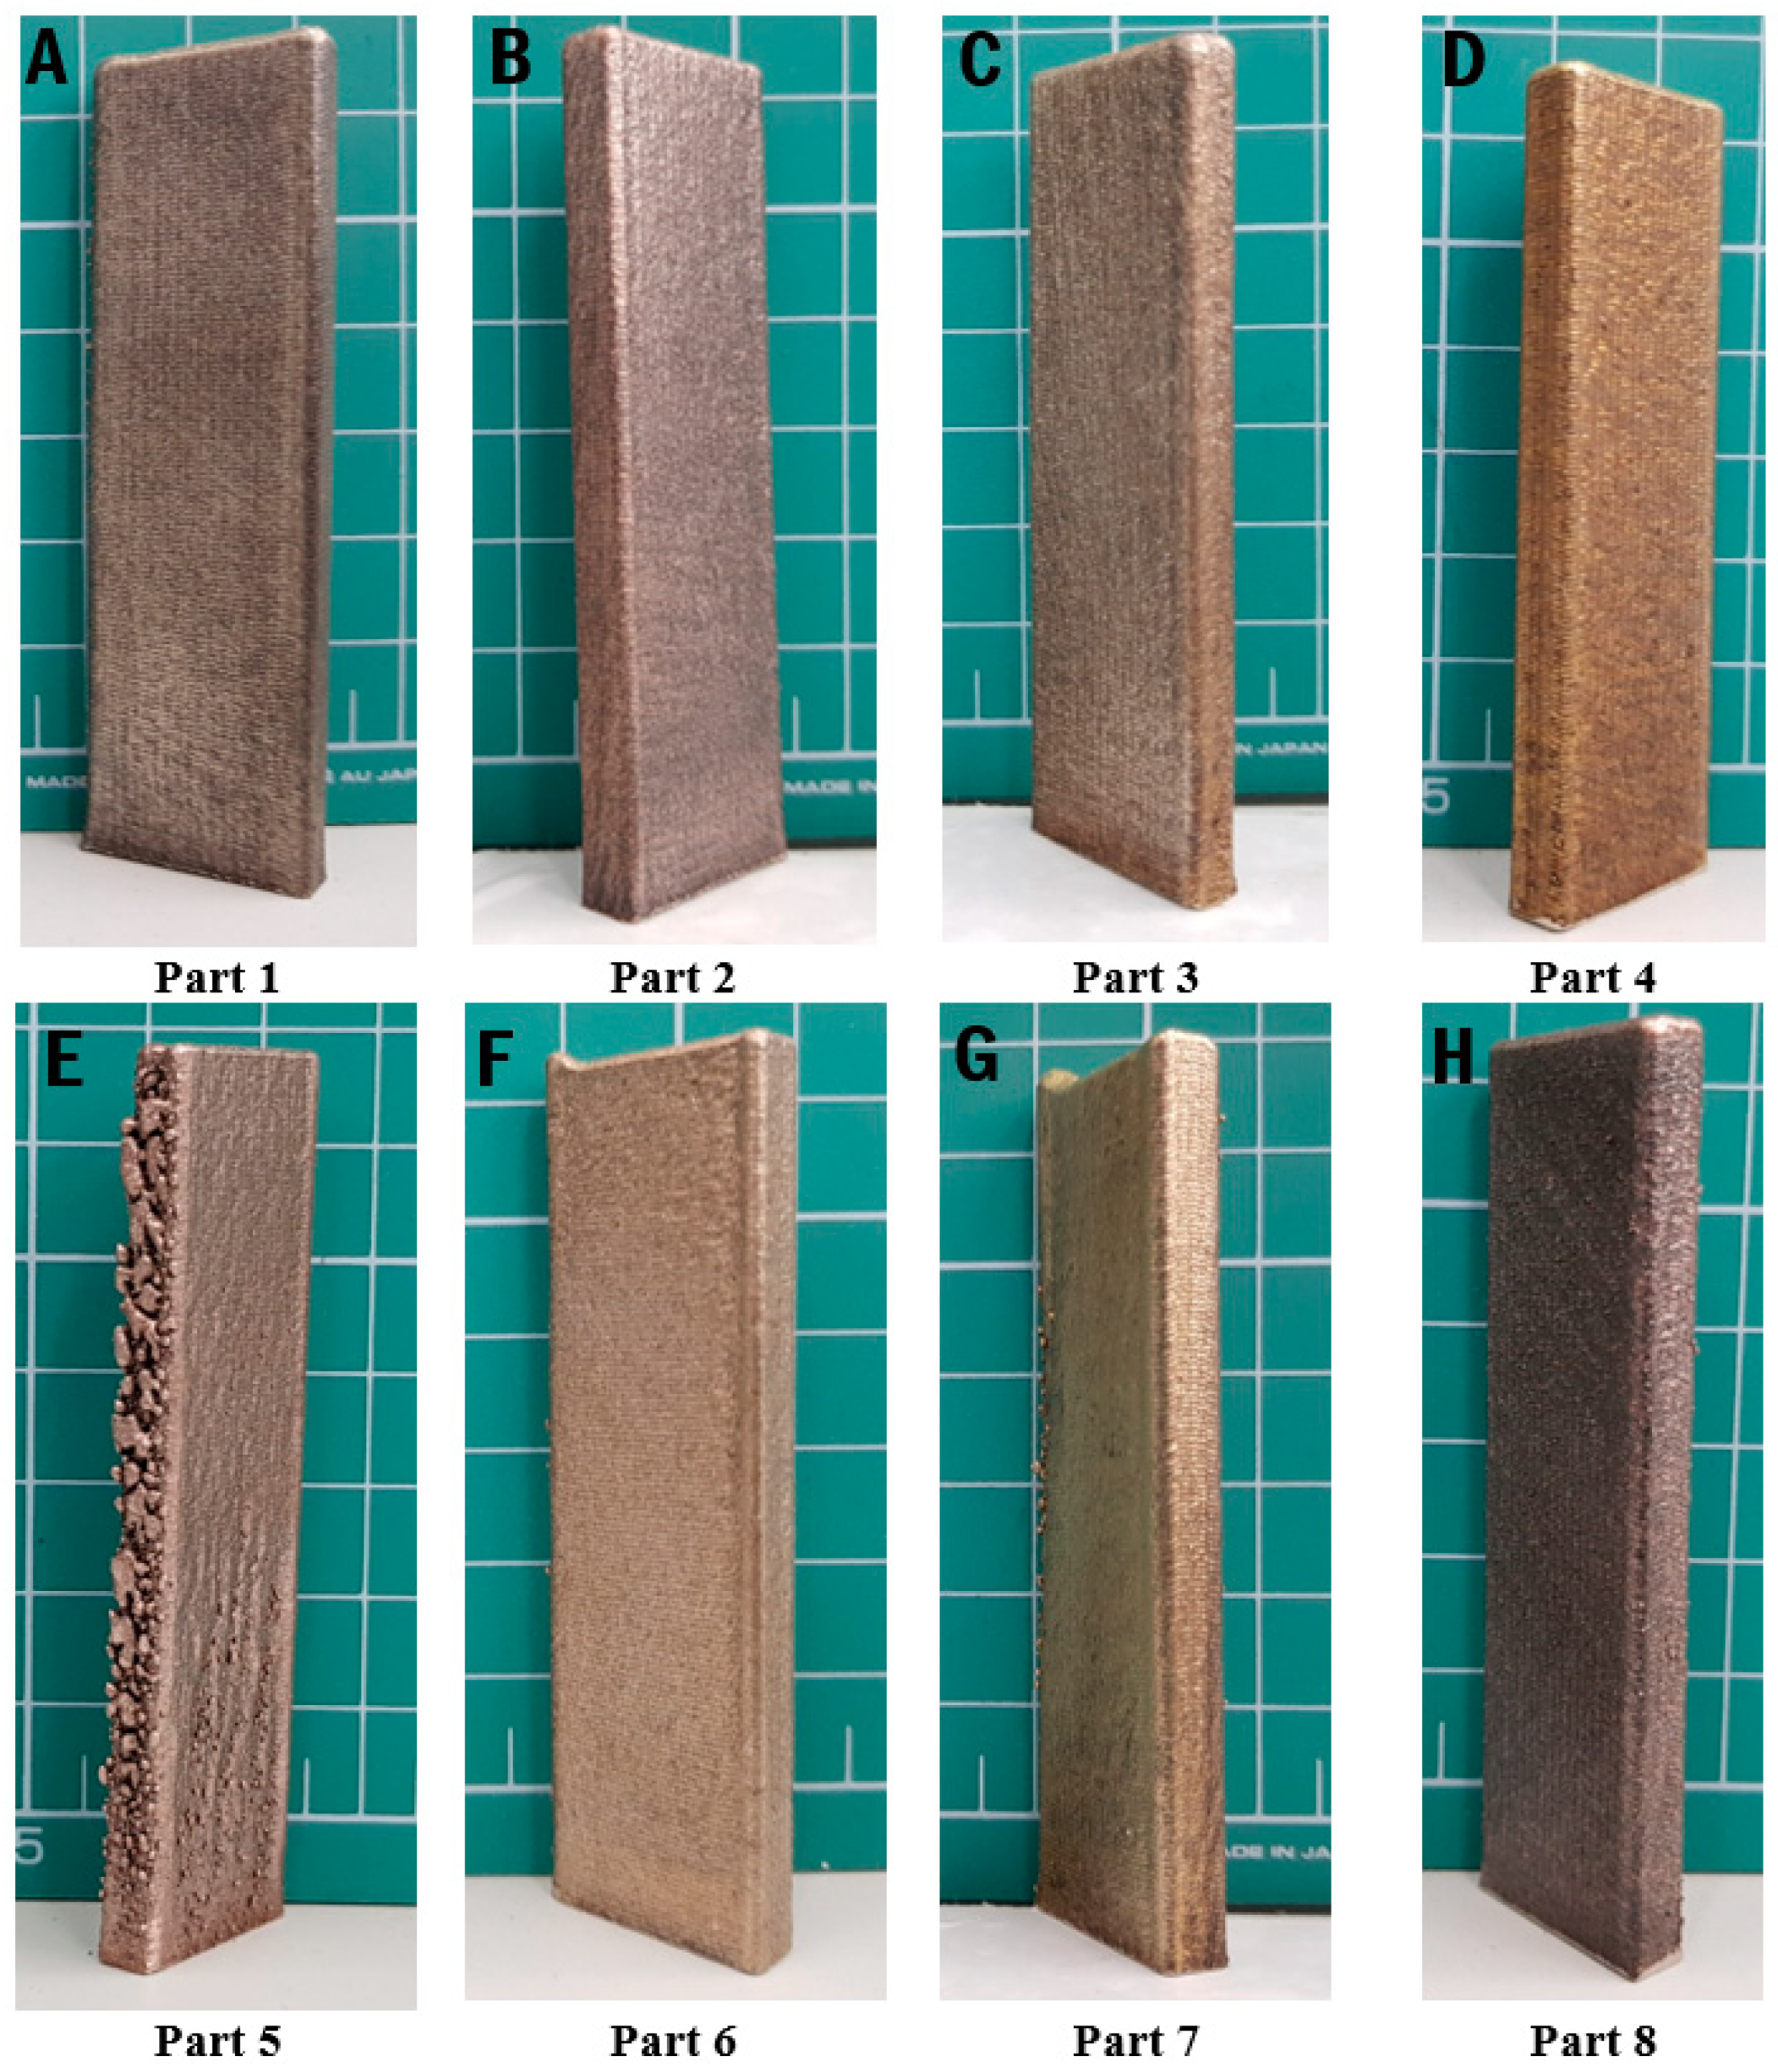
Figure 1. Parts of Groups 1–8.
Metals 13 00451 g001
Figure 2. CLTE of Groups 1–8.
Metals 13 00451 g002
Figure 3. All dotted curves showed 50/50 wt.% alloys. All solid curves showed 75/25 wt.% alloys. All dashed curves showed alternating-layers gradient alloys. Bright black curves showed C61800-based alloys. Pale orange curves showed C18400-based alloys. Blue curves of medium brightness showed CB480K-based alloys. Measurement precision was ± 2.5%. (a) Experimental dependence between specific heat capacity and temperature while heating; (b) Experimental dependence between specific heat capacity and temperature while cooling.
Metals 13 00451 g003
Figure 4. DSC curves of commercially pure SS 316L measured during 4 cycles. Measurement precision was ± 2.5%.
Metals 13 00451 g004
Table 1. Chemical compositions of bronzes (wt.%).
ElementAl BronzeSn BronzeCr Bronze
CuBaseBaseBase
Al9.500.05
Cr0.76
Fe1.000.100.05
Ni0.100.05
O20.05
P0.02
Pb0.020.05
S0.01
Sb0.050.05
Si0.100.05
Sn0.059.96
Zn0.050.11
Table 2. Set of groups 1 [23].
Group No.12345678
DescriptionC61800 + SS (1:1)C18400 + SS (1:1)CB480K + SS (1:1)C61800 + SS (3:1)C18400 + SS (3:1)CB480K + SS (3:1)C61800 + SS(alt.)C18400 + SS (alt.)
1 Abbreviation «alt.» referred to sandwich structures with alternating layers of steel and bronze.
Table 3. Analytically estimated CLTE of all groups based on the CLTE of pure metals.
Group No.12345678
CLTE, K−1 × 10−51.6401.6251.7001.6601.6381.7501.640 11.625 1
1 A volume-mean average.
Table 4. c p , J/(kg × K) for heating and cooling cycles.
CycleGroup 1Group 2Group 3Group 4Group 5Group 6Group 7Group 8
Heating409 ± 10.2436 ± 10.9421 ± 10.5386 ± 9.7474 ± 11.9415 ± 10.4428 ± 10.7450 ± 11.3
Cooling445 ± 11.1446 ± 11.2452 ± 11.3473 ± 11.8472 ± 11.8433 ± 10.8474 ± 11.9476 ± 11.9
Table 5. C p , J/(mol × K) for heating and cooling cycles.
CycleGroup 1Group 2Group 3Group 4Group 5Group 6Group 7Group 8
Heating24.4   ±   0.626.0   ±   0.725.1   ±   0.623.8   ±   0.629.2   ±   0.725.6   ±   0.625.6   ±   0.626.9   ±   0.7
Cooling26.6   ±   0.726.6   ±   0.727.0   ±   0.729.1   ±   0.729.1   ±   0.726.7   ±   0.728.3   ±   0.728.4   ±   0.7
Table 6. Values of coefficient A for heating and cooling cycles.
CycleGroup 1Group 2Group 3Group 4Group 5Group 6Group 7Group 8
Heating 8.58   ± 0.73 8.77   ±   0.75 8.80   ±   0.75 11.00   ±   1.16 10.02   ±   0.85 9.77   ±   0.83 6.93   ±   0.52 7.60   ±   0.57
Cooling9.35   ±   0.79 8.98   ±   0.76 9.47   ±   0.80 13.45   ±   1.41 9.99   ±   0.85 10.19   ±   0.87 7.66   ±   0.57 8.02   ±   0.60
Disclaimer/Publisher’s Note: The statements, opinions and data contained in all publications are solely those of the individual author(s) and contributor(s) and not of MDPI and/or the editor(s). MDPI and/or the editor(s) disclaim responsibility for any injury to people or property resulting from any ideas, methods, instructions or products referred to in the content.