Article

Effect of Graphite Morphology on the Thermomechanical Performance of Compacted Graphite Iron

by
Minghua Cao
,
Konstantinos P. Baxevanakis
* and
Vadim V. Silberschmidt
Wolfson School of Mechanical, Electrical and Manufacturing Engineering, Loughborough University, Loughborough LE11 3TU, UK
*
Author to whom correspondence should be addressed.
Metals 2023, 13(3), 473; https://doi.org/10.3390/met13030473
Submission received: 30 December 2022 / Revised: 12 February 2023 / Accepted: 21 February 2023 / Published: 24 February 2023

Abstract

:
Compacted graphite iron (CGI) has gained significant attention in automotive industry applications thanks to its superior thermomechanical properties and competitive price. Its main fracture mechanism at the microscale—interfacial damage and debonding between graphite inclusions and a metallic matrix—can happen under high-temperature service conditions as a result of a mismatch in the coefficients of thermal expansion between the two phases of CGI. Macroscopic fracture in cast iron components can be initiated by interfacial damage at the microscale under thermomechanical load. This phenomenon was investigated in various composites but still lacks information for CGI, with its complex morphology of graphite inclusions. This research focuses on the effect of this morphology on the thermomechanical performance of CGI under high temperatures. A set of three-dimensional finite-element models was created, with a unit cell containing a single graphite inclusion embedded in a cubic domain of the metallic matrix. Elastoplastic behaviour was assumed for both phases in numerical simulations. The effect of graphite morphology on the thermomechanical performance of CGI was investigated for pure thermal loading, focusing on a high-temperature response of its constituents. The results can provide a deeper understanding of the correlation between graphite morphology and CGI fracture mechanisms under high temperatures.

1. Introduction

Accounting for 70% of the total metal production, cast irons are widely used in the automotive industry [1]. Since its first observation in 1948 [2] as a type of cast iron, compacted graphite iron (CGI) was used in numerous industrial applications, including in internal combustion engines (cylinder heads, blocks, brake drums [3], and exhaust manifolds [4]), machinery, and pipes. CGI has a strong potential in the automotive industry, especially diesel engines [5], benefiting from its toughness, thermal-fatigue durability [6], heat resistance [7], and competitive price.
Cast iron is commonly considered as a typical in situ metal matrix composite [8], with a microstructure comprising a metallic matrix and graphite inclusions. The matrix is composed of one or a mixture of phases, including pearlite and ferrite [6]. Graphite inclusions are classified as spherical (nodular), flake, and vermicular based on their circularity (Figure 1). The classification of cast irons is based on the morphology of graphite particles in iron. In contrast to many other types of cast irons, the complex microstructure of CGI includes all three types of graphite inclusions that affect its performance [9]. Grey cast iron with a simple microstructure of only flake graphite particles is the most commonly used material in diesel engines [1]; however, the application of CGI provides opportunities for power increase and weight reduction, while [3] contributing to highly powerful next-generation diesel engines [10]. In engine applications, CGI faces high-temperature and -pressure working conditions. Under such harsh working environments, the generation of damage can cause failure of the component, resulting in safety problems and economic losses [11].
Based on experimental observations, graphite-matrix debonding (decohesion) is considered the main damage mechanism of cast irons [12,13]. Graphite particles with their brittle and soft response were observed to fracture or debond from the metallic matrix at low levels of stress [14,15], causing plastic deformation to them [12]. This interfacial (graphite-matrix) debonding mechanism can initiate microcracks in the deformed metallic matrix, which possibly coalesce and result in main cracks and macrocracks [12]. Under cyclic mechanical loads, fatigue cracks can be initiated by interfacial debonding [16].
Thermal load is another important factor affecting the interfacial debonding phenomenon. Many parts in diesel engines are manufactured with cast irons, where the inner wall of the combustion chamber can reach temperature levels of 400 °C to 600 °C [17]. In these high-temperature service conditions, different magnitudes of the coefficients of thermal expansion of the graphite inclusions and the metallic matrix can cause the onset of interfacial debonding even without mechanical loads. The propagation and interaction of microcracks in the metallic matrix can result in the formation of their networks and further main cracks in CGI under thermal loadings [13]. When exposed to a high-temperature environment, CGI softens and can boost the interfacial debonding at lower levels of stress compared to room temperature. Occurrence of interfacial debonding was reported at stress levels below 50 MPa at 723 K (450 °C) [18]. On the contrary, interfacial debonding was observed at a stress level above 495 MPa at room temperature [19]. At the macroscale, the strength of CGI rapidly decreases at temperatures above 573 K (300 °C) [20]. During the cooling process of spherical graphite iron from the casting to the room temperature, increased thermal residual stresses were also caused by the mismatch of thermal expansion [21]. Compressive stress is generated normally at the graphite-matrix interface, with perfect bonding between the two phases [21]. Residual stresses were measured in white and grey cast irons after the cooling-down stage in thermal experiments [22]. There were several attempts to research the mechanism of thermal expansion in metals, focusing on white and grey cast irons [22], Invar [23], and copper-based amorphous alloys [24], as well as in ceramic-metal composites [25], but not enough information is available about CGI. Additionally, it was found that under multiple thermal cycles, the performance of cast iron was significantly influenced by longer-term thermal exposure [26]. This effect of the cyclic thermal history will be considered in a separate study but is not presented in this work.
Further, the mechanical properties and the damage mechanism of cast iron are influenced by its microstructure, including the size, morphology, and distribution of the graphite phase [14,27,28,29]. For composites, the toughness and stiffness change with the increasing aspect ratio and volume fraction of the filler [30]. Compared to polymer-based composites, the reinforcement in cast irons—graphite—is softer and weaker than the matrix. The initiation of cracks occurs easier when graphite inclusions with larger sizes and higher content are present [13]. The elastic modulus of various cast irons is closely related to the shape of graphite inclusions [31,32,33]. The morphology of graphite and matrix features are also important for the tensile and yield strength [31,34], as well as thermal conductivity [35] and fatigue performance of cast irons. Generally, the yield stress and tensile strength decrease under increasing environmental temperatures [36]. With longer graphite inclusions, the fatigue life of cast irons becomes shorter [31]. Still, further research is required to investigate the correlation between macroscopic thermomechanical properties and microstructural parameters.
With the development of technology and science, cast irons have received much attention thanks to their extensive applications in industry. In 1863, microscopy offered opportunities for engineering researchers to explore and reveal the surface microstructure of cast irons at the microscopic scale [37]. The first macroscopic model proposing a method to predict failure in grey cast iron was presented in 1976 [38]. In recent studies, the main methodology of numerical simulations on the thermomechanical performance in cast irons includes phenomenological and micromechanical modelling schemes. In the phenomenological case, to describe the macroscopic behaviour of the material, the fracture mechanism and microstructural features are implemented by modifying the hardening parameters and yield surface [38,39,40,41,42]. In micromechanical approaches, the prediction of the effect of its microstructure on the mechanical response is based on the direct introduction of microstructure parameters into simulations [4,43]. Generally, the constituents in numerical simulations are assumed to be elastoplastic [44] or anisotropic [45].
In summary, the interfacial debonding mechanism in CGI was primarily studied under mechanical loads. Accordingly, the thermal analysis in cast iron was mainly focused on spherical graphite iron [21]. There is insufficient research into the mechanism of thermal damage in CGI under pure thermal loading at the microscale [46]. Under high-temperature conditions, CGI is vulnerable due to the mismatch of thermal expansion between graphite inclusions and its metallic matrix. Further research on thermal interfacial debonding in CGI is still required, which should account for its complex microstructure. This work investigates the effect of CGI microstructure on thermomechanical performance under pure thermal loading by developing a series of three-dimensional numerical models. The input parameters of the models were obtained from mechanical tests and statistical characterisation of the CGI microstructure.

2. Microstructural Characterisation of CGI

A specimen of CGI (EN-GJV-450) was prepared through processes of cutting, grinding, and polishing. Statistical characterisation of the microstructure of CGI was implemented using a set of 20 scanning electron microscopy (SEM) images captured with an FEGSEM Jeol 7100 (Jeol Ltd., Tokyo, Japan). The analysis was performed with ImageJ software (1.52u, ImageJ, National Institutes of Health, Bethesda, MD, USA) and included the process of scale setting, threshold adjustment, and shape outline adjustment of graphite inclusions (Figure 2). The microstructural features were approximated as ellipses. The characterisation provided geometrical parameters such as area, perimeter, circularity, volume fraction, and lengths of the major and minor axes of graphite inclusions.
Using the 2D micrographs, the following assumptions regarding the geometry of both graphite inclusions and the metallic matrix in 3D numerical models were made:
  • Spherical (nodular) graphite in 2D was modelled as a sphere in 3D.
  • Vermicular graphite inclusions in 2D were simulated as oblate spheroids in 3D.
  • Flake graphite inclusions in 2D were considered as plates, becoming cuboid with increasing width and height in 3D.
  • The length of the major axis in vermicular graphite and the length of flake graphite were assumed equal to the diameter of a spherical graphite.
  • The rectangular matrix domain in 2D corresponded to a cuboid with equal length and width in 3D.
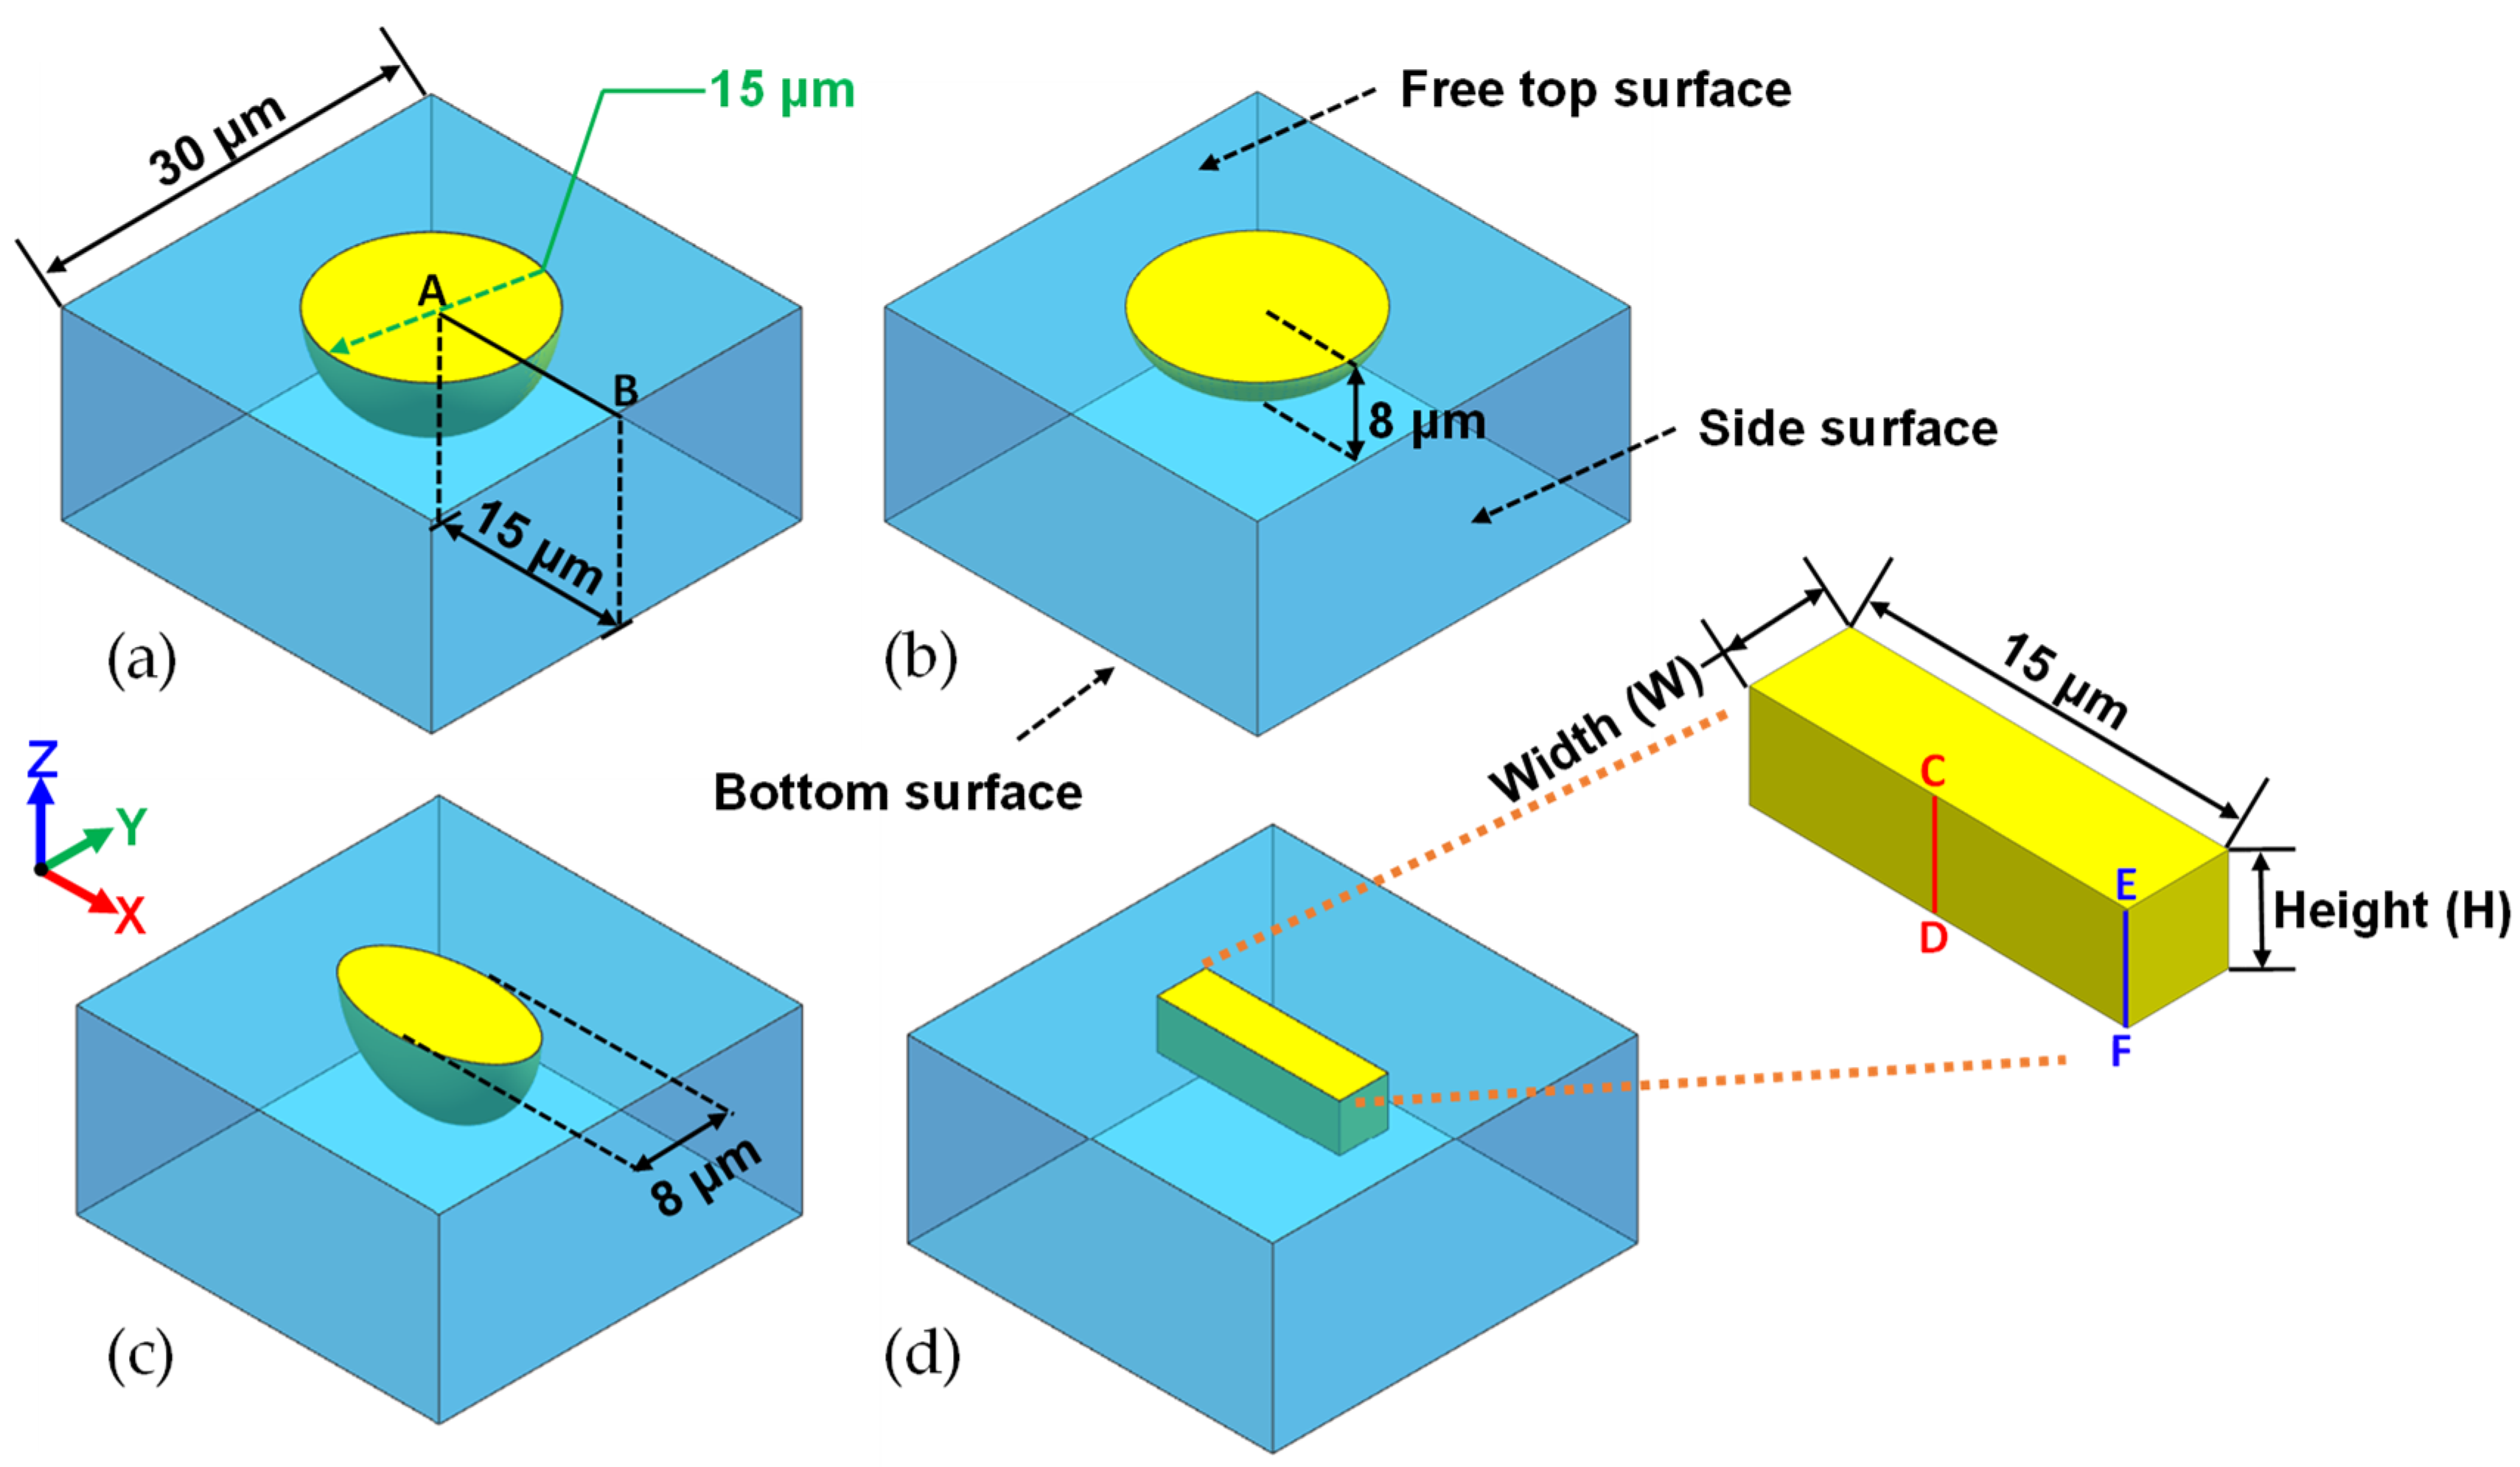
The simulation methodology relied on representative volume elements (RVEs) that can represent a constituent at the macroscale with a unit cell at the microscale [29]. A set of 3D unit cells was developed in this study, in which a single graphite inclusion was embedded on the surface of the cuboid metallic matrix domain (Figure 4). This approach was selected based on the possibility to observe surface processes in opaque specimens.

3. Thermal Experiments

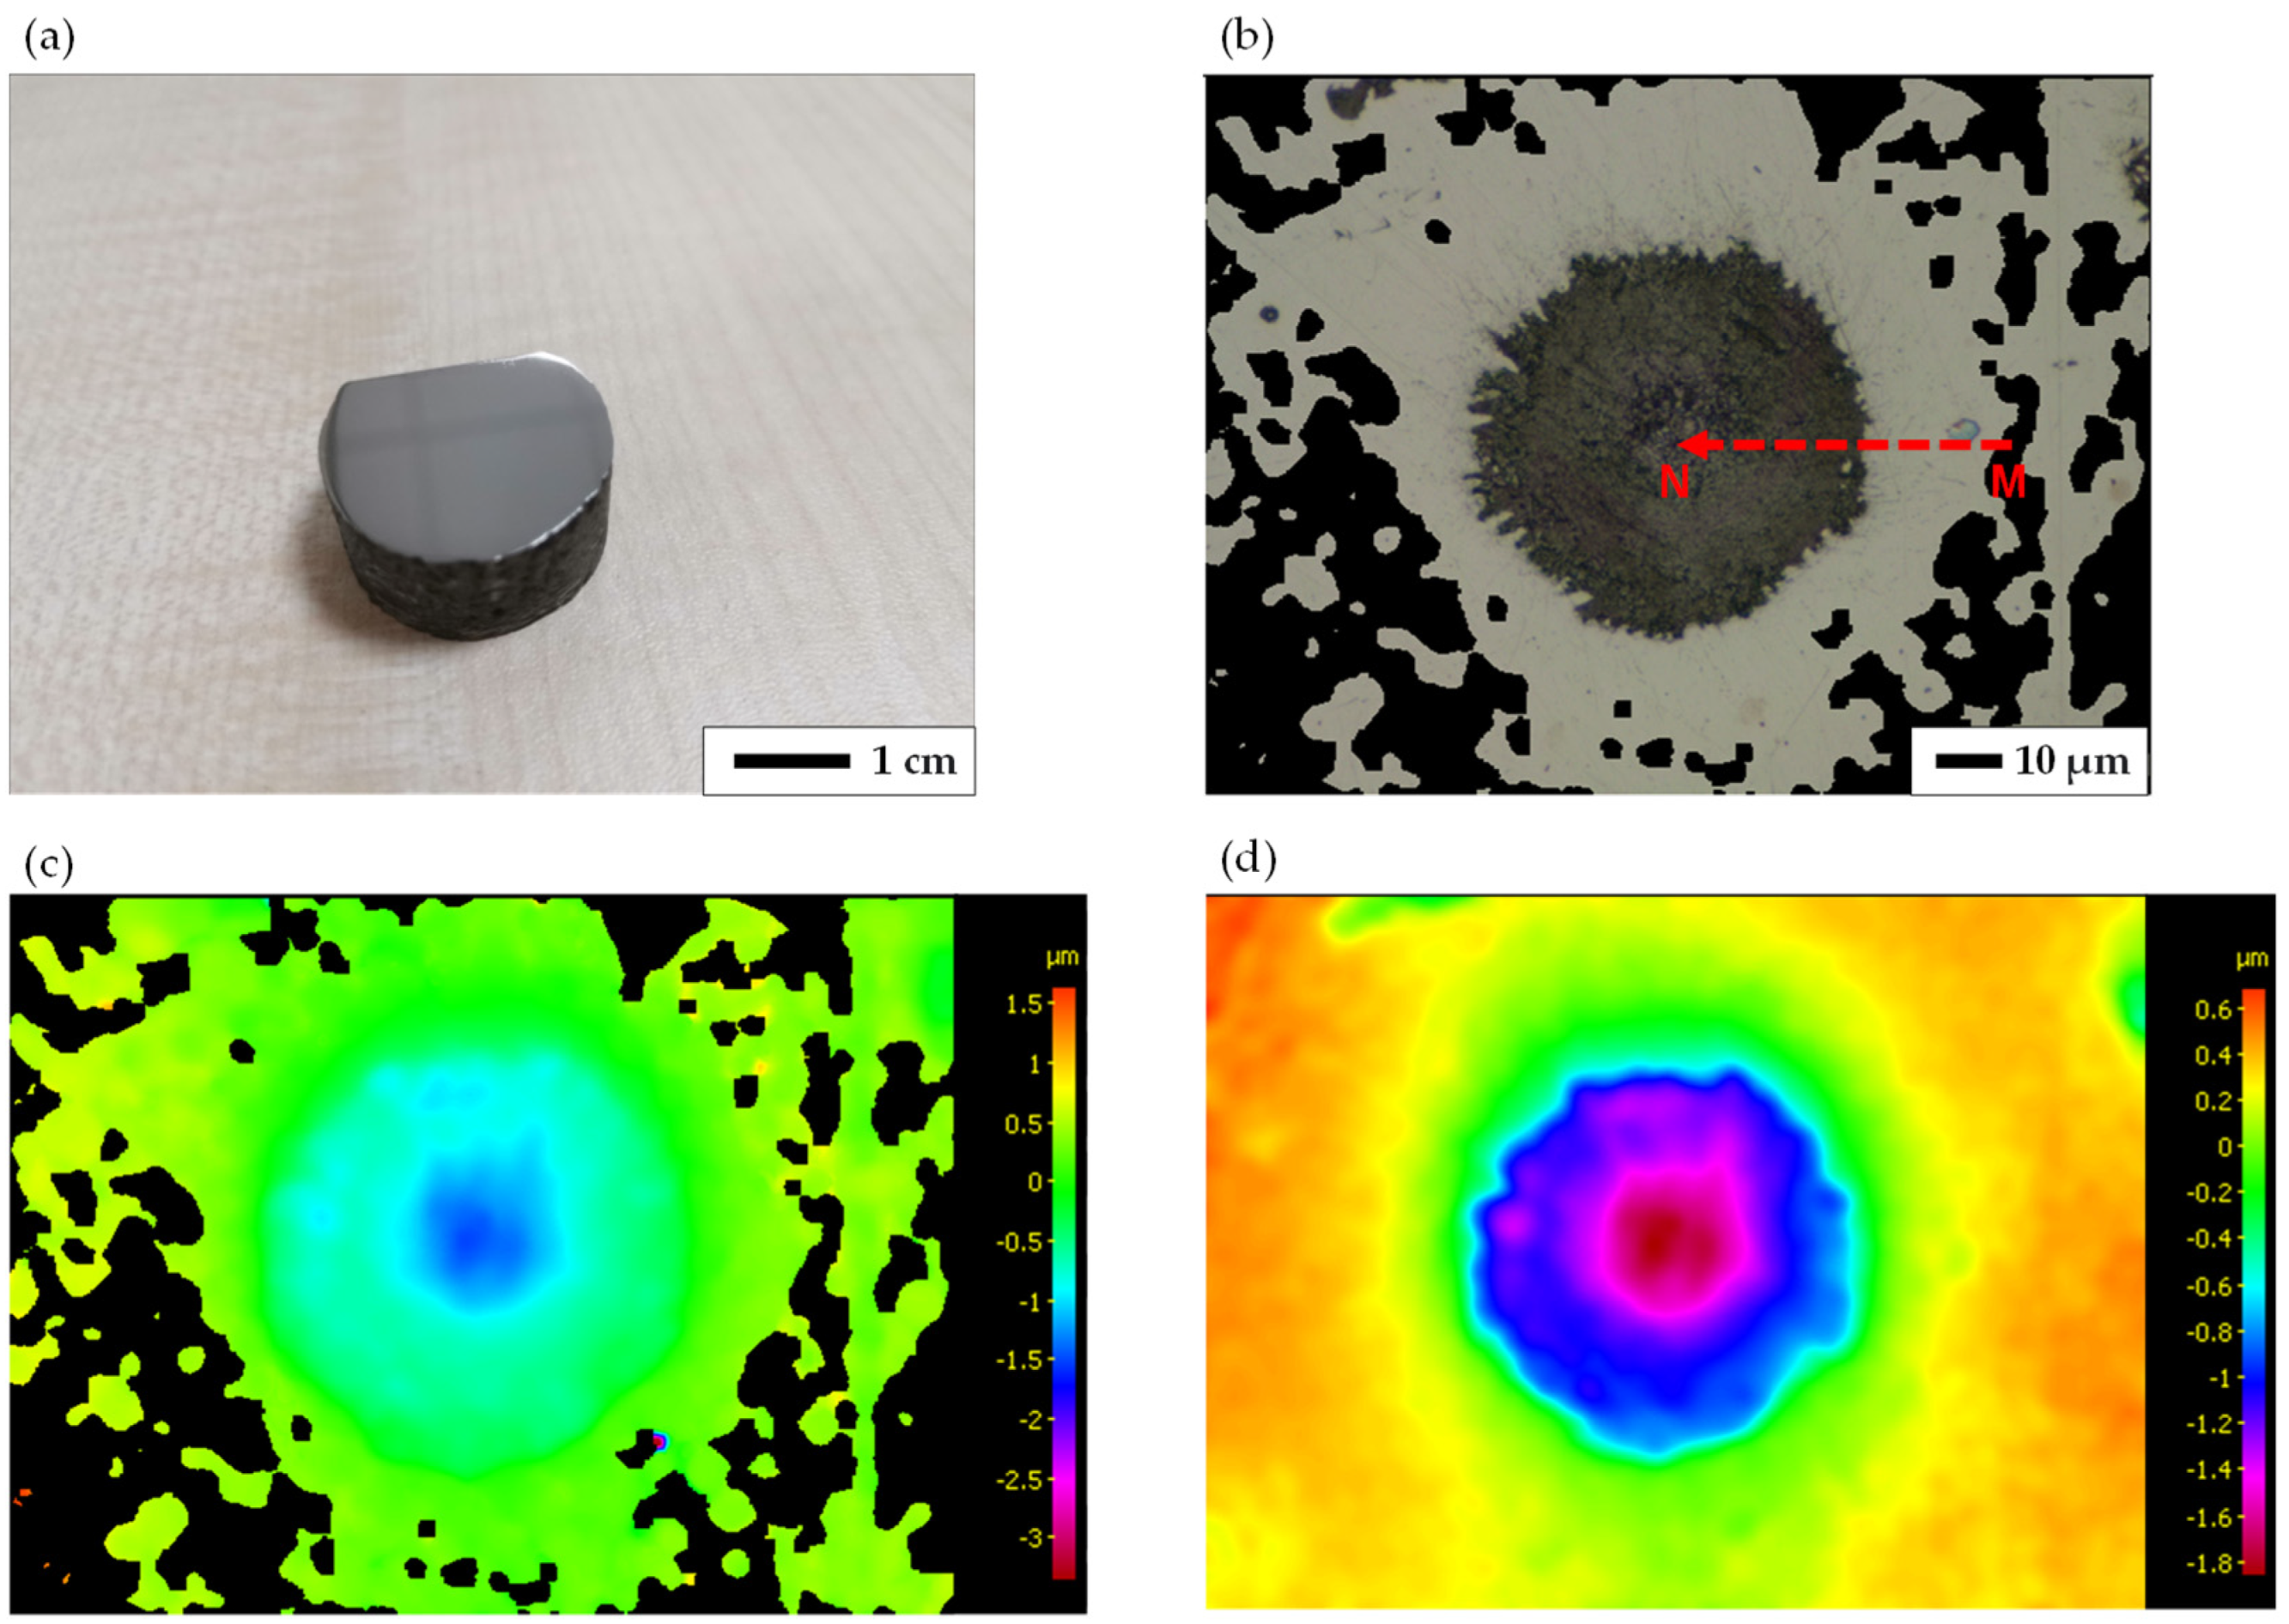
To study the effect of a thermal loading regime on the expansion of CGI, a specimen was prepared with its top surface polished at the 1 µm level (Figure 3a).
The CGI specimen was scanned with an Alicona surface measurement system to obtain the height profile of the microstructure before its exposure to heating. Then, the specimen was heated in a furnace from room temperature to 500 °C with a heating rate of 4 °C/min and cooled down to room temperature with a cooling rate of 10 °C/min. The visual analysis demonstrated that the specimen’s oxidation was negligible due to the relatively short duration of the experiment. After the heating cycle, the specimen’s profile was again measured. Eight graphite inclusions were selected in the microstructure, and every graphite particle was scanned with an Alicona InfiniteFocus G5+ (Bruker Alicona, Graz, Austria). Their microstructure was measured in terms of the height along path MN (direction from the matrix to the graphite particle) (Figure 3b) before and after the thermal load for comparison.
The height difference between the matrix and the graphite particle for all thermal experiments is summarised in Table 1. The values of height difference are in the range of 0.065–0.212 μm due to the mismatch in coefficients of thermal expansion. These experimental results were later compared with numerical simulations.

4. Numerical Models

4.1. Geometry

Based on the assumptions for the microstructure characterisation of CGI, the geometry of the nodular graphite was obtained by the following calculations.
The dimensional parameters of spherical graphite inclusions follow the expressions:
A = π D 2 2 ,
S = L 2 D 2 ,
V f = A S .
The 3D parameters of numerical models were calculated as follows:
V g = 4 3 π D 2 3 ,
V = L 3 D 3 ,
V f = V g V .
According to Equations (1)–(6), the 3D parameters of the metallic matrix domain were obtained as follows:
L 2 D = π D 2 2 V f ,
L 3 D = 4 3 π D 2 3 V f 3 .
The aspect ratio ( A R ) of the vermicular graphite inclusion was calculated with the following equations:
A R = L m a j o r L m i n o r ,
L m a j o r = D .
The numerical models were developed as a unit cell of the metallic matrix domain containing a spherical, a vermicular, or a flake graphite inclusion on the top surface, with the evolution of the microstructure considered for the free material surface. In these models, the two phases—the graphite particles and the matrix—were considered to have perfect bonding (the interfacial processes and their effect are studied separately and will be published elsewhere). For comparability with the thermal experiments, the cross-sectional surfaces of graphite particles were embedded on the surface of the matrix cube (Figure 4). The dimensional parameters of the created FEA models were determined based on the range of nodular graphite diameters measured by SEM images. The diameters of spherical graphite particles varied between 0.29 and 42.53 μm; thus, 15 μm was selected for numerical simulations. For vermicular graphite inclusions, 15 μm was considered the length of the major axis. The aspect ratios of graphite in the statistical results were between 1 and 5, corresponding to the minor axis lengths of 15 μm and 3 μm; therefore, 8 μm was used as the minor axis length in vermicular graphite particles. Specifically, the graphite was embedded on the matrix surface in two different directions: minor axis (Model B) and major axis (Model C) along the Z direction in Figure 4. For flake graphite, the width and height were varied (Table 2) to investigate the effect of the aspect ratio and volume fraction on the obtained results (Model E). In all models, 15 μm was selected to be the diameter (D) of the spherical graphite particle, the length of the major axis ( L m a j o r ) of vermicular graphite, and the length (L) of all flake graphite particles. According to the 2D statistical analysis, the dimensions of the cubic matrix in 3D were calculated between 25.74 and 32.23 μm; thus, 30 μm was selected in this work for consistency. The external dimensions of the matrix domain were set as 30 μm × 30 μm × 15 μm. The typical dimension of the finite element was 0.5 μm.

4.2. Constitutive Behaviour

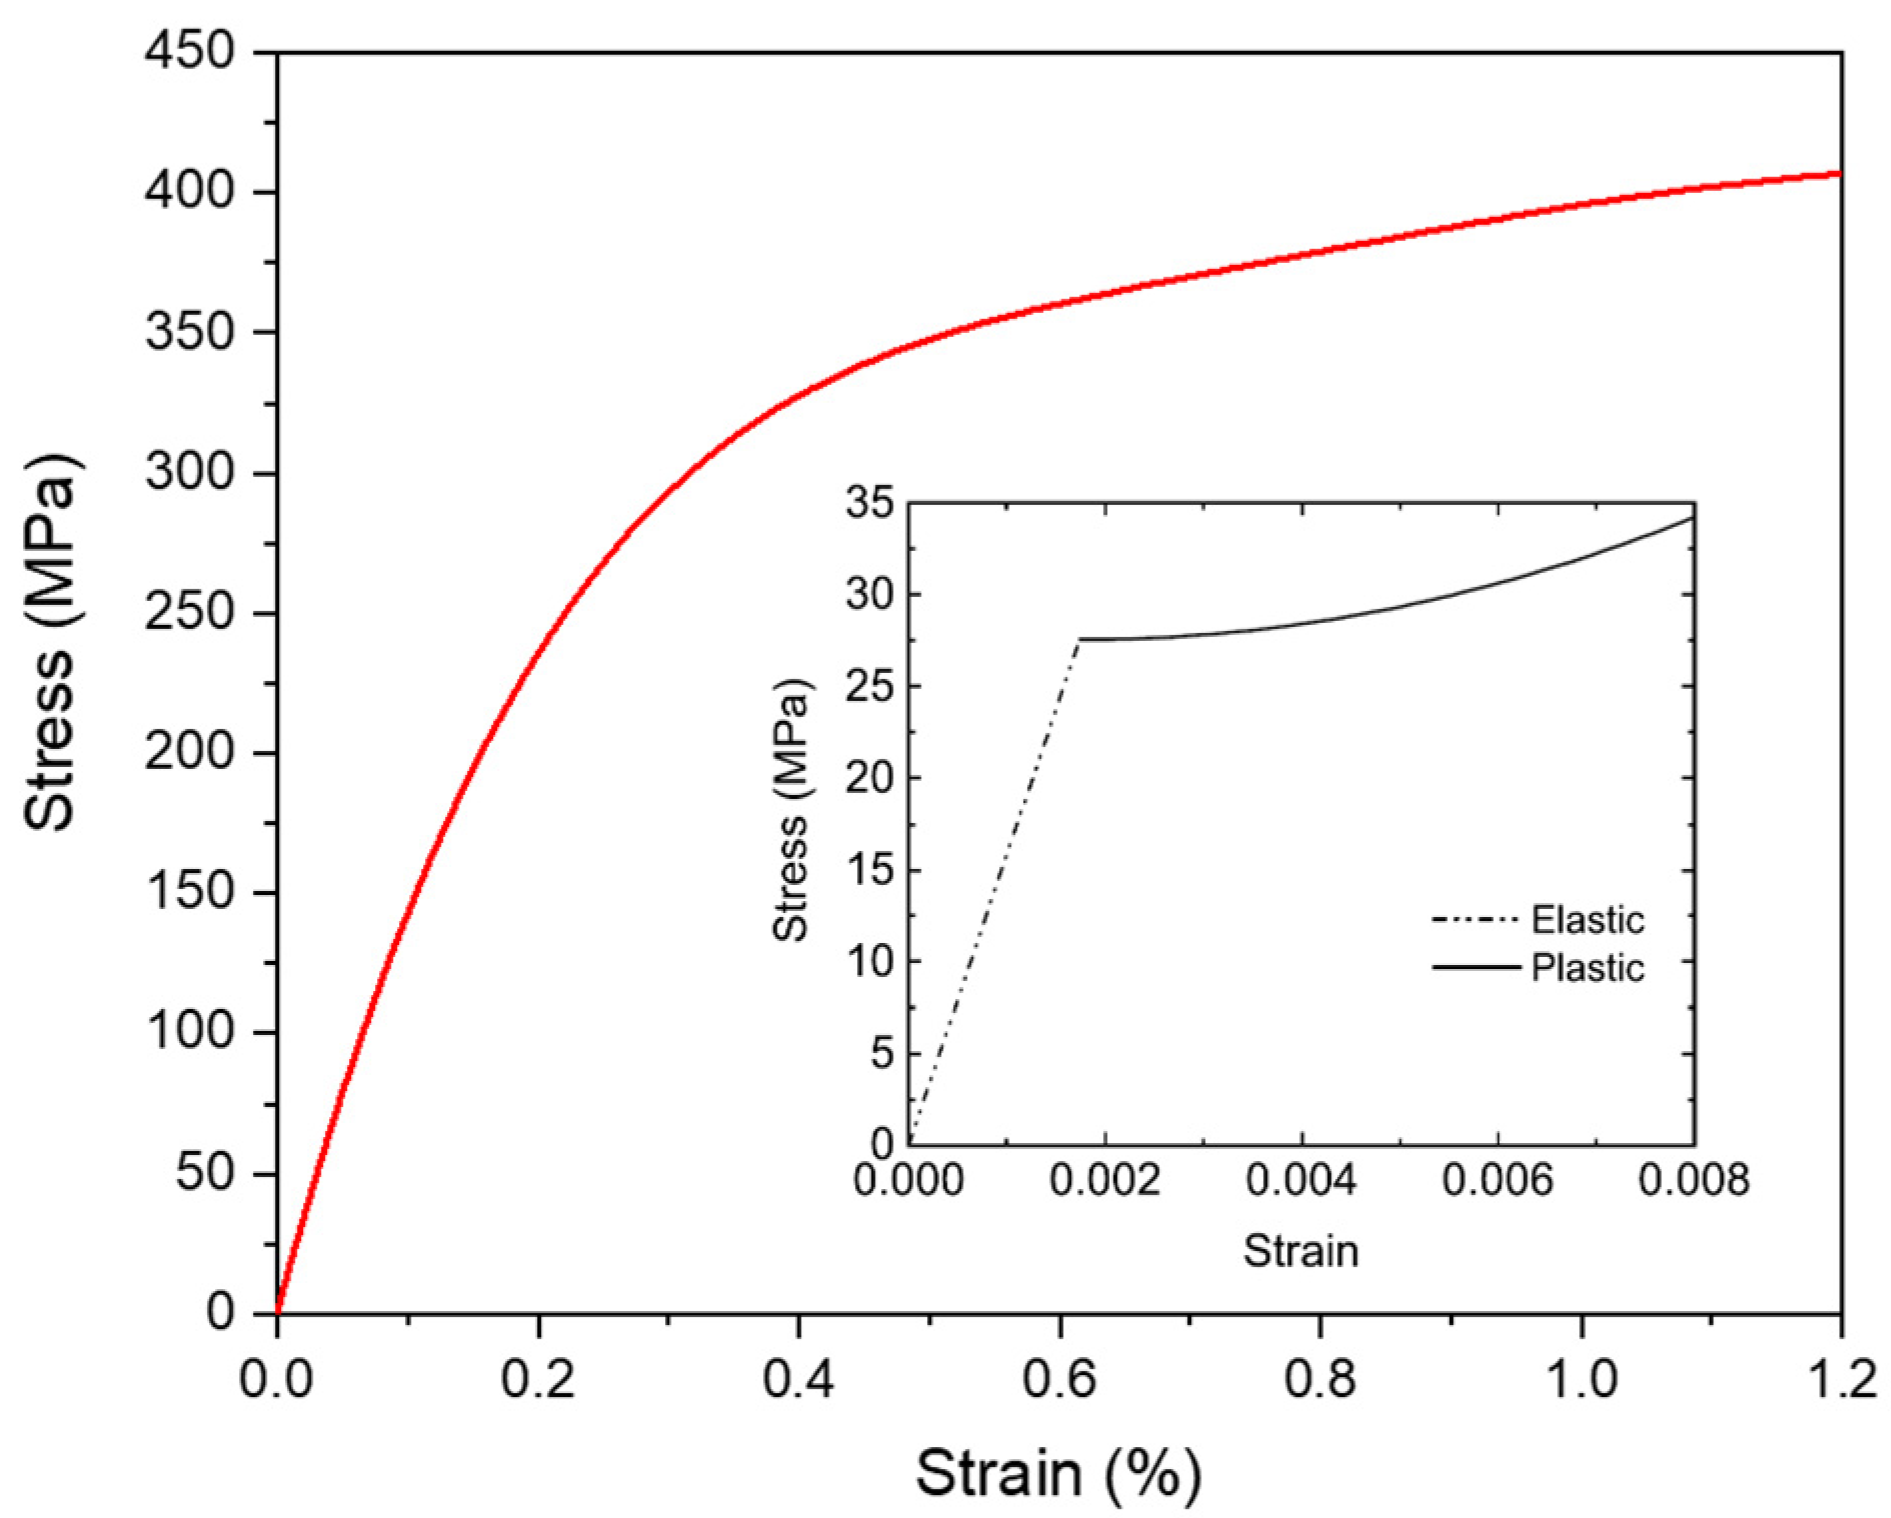
Due to their soft and brittle behaviour, graphite particles were assumed to display a limited plastic performance in previous numerical models [47,48,49]. Since the inter-particle distances in CGI are smaller than the model’s dimensions, the metallic matrix domain had the effective properties of CGI as used—together with those of graphite inclusions—in our previous 2D study [46,50]. A typical experimental stress–strain curve of CGI (Figure 5) was used in this work. The J2 flow theory was considered to describe the mechanical behaviour of both the graphite inclusions and the metallic matrix [51].
A damage model was employed to capture the graphite phase’s response beyond the elastic region. Damage was initiated when a plastic strain-based criterion was fulfilled and, afterwards, the stiffness of the material gradually degraded to 0. The integral ductile damage criterion follows the equation [52]:
ω D = d ε ¯ D p l ε ¯ D p l η , ε ¯ ˙ D p l = 1 ,
where ω D is the state variable increasing monotonically. At each increment, the ω D increment is given by:
Δ ω D = Δ ε ¯ D p l ε ¯ D p l η , ε ¯ ˙ D p l 0 ,
where ε ¯ D p l η , ε ¯ ˙ D p l is the plastic strain at the onset of damage and ε ¯ ˙ D p l is the plastic strain rate. Stress triaxiality ( η ) is the main parameter in this damage criterion, determined as:
η = p q ,
where q is the von Mises equivalent stress and   p is the pressure.
After initiation, the damage was assumed to evolve linearly with deformation. A finite element was deleted when the damage value exceeded a set threshold value at all integration points in the given element.

4.3. Boundary and Loading Conditions

Depending on the type of the component and its fixture in any system, two types of boundary conditions may be considered as upper and lower bounds in the case of thermal loading. If there is no possibility of the material to expand under pure thermal loading because of constraints, fully fixed boundary conditions (FFBCs) should be used. On the other hand, if material expansion is not constrained, periodic boundary conditions (PBCs) along the faces of the material domain seem the best way to model it. In real-life situations, characterised by different extents of constraints, the material behaviour can be anywhere between these two bounds.
The PBCs are extensively used in numerical models to simulate the mesoscopic and microscopic behaviours of the constituents with RVEs [53]. These BCs permit simulations of deformation in RVE models, where a small domain can represent the corresponding infinitely large system, allowing the distortion of boundary surfaces [54]. In a model with PBCs, a pair of two points ( x and x + d ) with distance d on the two corresponding boundary surfaces should follow the condition:
u x + d = u x + ε ¯ d ,
t x + d = t x ,
where u is the displacement at x and t is the traction, respectively, and ε ¯ is the parameter of the average infinitesimal strain over the volume [55]. In this study, when the side surfaces of models were under PBCs, the bottom surfaces were free at the XY plane for expansion. FFBCs were used to constrain all six degrees of freedom for all nodes along the side and bottom boundary surfaces in each model. PBCs and FFBCs were applied for comparison on the side surfaces in numerical models. Pure thermal loading with linear evolution of 20 °C −500 °C −20 °C was applied to all the models. A full set of the developed models with their boundary conditions is presented in Table 2.

5. Results of Numerical Simulations

5.1. Height Profile of Graphite and Matrix in Numerical Simulations

The height profile of the graphite inclusion and the matrix under FFBCs was measured along Path AB (see Figure 4a) from the centre of the graphite particle to the matrix surface (Figure 6). FFBCs limited the thermal expansion of graphite (0 μm to 7.5 μm of path AB) and the metallic matrix (7.5 μm to 15 μm of path AB) in the XY plane. Before the thermal loading, the height of both phases was 0 µm. Under thermal loading, the reaction force from the metallic matrix with the higher CTE caused compressive stresses in the inclusion, resulting in a larger magnitude of the out-of-plane displacement U3 in the graphite phase (up to 0.42 µm) compared to that in the matrix. The displacement U3 of the graphite in Models D1 to H1 at 500 °C was larger than that at 20 °C due to the shrinkage of the two constituents during the cooling-down process. For Models D1, E1, and F1, the displacement U3 of graphite decreased with the increasing width of flake graphite inclusions when its height (4 µm) was kept constant, both at 500 °C and 20 °C. Due to the lower coefficient of thermal expansion of graphite, a larger volume of graphite (and smaller of the matrix) led to a higher displacement U3 in Model D1. For Models F1, G1, and H1 with the same width (8 µm), the displacement U3 of graphite increased as the height of the particles became larger.
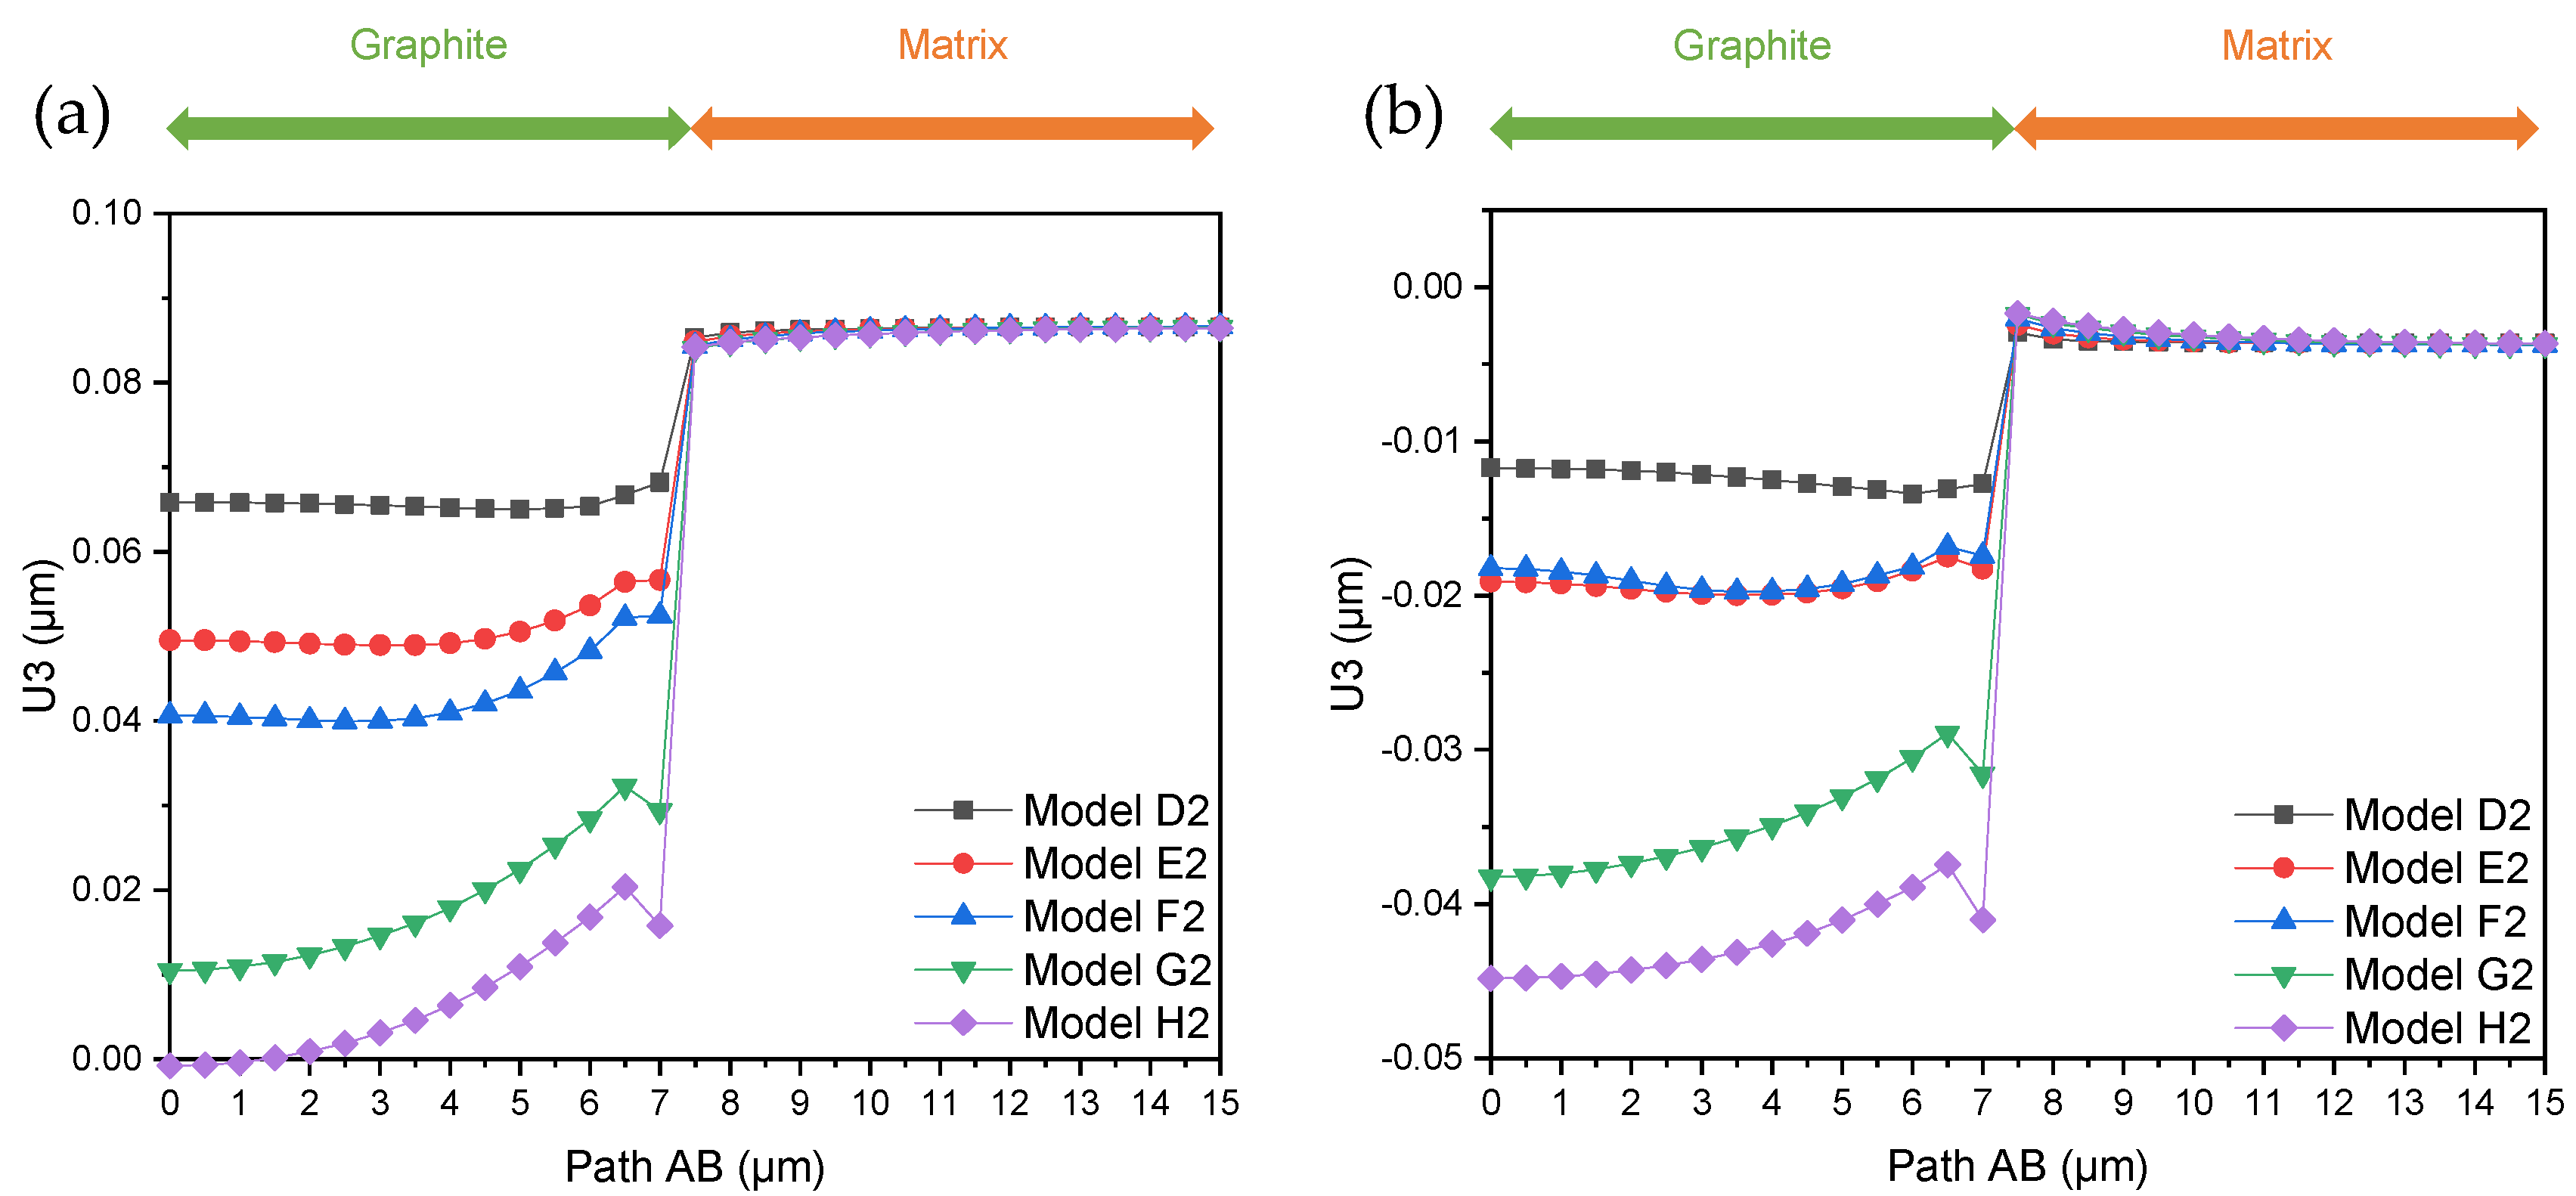
On the contrary, the thermal expansion of graphite was smaller than that of the matrix under PBCs since they allowed unconstrained expansion of the model. For Models D2 to F2 (Figure 7) with the same inclusion height of 4 μm, there was a clear difference in the displacement profile for the two domains as the inclusion’s width increased from 2 to 8 μm. The same mechanism occurred in Models F2, G2, and H2 with a width of 8 μm: as the volume of graphite became larger with the increasing height from 4 to 12 μm, the thermal expansion was reduced, since the volume of the matrix was decreased. The displacement U3 of both constituents decreased from 500 °C to 20 °C due to a shrinkage phenomenon.
The results of the height difference between the matrix and the graphite phase in the thermal experiments were in the range of 0.065 μm to 0.212 μm (Table 1). This range is between the respective results obtained in numerical simulations under FFBCs and PBCs.

5.2. Temperature of Damage Initiation

The next part of the study deals with the effect of dimensions of vermicular and spherical graphite particles since they play an important part in the thermomechanical behaviour of CGI.
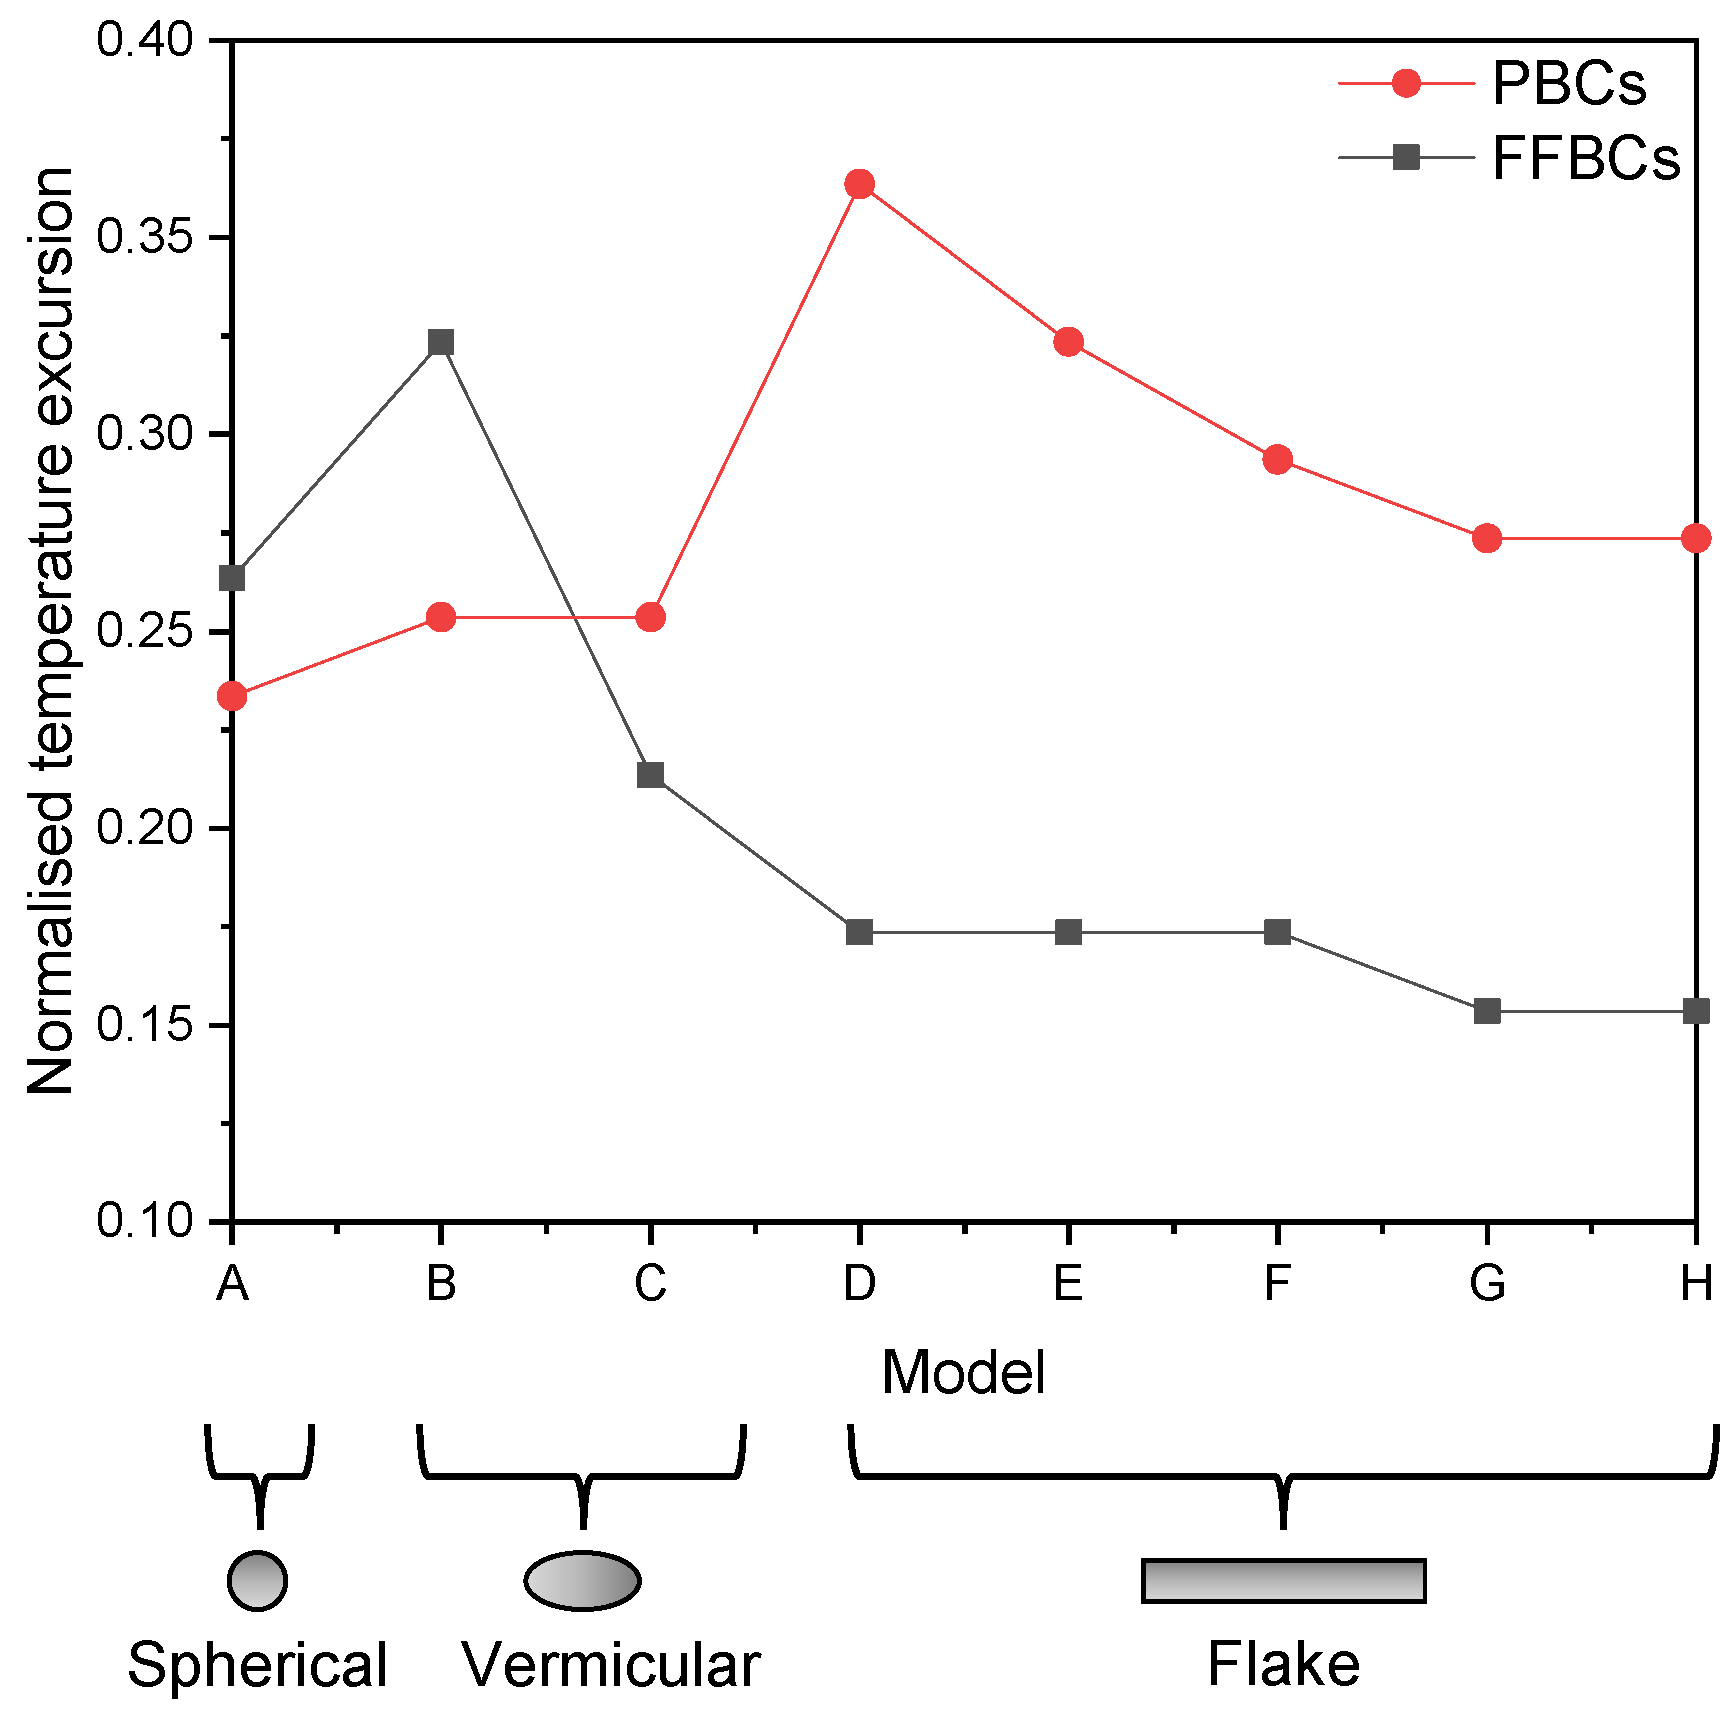
The temperature excursion corresponding to damage initiation in graphite was assessed for both PBCs and FFBCs, and a magnitude normalised with the range of applied thermal load was used for comparability (Figure 8). For spherical graphite (Model A), damage initiated at a lower temperature level under PBCs than FFBCs as less compressive stresses were developed in the former case. On the other hand, in Models D to H, corresponding to flake particles, damage started earlier for both BCs, when either the particle width or height increased. In Models B and C of vermicular graphite cases, PBCs did not affect the damage initiation, but under FFBCs a much earlier onset of damage was noted for Model C. This was attributed to the larger aspect ratio of the particle in Model C, which made the role of the contact surface between graphite and the matrix more prominent. Thus, the higher levels of the volume and aspect ratio of graphite and the increased contact surface between the two phases caused damage at a lower temperature.

5.3. Damage Profile in Graphite at the Interface

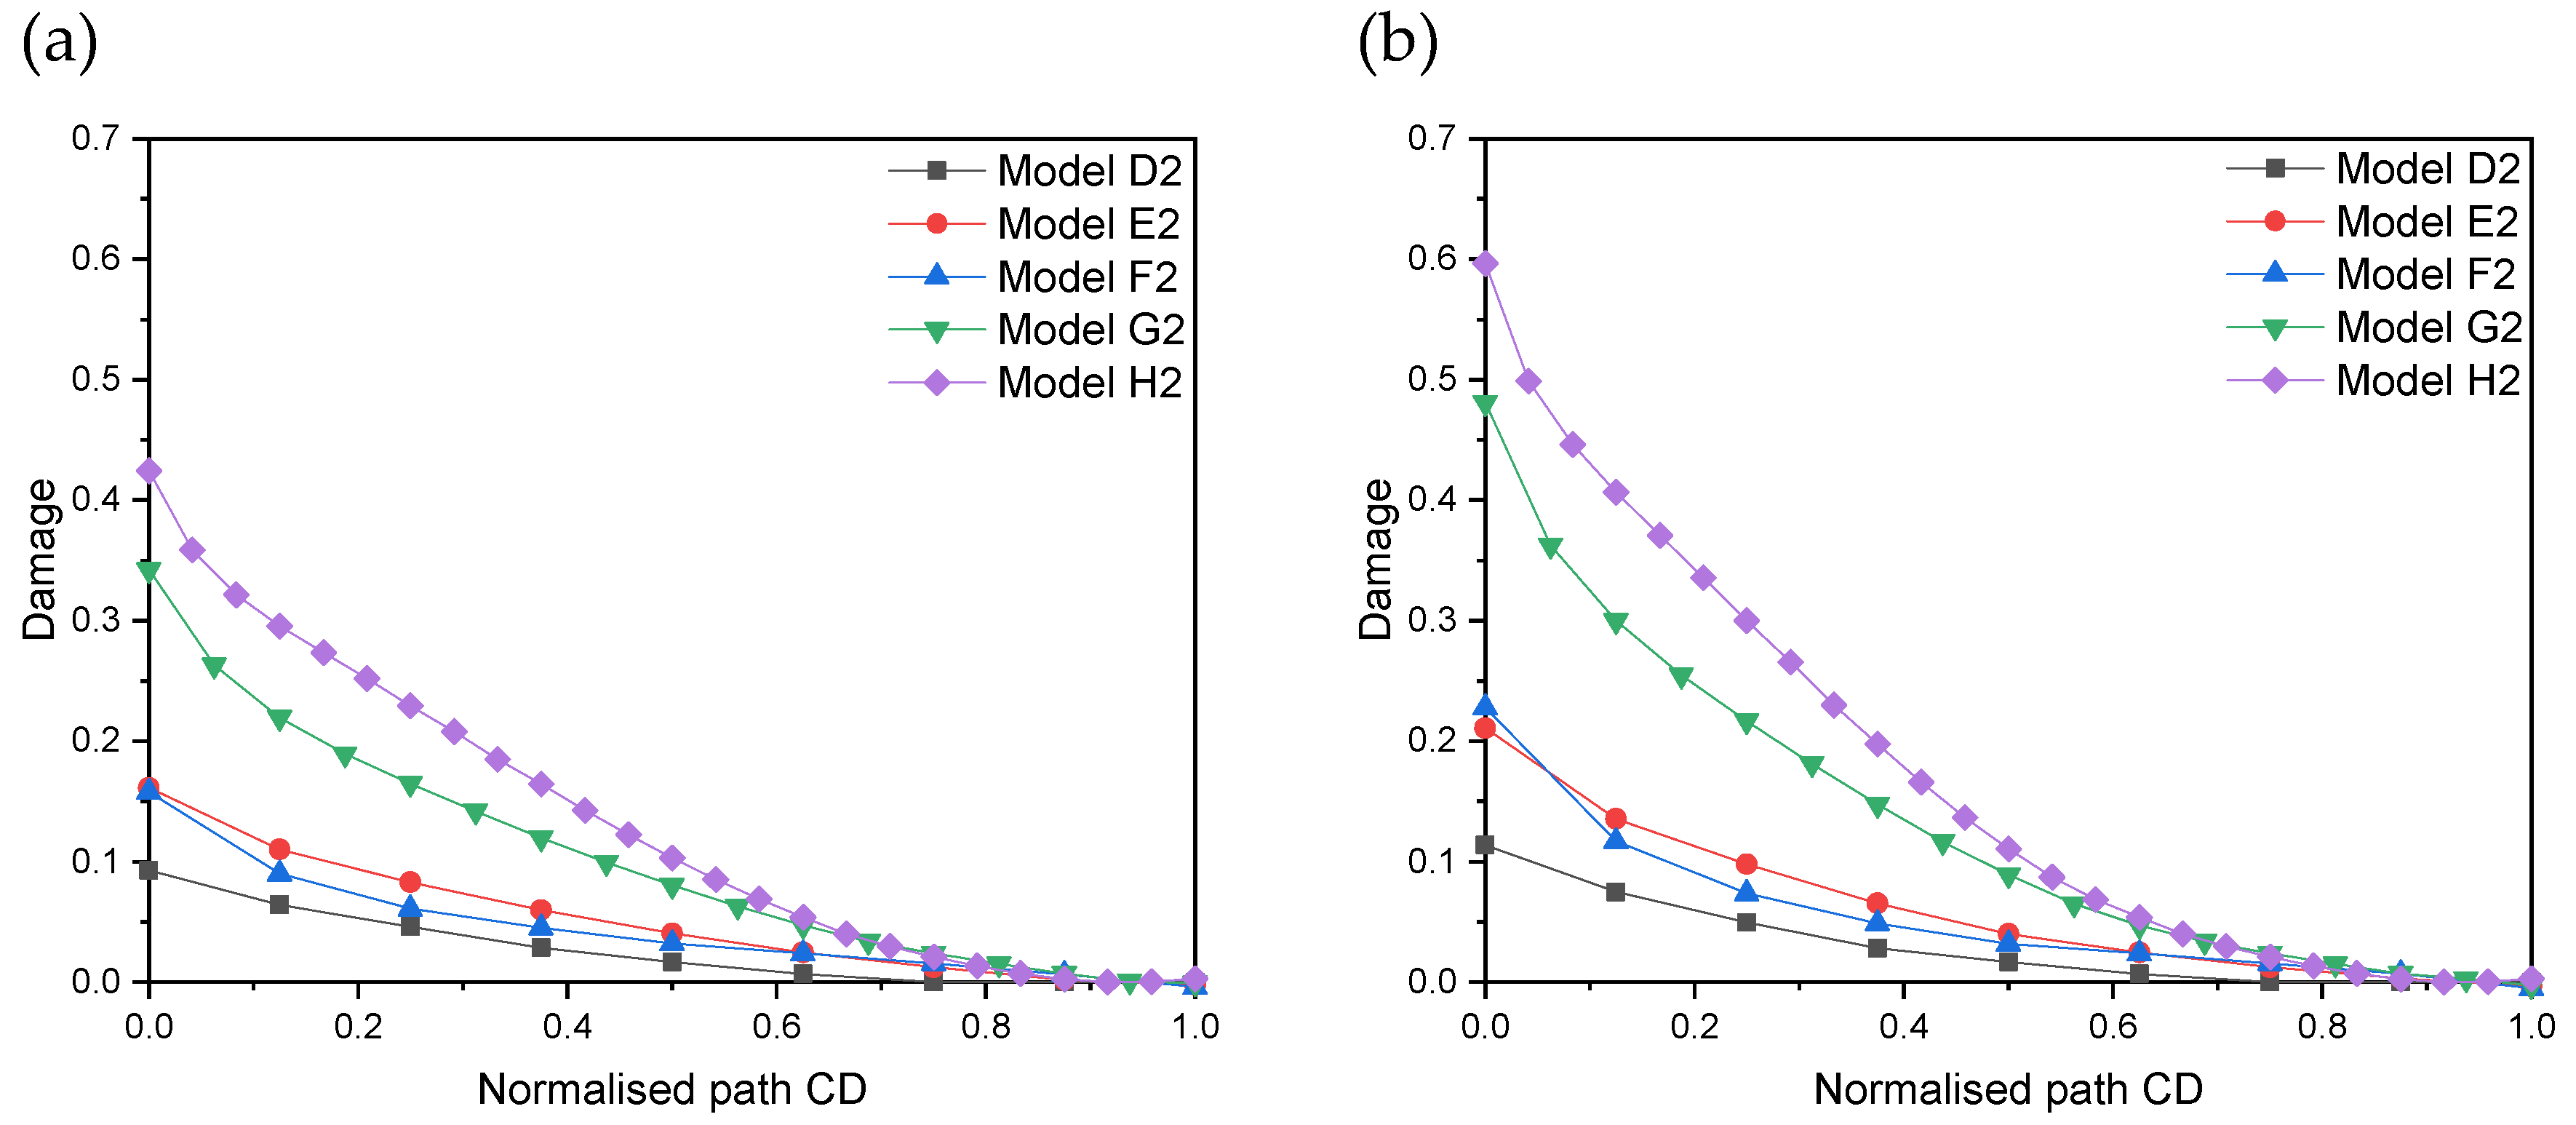
The damage profile in graphite at the interface between the two phases under FFBCs at different temperatures is summarised in Figure 9. For the flake graphite cases (Models D1 to H1), damage appeared due to the mismatch of thermal expansion between the graphite and matrix phases and was consistent with the trend of displacement U3 in Figure 6. For a constant width of 8 μm, damage grew as the height of graphite increased from 4 to 12 μm (Models F1, G1, and H1). Higher levels of damage appeared at the edge of the contact interface at points C and D (Figure 4d), assuming the perfect bonding between the two constituents. The maximum damage of graphite was at the edge of the connection between the contact interface and the top surface between the two phases (point C). Damage accumulated during the cooling-down process under FFBCs. For the larger volume of graphite (Model H1), damage equal to 1 (i.e., debonding) was reported close to point C and propagated along the path CD during the cooling-down process.
Accordingly, the damage profile in graphite at the interface between the two constituents for flake models under PBCs is shown in Figure 10. As in FFBCs, the maximum damage was at point C and along the edge of the connection between the free top surface and the graphite-matrix interface due to the mismatch of thermal expansion. Due to fewer constraints to expansion, the maximum damage for PBCs was equal to 0.6 (Model H2), significantly lower than the corresponding case for FFBCs (equal to 1). The comparison of damage evolution between D2, E2, F2 and F2, G2, H2 showed the same trend with the thermal expansion about the displacement U3 (Figure 7). Higher levels of damage in the model with a larger volume of graphite inclusion were driven by higher compressive stresses from the metallic matrix. Additionally, damage accumulated during the cooling-down process under PBCs.
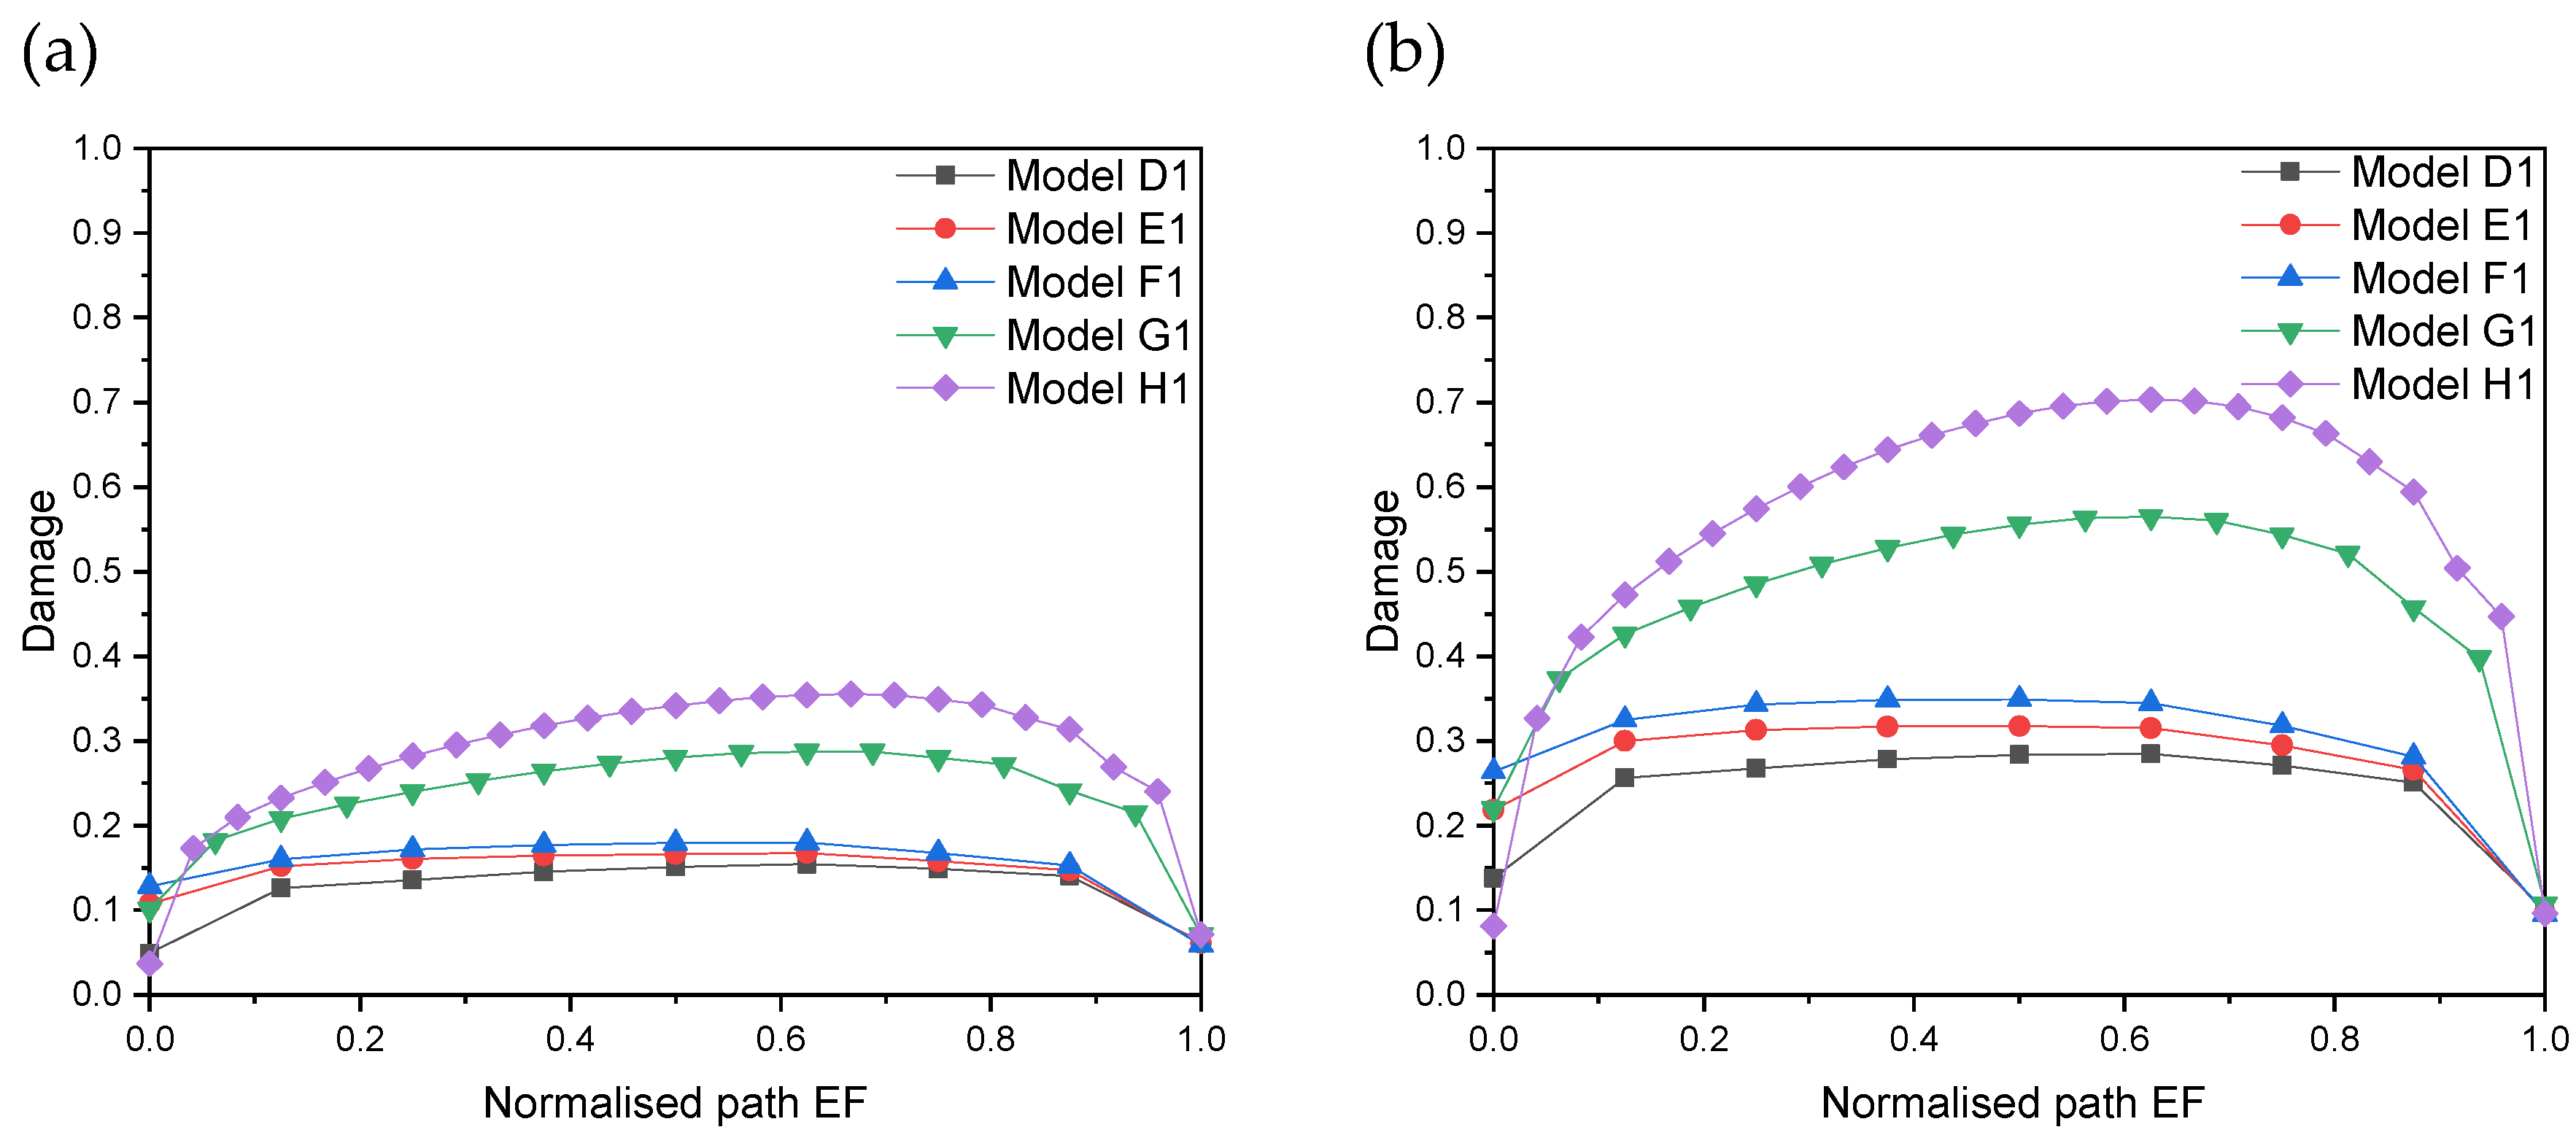
Further, the damage profile in graphite at the interface under FFBCs was measured along the path EF (see Figure 4d) at different temperatures (Figure 11). Similar to previous results, damage became more significant in graphite particles of a larger volume (Models F1, G1, and H1) and accumulated during cooling from 500 °C to 20 °C. In the flake graphite cases with shapes of plate (Model D) or cuboid (Model H), damage along the path EF was smaller than the path CD, since the compressive stresses were normal to the contact interface. Damage was not observed along path EF in models under PBCs due to the fewer kinematical constraints and less developed compression (Figure 12).

5.4. Stress Distribution in Graphite and Matrix

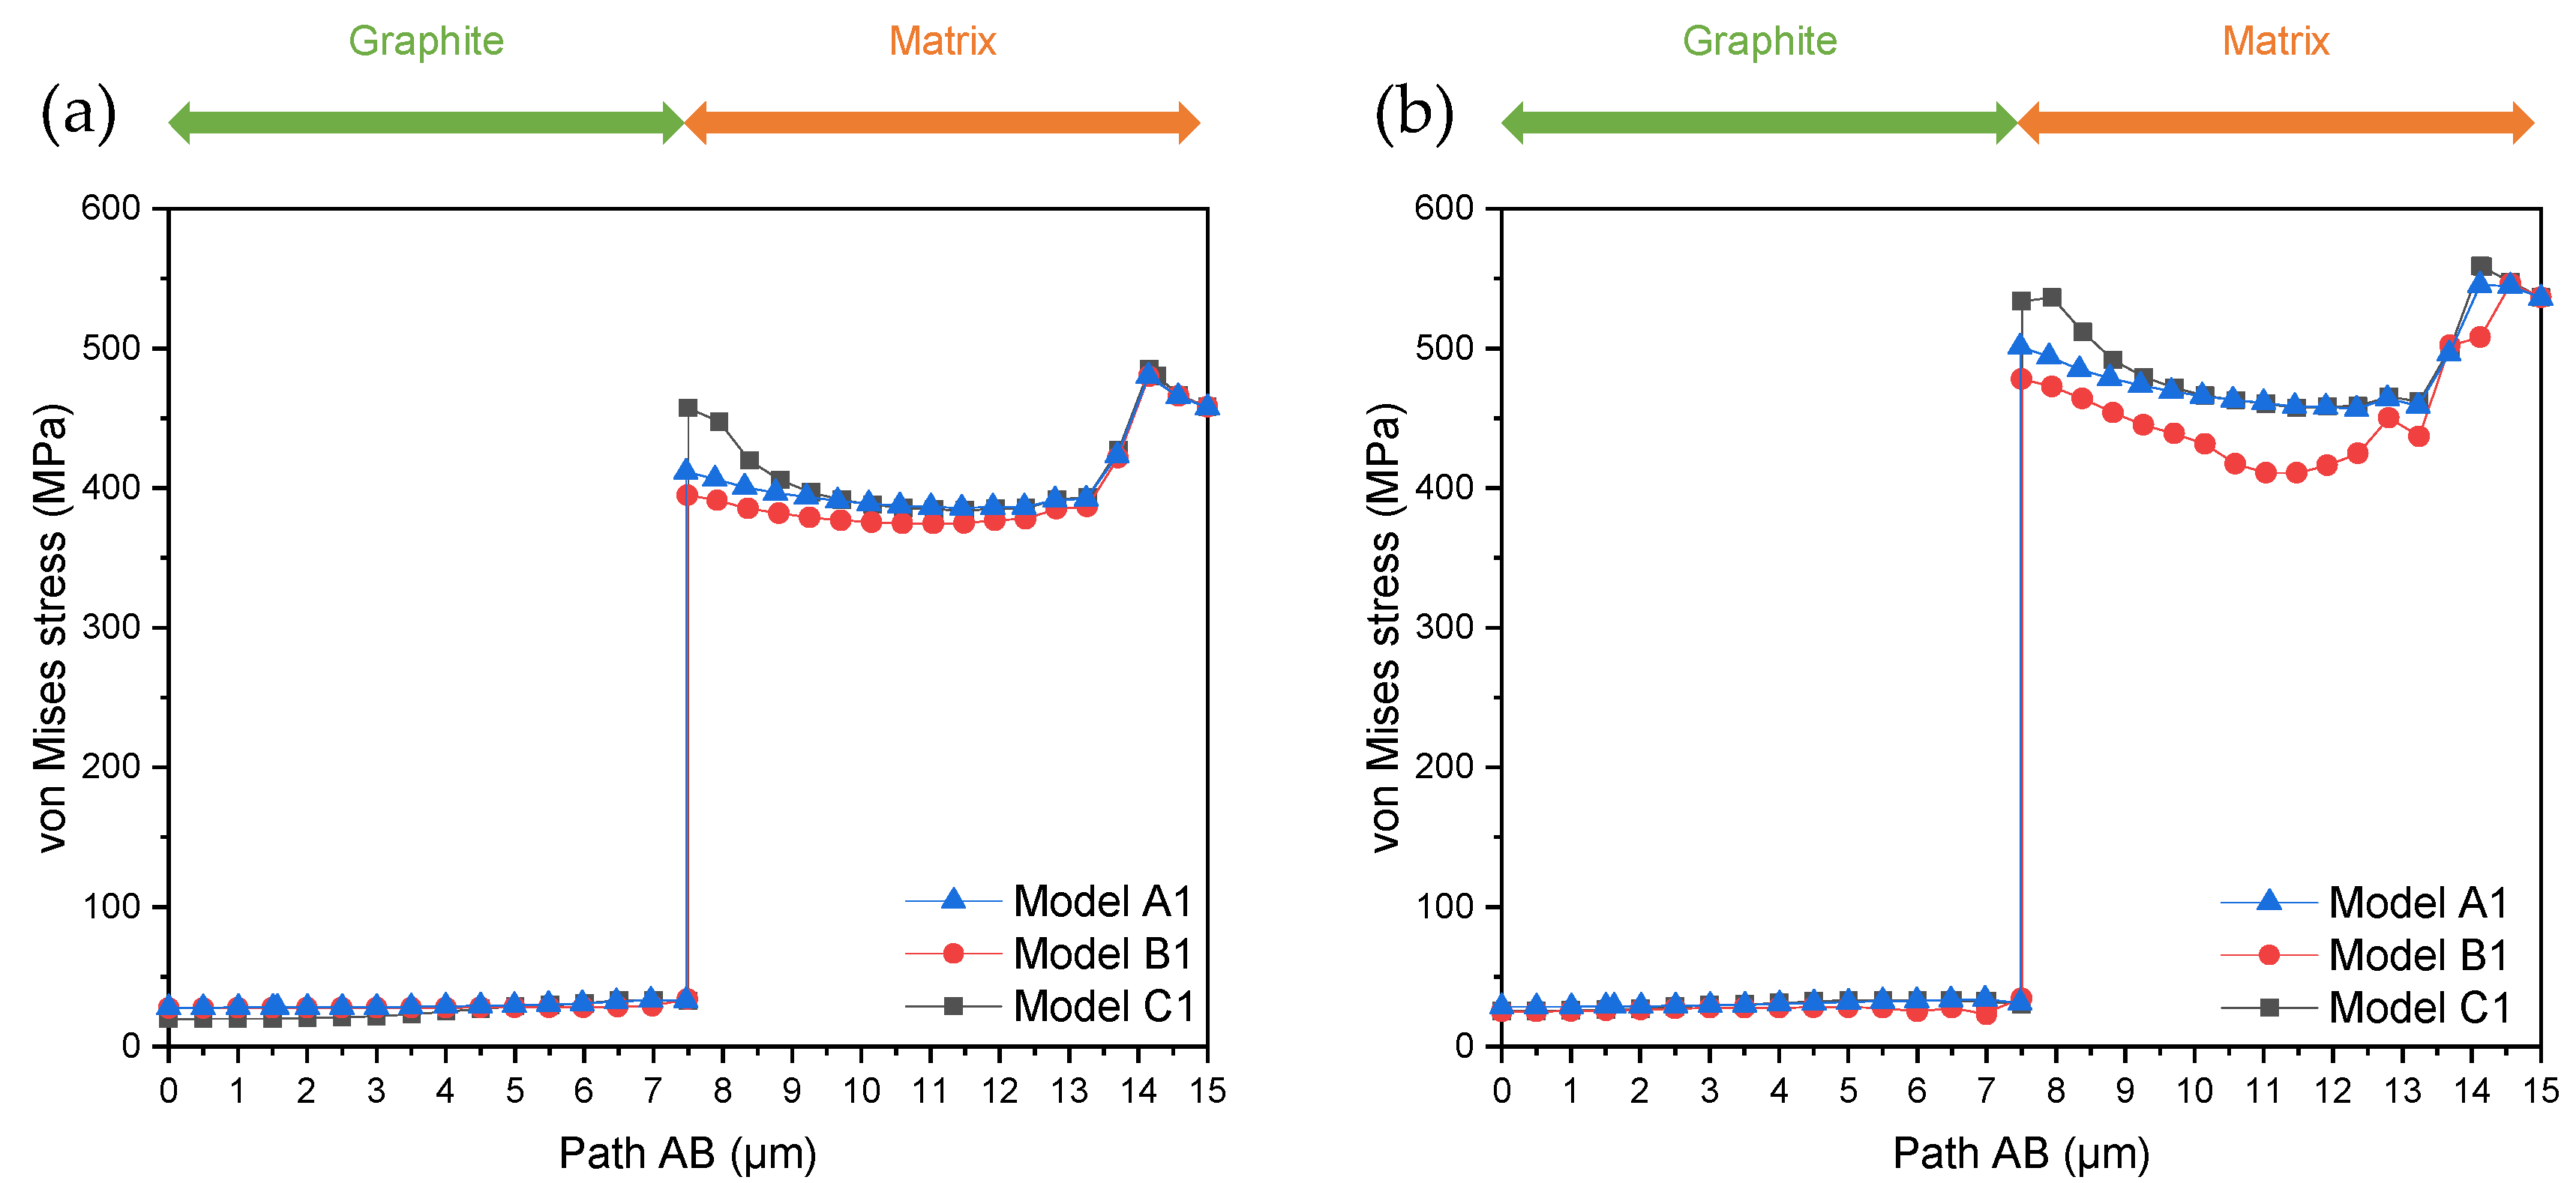
The distribution of von Mises stress was analysed along path AB in models with spherical and vermicular graphite particles under FFBCs (Figure 13). Under pure thermal loading, both the graphite and matrix phases were restricted from expanding by the fully fixed boundaries, and compressive stresses were developed due to these constraints. Since the shape of graphite inclusions was spherical (Model A1) or close to spherical (Models B1 and C1), the stress state of graphite was effectively hydrostatic, and the effective stresses vanished. Indeed, the graphite was at stress levels of less than 50 MPa. In contrast, the von Mises stresses were between 500 MPa and 600 MPa in the matrix and increased as the aspect ratio of graphite became higher.
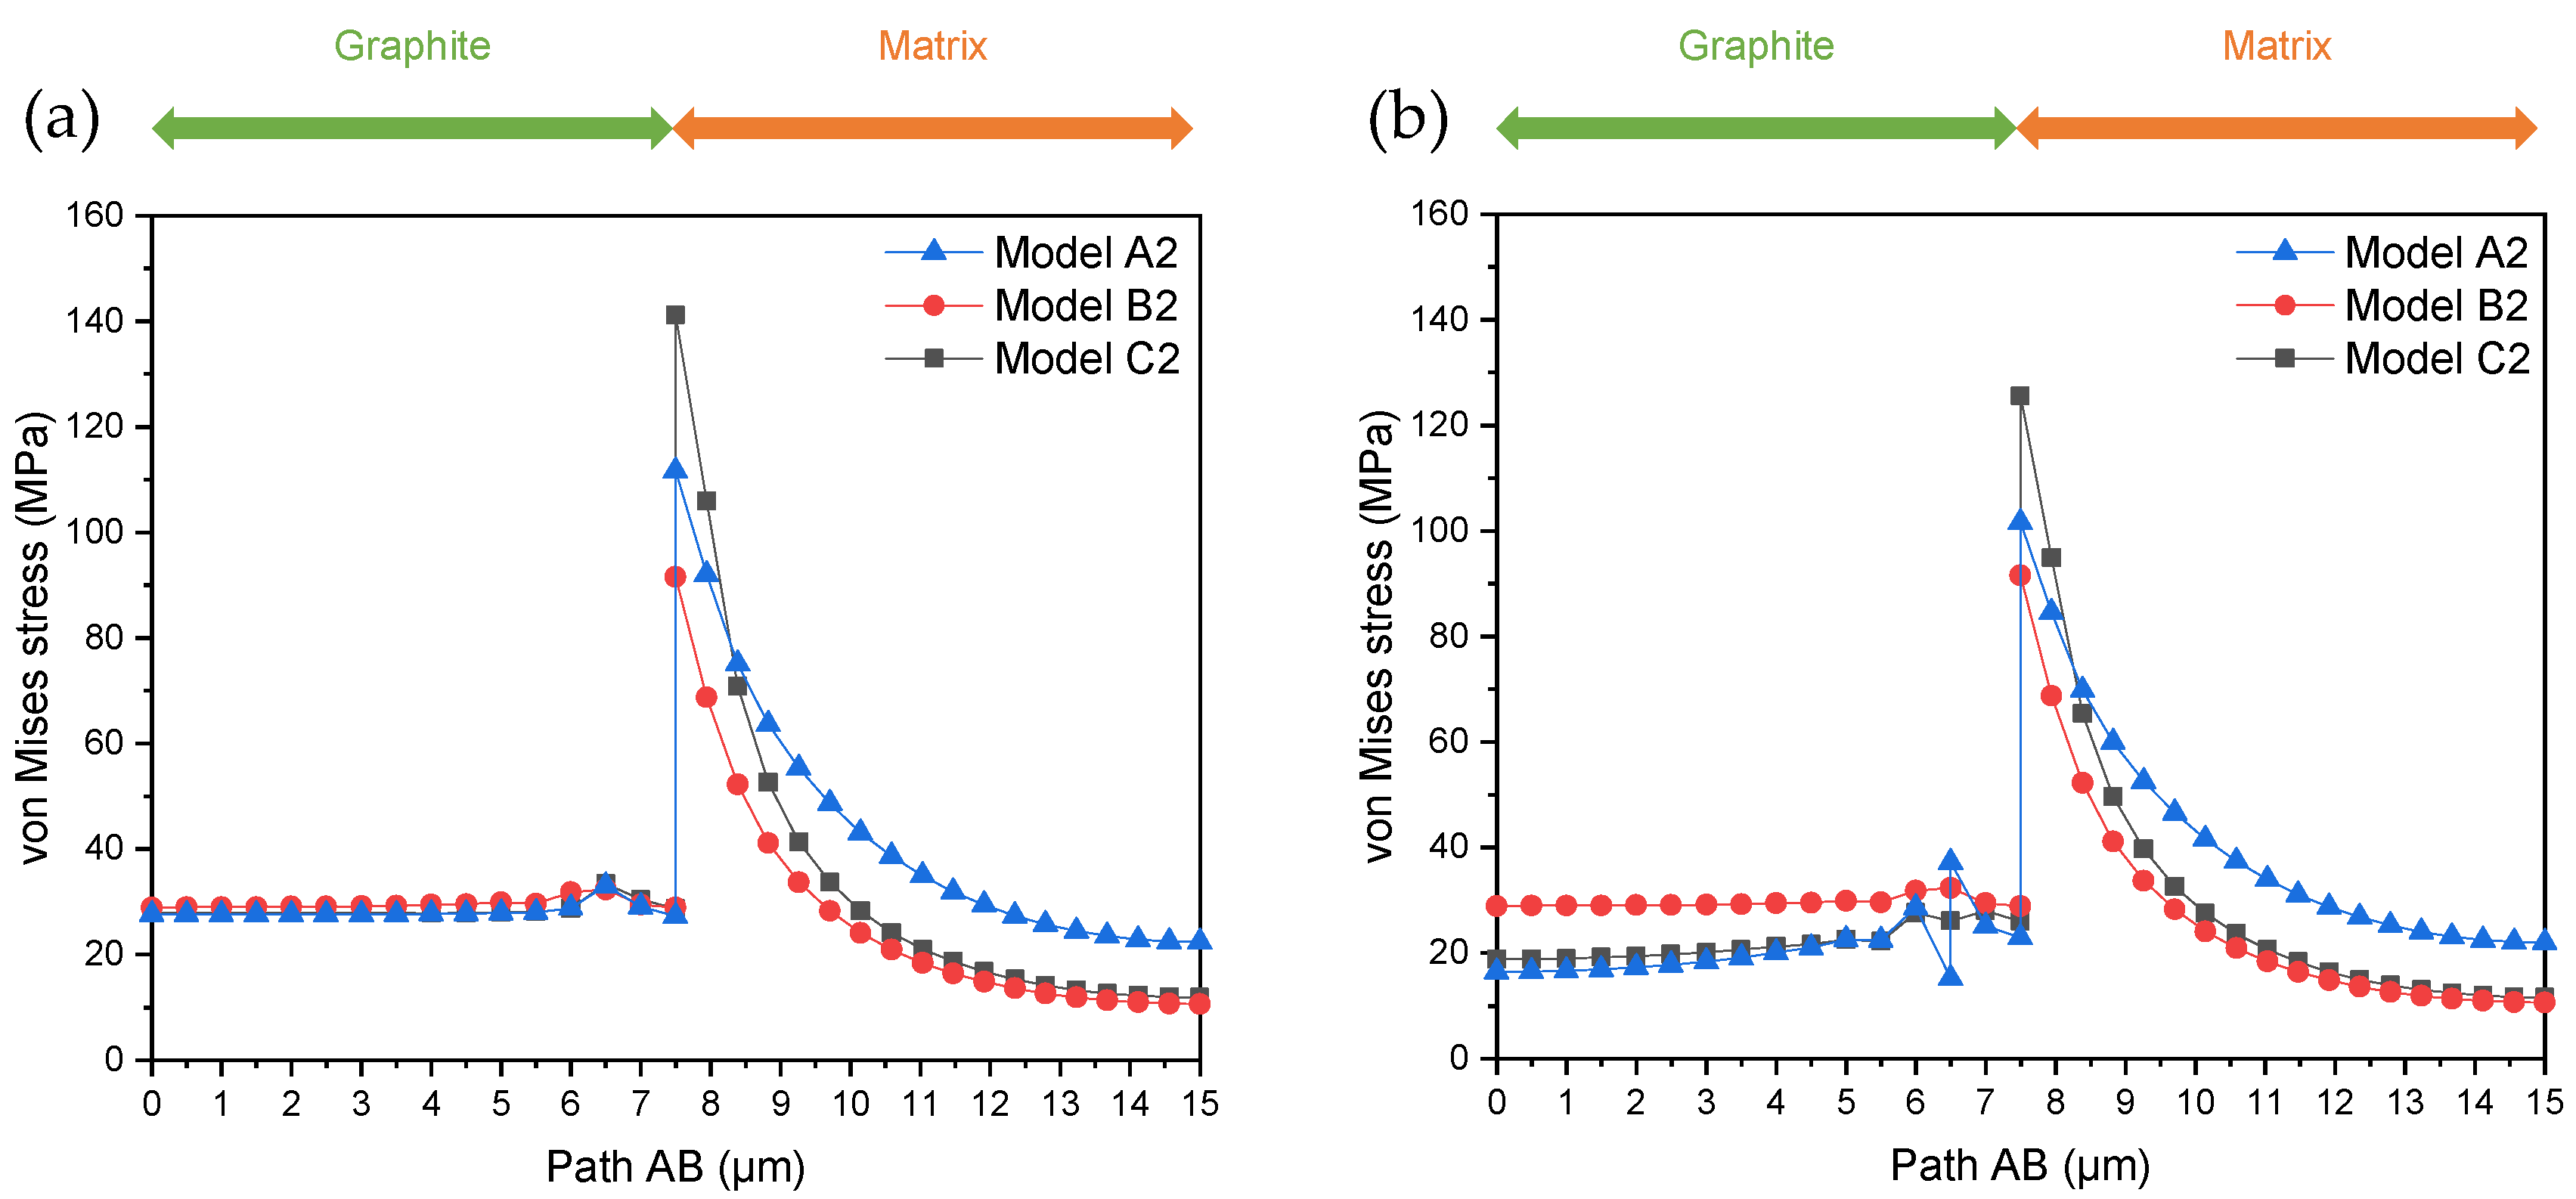
The distribution of von Mises stress under PBCs along path AB is presented in Figure 14. Under PBCs, there was no restriction for thermal expansion, and thus there were no excessive thermal stresses developed in the unit cell (note the difference in the scales of the axis of coordinates in Figure 13 and Figure 14). Model C2 recorded the highest von Mises stress just above 140 MPa at 500 °C, which was reduced to about 130 MPa at 20 °C.

6. Conclusions

In this research, the mechanism of thermal expansion in micro-structured CGI was investigated. CGI, in contrast to many other cast irons, contains three major types of inclusion that were studied in this manuscript. A set of three-dimensional numerical models was developed employing the concept of RVE. The morphology of a graphite inclusion embedded in a cuboid domain of the metallic matrix with perfect bonding was considered. Elastoplastic constitutive behaviour was assumed in both phases. Pure thermal loading of 20 −500 −20 °C was applied in the unit cell under FFBCs and PBCs.
The thermal expansion of graphite and the matrix was significantly affected by the volume and shape of graphite. As the volume and the aspect ratio of graphite and the contact surface between the two phases became larger, damage initiated at lower temperatures. Generally, damage occurred easier and at higher levels under FFBCs than in PBCs as high compressive stress emerged in the matrix in that case.
For FFBCs, the level of generated thermal stresses was higher due to the mismatch in coefficients of thermal expansion and the material being more constrained than in PBCs. Due to constraints in expansion, damage accumulation was low. In contrast, when the material was free to expand, stress levels were lower and less plastic deformation was noted.
Finally, the obtained numerical values for the surface displacement profile correlated well with experimental measurements performed in a CGI specimen subjected to the same heating cycle.

Author Contributions

Conceptualisation, M.C., K.P.B. and V.V.S.; methodology, M.C., K.P.B. and V.V.S.; software, M.C.; validation, M.C.; formal analysis, M.C., K.P.B. and V.V.S.; investigation, M.C.; resources, M.C.; data curation, M.C.; writing—original draft preparation, M.C.; writing—review and editing, K.P.B. and V.V.S.; supervision, K.P.B. and V.V.S. All authors have read and agreed to the published version of the manuscript.

Funding

This research received no external funding.

Data Availability Statement

All data are available from the corresponding author upon request.

Acknowledgments

The authors are grateful to Abhijit Joshi (Loughborough University, UK) for the experimental data for CGI.

Conflicts of Interest

The authors declare no conflict of interest.

Nomenclature

A area of graphite in 2D
A R aspect ratio of vermicular graphite
C T E coefficient of thermal expansion
D diameter of spherical graphite
F F B C fully fixed boundary condition
L length of flake graphite
L 2 D length of square matrix in 2D
L 3 D length of cubic matrix in 3D
L m a j o r major axis of vermicular graphite
L m i n o r minor axis of vermicular graphite
P B C periodic boundary condition
p pressure
q von Mises equivalent stress
S area of square matrix (2D)
V volume of cubic matrix in 3D
V f volume fraction of graphite
V g volume of spherical graphite in 3D
ε ¯ ˙ D p l plastic strain rate
ε ¯ D p l plastic strain at onset of damage
η stress triaxiality
ω D state variable

References

  1. Nguyen, D.; Tooptong, S.; Park, K.-H.; Kwon, P. Formation Mechanism of Alumina Layer in Protecting Cubic Boron Nitride Inserts in Turning Cast Irons. Int. J. Mach. Tools Manuf. 2020, 153, 103539. [Google Scholar] [CrossRef]
  2. Dawson, S. Compacted Graphite Iron—A Material Solution for Modern Diesel Engine Cylinder Blocks and Heads. In Proceedings of the 68th WFC-World Foundry Congress, Chennai, India, 7–10 February 2008; pp. 93–99. [Google Scholar]
  3. Dawson, S.; Schroeder, T. Practical Applications for Compacted Graphite Iron. AFS Trans. 2004, 47, 1–9. [Google Scholar]
  4. Yang, W.; Pang, J.; Wang, L.; Wang, S.; Liu, Y.; Hui, L.; Li, S.; Zhang, Z. Tensile Properties and Damage Mechanisms of Compacted Graphite Iron Based on Microstructural Simulation. Mater. Sci. Eng. A 2021, 814, 141244. [Google Scholar] [CrossRef]
  5. Guesser, W.L.; Duran, P.V.; Krause, W. Compacted Graphite Iron for Diesel Engine Cylinder Blocks. In Proceedings of the Congrès Le Diesel Aujourd’hui Demain Ec. Cent., Lyon, France, 12–13 May 2004; pp. 1–11. [Google Scholar]
  6. Essam, M.A.; Shash, A.Y.; Megahed, H.; El-Kashif, E. Effect of Section Thickness on Microstructure and Mechanical Properties of Compacted Graphite Iron for Diesel Engine Applications. Heliyon 2021, 7, e05930. [Google Scholar] [CrossRef]
  7. Meng, F.; Zhang, Z.; Wu, B.; Hu, W.; Ai, X.; Meng, X.; Ding, Z.; Zhang, L. Turning Processes and Mechanism of Compacted Graphite Iron Used for High Performance Engine. J. Manuf. Process. 2021, 68, 951–960. [Google Scholar] [CrossRef]
  8. Chen, J.K.; Chen, S.F. Thermal Conductivity of an In-Situ Metal Matrix Composite—Cast Iron. In Metal, Ceramic and Polymeric Composites for Various Uses; Cuppoletti, J., Ed.; IntechOpen: Taiwan, 2011; pp. 211–224. ISBN 978-953-307-353-8. [Google Scholar]
  9. Fragassa, C.; Babic, M.; Bergmann, C.P.; Minak, G. Predicting the Tensile Behaviour of Cast Alloys by a Pattern Recognition Analysis on Experimental Data. Metals 2019, 9, 557. [Google Scholar] [CrossRef] [Green Version]
  10. Xu, B.; Rathod, D.; Yebi, A.; Filipi, Z.; Onori, S.; Hoffman, M. A Comprehensive Review of Organic Rankine Cycle Waste Heat Recovery Systems in Heavy-Duty Diesel Engine Applications. Renew. Sustain. Energy Rev. 2019, 107, 145–170. [Google Scholar] [CrossRef]
  11. Chen, Y.; Pang, J.C.; Li, S.X.; Zou, C.L.; Zhang, Z.F. Damage Mechanism and Fatigue Strength Prediction of Compacted Graphite Iron with Different Microstructures. Int. J. Fatigue 2022, 164, 107126. [Google Scholar] [CrossRef]
  12. Di Cocco, V.; Iacoviello, F.; Cavallini, M. Damaging Micromechanisms Characterization of a Ferritic Ductile Cast Iron. Eng. Fract. Mech. 2010, 77, 2016–2023. [Google Scholar] [CrossRef]
  13. Qiu, Y.; Pang, J.C.; Li, S.X.; Yang, E.N.; Fu, W.Q.; Liang, M.X.; Zhang, Z.F. Influence of Thermal Exposure on Microstructure Evolution and Tensile Fracture Behaviors of Compacted Graphite Iron. Mater. Sci. Eng. A 2016, 664, 75–85. [Google Scholar] [CrossRef]
  14. Di Cocco, V.; Iacoviello, F.; Rossi, A.; Iacoviello, D. Macro and Microscopical Approach to the Damaging Micromechanisms Analysis in a Ferritic Ductile Cast Iron. Theor. Appl. Fract. Mech. 2014, 69, 26–33. [Google Scholar] [CrossRef]
  15. Norman, V.; Calmunger, M. On the Micro- and Macroscopic Elastoplastic Deformation Behaviour of Cast Iron When Subjected to Cyclic Loading. Int. J. Plast. 2019, 115, 200–215. [Google Scholar] [CrossRef]
  16. Di Cocco, V.; Iacoviello, F.; Rossi, A.; Cavallini, M.; Natali, S. Graphite Nodules and Fatigue Crack Propagation Micromechanisms in a Ferritic Ductile Cast Iron. Fatigue Fract. Eng. Mater. Struct. 2013, 36, 893–902. [Google Scholar] [CrossRef]
  17. Tang, C.; Liu, L.; Yang, Z.; Tao, D.; Li, J.; Guo, Q.; Zhen, J.; He, Y.; He, H. Surface Evolution of Vermicular Cast Iron in Ultra-High Temperature Combustion with Different Single-Pulsing Duration. Eng. Fail. Anal. 2022, 141, 106679. [Google Scholar] [CrossRef]
  18. Qiu, Y.; Pang, J.C.; Yang, E.N.; Li, S.X.; Zhang, Z.F. Transition of Tensile Strength and Damaging Mechanisms of Compacted Graphite Iron with Temperature. Mater. Sci. Eng. A 2016, 677, 290–301. [Google Scholar] [CrossRef]
  19. Wu, Y.; Li, J.; Yang, Z.; Guo, Y.; Ma, Z.; Liang, M.; Yang, T.; Tao, D. Thermal Conductivity Analysis of Compacted Graphite Cast Iron after a Creep Test. Metall. Mater. Trans. A 2019, 50, 3697–3704. [Google Scholar] [CrossRef]
  20. Selin, M. Tensile and Thermal Properties in Compacted Graphite Irons at Elevated Temperatures. Metall. Mater. Trans. A Phys. Metall. Mater. Sci. 2010, 41, 3100–3109. [Google Scholar] [CrossRef]
  21. Rodriguez, F.J.; Boccardo, A.D.; Dardati, P.M.; Celentano, D.J.; Godoy, L.A. Thermal Expansion of a Spheroidal Graphite Iron: A Micromechanical Approach. Finite Elem. Anal. Des. 2018, 141, 26–36. [Google Scholar] [CrossRef]
  22. Maijer, D.; Cockcroft, S.; Jacot, A. Modeling of Microstructure and Residual Stress in Cast Iron Calender Rolls. Metall. Mater. Trans. A 2000, 31, 1201–1211. [Google Scholar] [CrossRef]
  23. Kim, D.-S.; Pyo, C.; Kim, J.; Kim, J.; Lee, H.-K. A Study on Cross-Shaped Structure of Invar Material Using Cold Wire Laser Fillet Welding (Part I: Feasibility Study for Weldability). Metals 2020, 10, 1385. [Google Scholar] [CrossRef]
  24. Zhao, J.; Fan, X.; Li, B.; Yang, K.; Kong, Y.; Wang, Z. Microstructure and Thermal Expansion of Copper-Based Amorphous Alloys during Structural Relaxation. China Foundry 2020, 17, 8–14. [Google Scholar] [CrossRef] [Green Version]
  25. Yeon, J.; Yamamoto, M.; Ni, P.; Nakamoto, M.; Tanaka, T. Joining of Metal to Ceramic Plate Using Super-Spread Wetting. Metals 2020, 10, 1377. [Google Scholar] [CrossRef]
  26. Lin, H.-M.; Lui, T.-S.; Chen, L.-H. Effect of Maximum Temperature on the Cyclic-Heating-Induced Embrittlement of High-Silicon Ferritic Spheroidal-Graphite Cast Iron. Mater. Trans. 2004, 45, 569–576. [Google Scholar] [CrossRef]
  27. Zhang, Y.; Pang, J.C.; Shen, R.; Yu, Q.; Li, S.; Zhang, Z.Z. Investigation on Tensile Deformation Behavior of Compacted Graphite Iron Based on Cohesive Damage Model. Mater. Sci. Eng. A-Struct. Mater. Prop. Microstruct. Process. 2018, 713, 260–268. [Google Scholar] [CrossRef]
  28. Salomonsson, K.; Jarfors, A.E.W. Three-Dimensional Microstructural Characterization of Cast Iron Alloys for Numerical Analyses. Mater. Sci. Forum 2018, 925, 427–435. [Google Scholar] [CrossRef] [Green Version]
  29. Zhan, Y.; Kaddouri, W.; Kanit, T.; Jiang, Q.; Liu, L.; Imad, A. From Unit Inclusion Cell to Large Representative Volume Element: Comparison of Effective Elastic Properties. Eur. J. Mech.-A/Solids 2022, 92, 104490. [Google Scholar] [CrossRef]
  30. Safaei, M.; Sheidaei, A.; Baniassadi, M.; Ahzi, S.; Mosavi Mashhadi, M.; Pourboghrat, F. An Interfacial Debonding-Induced Damage Model for Graphite Nanoplatelet Polymer Composites. Comput. Mater. Sci. 2015, 96, 191–199. [Google Scholar] [CrossRef]
  31. Kihlberg, E.; Norman, V.; Skoglund, P.; Schmidt, P.; Moverare, J. On the Correlation between Microstructural Parameters and the Thermo-Mechanical Fatigue Performance of Cast Iron. Int. J. Fatigue 2021, 145, 106112. [Google Scholar] [CrossRef]
  32. Anand, L. Elastic Moduli of Gray and Ductile Cast Irons. Scr. Metall. 1982, 16, 173–177. [Google Scholar] [CrossRef]
  33. Sjögren, T.; Svensson, I.L. Modelling the Effect of Graphite Morphology on the Modulus of Elasticity in Cast Irons. Int. J. Cast Met. Res. 2004, 17, 271–279. [Google Scholar] [CrossRef]
  34. Fragassa, C.; Radovic, N.; Pavlovic, A.; Minak, G. Comparison of Mechanical Properties in Compacted and Spheroidal Graphite Irons. Tribol. Ind. 2016, 38, 45–56. [Google Scholar]
  35. Liu, Y.; Li, Y.; Xing, J.; Wang, S.; Zheng, B.; Tao, D.; Li, W. Effect of Graphite Morphology on the Tensile Strength and Thermal Conductivity of Cast Iron. Mater. Charact. 2018, 144, 155–165. [Google Scholar] [CrossRef]
  36. Šamec, B.; Potrč, I.; Šraml, M. Low Cycle Fatigue of Nodular Cast Iron Used for Railway Brake Discs. Eng. Fail. Anal. 2011, 18, 1424–1434. [Google Scholar] [CrossRef]
  37. Stefanescu, D.M. The Meritocratic Ascendance of Cast Iron: From Magic to Virtual Cast Iron. Int. J. Met. 2019, 13, 726–752. [Google Scholar] [CrossRef]
  38. Frishmuth, R.E.; McLaughlin, P.V. Failure Analysis of Cast Irons under General Three-Dimensional Stress States. J. Eng. Mater. Technol. 1976, 98, 69–75. [Google Scholar] [CrossRef]
  39. Josefson, B.L.; Stigh, U.; Hjelm, H.E. A Nonlinear Kinematic Hardening Model for Elastoplastic Deformations in Grey Cast Iron. J. Eng. Mater. Technol. 1995, 117, 145–150. [Google Scholar] [CrossRef] [Green Version]
  40. Josefson, B.L.; Hjelm, H.E. Modelling Elastoplastic Deformations in Grey Cast Iron. In Low Cycle Fatigue and Elasto-Plastic Behaviour of Materials; Rie, K.-T., Grünling, H.W., König, G., Neumann, P., Nowack, H., Schwalbe, K.-H., Seeger, T., Eds.; Springer: Dordrecht, The Netherlands, 1992; pp. 465–472. ISBN 978-94-011-2860-5. [Google Scholar]
  41. Hjelm, H.E. Yield Surface for Grey Cast Iron under Biaxial Stress. J. Eng. Mater. Technol. 1994, 116, 148–154. [Google Scholar] [CrossRef]
  42. Altenbach, H.; Stoychev, G.B.; Tushtev, K.N. On Elastoplastic Deformation of Grey Cast Iron. Int. J. Plast. 2001, 17, 719–736. [Google Scholar] [CrossRef]
  43. Andriollo, T.; Zhang, Y.; Fæster, S.; Thorborg, J.; Hattel, J. Impact of Micro-Scale Residual Stress on in-Situ Tensile Testing of Ductile Cast Iron: Digital Volume Correlation vs. Model with Fully Resolved Microstructure vs. Periodic Unit Cell. J. Mech. Phys. Solids 2019, 125, 714–735. [Google Scholar] [CrossRef]
  44. Andriollo, T.; Thorborg, J.; Hattel, J. The Influence of the Graphite Mechanical Properties on the Constitutive Response of a Ferritic Ductile Cast Iron—A Micromechanical FE Analysis. In Proceedings of the COMPLAS XIII: Proceedings of the XIII International Conference on Computational Plasticity: Fundamentals and applications, Barcelona, Spain, 1–3 September 2015; pp. 632–641. [Google Scholar]
  45. Andriollo, T.; Thorborg, J.; Tiedje, N.; Hattel, J. A Micro-Mechanical Analysis of Thermo-Elastic Properties and Local Residual Stresses in Ductile Iron Based on a New Anisotropic Model for the Graphite Nodules. Model. Simul. Mater. Sci. Eng. 2016, 24, 55012. [Google Scholar] [CrossRef] [Green Version]
  46. Palkanoglou, E.N.; Baxevanakis, K.P.; Silberschmidt, V.V. Thermal Debonding of Inclusions in Compacted Graphite Iron: Effect of Matrix Phases. Eng. Fail. Anal. 2022, 139, 106476. [Google Scholar] [CrossRef]
  47. Seldin, E.J. Stress-Strain Properties of Polycrystalline Graphites in Tension and Compression at Room Temperature. Carbon N. Y. 1966, 4, 177–191. [Google Scholar] [CrossRef]
  48. Greenstreet, W.L.; Yahr, G.T.; Valachovic, R.S. The Behavior of Graphite under Biaxial Tension. Carbon N. Y. 1973, 11, 43–57. [Google Scholar] [CrossRef] [Green Version]
  49. Andriollo, T.; Thorborg, J.; Tiedje, N.S.; Hattel, J. Modeling of Damage in Ductile Cast Iron—The Effect of Including Plasticity in the Graphite Nodules. IOP Conf. Ser. Mater. Sci. Eng. 2015, 84, 12027. [Google Scholar] [CrossRef] [Green Version]
  50. Palkanoglou, E.N.; Cao, M.; Baxevanakis, K.P.; Silberschmidt, V.V. Effect of Graphite-Particle Morphology on Thermomechanical Performance of Compacted Graphite Iron: Numerical Modelling. In Proceedings of the 8th European Congress on Computational Methods in Applied Sciences and Engineering ECCOMAS Congress 2022, Oslo, Norway, 5–9 June 2022. [Google Scholar]
  51. Palkanoglou, E.N.; Baxevanakis, K.P.; Silberschmidt, V.V. Interfacial Debonding in Compacted Graphite Iron: Effect of Thermal Loading. Procedia Struct. Integr. 2020, 28, 1286–1294. [Google Scholar] [CrossRef]
  52. Hooputra, H.; Gese, H.; Dell, H.; Werner, H. A Comprehensive Failure Model for Crashworthiness Simulation of Aluminium Extrusions. Int. J. Crashworthiness 2004, 9, 449–464. [Google Scholar] [CrossRef]
  53. Garoz, D.; Gilabert, F.A.; Sevenois, R.D.B.; Spronk, S.W.F.; Van Paepegem, W. Consistent Application of Periodic Boundary Conditions in Implicit and Explicit Finite Element Simulations of Damage in Composites. Compos. Part B Eng. 2019, 168, 254–266. [Google Scholar] [CrossRef]
  54. Omairey, S.L.; Dunning, P.D.; Sriramula, S. Development of an ABAQUS Plugin Tool for Periodic RVE Homogenisation. Eng. Comput. 2019, 35, 567–577. [Google Scholar] [CrossRef] [Green Version]
  55. Drago, A.; Pindera, M.J. Micro-Macromechanical Analysis of Heterogeneous Materials: Macroscopically Homogeneous vs Periodic Microstructures. Compos. Sci. Technol. 2007, 67, 1243–1263. [Google Scholar] [CrossRef]
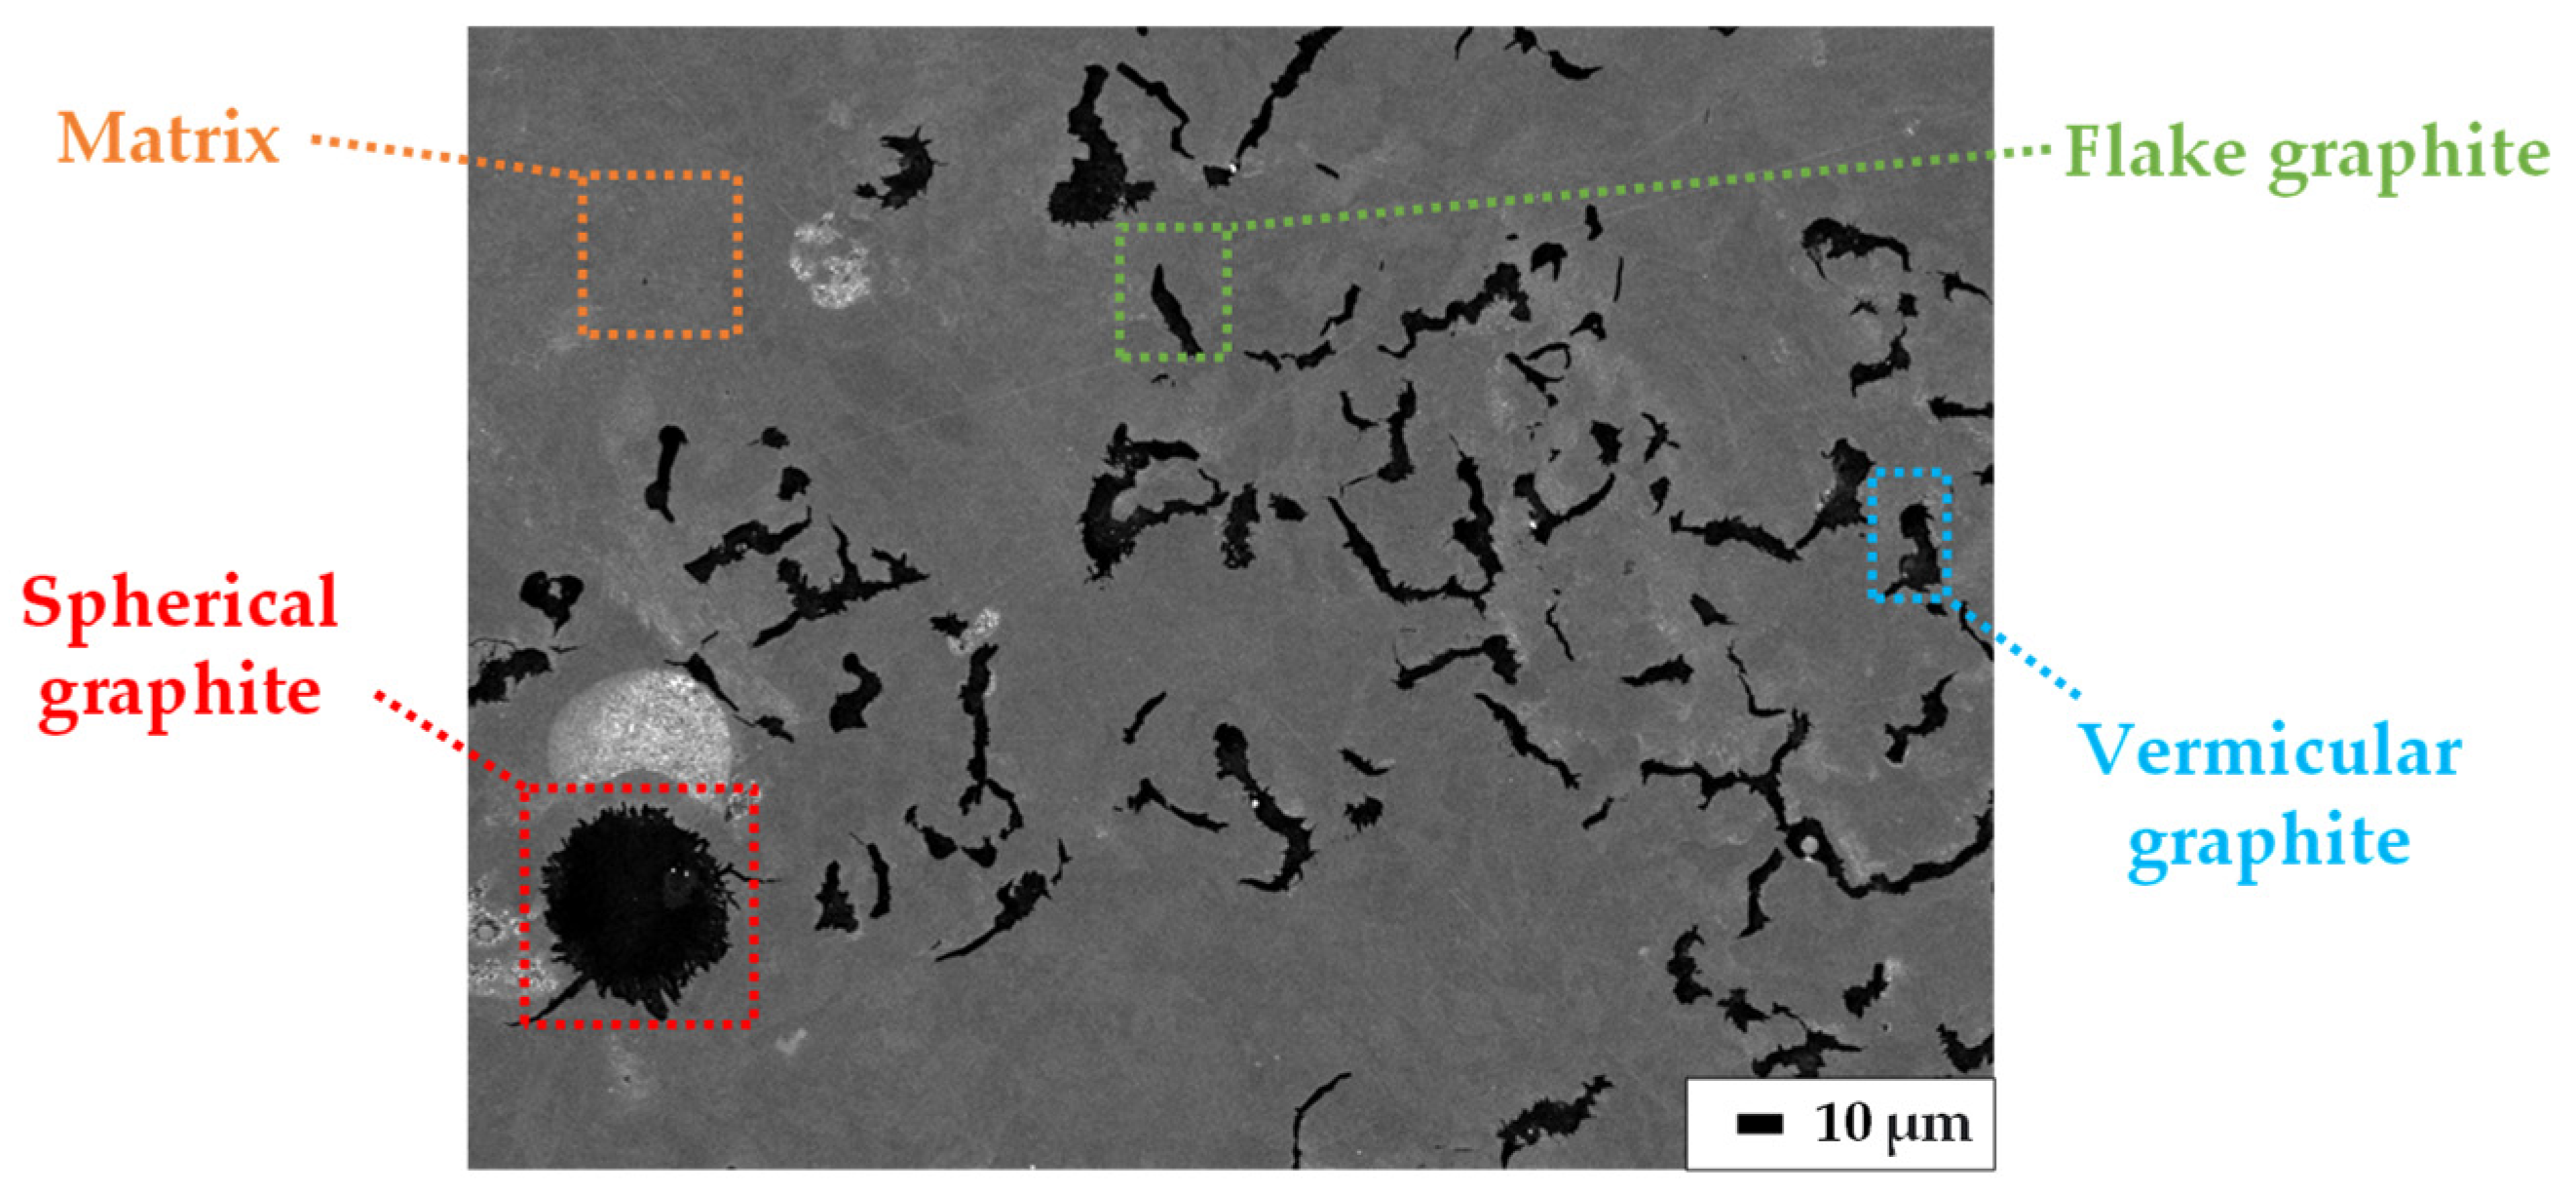
Figure 1. Microstructure of CGI.
Metals 13 00473 g001
Figure 2. Processes of statistical analysis of CGI micrographs.
Metals 13 00473 g002
Figure 3. Thermal experiments of CGI: (a) CGI specimen, (b) micrograph of CGI, (c) height profile before thermal load, and (d) height profile after thermal load (images (b,d) are for graphite particle 4).
Metals 13 00473 g003
Figure 4. Geometry and dimensions of numerical unit cells: (a) Model A, (b) Model B, (c) Model C, and (d) Model E.
Metals 13 00473 g004
Figure 5. Experimental stress–strain diagram of CGI used in simulations (insert presents mechanical properties for graphite domain).
Metals 13 00473 g005
Figure 6. Height profile of flake graphite (see Table 2) and matrix under FFBCs at different temperatures: (a) 500 °C after heating and (b) 20 °C after cooling.
Metals 13 00473 g006
Figure 7. Height profile of flake graphite (see Table 2) and matrix under PBCs at different temperatures: (a) 500 °C after heating and (b) 20 °C after cooling.
Metals 13 00473 g007
Figure 8. Normalised temperature excursion of damage initiation under PBCs and FFBCs.
Metals 13 00473 g008
Figure 9. Damage profile in flake graphite (see Table 2) at the interface along path CD (Figure 4d) under FFBCs at different temperatures: (a) 500 °C after heating and (b) 20 °C after cooling.
Metals 13 00473 g009
Figure 10. Damage profile in flake graphite (see Table 2) at the interface along path CD (Figure 4d) under PBCs at different temperatures: (a) 500 °C after heating and (b) 20 °C after cooling.
Metals 13 00473 g010
Figure 11. Damage profile in flake graphite (see Table 2) at the interface along path EF (Figure 4d) under FFBCs at different temperatures: (a) 500 °C after heating and (b) 20 °C after cooling.
Metals 13 00473 g011
Figure 12. Damage profile in flake graphite at the interface under PBCs (Model D2 in Table 2) at different temperatures: (a) 500 °C after heating and (b) 20 °C after cooling.
Metals 13 00473 g012
Figure 13. Distribution of von Mises stress along path AB under FFBCs in nodular and vermicular graphite (see Table 2) at different temperatures: (a) 500 °C after heating and (b) 20 °C after cooling.
Metals 13 00473 g013
Figure 14. Distribution of von Mises stress along path AB under PBCs in nodular and vermicular graphite (see Table 2) at different temperatures: (a) 500 °C after heating and (b) 20 °C after cooling.
Metals 13 00473 g014
Table 1. Summary of the height profile of CGI in thermal experiments.
Graphite Particle No.Height Difference before Thermal Load (μm)Height Difference after Thermal Load (μm)Change of Height
Difference (μm)
10.5980.7200.122
20.6030.8130.210
30.3270.5390.212
40.2880.4850.197
50.3820.4470.065
60.3650.5020.137
70.1170.2520.135
81.7691.9620.193
Table 2. Summary of numerical models.
ModelNotationType of Graphite Inclusion L m i n o r (µm) W (µm)H (µm)Boundary
Conditions
AA1SphericalSpherical15--FFBCs
A2PBCs
BB1Ver_H4Vermicular8--FFBCs
B2PBCs
CC1Ver_H7.5Vermicular8--FFBCs
C2PBCs
DD1W2H4Flake-24FFBCs
D2PBCs
EE1W4H4Flake-44FFBCs
E2PBCs
FF1W8H4Flake-84FFBCs
F2PBCs
GG1W8H8Flake-88FFBCs
G2PBCs
HH1W8H12Flake-812FFBCs
H2PBCs
Disclaimer/Publisher’s Note: The statements, opinions and data contained in all publications are solely those of the individual author(s) and contributor(s) and not of MDPI and/or the editor(s). MDPI and/or the editor(s) disclaim responsibility for any injury to people or property resulting from any ideas, methods, instructions or products referred to in the content.