Article

An Electrochemical Study of the Corrosion Behaviour of T91 Steel in Molten Nitrates

by
D. Lopez-Dominguez
1,
N. B. Gomez-Guzman
1,
J. Porcayo-Calderón
2,
R. Lopez-Sesenes
3,
A. K. Larios-Galvez
4,
E. Sarmiento-Bustos
5,
E. Rodriguez-Clemente
6 and
J. G. Gonzalez-Rodriguez
1,*
1
Research Centre in Engineering and Applied Sciences, Morelos State Autonomous University, Cuernavaca 62209, Mexico
2
Chemical Engineering and Metallurgy Department, Sonora State University, Sonora 83000, Mexico
3
Chemical Science and Engineering Faculty, Morelos State Autonomous University, Cuernavaca 62209, Mexico
4
Physical Sciences Institute, National Autonomous University of Mexico, Cuernavaca 62209, Mexico
5
Industrial Mechanical Division, Morelos State Emiliano Zapata Technological University, Emiliano Zapata 62565, Mexico
6
Basic Sciences Department, Metropolitan Azcapotzalco Autonomous University, Mexico City 02080, Mexico
*
Author to whom correspondence should be addressed.
Metals 2023, 13(3), 502; https://doi.org/10.3390/met13030502
Submission received: 24 January 2023 / Revised: 23 February 2023 / Accepted: 25 February 2023 / Published: 1 March 2023

Abstract

:
A study of the corrosion behaviour of T91 steel in molten 60 wt% NaNO3-40%KNO3 has been carried out at 300, 400 and 500 °C during 1000 h. Employed techniques included potentiodynamic polarization tests, linear polarization resistance (LPR) and electrochemical impedance spectroscopy (EIS) measurements. Experiments were complemented by detailed scanning electronic measurements and X-ray diffraction studies. Polarization curves revealed the existence of a passive layer formed onto the steel, composed mainly of Cr2O3, FeCr2O4, NaCrO4 and K2Fe2O4. Corrosion current density values increased, whereas the polarization resistance value decreased more than one order of magnitude as the testing temperature increased. EIS tests indicated a charge transfer controlled corrosion process, regardless of the testing temperature, and that the double electrochemical layer resistance decreased with the temperature.

1. Introduction

As the demand for electricity increases with an increase in the world population, the need of using cleaner technologies that produce less damage to the environment is necessary. In this sense, the use of solar energy, which could be used to produce electricity by using this unlimited, renewable source of energy, is more and more popular worldwide. Concentrated solar plants (CSPs) concentrate sunlight to heat a fluid that can store this energy in order for it to be used to spin a turbine or power an engine to generate electricity [1,2,3]. Among the fluids most widely used as heat storage, nitrates, carbonates and chlorides are preferred due to their high chemical stability, low cost, high melting points and good thermal properties, among others [4,5,6,7]. Currently, a mixture consisting of 60 wt% NaNO3-40 wt% KNO3, named, Solar salt, and the mixture of 53 wt% KNO3-7 wt% NaNO3-40 wt% NaNO2, or HITEC salt, are the two commercial salts used as heat storage fluids. However, the use of these salts or some others containing chlorides has different drawbacks, corrosion being one of the main ones [8,9,10,11,12,13,14,15,16,17]. In these studies, both gravimetric and electrochemical tests, such as potentiodynamic polarization and electrochemical impedance spectroscopy tests, have been used to evaluate different metallic alloys to the corrosion induced by molten salts used as heat storage.
T91 steel is a steel containing 9Cr-1Mo-V, which has high corrosion and oxidation resistance, good creep rupture strength, good thermal expansion and thermal conductivity at high temperatures, and it is ideally used in high-temperature steam lines and other high-temperature components in thermal power plants, such as reheaters and superheaters [18,19,20,21,22]. However, due to exposure to these high-temperature, high-pressure conditions, some materials deterioration problems, such as mechanical degradation and corrosion, might appear. In this sense, corrosion caused by molten salts of T91 steel has been reported [23,24,25,26,27]. Thus, Mallco et al. [23] studied the effect of tensile stress on the corrosion behaviour of T91 steel in the ternary mixture (KLiNa)NO3 at 550 °C by using weight loss tests, finding an acceleration of the corrosion rate of the steel under dynamic conditions as compared to the tests under static conditions. Similarly, Ning et al. [24] studied the effect of imposed stress on the corrosion performance of T91 steel in Na2SO4 + NaCl, finding that applied stress facilitated the formation of protective chromium oxide, with an increase in the alloy corrosion resistance. Sundaresan et al. [25] evaluated the corrosion protection of T91 steel in Na2SO4-K2SO4-Fe2O3 at 650 °C by using CoCrAlY, NiCoCrAlY and NiCr coatings applied by the Atmospheric Plasma Spray (APS) and Detonation spray (DSC) techniques. They found an excellent molten salt corrosion protection of T91 steel due to the formation of protective oxides, such as Cr2O3, NiCr2O4, CoCr2O4 and CoAl2O4, whereas the presence of Al2O3 was not observed. Dorcheh et al. [26] compared the corrosion behaviour of T91 steel with that for IN625 Ni-base alloy and 316 and 347H type stainless steels in 60% NaNO3-40% KNO3 at 600 °C during 4000 h by using weight loss tests. The worst corrosion behaviour was exhibited by T91 steel, whereas the highest corrosion resistance was given by the IN625 Ni-base alloy. Finally, Fähsing et al. [27] evaluated coated T91 steel with Cr-, Al- and Si-base slurry coatings in 60% NaNO3-40% KNO3 at 560 °C during 1000 h by using the weight loss technique. Unlike that work, the goal of this research is to carry out a detailed electrochemical study of the corrosion behaviour of T91 steel in molten 60% NaNO3-40% KNO3 at 3 different testing temperatures in order to learn the effect of temperature on the corrosion kinetics and in the corrosion-controlling process.

2. Experimental Procedure

2.1. Testing Material

The testing material included ASTM A213 T91 low-chromium steel, containing 0.1 (wt%) C-0.25 Si-0.41 Mn-8.81 Cr-0.61 Mo-0.23 V-0.06 Ni-0.013 Al-0.01 Nb-0.003 P-0.004 S and Fe as balance. Specimens measuring 10.0 × 5.0 × 3.0 mm were machined and ground with 1200 grade SiC emery paper, washed with water and acetone, and blown with warm air. They were spot welded to a Ni20Cr wire and inserted in a mullite tube.

2.2. Corrosion Studies

For the corrosion studies, a mixture consisting of 60 wt% NaNO3-40KNO3 was used, for which reactants 99.9% from Sigma Aldrich (Mexico city, Mexico) were used. An electrochemical cell was used, as schematically shown in Figure 1, where two Pt wires welded to a Ni20Cr wire immersed in a mullite tube were used as reference and auxiliary electrodes. These two electrodes, together with the T91 steel welded to the Ni20Cr wire, which was the working electrode, were placed in an alumina crucible, where 10 gr/cm2 of the exposed area of the 60 wt% NaNO3-40% KNO3 was used. This arrangement was placed within a horizontal tubular furnace, where the testing temperatures of 300, 400 and 500 during 1000 h were used. Electrochemical employed techniques included open circuit potential (OCP) potentiodynamic polarization curves, electrochemical spectroscopy (EIS) and linear polarization resistance (LPR) measurements. For the potentiodynamic polarization curves, specimens were polarized 300 mV more negative than the open circuit potential value, OCP, and then the scanning towards the anodic direction was started at a scan rate of 1 mV/s, which finished in an anodic potential of 600 mV more anodic than the OCP value. Corrosion current density values, Icorr, were calculated by using Tafel extrapolation. EIS experiments were recorded at the OCP value by applying a sinusoidal signal with an amplitude of ±15 mV in the frequency interval of 0.01–10,000 Hz. Finally, for the LPR measurements, specimens were polarized ±15 mV with respect to the OCP value every 50 h during 1000 h of testing. For EIS and LPR experiments, the same specimen was used during the whole testing time, and for the potentiodynamic polarization curves, a different specimen was used. In order to know the corrosion products formed, XRD experiments were carried out by using Phillips equipment (Phillips, Mexico City, Mexico), whereas the morphology of the corroded surface was studied in a low-vacuum LEO Scanning electronic microscope (SEM, (Leo Instruments, Düsseldorf, Germany), and microchemical analysis was performed by using an energy dispersive X-ray analyser (EDX) from Oxford Instruments (Abingdon, UK) attached to it.

3. Results and Discussion

3.1. Open Circuit Potential

The effect of testing temperature on the variation in the open circuit potential value (OCP) for T91 steel in 60% NaNO3-40% KNO3 is depicted in Figure 2. It can be seen that the noblest OCP values were obtained at 300 °C, whereas the most active values were achieved at 500 °C. The OCP values obtained at 300 and 400 °C were very constant, showing a slight trend to shift towards more active values, probably due to the dissolution of any protective corrosion products layer. Unlike this, the OCP values reached at 500 °C shifted towards nobler values, probably due to the formation of more protective corrosion products, obtaining values close to those obtained at 300 and 400 °C. Corrosion products formed on T91 steel in 60% NaNO3-40% KNO3 have been reported to include Fe2O3 and Fe3O4, but the corrosion protection was given by the formation of Cr2O3 and FeCr2O4 due to the presence of enough Cr in this alloy to form a layer of these oxides [27,28].

3.2. Potentiodynamic Polarization Curves

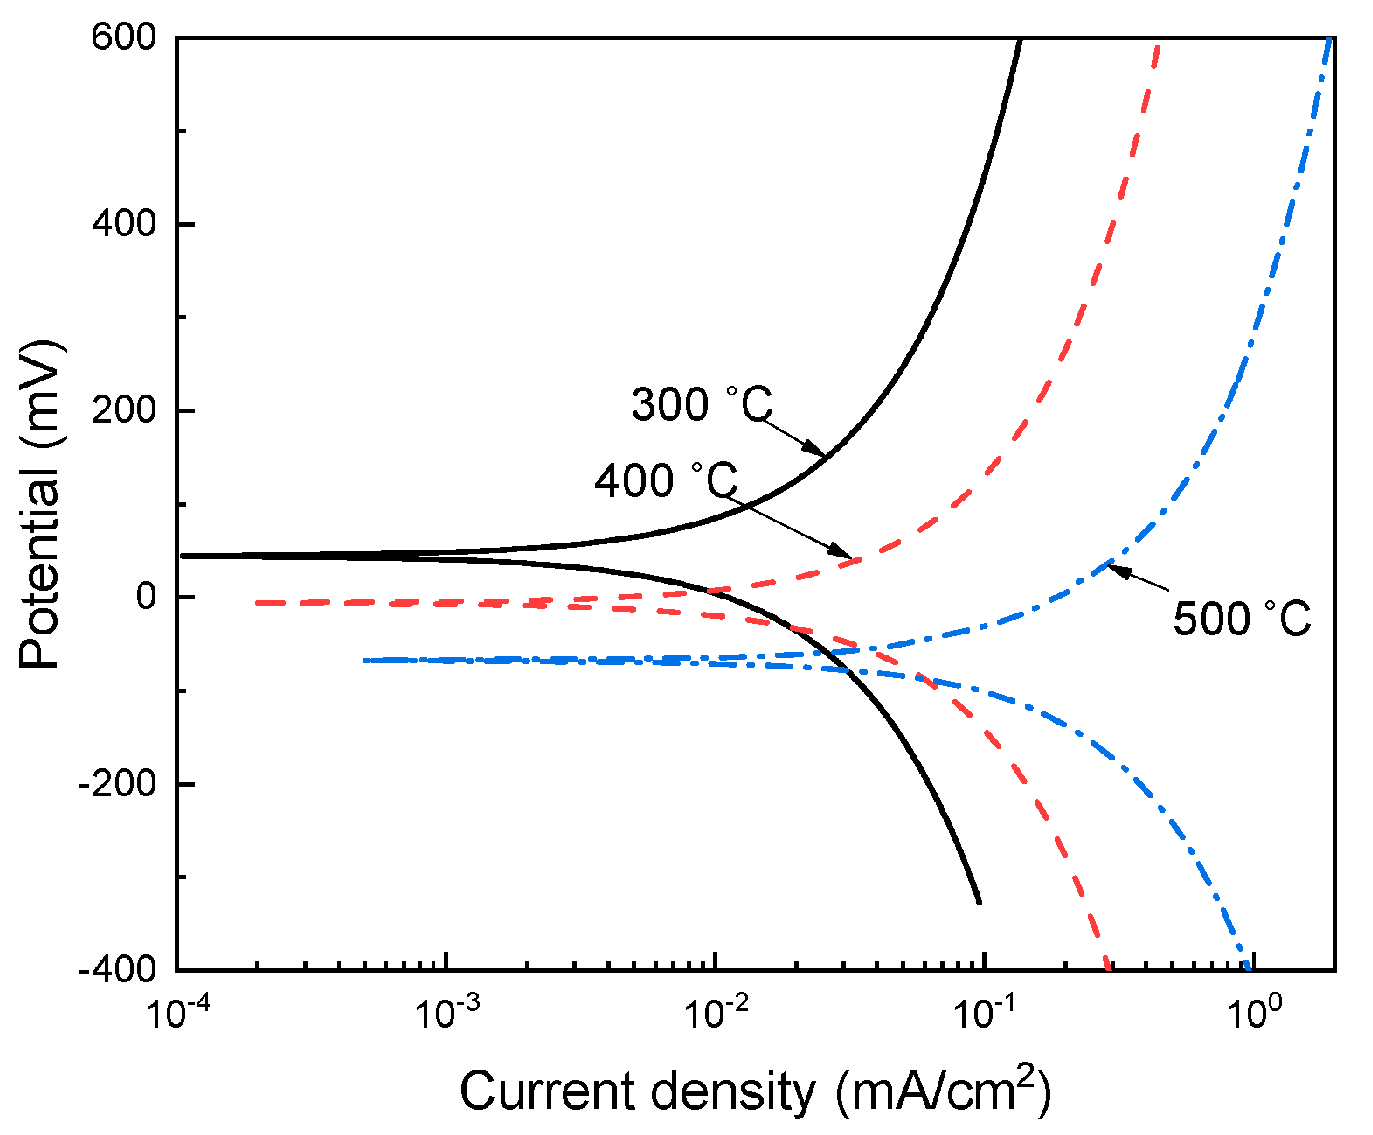
Polarization curves for T91 steel in 60% NaNO3-40% KNO3 at 300, 400 and 500 °C are shown in Figure 3, whereas electrochemical parameters, such as free corrosion potential, Ecorr, and corrosion current density, Icorr, are given in Table 1. In this figure, it can be seen that the plots did not display the formation of a passive layer; instead, an active behaviour can be seen, where both the cathodic and anodic current density values increase with an increase in the testing temperature, indicating the activation of the anodic and cathodic electrochemical reactions with the temperature, such as nitrates reduction [8,29,30]:
Whereas anodic reactions include the oxidation of iron according to:
NO3 + 2e → NO2 + O2−
Fe+O2− → FeO + 2e
3FeO + O2− → Fe3O4 + 2e
2Fe3O4 + O2− → 3Fe2O3 + 2e
Thus, the observed anodic and cathodic current density correspond to electrochemical reactions (1)–(4). In low-chromium and stainless steels corrosion products, such as Fe2O3 and Fe3O4, Cr2O3, NaFeO2 and FeCr2O4 have been reported to be the main corrosion products found [13,26,27,28]. The Ecorr value became more active, whereas Icorr increased for more than 1 order of magnitude as the testing temperature increased from 300 to 500 °C, as shown in Table 1. Li et al. [8] reported Icorr values around 0.6 mA/cm2 for 304 type stainless steel corroded in the same melt, but at 565 °C, whereas Zhu [31] reported a value of 3.1 mA/cm2 for 316 type stainless steel, but corroded in 53% KNO3-7% NaNO3 40% NaNO2 at 465 °C; so, the reported values in this work are in agreement with other reported values. Both cathodic and anodic Tafel slopes were affected by the testing temperature, indicating that both anodic and cathodic electrochemical reactions were accelerated by the testing temperature.

3.3. Linear Polarization Resistance Measurements

Polarization curves give a kind of instantaneous picture of the electrochemical behaviour of a steel in certain environments. In order to see its long-term electrochemical response, some linear polarization resistance (LPR) measurements were carried out, and from these experiments, the polarization resistance value, Rp, was obtained to correlate them to the Icorr value through the Stern–Geary equation, which shows that they are inversely proportional:
Icorr = K/Rp
where K is a proportional constant. Equation (5) shows that the larger the Rp value, the smaller the corrosion current density. The change in the polarization resistance value, Rp, with time for T91 steel in 60% NaNO3-40% KNO3 at 300, 400 and 500 °C is shown in Figure 4.
From this figure, it is evident that the Rp value decreases with an increase in the testing temperature, indicating an increase in the corrosion current density value. This increase in the Icorr value was more than 1 order of magnitude when the testing temperature increased from 300 to 500 °C, in accordance with the results obtained from the polarization curves and summarized in Table 1. Data depicted in Figure 4 reflect the high stability of the Rp values as time elapsed, especially at 300 and 400 °C, except at 500 °C, where a slight decrease in its value was observed during the first 400 h of testing, indicating the good stability of the formed corrosion products. Regardless of the testing of temperature, there is an increase in the Rp value during the first 100 h of testing, which indicates the formation of the protective corrosion products layer. As mentioned above, the reported corrosion products found in low-chromium steels when tested in molten nitrates have been Fe2O3 and Fe3O4, Cr2O3, NaFeO2 and FeCr2O4, which also have been found in the corrosion of stainless steels [13,26] and are responsible for their superior corrosion resistance as compared to that for low-chromium steels.

3.4. Electrochemical Impedance Spectroscopy Measurements

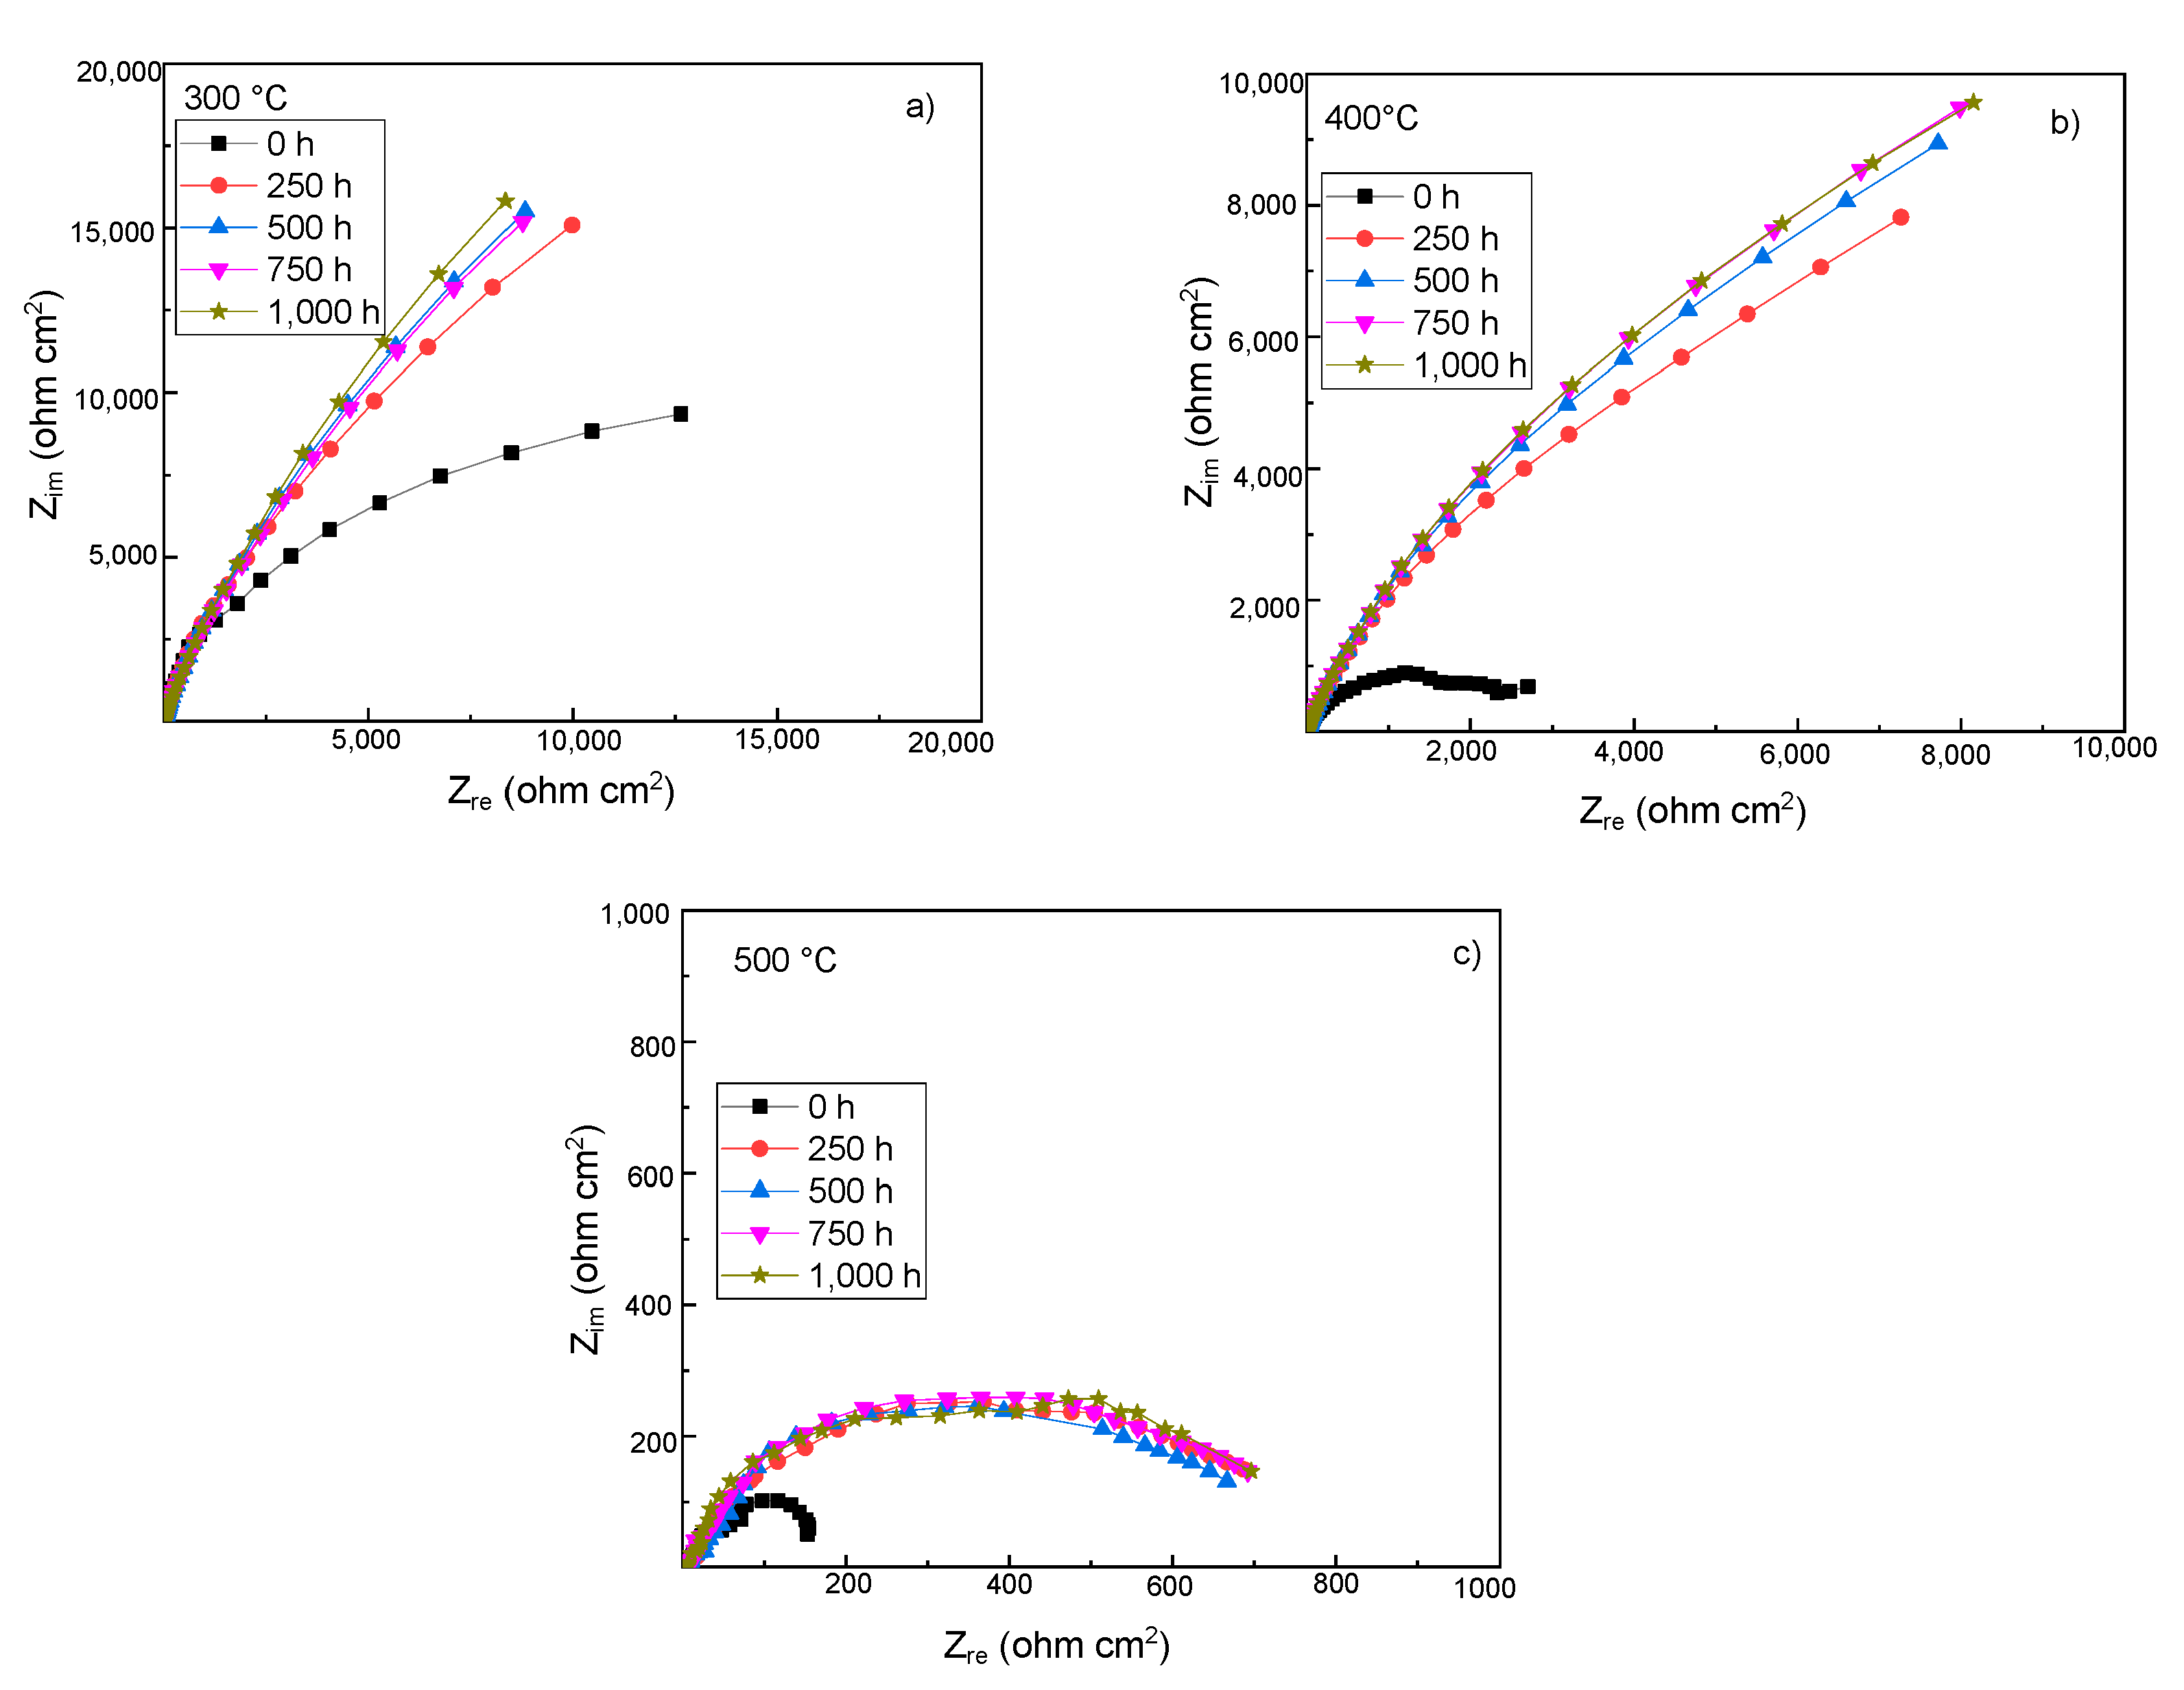
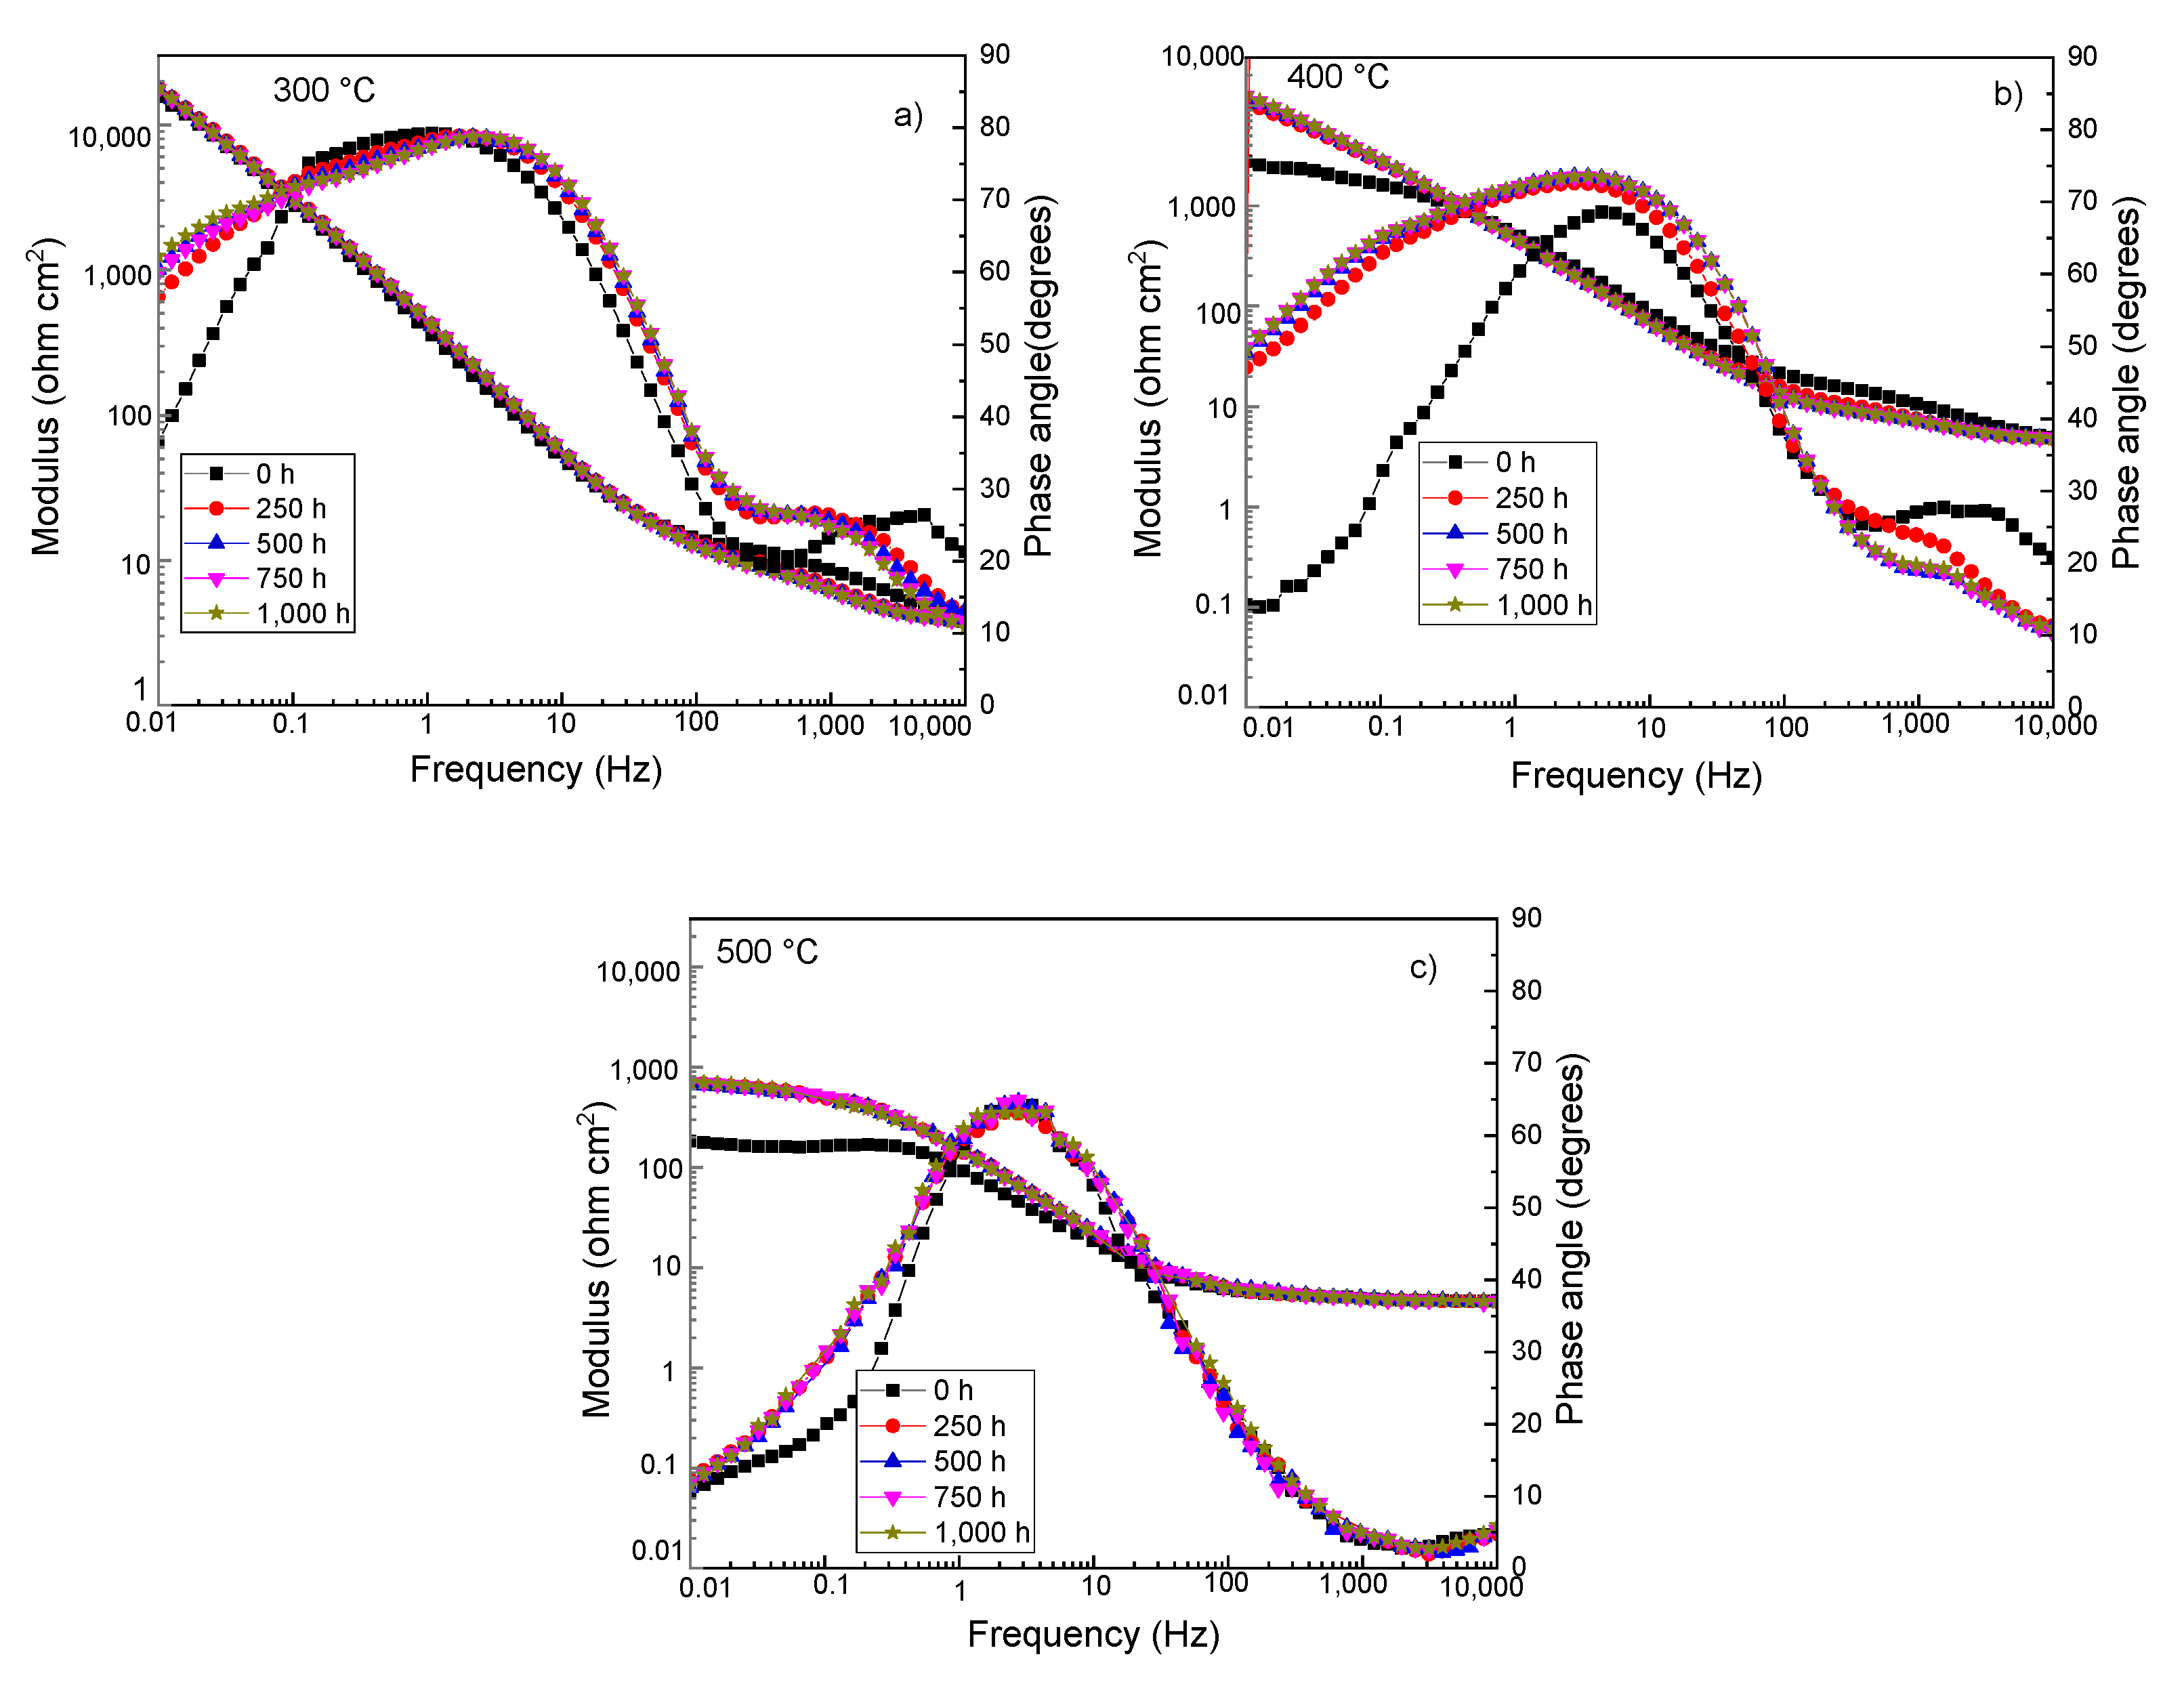
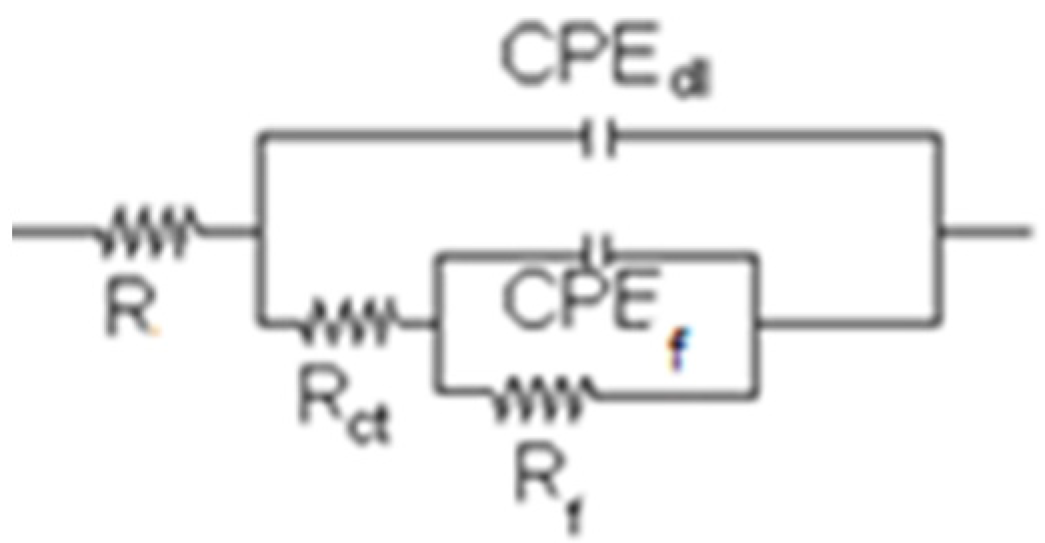
Nyquist diagrams for T91 steel at different immersion times in 60% NaNO3-40% KNO3 at 300, 400 and 500 °C is shown in Figure 5, whereas Bode plots in the same conditions are shown in Figure 6. At all testing temperatures, the Nyquist diagrams display a single depressed, capacitive semicircle at all the frequency values in Figure 5, indicating a charge transfer controlled corrosion process. The biggest semicircle diameter was obtained at 300 °C; bigger than 15,000 ohm cm2, it decreases to values close to 10,000 ohm cm2 at 400 °C, obtaining a value of 600 ohm cm2 at 500 °C. Regardless of the testing temperature, the semicircle diameter increases as time elapses, due to the formation of a protective corrosion products layer; however, at 500 °C, the semicircle diameter remained very constant after an initial increase. Encinas-Sánchez et al. [32] reported a single semicircle at the highest frequency values, followed by a straight line at intermediate and lower frequencies for T91 steel in molten nitrates at 580 °C, indicating a diffusion controlled corrosion process. In a similar way, when the same steel was coated with sol-gel ZrO2-3%molY2O3 coatings in the same salts, but at 500 °C [33], Nyquist diagrams displayed 1 semicircle at high-frequency values, followed by a second semicircle at intermediate and low frequencies, indicating a corrosion controlled process by the diffusion of ions through the protective coatings. Bode diagrams, on the other hand, in Figure 6 show that the impedance modulus was highest at 300 °C, and it decreased as the temperature increased to 500 °C. The phase angle at 300 and 400 °C in Figure 6 a and b gave values close to 80 degrees, indicative of a material passivated, and it remained very constant over a wide frequency interval, showing the existence of 2 peaks, and thus, 2 time constants, which was not so evident at 500 °C, where the peak is over a narrow frequency interval, and the phase angle decreased down to 60 degrees. The electric circuit in Figure 7 was used to fit the EIS data for T91 steel corroded in molten 60% NaNO3-40% KNO3. In this figure, Re represents the electrolyte resistance, in this case, the resistance of the 60% NaNO3-40% KNO3 mixture; Rct the resistance of the charge transfer, which occurs through the double electrochemical layer; and Cdl the capacitance at the metal/molten salt interface; Rf the resistance of the corrosion products film; and Cf its capacitance. In practice, capacitances of real experiments do not have an ideal behaviour due to surface heterogeneities, surface roughness, etc. EIS data were fitted using Zview software version 3.0 (Scribner Associates Southern Pines NC, USA). Each element proposed in the circuit was simulated using a freedom setting, fitting only positive values. The equivalent circuit proposed was submitted at different assays to reach a Chi-square less than 10−3, which indicates good fitting accuracy. To obtain approach values, an instant fit element was used to analyse the frequency range, starting from high to middle frequency, and after simulated from middle to low frequencies. After this, the equivalent circuits given in Figure 7 were built with the data obtained from the instant fit element. At the beginning of the simulation with the equivalent circuit, some data, such as Rct, Rf, and n, were fixed to estimate the adequate CPE.
And it is a common practice to replace ideal capacitances for constant phase elements, CPEs, whose impedance, ZCPE, is given by:
ZCPE = 1/[Y0(jω)n
For uncoated T91 steel in molten nitrates at 580 °C, Encinas-Sánchez et al. [32] replaced the corrosion film resistance and capacitance by a Warburg element to take into account the ions diffusion process, whereas for coated T91 steel with sol gel 3%molY2O3 coatings in the same salts, but at 500 °C [33], these elements were in series, not in parallel, with CPEdl and Rct as proposed in this work. Parameters obtained from the fitting of EIS data with the used electric circuit shown in Figure 7 are given in Table 2, Table 3 and Table 4. These tables show that the Rf values are significantly higher than those for Rct, indicating that the steel corrosion resistance in the melt is given by the film formed by the corrosion products. At 300 °C, the values for both resistances increase as time elapses, indicating an increase in both the double electrochemical layer and the film formed by the corrosion products, which seems to be highly protective. The reported values for the electrolyte and charge transfer resistances by Encinas-Sánchez et al. [32,33] are in the same order of magnitude as those reported in this work, although the electric circuits are slightly different. The slight increase in the Rct values reflects an increase in the number of ions released during the steel corrosion, mainly due to the increase in Cr, which has been reported to be highly soluble in nitrates [34,35,36]. As the temperature increased, the Rct values decreased, which is related to an increase in its conductivity due to an increase in ions released from the substrate corrosion or charged species coming from the melt. In a similar way, Rf decreased significantly as the temperature increased, due to the fact that the film of corrosion products is losing its protectiveness. The molten salt resistance, Re, remained quite constant throughout the testing time, regardless of the testing temperature, indicating a high stability of the melt.
On the other hand, the values for the parameters nf and nct close to 1 not only indicate the behaviour of an ideal capacitor, but also reflect the surface roughness due to corrosion. When the substrate corrosion rate is low, its surface roughness is low, and the values for these parameters is close to 1. On the contrary, when the corrosion rate increases, the surface roughness increases also, and the value for these parameters is close to 0.5. Thus, at 300 °C, where the corrosion rate was low, these parameters have values of 0.9, but as the temperature or the exposure time increased, the corrosion rate increased also, making the values for these parameters lower than 0.9.

3.5. Corroded Surface Analysis

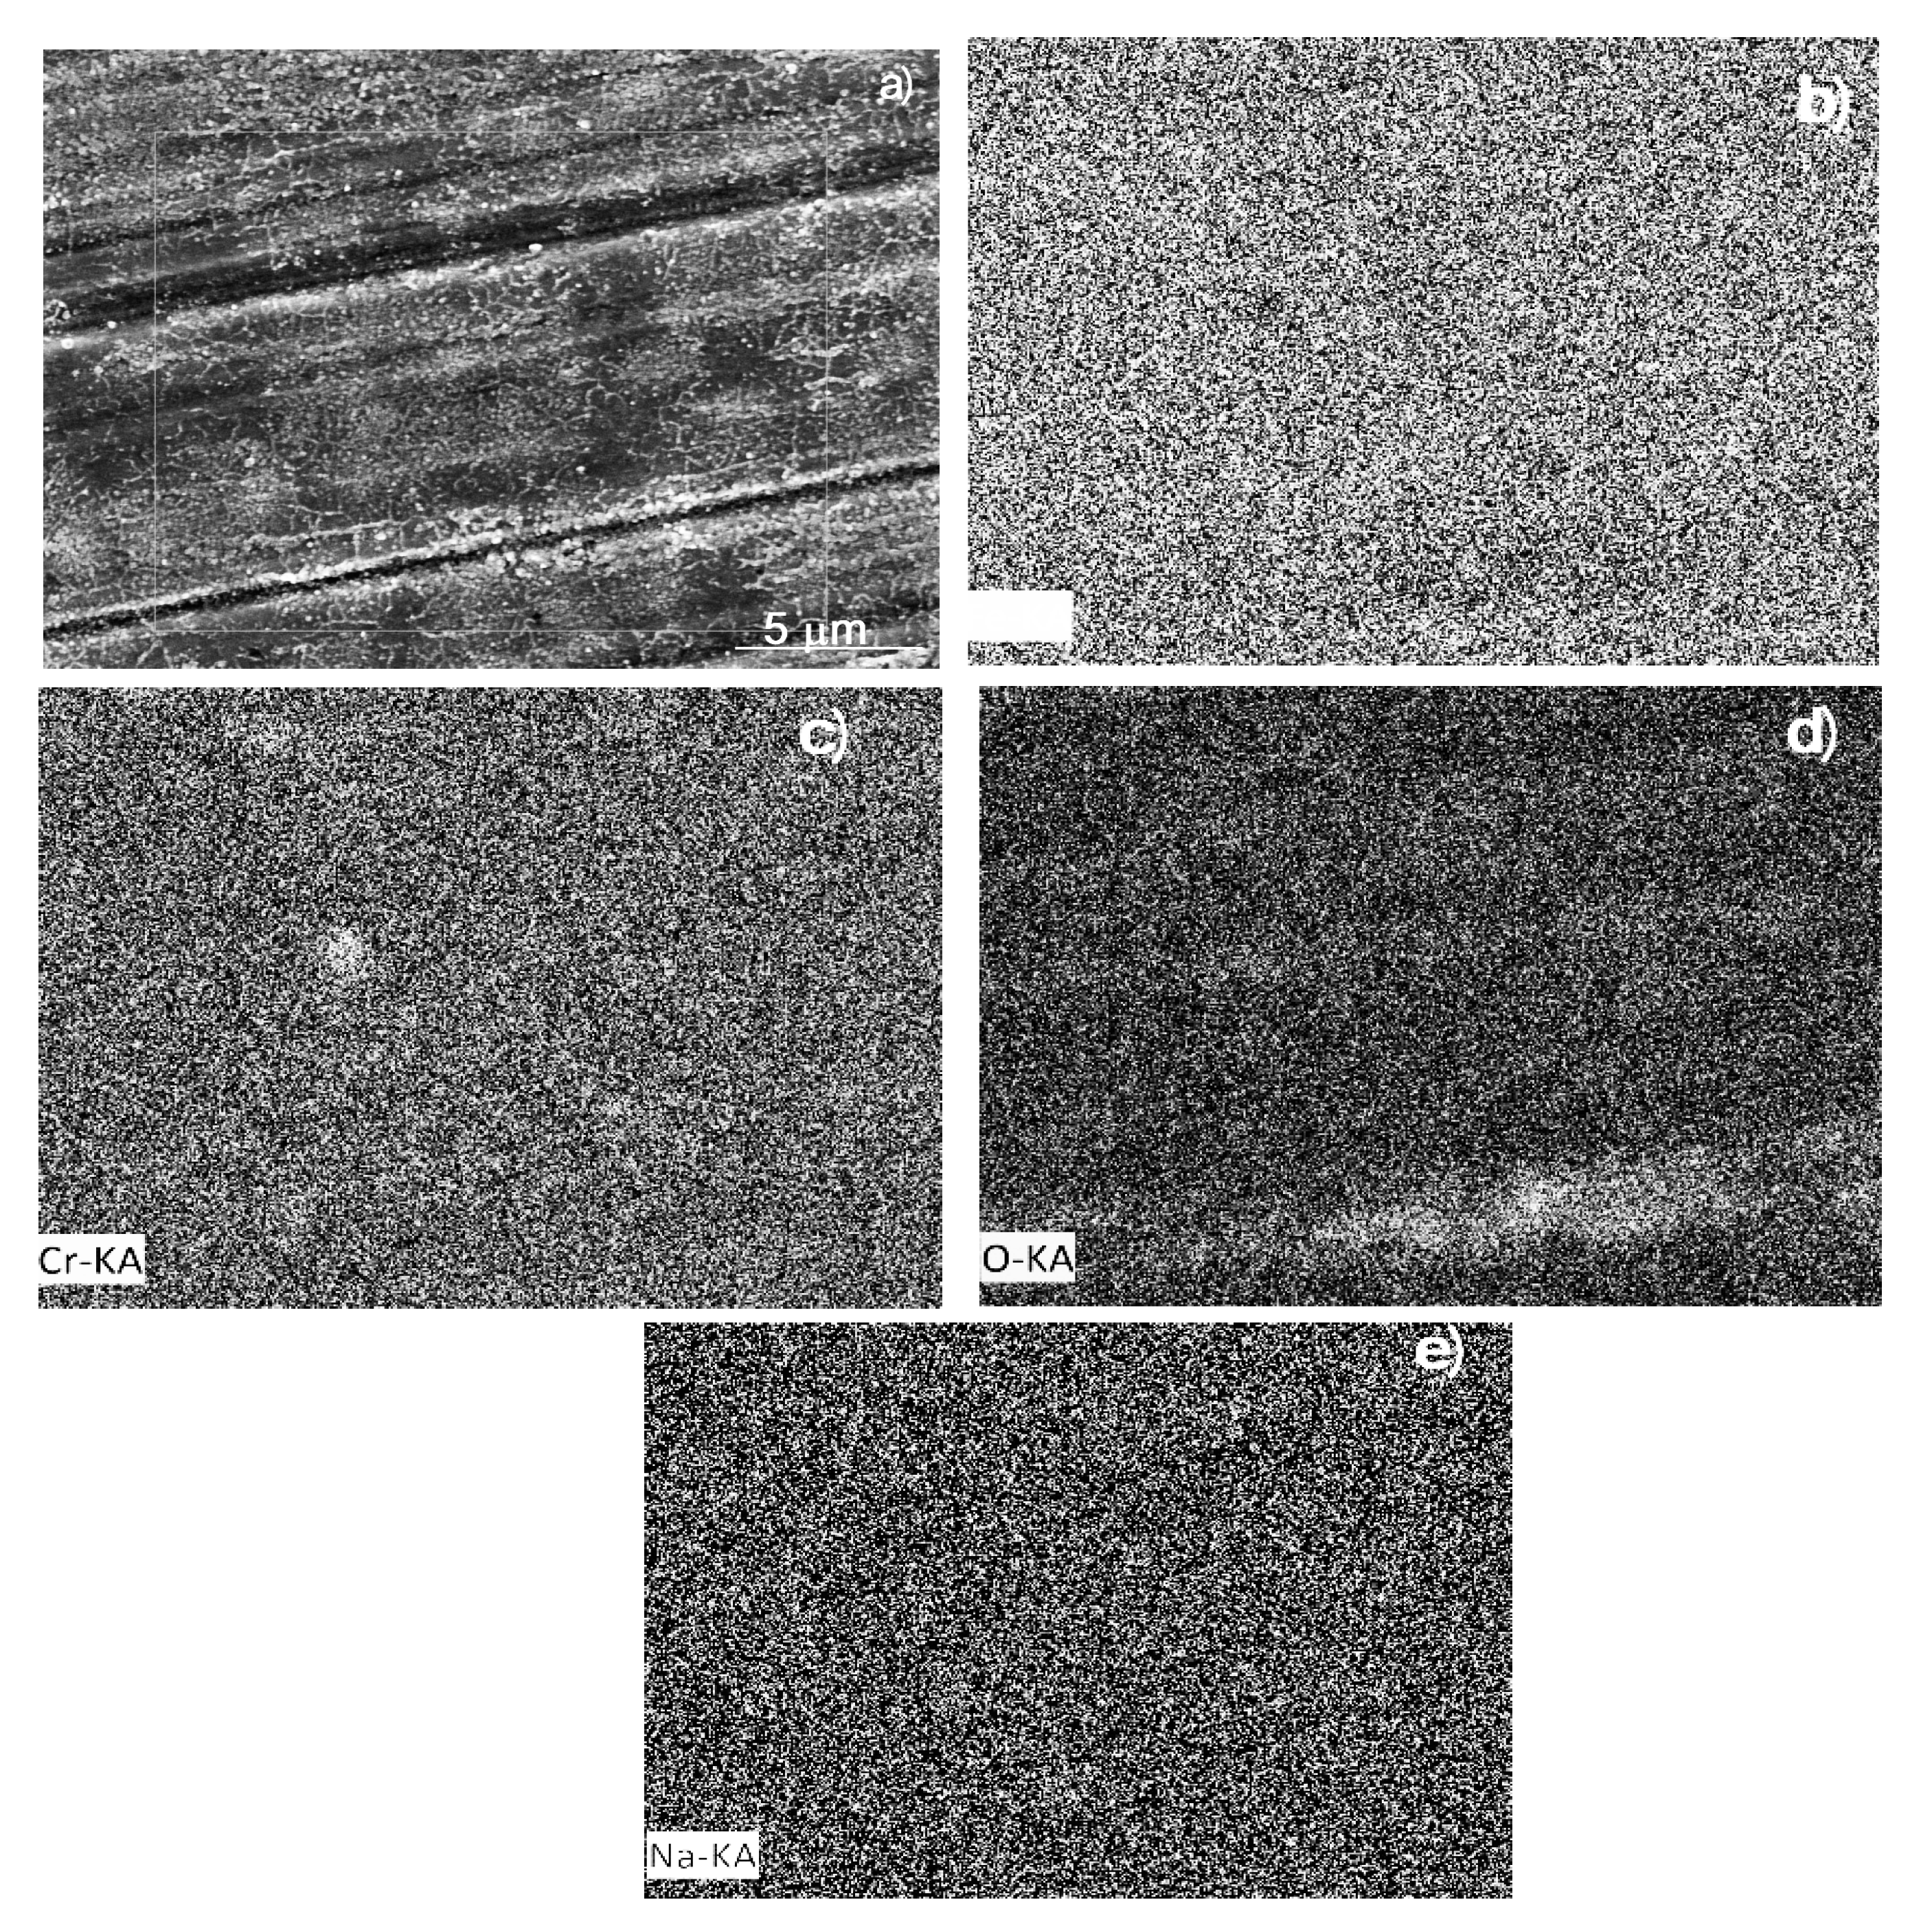
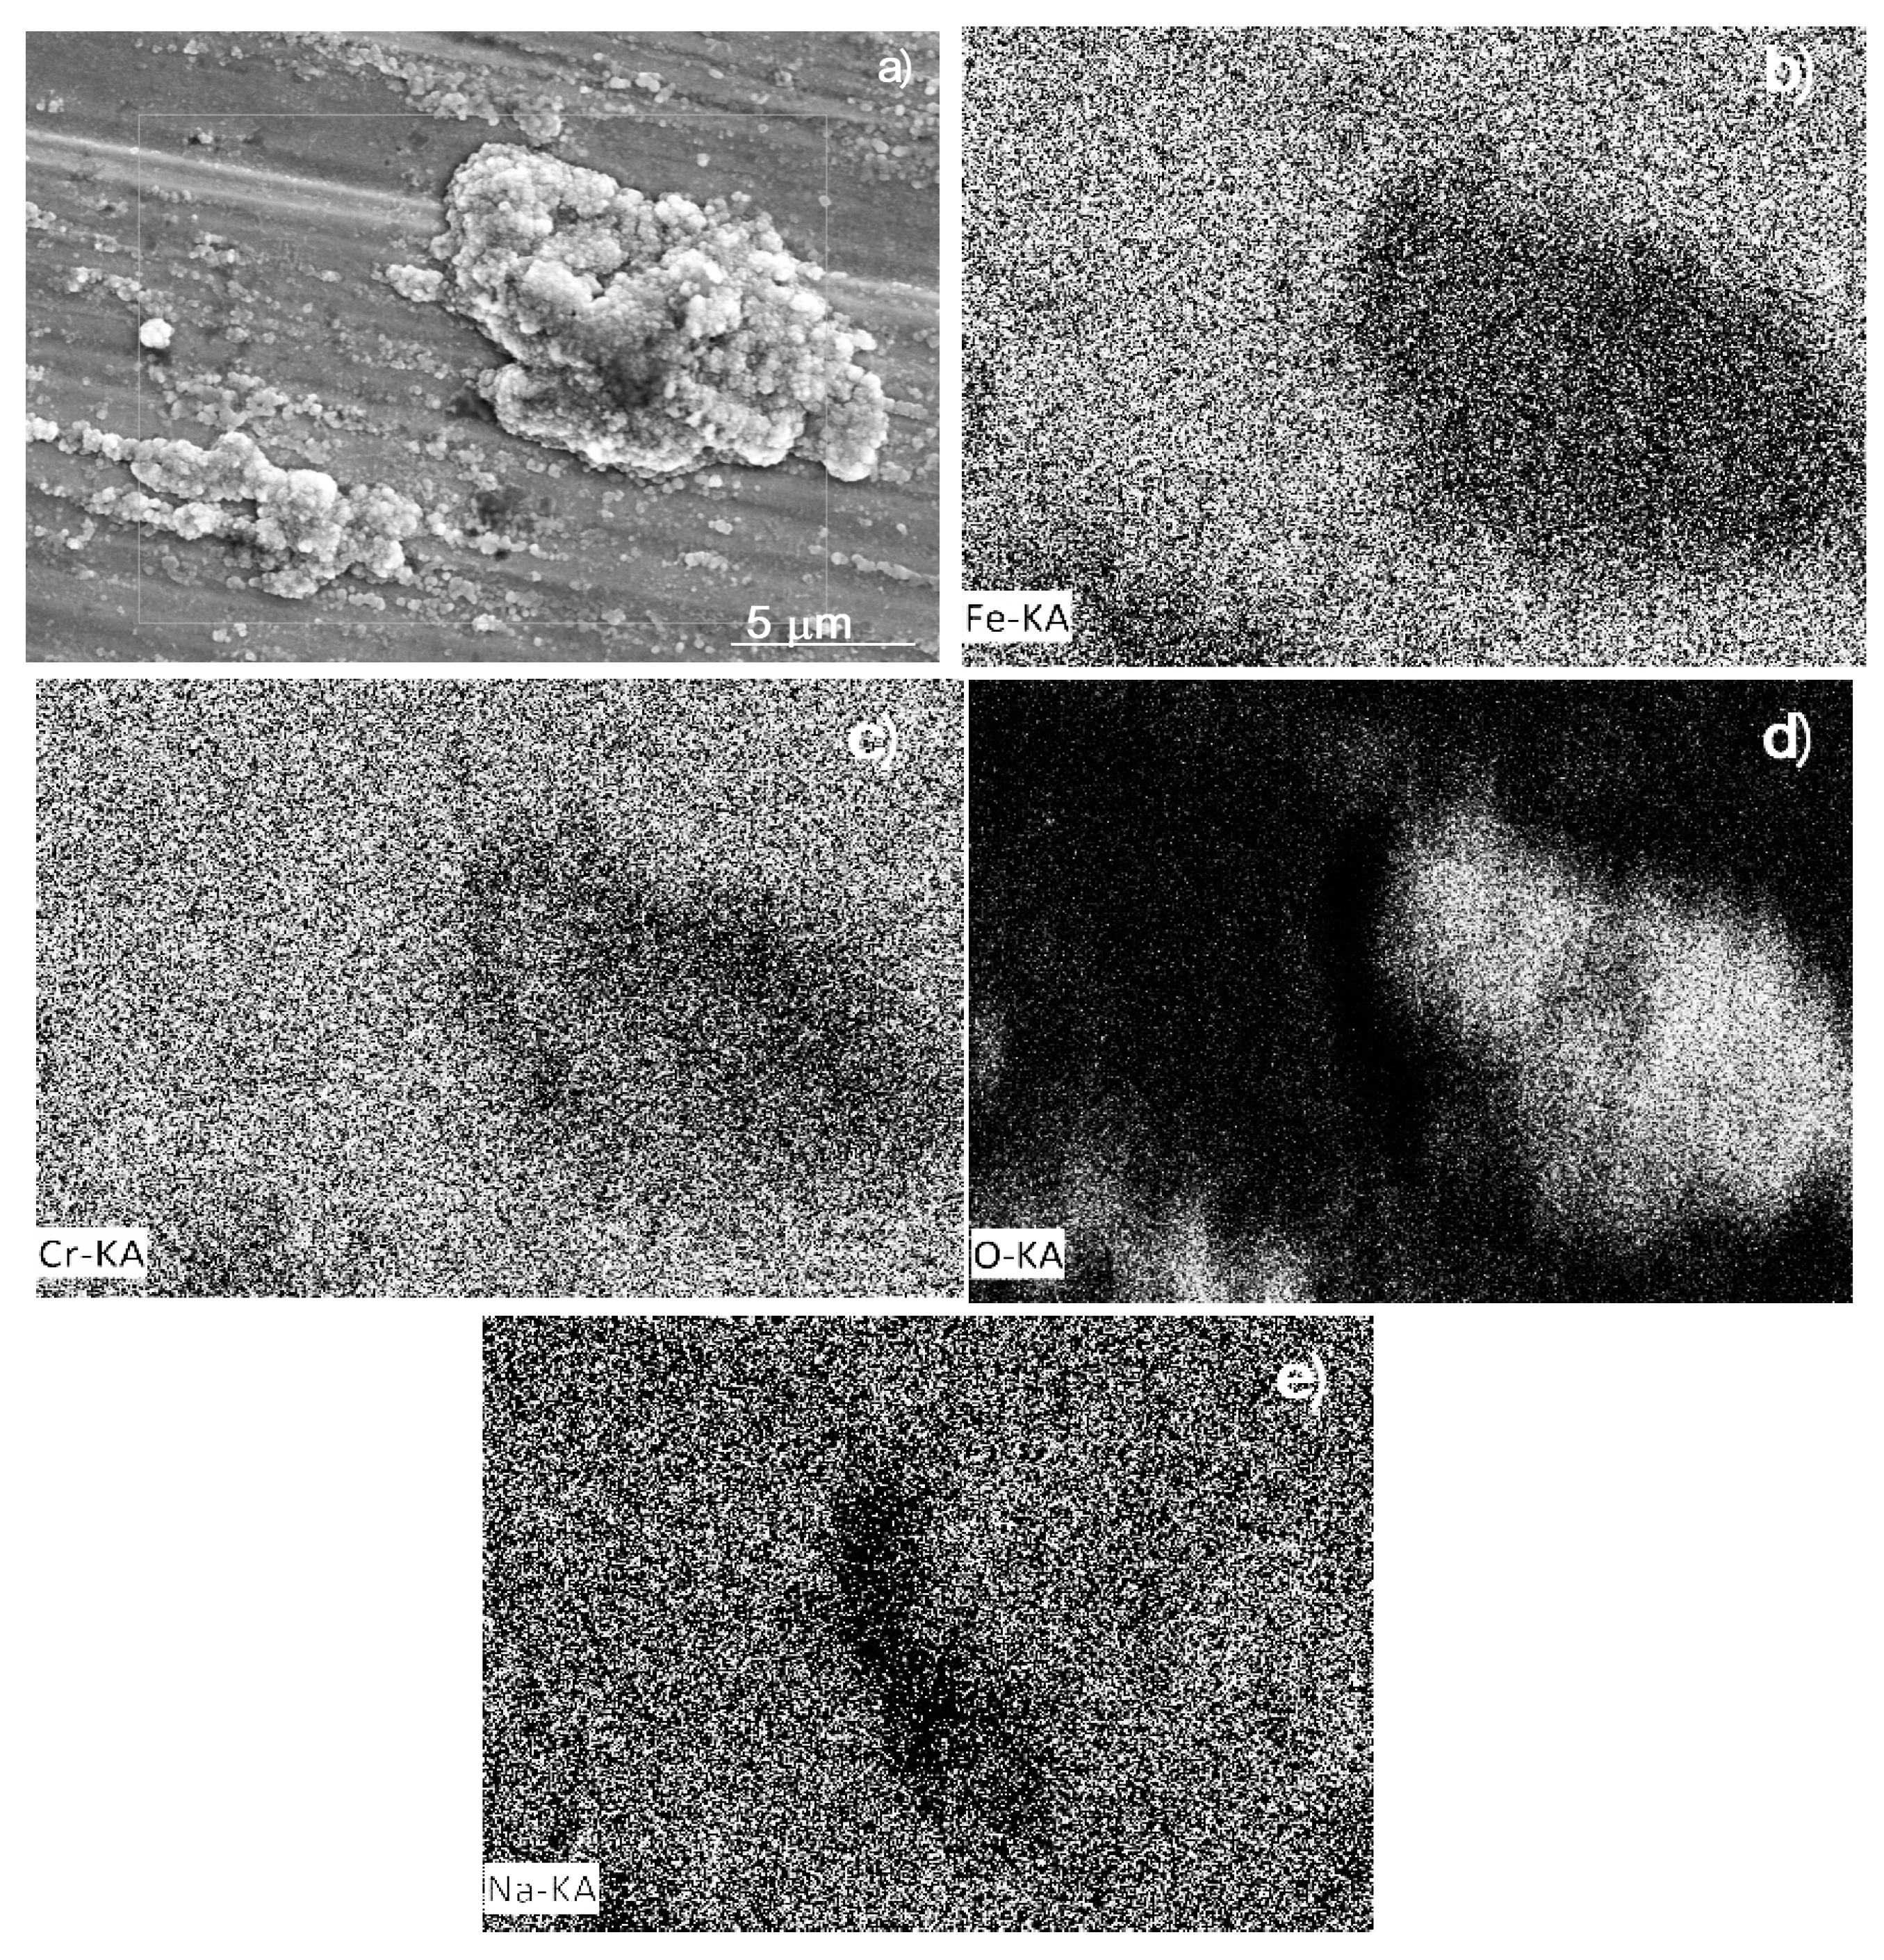
SEM micrographs of corroded T91 steel specimens in 60% NaNO3-40% KNO3 at 300, 400 and 500 °C, as well as EDX analysis of their surfaces, are shown in Figure 8, Figure 9 and Figure 10, respectively. These figures show that at 300 and 400 °C, the surface damage is marginal since the emerging paper marks are still visible, Figure 8 and Figure 9, there is no evidence of any damage due to the salt corrosive attack, and the amount of corrosion products is minimum, unlike the specimen corroded at 500 °C, Figure 10, where the corrosion products layer cover most of the steel surface. Microchemical analysis performed on the specimen surface detected the presence of chemical elements either in the steel, such as Fe and Cr, or in the salt, such as O and Na. X-ray diffraction patterns of the corrosion products [37], Figure 11, reveal the presence of Fe2O3, Fe3O4, Cr2O3 and K2FeO4 for specimens corroded at 300 °C, and at 400 °C the presence of FeCr2O4 at 2θ values of 65 degrees was detected in addition to the ones detected at 300 °C, whereas at 500 °C, in addition to these compounds, the presence of NaCrO4 was detected. In most of the tests carried out in low-chromium and stainless steels in molten nitrates, sodium ferrite, NaFeO2, iron oxides such as Fe2O3, Fe3O4, chromium oxide, Cr2O3, iron-chromium spinel, FeCr2O4, or iron–chromium mixed oxides such as (Fe,Cr)2O3 or (Fe,Cr)3O4 have been reported [7,8,11,13,26,32,34]. Encinas-Sánchez [11] reported the presence of an inner layer of FeCr2O4 spinel and an outer layer consisting of Fe2O3, Fe3O4 and Cr2O3 when 321 type stainless steel was corroded in the 53 wt% KNO3-7 wt% NaNO3-40 wt% NaNO2 mixture during 1000 h at 500 °C, whereas Fernández et al. [38] reported compounds such as Fe2O3, and Fe3O4 oxides, together with the NaCrO4 spinel. During the first stages of the test, formation of Cr2O3 is responsible for the corrosion resistance of the alloy, but it is solubilized by the melt, since it is very soluble in nitrates [39] and converted into fewer protective compounds, such as the iron-chromium spinel FeCr2O4, or iron–chromium mixed oxides, (Fe,Cr)2O3 or (Fe,Cr)3O4 due to the reaction between Cr2O3 and Fe or K to form either FeCr2O4 or K2FeO4 spinel, which is denser than single Fe2O3, Fe3O4 oxides and provide greater corrosion protection to the substrate because they grow between single oxides and underlying metal. At 300 °C, the peaks corresponding to FeCr2O4 and K2FeO4, observed at 2θ values of 22, 30 and 65 degrees, are very weak, but they increase as the temperature increases, which provides corrosion resistance to the alloy. On the contrary, the signal for Cr2O3, observed at 2 θ values of 25, 37 and 55 degrees, is very weak at all testing temperatures due to its dissolution in nitrates [39], as explained above, and to its reaction with Fe and K to form either FeCr2O4 or K2FeO4 alloy. However, since the oxides are dissolved into the molten salt, and protective spinel can be broken down, or they do not cover the whole alloy surface, causing the underlying metal to get in contact with the melt, making the corrosion of the substrate continue.

4. Conclusions

An electrochemical study of the corrosion behaviour of T91 steel in 60% NaNO3-40% KNO3 has been carried out. Polarization curves showed that the T91 steel displayed active-passive behaviour, and the Icorr value increased from 0.01 to 0.41 mA/cm2 when the testing temperature increased from 300 to 500 °C. In agreement with this, polarization resistance values decreased for more than one order of magnitude with the increase in the temperature, but remained very stable as time elapsed, indicating very good stability of the formed corrosion products. EIS studies indicated that the corrosion process was under charge transfer control and did not change with the working temperature. The corrosion products resistance was much higher than that for the double electrochemical or charge transfer resistance, indicating that the corrosion resistance was due to the protective corrosion products layer; however, both parameters decreased as the temperature increased.

Author Contributions

Investigation and methodology, D.L.-D. and N.B.G.-G.; resources and conceptualization, J.P.-C. and R.L.-S.; formal analysis and writing, A.K.L.-G. and E.S.-B.; data curation and supervision, E.R.-C.; project administration and resources, J.G.G.-R. All authors have read and agreed to the published version of the manuscript.

Funding

This research received no external funding.

Institutional Review Board Statement

Not applicable.

Informed Consent Statement

Not applicable.

Data Availability Statement

The data presented in this study are available on request from the corresponding author.

Conflicts of Interest

The authors declare no conflict of interest.

References

  1. Schellekens, A.; Battaglini, G.; Lilliestam, J.; McDonnell, J.; Patt, A. 100% Renewable Electricity: A Roadmap to 2050 For Europe and North Africa; Pricewaterhouse Coopers: London, UK, 2010; pp. 152–199. [Google Scholar]
  2. China Energy Research Institute. High Renewable Energy Penetration Scenario and Roadmap Study, 2050; Energy Research Institute: Beijing, China, 2015; pp. 210–225. [Google Scholar]
  3. Aarab, F.; Kuhn, B.; Bonk, A.; Bauer, T. A New Approach to Low-Cost, Solar Salt-Resistant Structural Materials for Concentrating Solar Power (CSP) and Thermal Energy Storage (TES). Metals 2021, 11, 1970. [Google Scholar] [CrossRef]
  4. Vignarooban, K. Vapor pressure and corrosivity of ternary metal-chloride molten salt based heat transfer fluids for use in concentrating solar power systems. Appl. Energy 2015, 159, 206–213. [Google Scholar] [CrossRef] [Green Version]
  5. Morales, M.; Gordon, S.; Fernández-Arana, Ó.; García-Marro, F.; Mateo, A.; Llanes, L.; Fargas, G. Duplex Stainless Steels for Thermal Energy Storage: Characterization of Oxide Scales Formed in Carbonate Salts at 500 °C. Metals 2022, 12, 2156. [Google Scholar] [CrossRef]
  6. Gomez-Vidal, J.C.; Fernandez, A.G.; Tirawat, R.; Turchi, C.; Huddleston, W. Corrosion resistance of alumina-forming alloys against molten chlorides for energy production. I: Pre-oxidation treatment and isothermal corrosion tests. Sol. Energy Mater. Sol. Cells 2017, 166, 222–233. [Google Scholar] [CrossRef] [Green Version]
  7. Gomez-Vidal, J.C.; Fernandez, A.G.; Tirawat, R.; Turchi, C.; Huddleston, W. Corrosion resistance of alumina forming alloys against molten chlorides for energy production. II: Electrochemical impedance spectroscopy under thermal cycling conditions. Sol. Energy Mater. Sol. Cells 2017, 166, 234–245. [Google Scholar] [CrossRef] [Green Version]
  8. Li, H.; Wang, X.; Yin, X.; Yang, X.; Tang, J.; Gong, J. Corrosion and electrochemical investigations for stainless steels in molten Solar Salt: The influence of chloride impurity. J. Energy Storage 2021, 39, 102675. [Google Scholar] [CrossRef]
  9. Mallco, A.; Fernández, A.G. Corrosion Monitoring Assessment on Lithium Nitrate Molten Salts as Thermal Energy Storage Material Applied to CSP Plants. Oxid. Met. 2020, 94, 383–396. [Google Scholar] [CrossRef]
  10. Spiegel, M.; Schraven, P. Corrosion of Austenitic Steels and Nickel Alloys in Molten KNO3–NaNO3 at Different Temperatures: Role of Alloying Elements. Oxid. Met. 2021, 96, 145–155. [Google Scholar] [CrossRef]
  11. Encinas-Sánchez, V.; Lasanta, M.I.; De Miguel, M.T.; García-Martín, G.; Pérez, F.J. Corrosion monitoring of 321H in contact with a quaternary molten salt for parabolic trough CSP plants. Corros. Sci. 2021, 178, 109070. [Google Scholar] [CrossRef]
  12. Vignarooban, K.; Pugazhendhi, P.; Tucker, C.; Gervasio, D.; Kannan, A.M. Corrosion resistance of Hastelloys in molten metal-chloride heat transfer fluids for concentrating solar power applications. Sol. Energy 2014, 103, 62–69. [Google Scholar] [CrossRef]
  13. Goods, S.H.; Bradshaw, R.W. Corrosion of stainless steels and carbon steel by molten mixtures of commercial nitrate salts. J. Mater. Eng. Perform. 2004, 13, 78–87. [Google Scholar] [CrossRef]
  14. Wang, J.W.; Zhang, C.Z.; Li, Z.H.; Zhou, H.X.; He, J.X.; Yu, J.C. Corrosion behavior of nickel-based superalloys in thermal storage medium, of molten eutectic NaCl-MgCl2 in atmosphere. Sol. Energy Mater. Sol. Cells 2017, 164, 146–155. [Google Scholar] [CrossRef]
  15. Palacios, A.; Navarro, M.E.; Jiang, Z.; Avila, A.; Qiao, G.; Mura, E.; Ding, Y. High-temperature corrosion behaviour of metal alloys in commercial molten Salts. Sol. Energy 2020, 201, 437–452. [Google Scholar] [CrossRef]
  16. Ibrahim, A.; Peng, H.; Riaz, A.; Basit, M.A.; Rashid, U.; Basit, A. Molten salts in the light of corrosion mitigation strategies and embedded with nanoparticles to enhance the thermophysical properties for CSP plants. Sol. Energy Mater. Sol. Cells 2021, 219, 110768. [Google Scholar] [CrossRef]
  17. Pineda, F.; Mallco, A.; De Barbieri, F.; Carrasco, C.; Henriquez, M.; Fuentealba, E.; Fernández, Á.G. Corrosion evaluation by electrochemical real-time tracking of VM12 martensitic steel in a ternary molten salt mixture with lithium nitrates for CSP plants. Sol. Energy Mater. Sol. Cells 2021, 231, 111302. [Google Scholar] [CrossRef]
  18. Bendick, W.; Cipolla, L.; Gabrel, J.; Hald, J. New ECCC assessment of creep rupture strength for steel grade X10CrMoVNb9-1 (Grade 91). Int. J. Press. Vessel. Pip. 2010, 87, 304–309. [Google Scholar] [CrossRef]
  19. Li, Y.; Du, J.; Li, L.; Gao, K.; Pang, X.; Volinsky, A.A. Mechanical properties and phases evolution in T91 steel during long-term high-temperature exposure. Eng. Fail. Anal. 2020, 111, 104451. [Google Scholar] [CrossRef]
  20. Sharma, A.; Verma, D.K.; Kumaran, S. Effect of post weld heat treatment on microstructure and mechanical properties of Hot Wire GTA welded joints of SA213 T91 steel. Mater. Today Proc. 2018, 5, 8049–8056. [Google Scholar] [CrossRef]
  21. Singh, M.P.; Basu, B.; Chattopadhyay, K. Probing High-Temperature Electrochemical Corrosion of 316 Stainless Steel in Molten Nitrate Salt for Concentrated Solar Power Plants. J. Mater. Eng. Perform. 2022, 31, 4902–4908. [Google Scholar] [CrossRef]
  22. Ma, L.; Zhang, C.; Wu, Y.; Lu, Y. Comparative review of different influence factors on molten salt corrosion characteristics for thermal energy storage. Sol. Energy Mater. Sol. Cells 2022, 235, 111485. [Google Scholar] [CrossRef]
  23. Mallco, A.; Pineda, F.; Mendoza, M.; Henriquez, M.; Carrasco, C.; Vergara, V.; Fuentealba, E.; Fernandez, A.G. Evaluation of flow accelerated corrosion and mechanical performance of martensitic steel T91 for a ternary mixture of molten salts for CSP plants. Solar Sol. Energy Mater. Sol. Cells 2022, 238, 111623. [Google Scholar] [CrossRef]
  24. Ning, Z.; Zhou, Q.; Liu, Z.; Li, N.; Luo, Q.; Wen, D. Effects of imposed stresses on high temperature corrosion behaviour of T91. Corros. Sci. 2021, 189, 109595. [Google Scholar] [CrossRef]
  25. Sundaresan, C.; Rajasekaran, B.; Varalakshmi, S.; Santhy, K.; Rao, D.S.; Sivakumar, G. Comparative hot corrosion performance of APS and Detonation sprayed CoCrAlY, NiCoCrAlY and NiCr coatings on T91 boiler steel. Corros. Sci. 2021, 189, 109556. [Google Scholar]
  26. Dorcheh, A.S.; Durham, R.N.; Galetz, M.C. Corrosion behavior of stainless and low-chromium steels and IN625 in molten nitrate salts at 600 °C. Sol. Energy Mater. Sol. Cells 2016, 144, 109–116. [Google Scholar] [CrossRef]
  27. Fähsing, D.; Oskay, C.; Meißner, T.M.; Galetz, M.C. Corrosion testing of diffusion-coated steel in molten salt for concentrated solar power tower systems. Surf. Coat. Technol. 2018, 354, 46–55. [Google Scholar] [CrossRef]
  28. Zhai, W.; Yang, B.; Li, S.; Wang, Z.; Zhang, S.; Huang, G. High Temperature Corrosion behavior of Metallic Materials in modified Hitec Molten Salts. Adv. Comp. Sci. Res. 2016, 71, 707–713. [Google Scholar]
  29. Baraka, A.; Rohman, A.; El Hosary, A.A. Corrosion on mild steel in molten sodium nitrate-potassium nitrate eutectic. Br. Corros. J. 1976, 11, 44–46. [Google Scholar] [CrossRef]
  30. De Jong, J.M.; Broers, G.H.J. A reversible oxygen electrode in an equimolar KNO3–NaNO3 melt saturated with sodium peroxide II. A voltammetric study. Electrochim. Acta 1976, 21, 893–900. [Google Scholar] [CrossRef]
  31. Zhu, M.; Zeng, S.; Sharif, A.; Cao, B.; Zhang, H.; Wang, M. Effects of chloride ions on electrochemical reaction of 316 stainless steel in mixtures of molten nitrate salts. Mater. Werkst. 2020, 51, 1161–1169. [Google Scholar] [CrossRef]
  32. Encinas-Sánchez, V.; De Miguel, M.T.; Lasanta, M.I.; García-Martín, G.; Pérez, F.J. Electrochemical impedance spectroscopy (EIS): An efficient technique for monitoring corrosion processes in molten salt environments in CSP Applications. Sol. Energy Mat. Sol Cells 2019, 191, 157–163. [Google Scholar] [CrossRef]
  33. Encinas-Sánchez, V.; Macías-García, A.; De Miguel, M.T.; Pérez, F.J.; Rodríguez-Rego, J.M. Electrochemical Impedance Analysis for Corrosion Rate Monitoring of Sol–Gel Protective Coatings in Contact with Nitrate Molten Salts for CSP Applications. Materials 2023, 16, 546. [Google Scholar] [CrossRef]
  34. Zhu, M.; Zeng, S.; Zhang, H.; Li, J.; Cao, B. Electrochemical study on the corrosion behaviors of 316 SS in HITEC molten salt at different temperatures. Sol. Energy Mater. Sol. Cells 2018, 186, 200–207. [Google Scholar] [CrossRef]
  35. Ni, C.S.; Lu, L.Y. Electrochemical impedance and modelling studies of the corrosion of three commercial stainless steels in molten carbonate. Int. J. Corros. 2014, 2014, 1–13. [Google Scholar] [CrossRef] [Green Version]
  36. Dorcheh, S.; Durham, R.N.; Galetz, M.C. High temperature corrosion in molten solar salt: The role of chloride impurities. Mater. Corr. 2017, 68, 943–951. [Google Scholar] [CrossRef]
  37. Powder Diffraction File, International Center of Diffraction Data, 12 Campus Boulevard, Newton Square, PA, USA, 2003. Available online: https://www.icdd.com/pdfsearch/ (accessed on 20 February 2023).
  38. Fernández, A.G.; Galleguillos, H.; Fuentealba, E.; Pérez, F.J. Corrosion of stainless steels and low-Cr steel in molten Ca(NO3)2–NaNO3–KNO3 eutectics for direct energy storage in CSP plants. Sol. Energy Mat. Sol. Cells 2015, 141, 7–13. [Google Scholar] [CrossRef]
  39. Fernández, A.G.; Lasanta, M.I.; Pérez, F.J. Molten salt corrosion of stainless steels and low-Cr steel in CSP plants. Oxid. Met. 2012, 78, 329–348. [Google Scholar] [CrossRef]
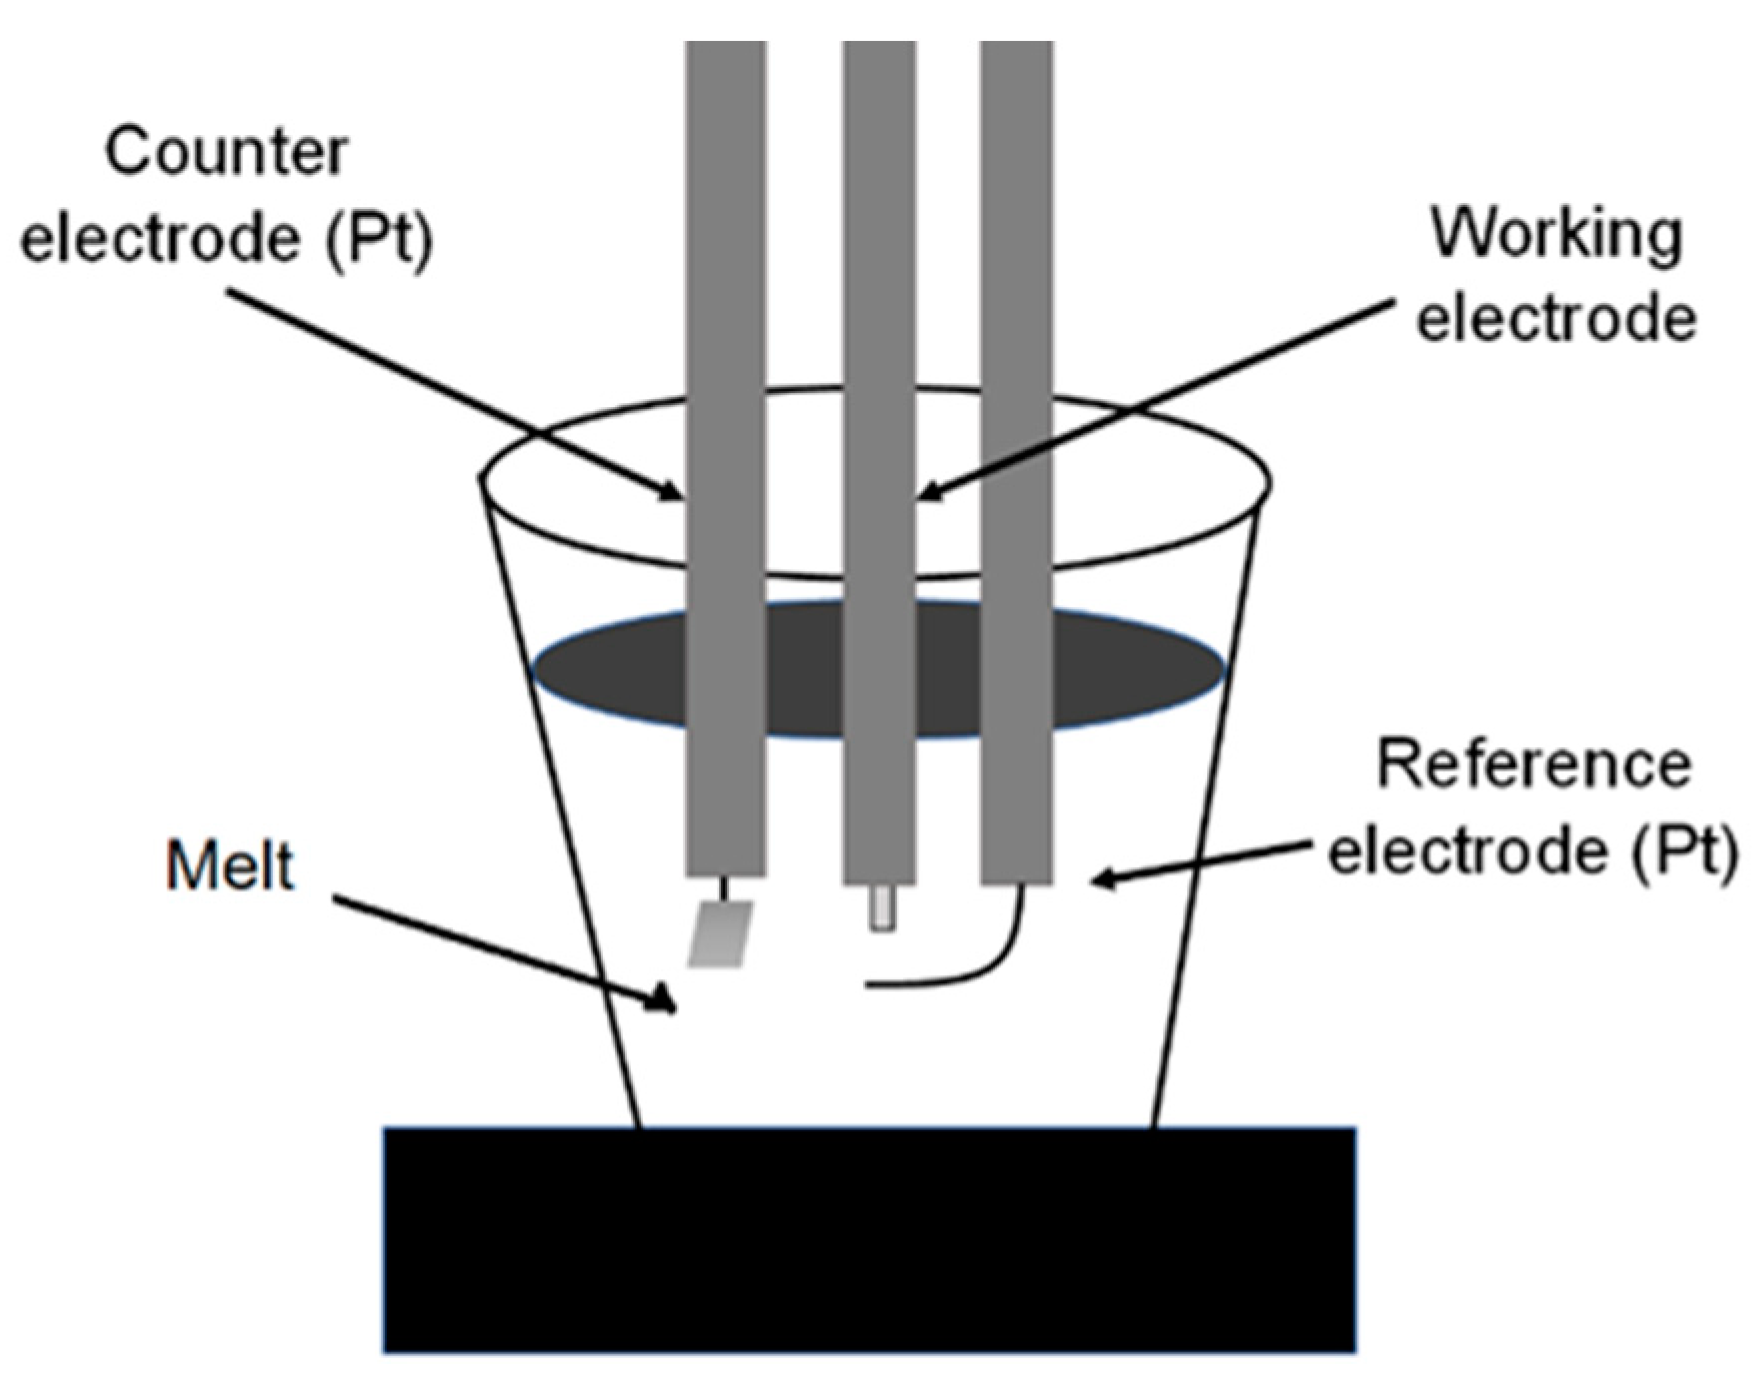
Figure 1. Set-up arrangement for the electrochemical tests.
Metals 13 00502 g001
Figure 2. Effect of temperature on the variation of the OCP value for T91 steel in 60 wt% NaNO3-40%KNO3.
Metals 13 00502 g002
Figure 3. Effect of temperature on the variation of the polarization curves for T91 steel in 60 wt% NaNO3-40%KNO3.
Metals 13 00502 g003
Figure 4. Effect of temperature on the variation of the Rp value for T91 steel in 60 wt% NaNO3-40%KNO3.
Metals 13 00502 g004
Figure 5. Nyquist diagrams for T91 steel in 60 wt% NaNO3-40%KNO3 at (a) 300, (b) 400 and (c) 500 °C.
Metals 13 00502 g005
Figure 6. Bode diagrams for T91 steel in 60 wt% NaNO3-40%KNO3 at (a) 300, (b) 400 and (c) 500 °C.
Metals 13 00502 g006
Figure 7. Electric circuit to simulate EIS data of T91 steel in 60 wt% NaNO3-40KNO3.
Metals 13 00502 g007
Figure 8. SEM micrograph of T91 steel corroded in 60 wt% NaNO3-40KNO3 at 300 °C showing (a) secondary electrons image and EDX mappings of (b) Fe, (c) Cr, (d) O and (e) Na.
Metals 13 00502 g008
Figure 9. SEM micrograph of T91 steel corroded in 60 wt% NaNO3-40KNO3 at 400 °C showing (a) secondary electrons image and EDX mappings of (b) Fe, (c) Cr, (d) O and (e) Na.
Metals 13 00502 g009
Figure 10. SEM micrograph of T91 steel corroded in 60 wt% NaNO3 at 500 °C showing (a) secondary electrons image and EDX mappings of (b) Fe, (c) Cr, (d) O and (e) Na.
Metals 13 00502 g010aMetals 13 00502 g010b
Figure 11. X-ray patterns of corrosion products for T91 steel corroded in 60 wt% NaNO3-40KNO3 at 300, 400 and 500 °C.
Metals 13 00502 g011
Table 1. Electrochemical parameters obtained from polarization curves.
Testing Temperature (°C)Ecorr
(mV)
Icorr
(mA/cm2)
βa
(mV/dec)
βc
(mV/dec)
300600.01295420
400−100.05360490
500−700.41420570
Table 2. Electrochemical parameters obtained from the fitting of the EIS data at 300 °C.
Time
(h)
Re
(ohm cm2)
CPEdl
(F/cm2)
ndlRct
(ohm cm2)
CPEf
(F/cm2)
nfRf
(ohm cm2)
03.28.140.9110.324.120.9212,840
2503.41.780.9014.592.650.9415,797
5003.42.100.9014.282.440.9517,869
7503.52.360.8913.692.140.9618,050
10003.62.370.8913.562.150.9618,306
Table 3. Electrochemical parameters obtained from the fitting of the EIS data at 400 °C.
Time
(h)
Re
(ohm cm2)
CPEdl
(F/cm2)
ndlRdl
(ohm cm2)
CPEf
(F/cm2)
nfRf
(ohm cm2)
03.23.720.912.661.210.92808
2504.32.560.89.942.200.910,348
5004.22.720.87.362.030.911,659
7504.32.750.87.651.930.912,476
10004.22.740.77.911.930.912,717
Table 4. Electrochemical parameters obtained from the fitting of the EIS data at 500 °C.
Time
(h)
Re
(ohm cm2)
CPEdl
(F/cm2)
ndlRdl
(ohm cm2)
CPEf
(F/cm2)
nfRf
(ohm cm2)
04.71.880.86.01.550.8196
2506.32.090.73.81.050.7694
5004.63.290.73.12.050.7665
7504.75.720.72.52.320.7655
10004.01.280.75.48.990.7750
Disclaimer/Publisher’s Note: The statements, opinions and data contained in all publications are solely those of the individual author(s) and contributor(s) and not of MDPI and/or the editor(s). MDPI and/or the editor(s) disclaim responsibility for any injury to people or property resulting from any ideas, methods, instructions or products referred to in the content.