Article

Dwell Fatigue Crack Growth Behavior of CP-Ti TA2 Welded Joint at 25 °C and 200 °C

1
School of Mechanical and Power Engineering, Nanjing Tech University, Nanjing 211816, China
2
Jiangsu Key Lab of Design and Manufacture of Extreme Pressure Equipment, Nanjing 211816, China
3
Engineering Technology Training Center, Nanjing Vocational University of Industry Technology, Nanjing 210023, China
*
Authors to whom correspondence should be addressed.
Metals 2023, 13(3), 553; https://doi.org/10.3390/met13030553
Submission received: 13 January 2023 / Revised: 2 March 2023 / Accepted: 7 March 2023 / Published: 9 March 2023
(This article belongs to the Special Issue Fracture Mechanics of Metals)

Abstract

:
We report on studies of the dwell fatigue crack growth (FCG) behavior of commercial pure titanium (CP-Ti) TA2 weld joints at 25 °C and 200 °C. Taking into account the effects of load ratio and dwell temperature, the impact of dwell on FCG behavior and the associated fracture mechanism are clearly demonstrated. Meanwhile, in order to illustrate creep–fatigue interaction, finite element simulations are also performed to analyze the evolution of stress and strain field near the crack tip. The results show that with the increase in dwell temperature, the FCG rate is increased. Furthermore, the effect of dwell on FCG behavior is more pronounced at higher load ratios. Finite element simulation results indicate that dwell induces creep stress relaxation and leads to an increase in the equivalent plastic strain near the crack tip. With the increase of dwell temperature and load ratio, the more pronounced creep deformation may lead to a creep-dominated FCG behavior. As consistent with the above analysis, the examination of the fracture surface reveals that more cavities and secondary cracks may be observed because of the increased creep deformation at the higher dwell temperature and load ratio.

1. Introduction

Titanium and its alloys have been extensively used in different industries because of their excellent mechanical properties. However, it has been well recognized over the past 40 years that a significant failure mode, known as cold dwell fatigue, occurs typically between −40 °C and 200 °C in titanium alloys [1]. Compared to pure creep, loading–unloading cycles superimposed on static stress during a dwell fatigue process results in the reduction of failure time [2]. The dwell fatigue damage essentially results from fatigue and creep damage. The fatigue damage is related to fatigue crack propagation, while the creep damage is related to the coalescence of creep cavities [3].
Cold dwell had significant influences on FCG behavior [4]. A few researchers investigated the dwell FCG behavior of different engineering alloys [5,6,7,8,9,10]. The findings revealed that the FCG rate of Ti-6242 with a clod dwell time of 80 s was three times higher than that without dwell at room temperature [5]. The study on the high-temperature dwell FCG behavior of nickel-based alloy 718 suggested that the FCG rate at 450 °C to 650 °C was accelerated by an increase in dwell temperature and time [6,7]. The impact of dwell on FCG behavior was more significant at the higher temperature of 650 °C [6,7]. Meanwhile, the failure mode of the material could change from transgranular fracture to intergranular fracture under the influence of creep damage [8]. With the increase in dwell time, the FCG behavior of HAYNES 230 alloys was more dependent on the creep deformation [8]. The dominant damage mechanism of P91 power plant steel during creep FCG tests at 600 °C was the formation of micro-voids and microcracks associated with the crack tip due to the significant creep effect [10].
Despite the common belief that creep is primarily observed at high temperatures, reports over the past 50 years have shown that creep also occurs at low temperatures in titanium alloys [11]. Yamada et al. [12] conducted a comparative analysis of the low-temperature creep behavior of various metallic materials, including hexagonal close-packed (hcp), body-centered cubic (bcc), and face-centered cubic (fcc) structures, and found that hcp titanium alloys exhibit more significant creep deformation. It has been suggested that the notable creep behavior in titanium alloys at low temperatures may be attributed to the emergence of deformation twinning [13,14]. A study on the effect of cold creep on the FCG behavior of CP-Ti reported that room-temperature dwell FCG behavior was also dependent on the applied load ratio and amplitude [15]. Further study on the dwell FCG behavior of CP-Ti at different temperatures ranging from 20 °C to 300 °C found that the dwell FCG rate was sensitive to dwell temperature [16]. Compared to other deformation temperatures, the creep effect of CP-Ti at 200 °C was more remarkable [17]. A comparison of FCG behavior between CP-Ti base metal and its weld joint found that the FCG behavior of the weld joint exhibited different features, as the coarse grains and acicular martensite in the microstructure of the weld joint led to the reduction of the FCG rate [18]. Further research is necessary to investigate the dwell FCG behavior of the CP-Ti weld joint.
However, there is currently a limited amount of literature available regarding the study of the dwell FCG behavior of the CP-Ti weld joint. The influence of dwell temperature on the FCG behavior of the CP-Ti weld joint remains unclear. Hence, the main purpose of this work is to investigate the dwell FCG behavior of a CP-Ti weldment at the typical temperatures of 25 °C and 200 °C. Meanwhile, the finite element method is employed to investigate the details of the crack tip deformation. Fracture surface morphology is analyzed using the JSM-6360LV scanning electron microscope (SEM). This research will contribute to the understanding of the dwell effect on FCG behavior of the CP-Ti weld joint.

2. Methods

2.1. Experiments

The as-received material in this study was commercial pure titanium grade 2 (TA2) with annealing treatment. Its chemical composition (mass fraction, %) is listed in Table 1. Table 2 shows the detailed welding parameters. The welding direction was normal to the rolling direction, and subsequent 100% radiographic testing (RT) was conducted to avoid macro cracks. Standard compact tension (CT) specimen was used in this study. The detailed dimension of the specimen is shown in Figure 1, where a0, B, and W are 20 mm, 12.5 mm, and 50 mm, respectively. Fatigue crack growth tests were performed on the MTS370 material testing system according to ASTME 674-15 [19]. Prior to the experiment, a crack with a length of 2 mm was produced. The crack length was recorded using the unloading compliance method during the tests. Triangular and trapezoidal waveforms with a constant frequency of 5 Hz were used. Dwell is applied at the peak load. In order to compare the effects of dwell temperature, FCG experiments are carried out at a room temperature of 25 °C and an intermediate temperature of 200 °C, as shown in Table 3.

2.2. Finite Element Simulation

In order to have a deep understanding of the effects of creep on the crack tip deformation, the finite element method (FEM) is also used to extract the details of stress and strain distribution around the crack tip. The well-known Chaboche model [20] is capable of describing the process of plastic deformation and cyclic hardening/softening quite accurately. The typical Huber–Von Mises yield criteria can be used to describe the yield surface, expressed as follows:
f σ , α , R , k = J σ α R k 0
where f is the yield function, σ is the stress tensor, and α and R are the non-linear kinematic hardening and the isotropic hardening variables, respectively. k is the initial size of the yield surface. J represents the von Mises distance in the deviatoric stress space, which is expressed as
J σ α = 3 2 S α dev : S α dev
where αdev and S are the deviatoric part of back stress and the deviatoric stress tensor, respectively. The evolution of back stress components is
α ˙ k = C k ε ¯ ˙ p l 1 σ 0 σ α γ k α k ε ¯ ˙ p l + 1 C k α k C ˙ k
and the overall back stress α is the sum of all back stress components:
α = k = 1 N α k
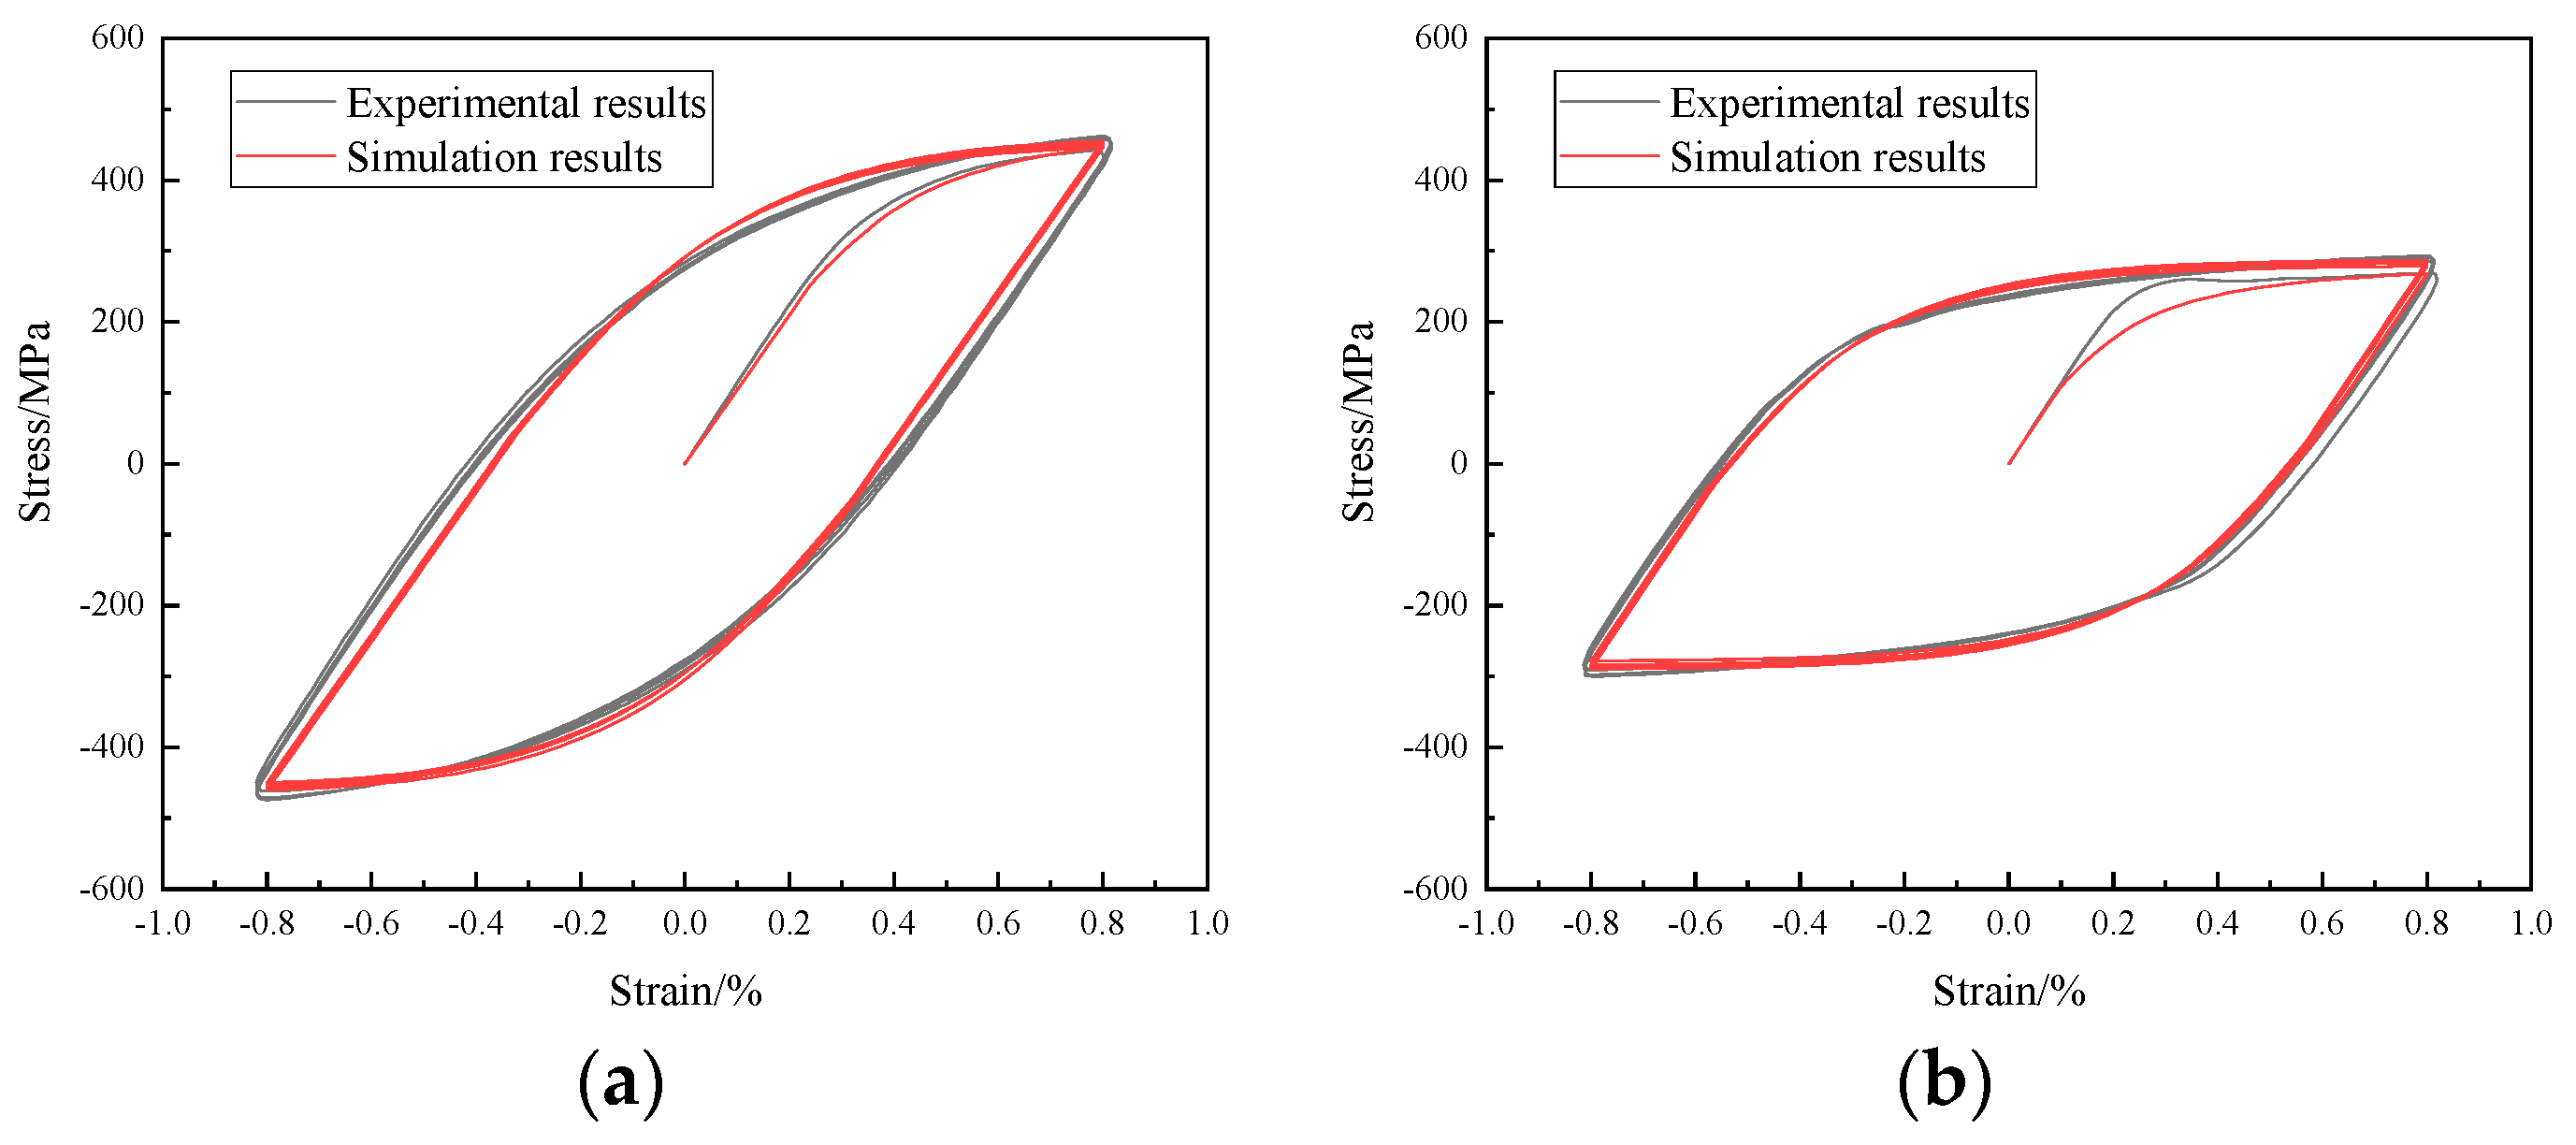
where σ0, N, Ck and γ k , and ε ¯ ˙ p l are the yield surface size, the number of back stresses, kinematic hardening parameters, and the equivalent plastic strain rate, respectively. According to uniaxial test results, the value of kinematic hardening parameters Ck and γ k can be obtained, as listed in Table 4. The isotropic hardening component can be incorporated by defining the equivalent stress, which determines the size of the yield surface (σ0), as a tabular function of the equivalent plastic strain ( ε ¯ p l ). The hysteresis loops simulated using the Chaboche model show good agreement with low cycle fatigue data at a strain amplitude of 0.8%, as shown in Figure 2. The time-dependent creep behavior is described by a power law, expressed as
ε ¯ ˙ c r = A q ˜ n m + 1 ε ¯ c r m 1 / m + 1
where ε ¯ ˙ c r , q ˜ , and ε ¯ c r denote the uniaxial equivalent creep strain rate, equivalent deviatoric stress, and equivalent creep strain, respectively. The values of different parameters obtained from the uniaxial creep experiments are also listed in Table 4.
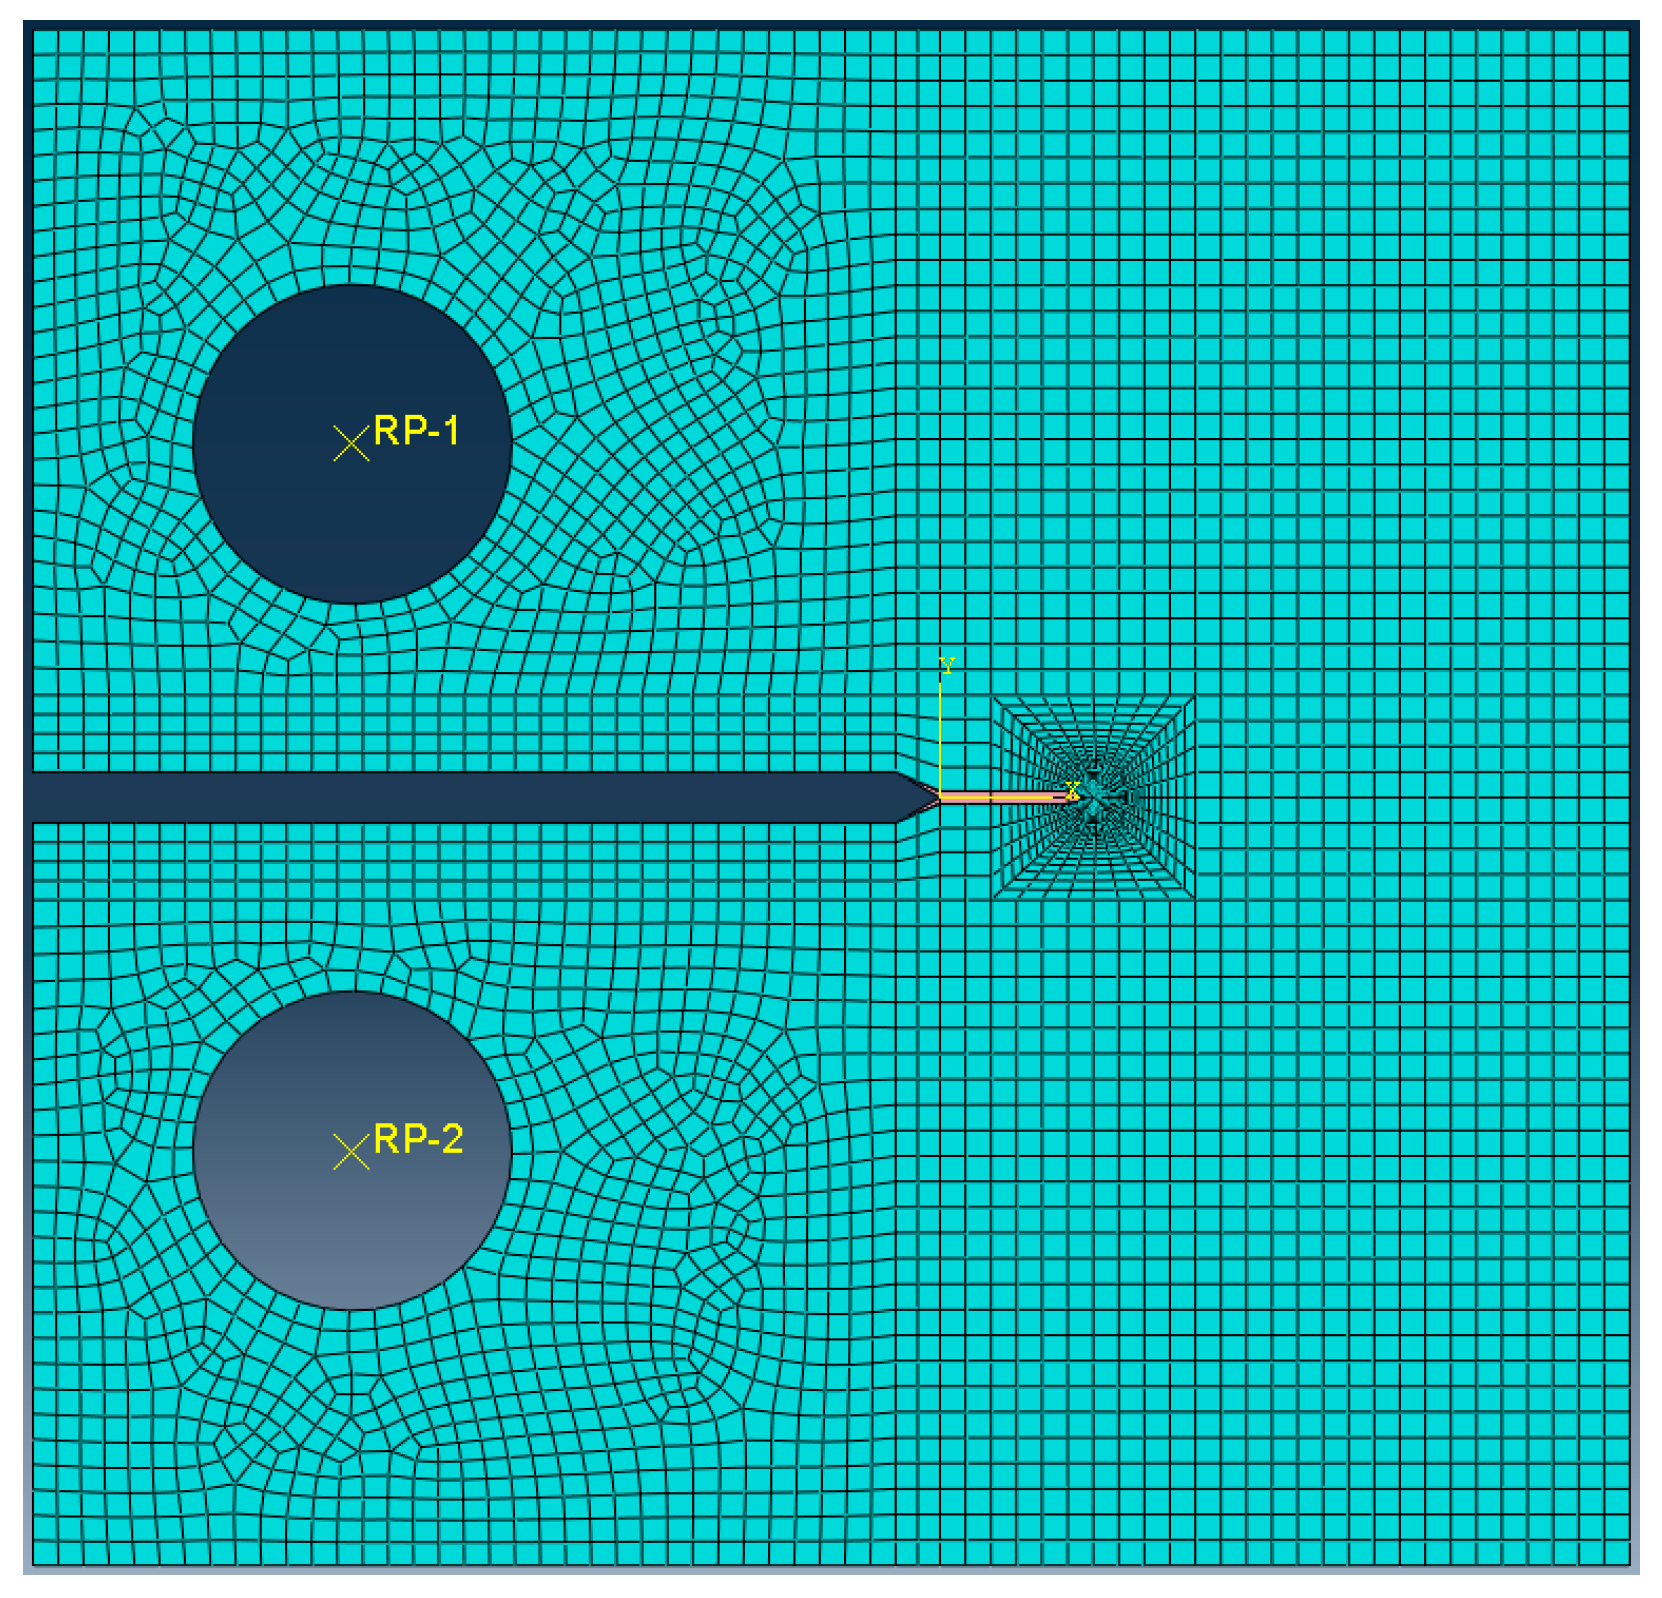
In order to carry out the cycle-by-cycle simulations, a finite element model of a standard CT specimen is created using the commercial finite element software ABAQUS, as shown in Figure 3. The meshing type is Continuum 4-noded plain strain element (CPE4R). The stress–strain gradient is imitated by refining the elements near the crack tip. The number of elements is 5535. In order to prevent hourglass modes, the enhanced hourglass control method is also used. As consistent with the test conditions, fixed constraint and cyclic load are applied in the top rigid pin and the bottom rigid pin, respectively.

3. Results

3.1. The Effect of Room-Temperature Dwell on FCG Behavior

3.1.1. FCG Rate Analysis at the Temperature of 25 °C

Figure 4 depicts the evolution of the FCG rate for a TA2 weld joint under different hold times and different load ratios. At a load ratio of 0.1, the FCG rate is increased by a room-temperature dwell in the near-threshold region, as shown in Figure 4a. A previous study found that the FCG rate could be significantly retarded by crack closure at a low load amplitude level [18]. Since creep relaxation can be generated by the application of dwell, the decreased crack closure effect accelerates FCG in the near-threshold region. In the stage of stable crack growth, room-temperature creep has little influence on the FCG rate. However, with the increase of crack length and stress level at the crack tip, room-temperature creep significantly increases the FCG rate in the later stage of crack growth. A similar variation trend of the FCG rate curve under the influence of room-temperature creep can be detected at a load ratio of 0.5, as shown in Figure 4b. At a high load ratio of 0.7, the promotion effect of room-temperature creep on the FCG rate is most significant, as shown in Figure 4c, which is manifested by the slightly increased FCG rate in the stage of stable crack growth and substantially increased FCG rate in the later stage of crack growth.
A schematic presentation of the creep–fatigue interaction under the combined influences of load ratio and load amplitude was proposed in our previous study [15]. According to the schematic of Figure 10 in reference [15], a simple analysis of the results in Figure 4 can be made. At the region of low load ratio and load amplitude, the crack growth is controlled by the fatigue process, exhibiting a weak dependence on creep. For instance, the stage of stable crack growth at load ratios of 0.1 and 0.5 can be regarded as a fatigue-dominated process. The impact of creep on the FCG rate becomes apparent with the increase in crack length due to the gradually increased stress level at the crack tip. At this condition, the FCG behavior is controlled by the interaction of fatigue and creep. Therefore, with the propagation of fatigue crack, the FCG rate is increased by creep at the higher ΔK region (i.e., the later stage of crack growth). Similarly, the increased load ratio also leads the FCG progress into the fatigue–creep interaction region, which enhances the effect of creep on the FCG rate. Consequently, the promotion effect of creep on the FCG rate is more remarkable at a load ratio of 0.7. For α-Ti, it has been found that its creep behavior shows stress dependence. At a higher stress level, the creep effect is more significant [17]. Compared with the TA2 base metal, the coarse lamellar structure, as well as the needle-shaped martensite in the microstructure of its weld joint, impede the activation of dislocation slip or twinning, leading to the decreased creep effect [21]. Consequently, the application of dwell at a low load ratio and load amplitude shows little influence on the FCG behavior, while a significant effect can be observed at a high load ratio and load amplitude due to the increased creep effect.

3.1.2. FEM Results Analysis at a Temperature of 25 °C

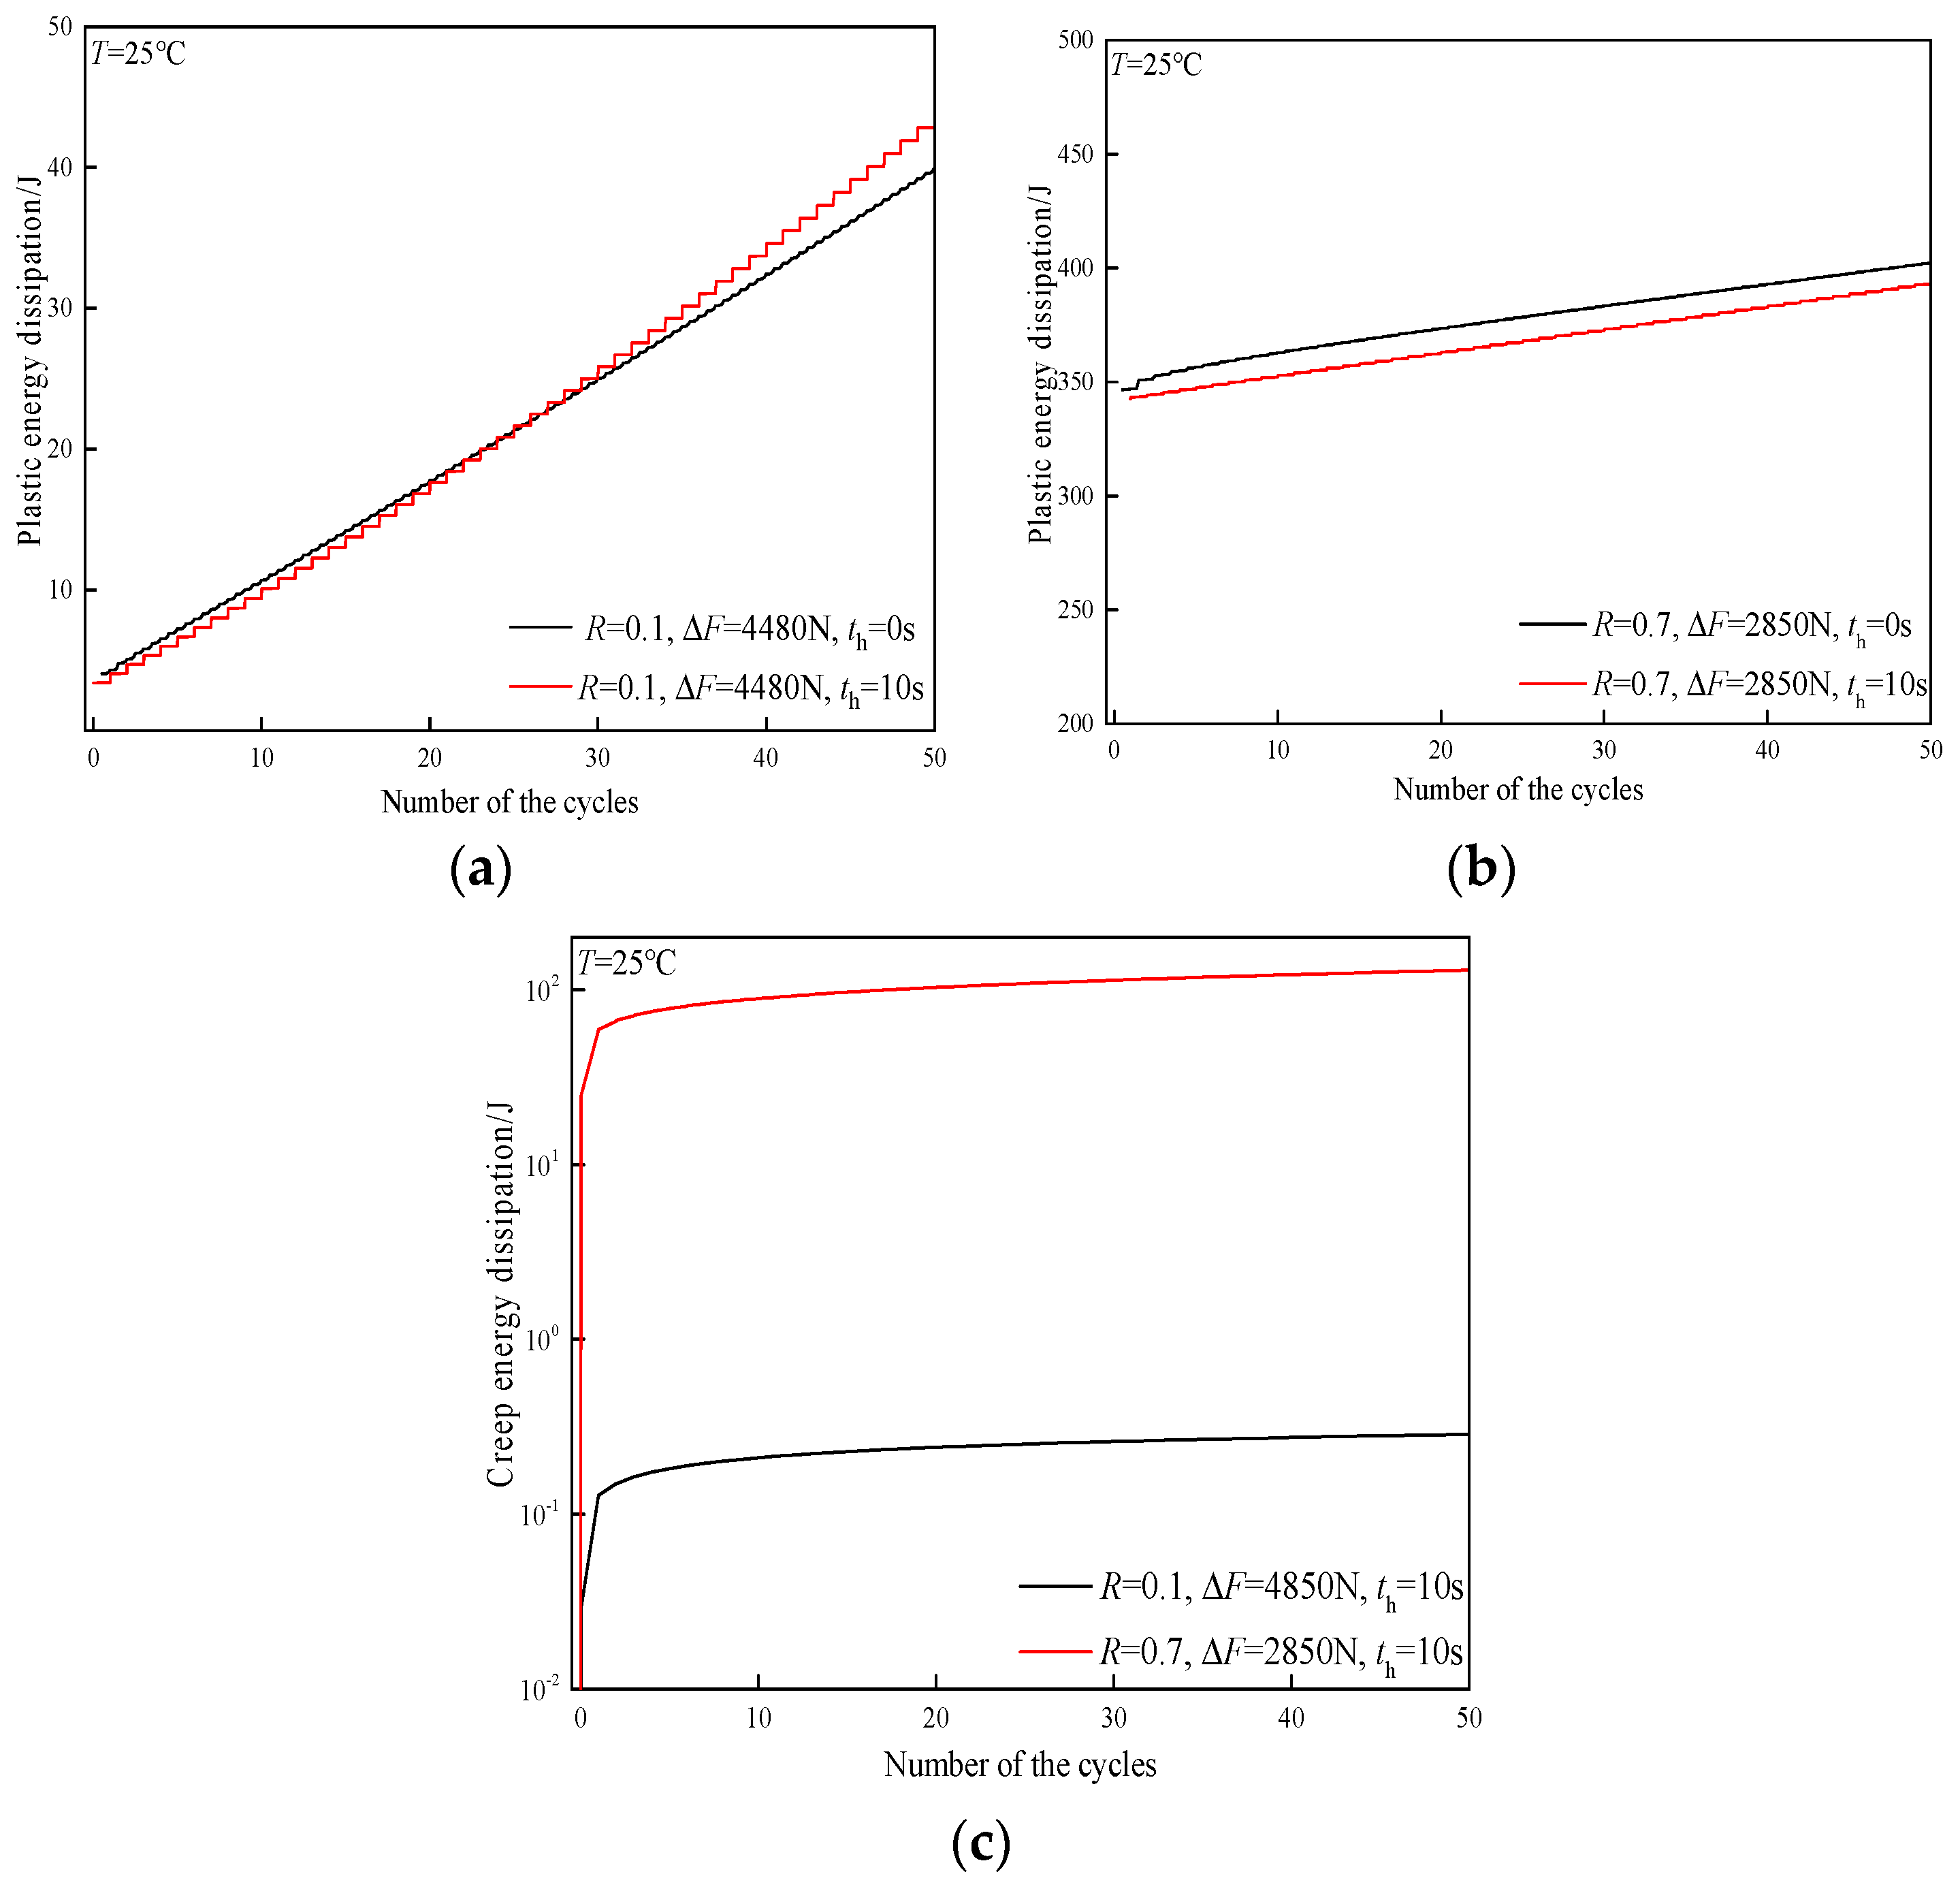
It has been reported that the FCG rate is dependent on the cumulative change of the strain energy at the net section of the specimen, which is related to the change of cyclic work at the end of the loading [22]. According to the FEM results of the strain energy analysis, Figure 5 shows the variation of different strain energy components for the TA2 weld joint under different load ratios R and hold times th, which is useful for evaluating creep–fatigue interaction during FCG progress. In Figure 5a,b, there is little difference between plastic strain energy under the dwell of 10 s and that without dwell. In Figure 5c, creep strain energy at a load ratio of 0.7 is much higher than that at a load ratio of 0.1. At a load ratio of 0.1, compared to plastic strain energy, creep strain energy is negligible, as its value is two orders of magnitude lower than that of plastic strain energy. Therefore, the application of dwell at a low load ratio shows little effect on the FCG rate in the stage of stable crack growth. In contrast to this, the value of creep strain energy shows a significant increase at a load ratio of 0.7, which will have a certain effect on the FCG behavior of the TA2 weld joint. However, considering that the value of creep strain energy at a load ratio of 0.7 is still much lower than that of plastic strain energy, the effect of room-temperature creep on the FCG rate should be limited, as shown in Figure 4c. With the assistance of the digital image correlation (DIC) characterization method, it was found that the accumulated creep strain of the TA2 weldment is limited at room temperature and is much lower than that of TA2 base metal [21]. Thus, it is reasonable that room-temperature creep has a limited effect on the FCG behavior of the TA2 weld joint, which is also evidence of a relatively low proportion of creep strain energy. From this perspective, the contribution of room-temperature creep to FCG is limited. According to the result in Figure 4, the impact of room-temperature creep on the FCG rate is indeed rather limited, as room-temperature creep only slightly increases the FCG rate in the stage of stable crack growth at the highest load ratio.
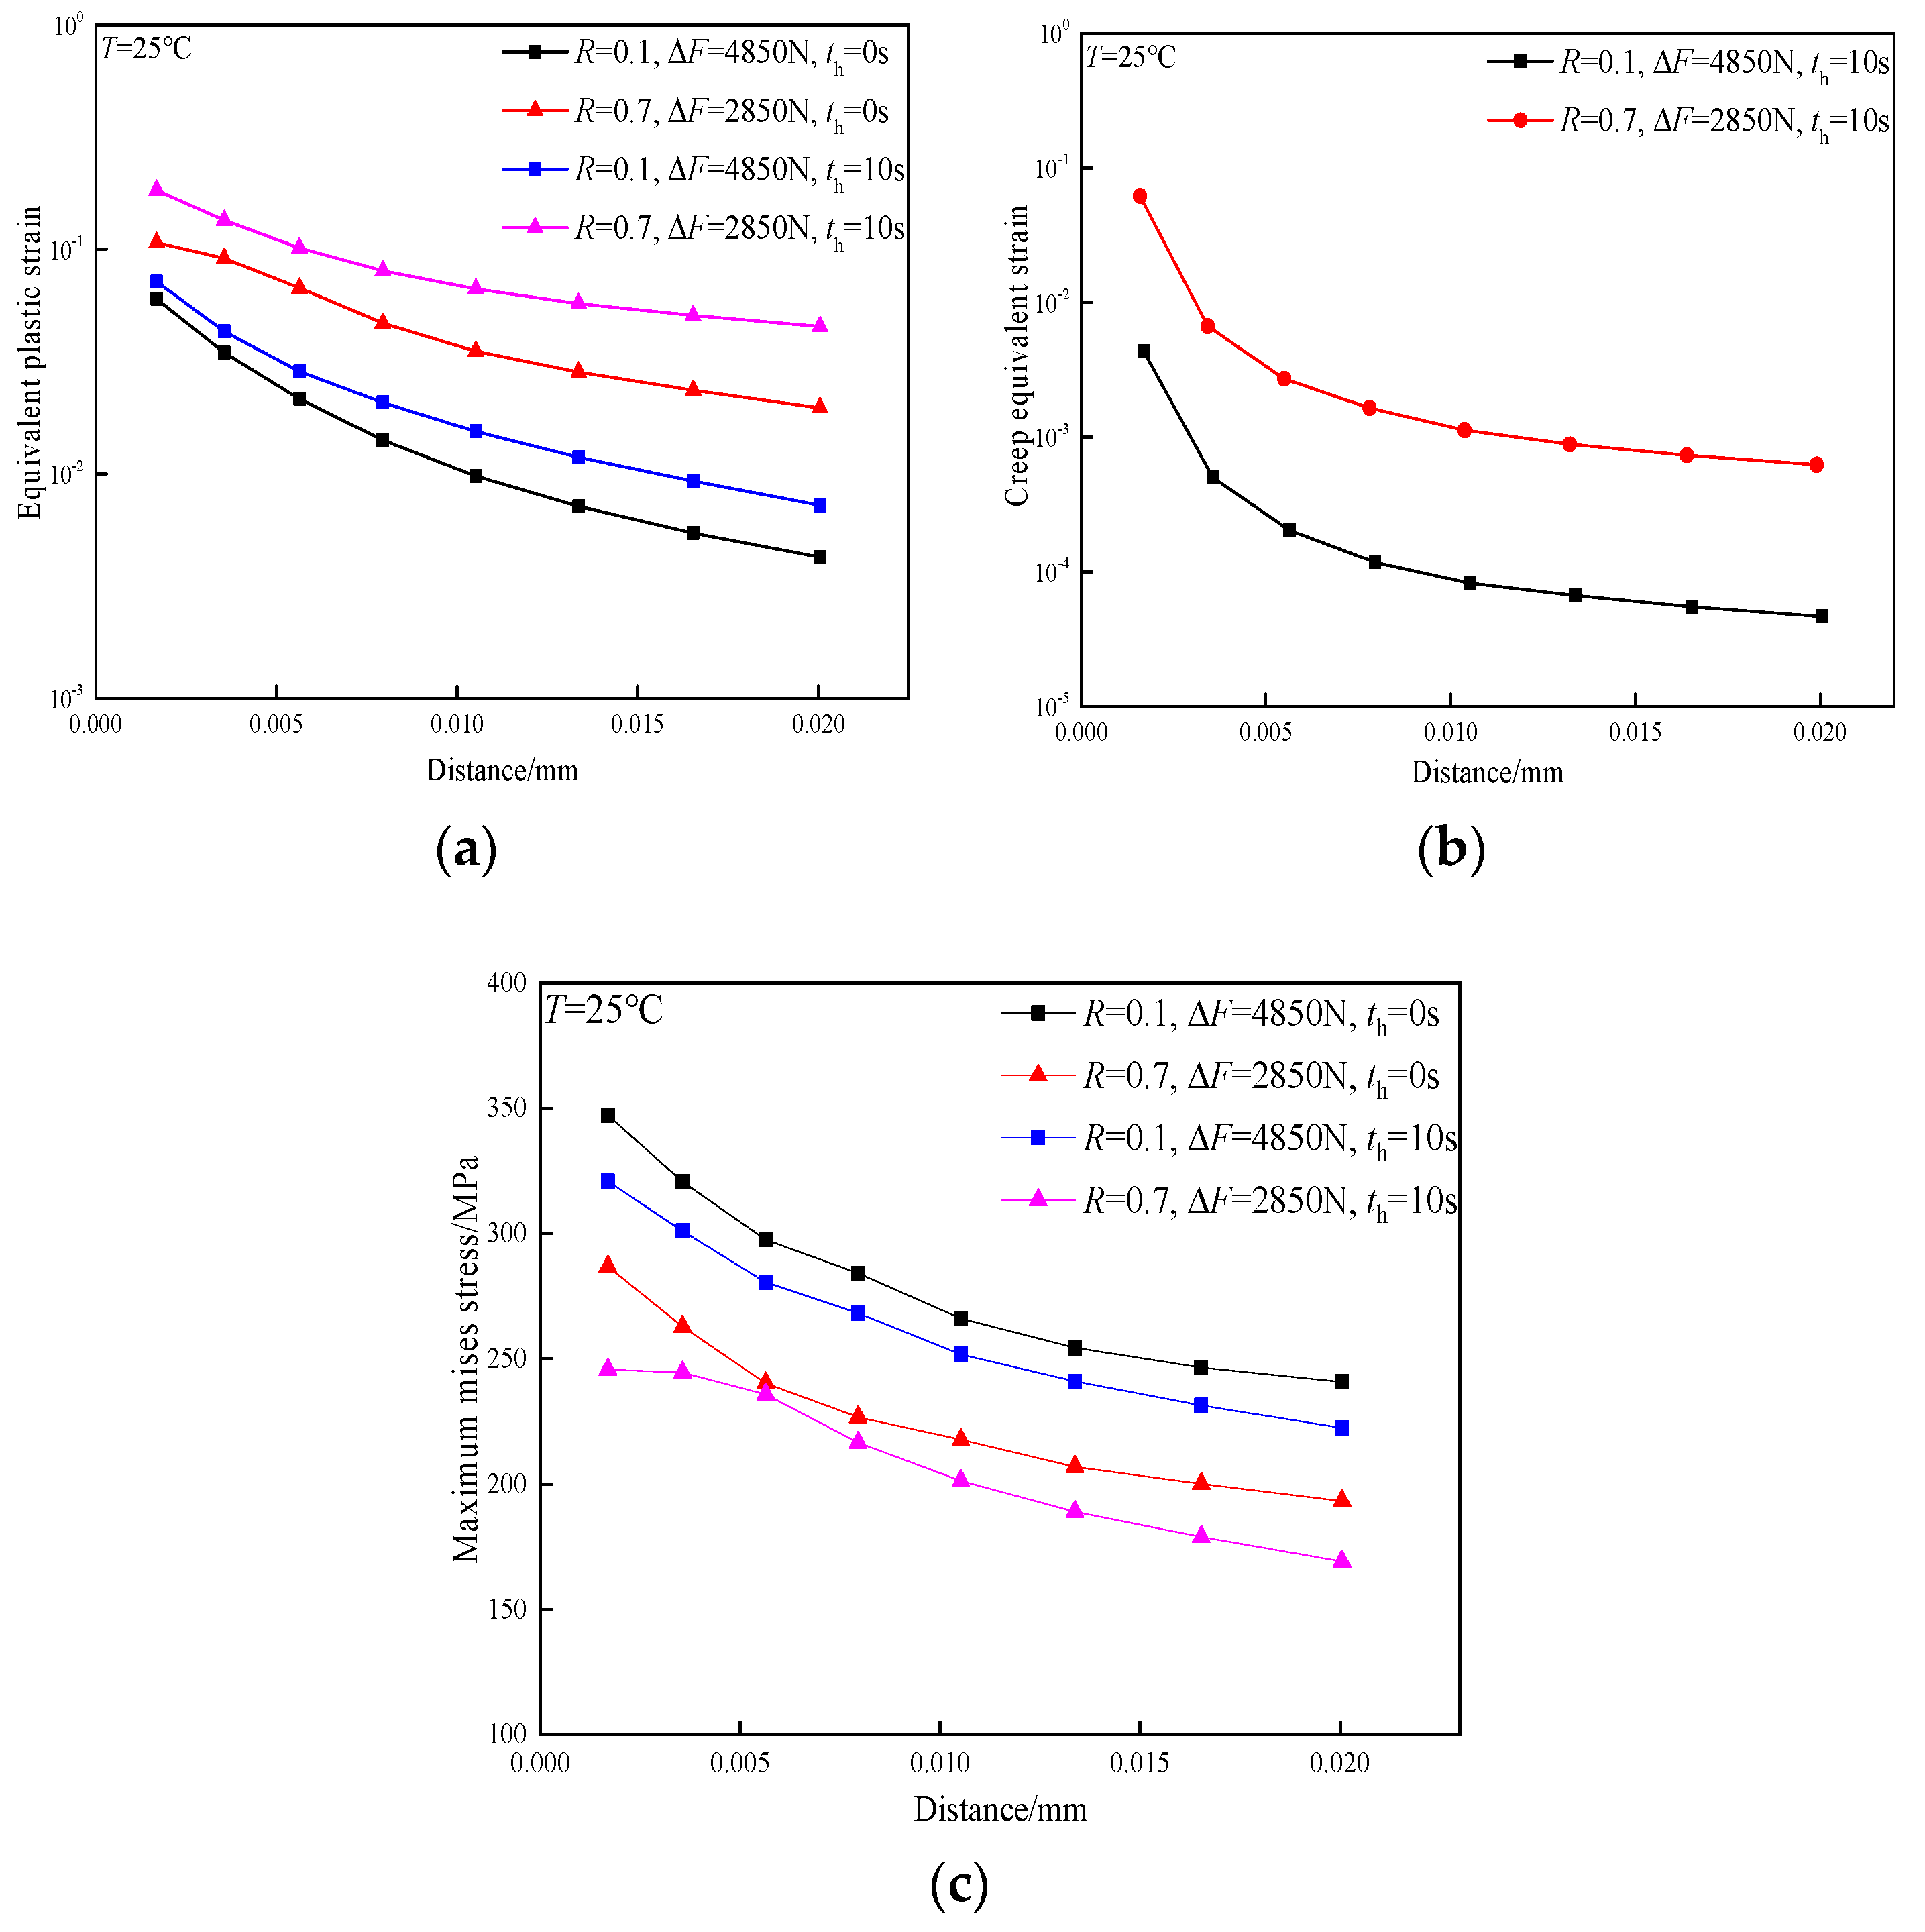
In order to investigate the role of room-temperature creep on the FCG behavior of the TA2 weld joint, the strain and stress distributions ahead of the crack tip after 50 cycles are plotted in Figure 6. According to the variation of Mises stress in Figure 6c, it can be found that the stress level around the crack tip is decreased by creep stress relaxation at load ratios of 0.1 and 0.7. Figure 6a shows the distribution of equivalent plastic strain near the crack tip, from which it can be observed that although creep stress relaxation occurs, equivalent plastic strain is increased under the loading condition of dwell because of the facilitating effect of creep on the plastic deformation of the crack tip. Figure 6b shows the distribution of creep strain near the crack tip. At a low load ratio of 0.1, the value of creep strain is quite small, which has little impact on crack growth. As the load ratio increases to 0.7, creep strain increases significantly. At this condition, the facilitating effect of room-temperature creep on FCG behavior cannot be ignored.

3.2. The Effect of Dwell at 200 °C on FCG Behavior

3.2.1. FCG Rate Analysis at the Temperature of 200 °C

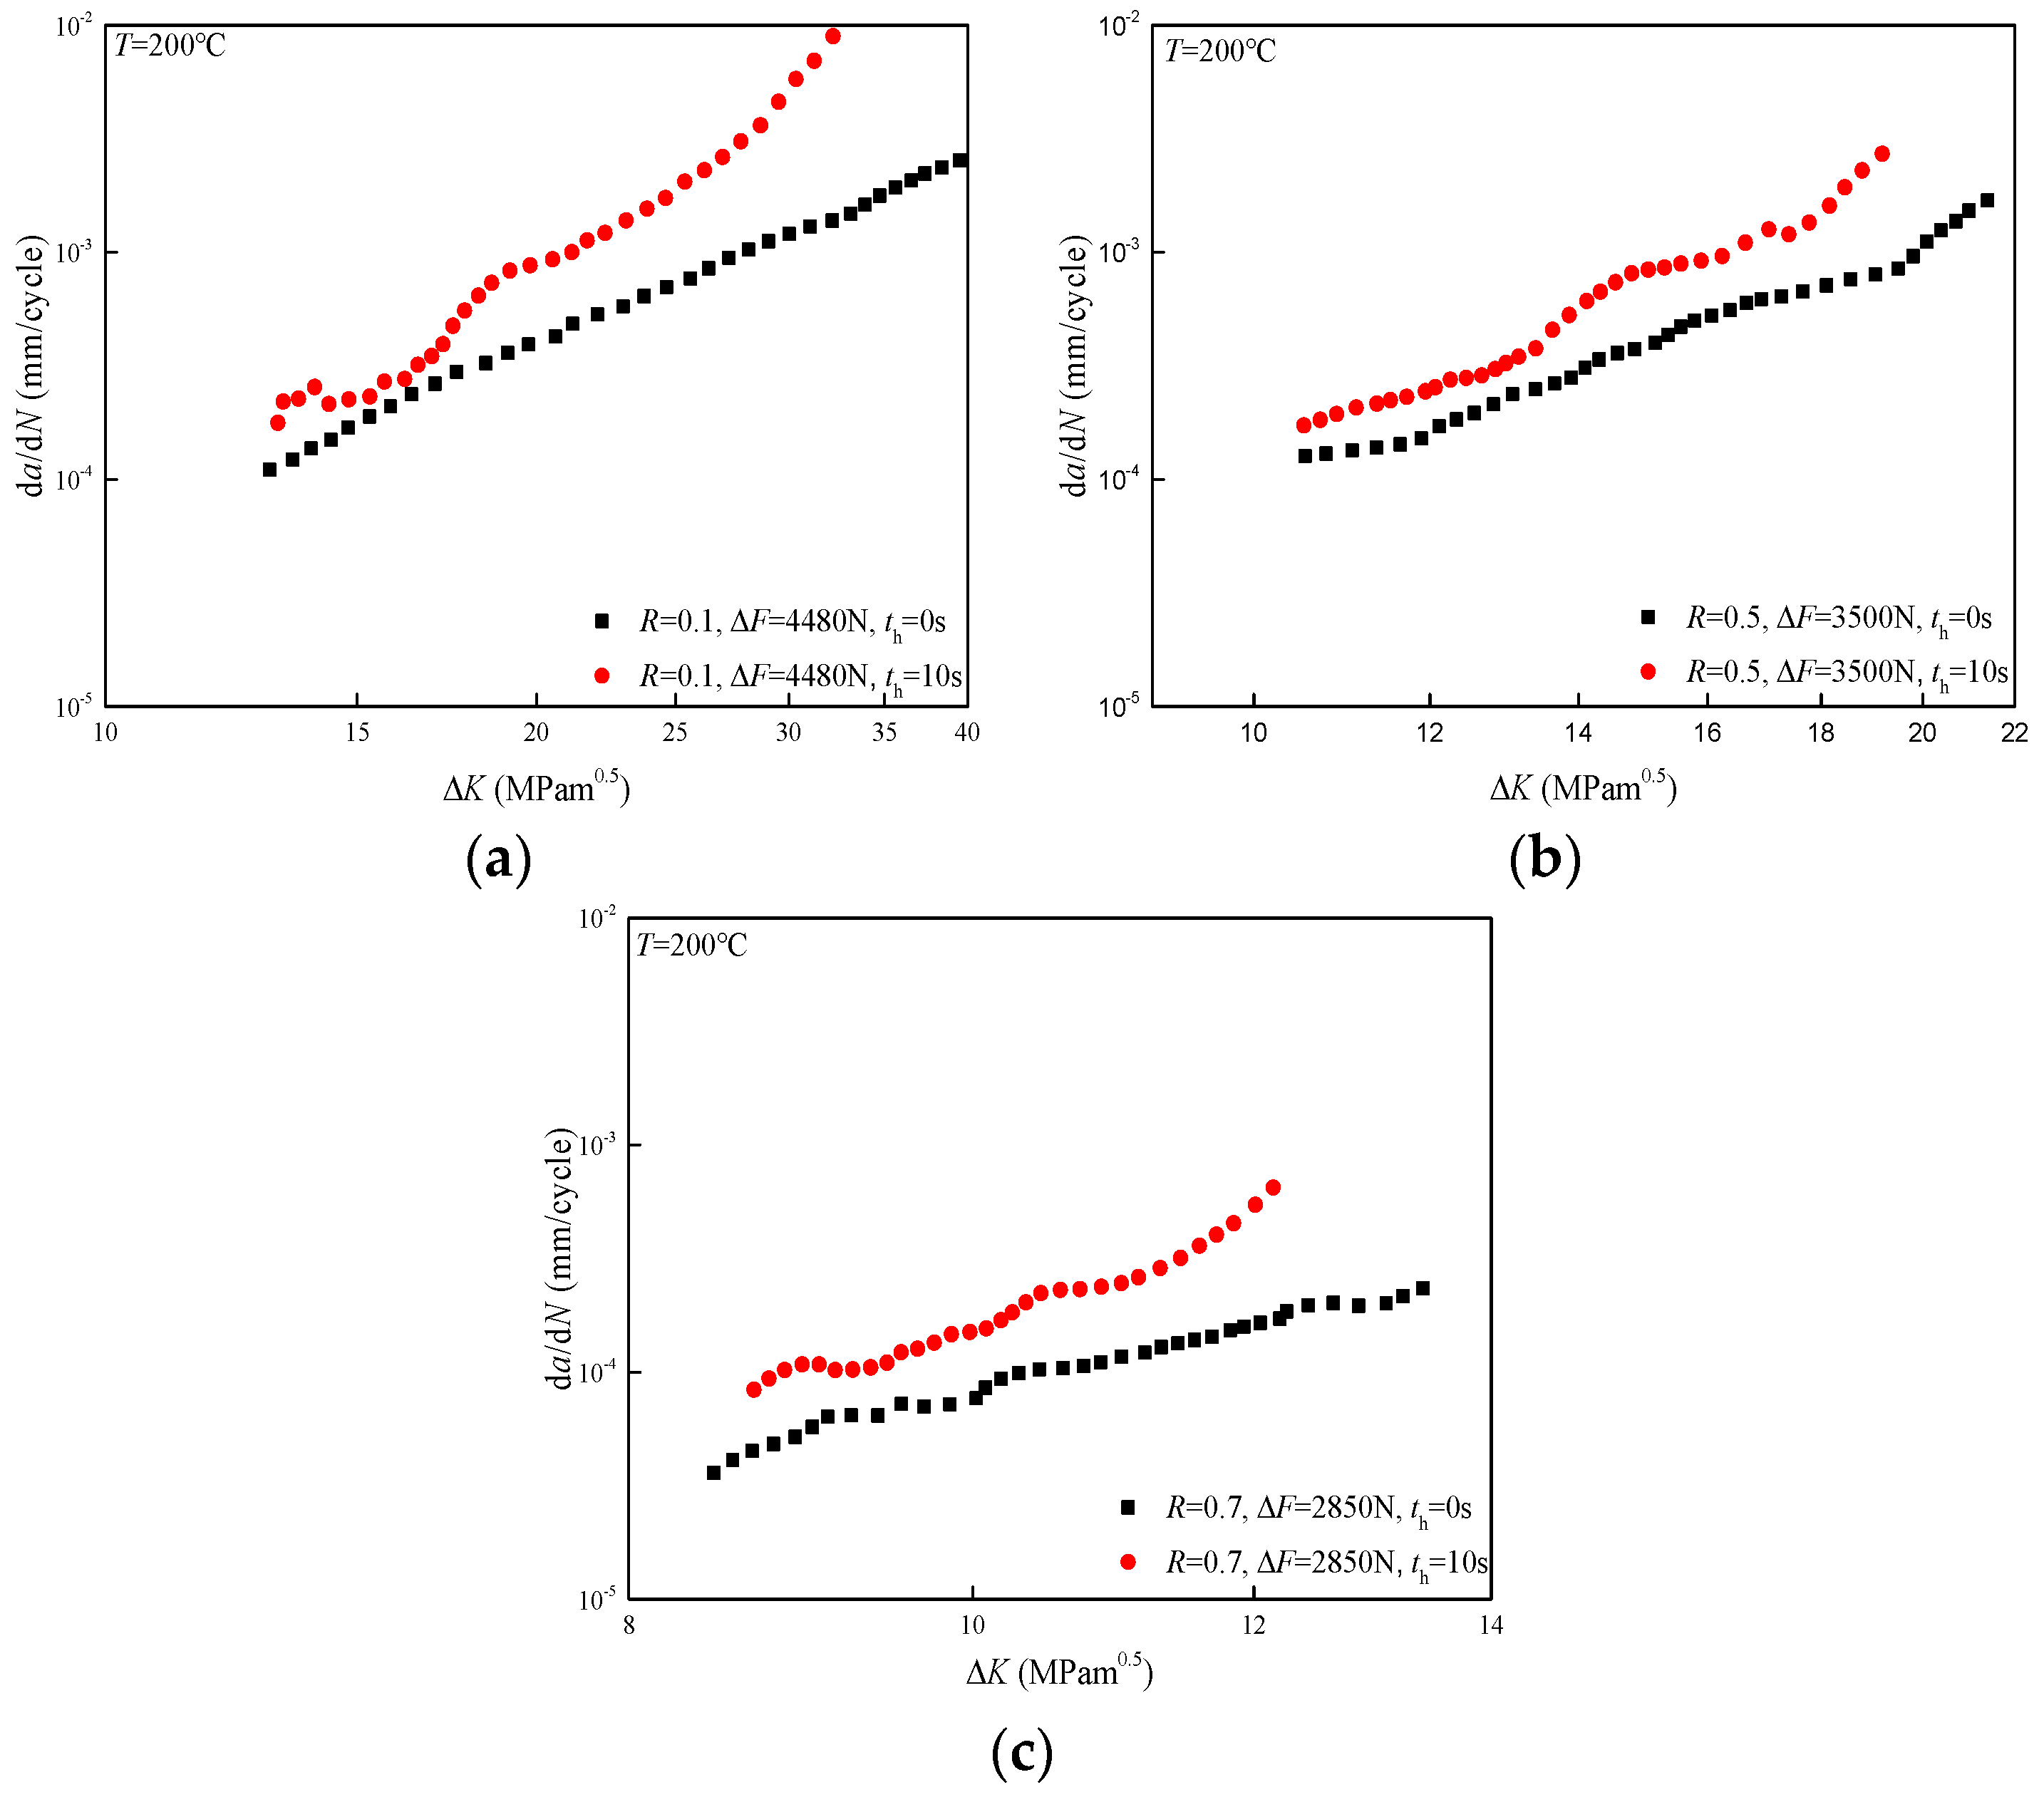
At a temperature of 200 °C, creep significantly promotes fatigue crack propagation at different load ratios, leading to a more prominent dwell sensitivity than that at room temperature, as shown in Figure 7a–c. In addition, the promotion effect of creep on the FCG rate is more prominent at higher load ratios. With the propagation of the FCG behavior, the stress level near the crack tip increases, leading to a more significant effect of creep on the FCG rate in the later stage, which is consistent with the result in Figure 4. The medium-low–temperature creep behavior of α titanium is dependent on the applied stress level and temperature [17,23], as the increase in temperature and stress level is beneficial for the cumulation of creep strain. With the increase in temperature, the threshold stress for the activation of dislocation slip decreases [23], which facilitates the generation of creep deformation, leading to a more significant creep effect in the TA2 weld joint at 200 °C.

3.2.2. FEM Results Analysis at the Temperature of 200 °C

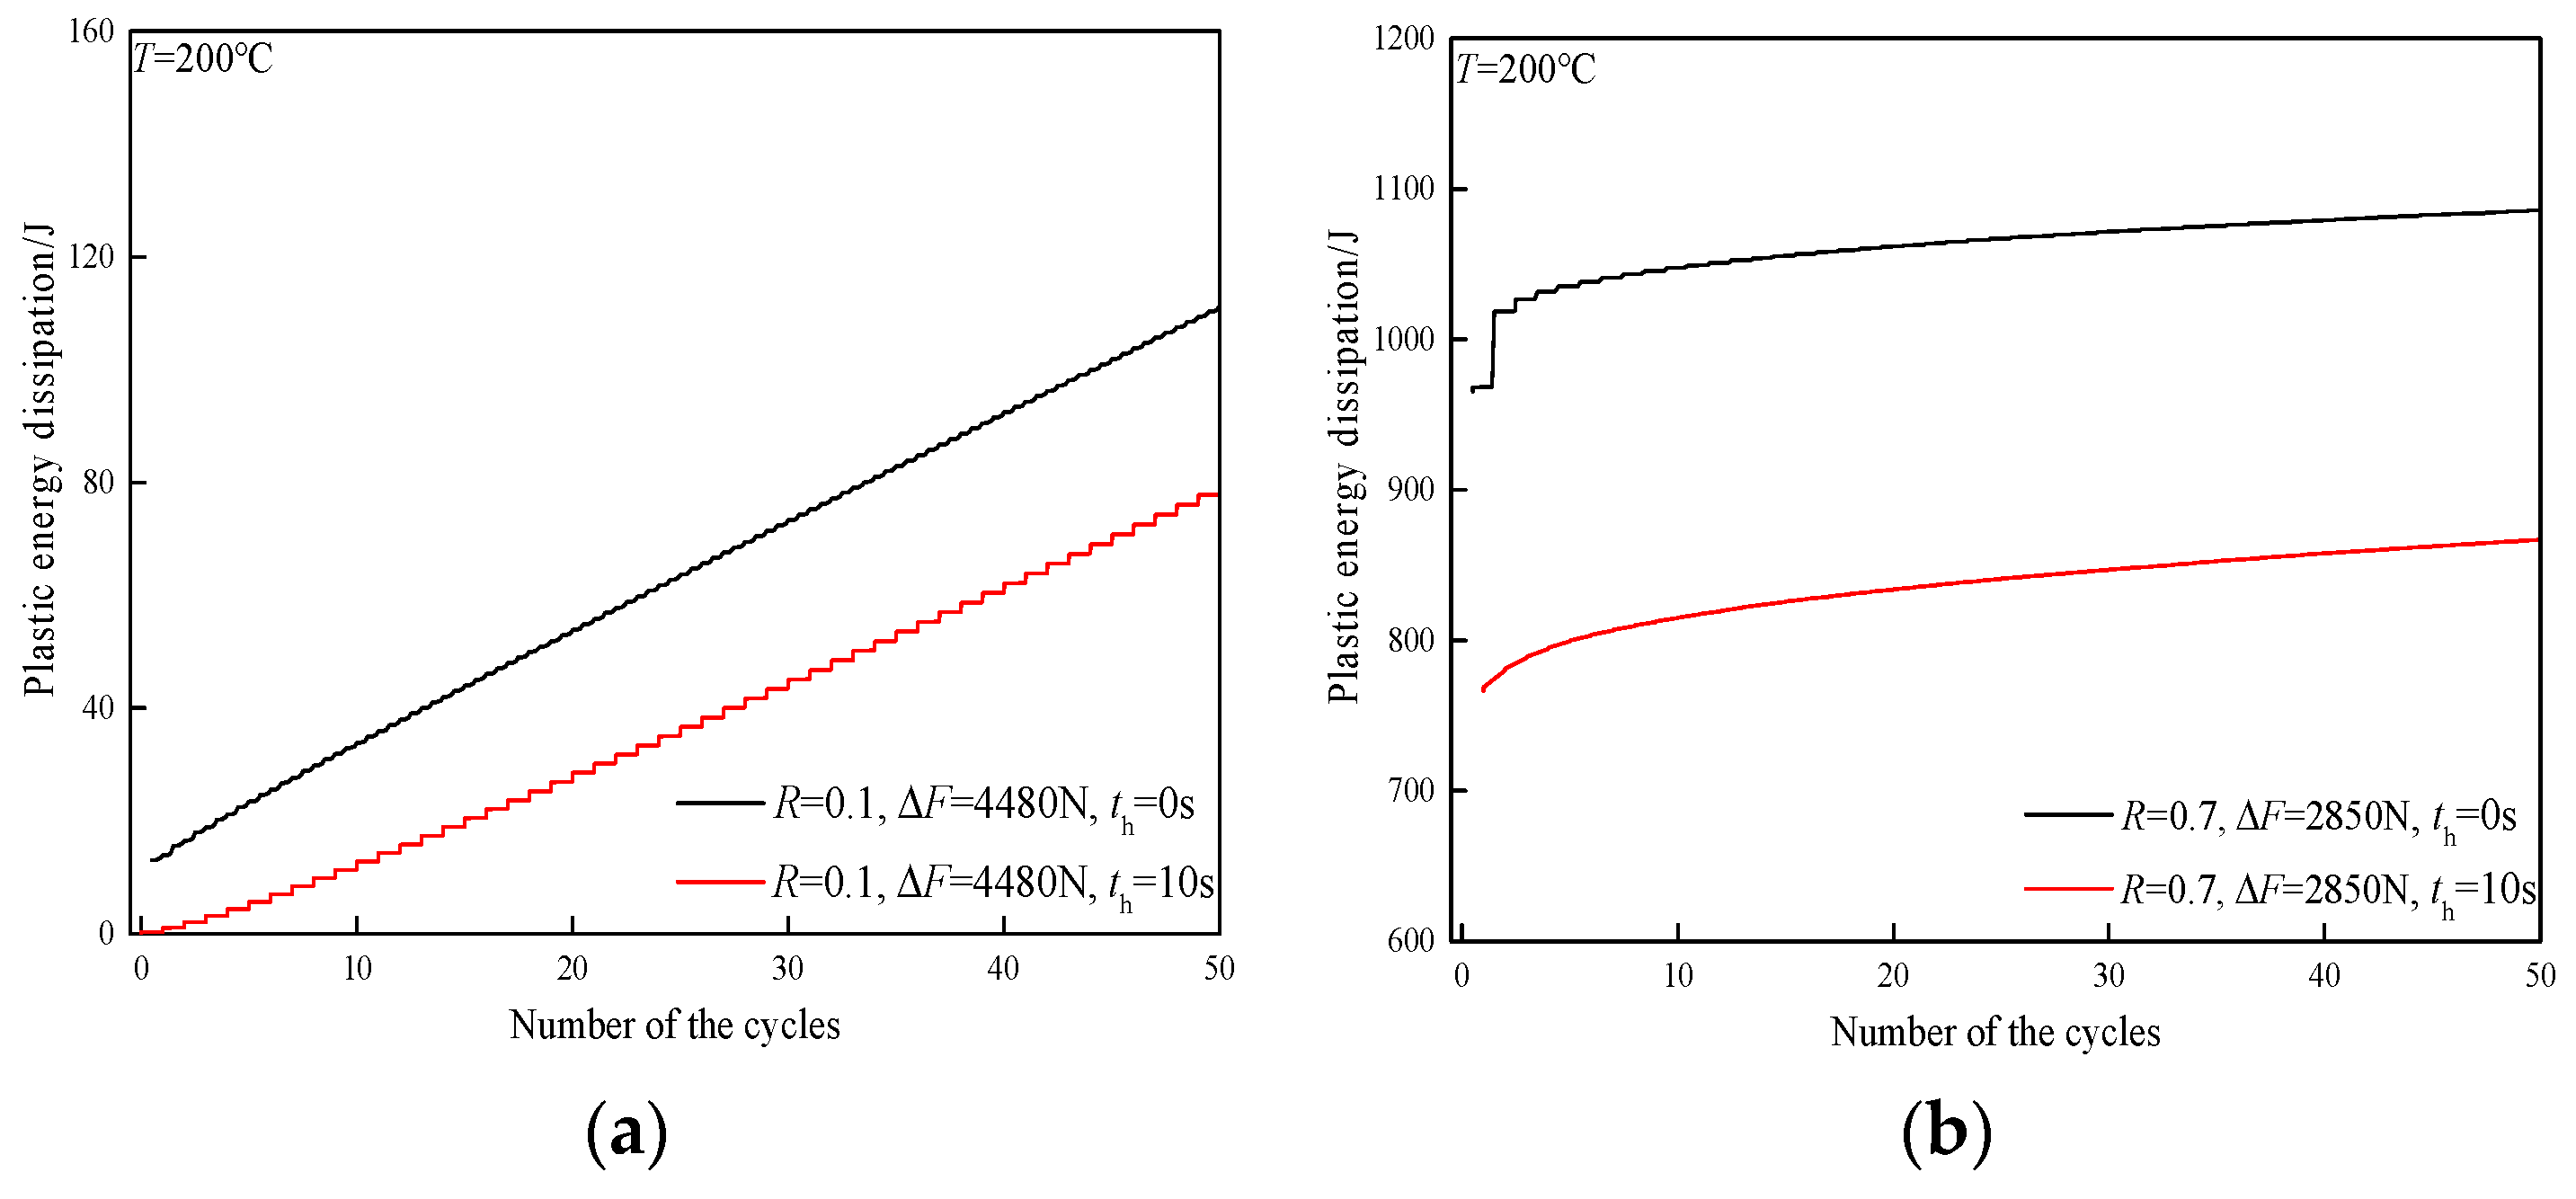
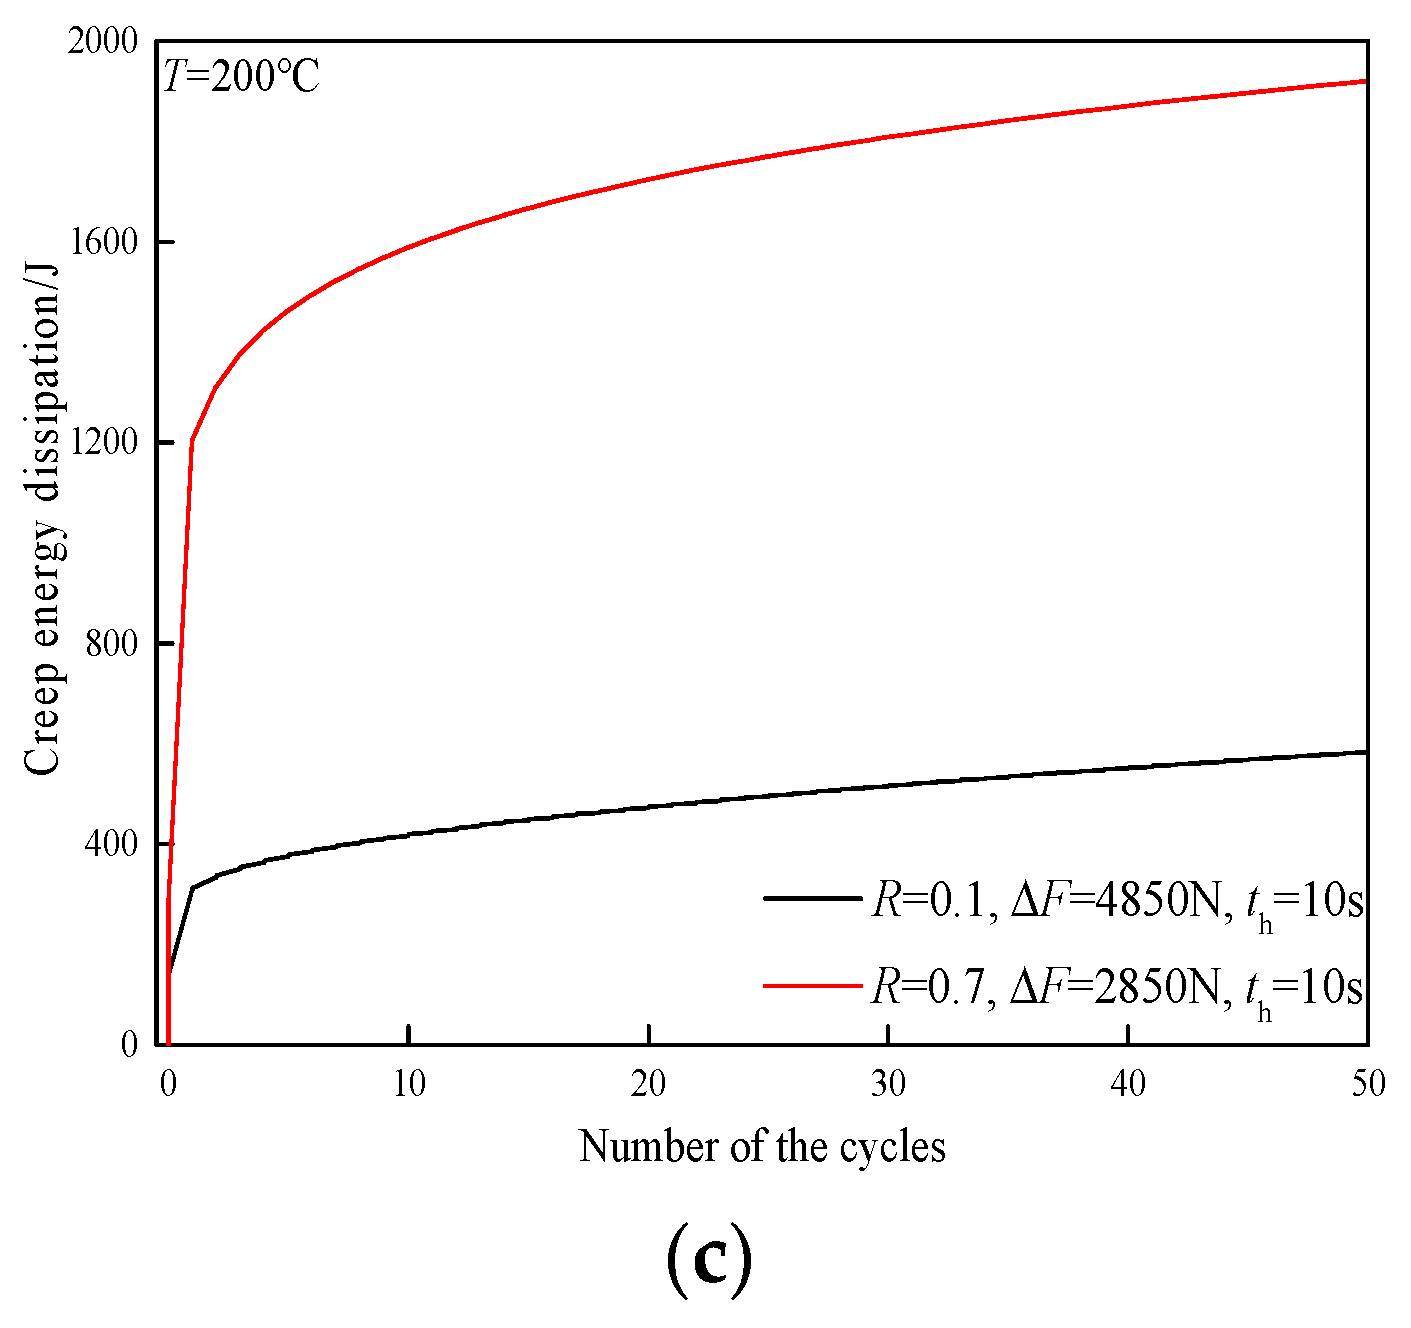
Figure 8 shows the variation of different strain energy components for the TA2 weld joint at a temperature of 200 °C. At this temperature, plastic strain energy is decreased by the prominent creep effect at different load ratios, as shown in Figure 8a,b. Creep strain energy in Figure 8c is much higher than plastic strain energy, indicating that the FCG behavior at this condition is mainly controlled by creep. As a result, the FCG rate can be significantly increased by creep at a temperature of 200 °C.
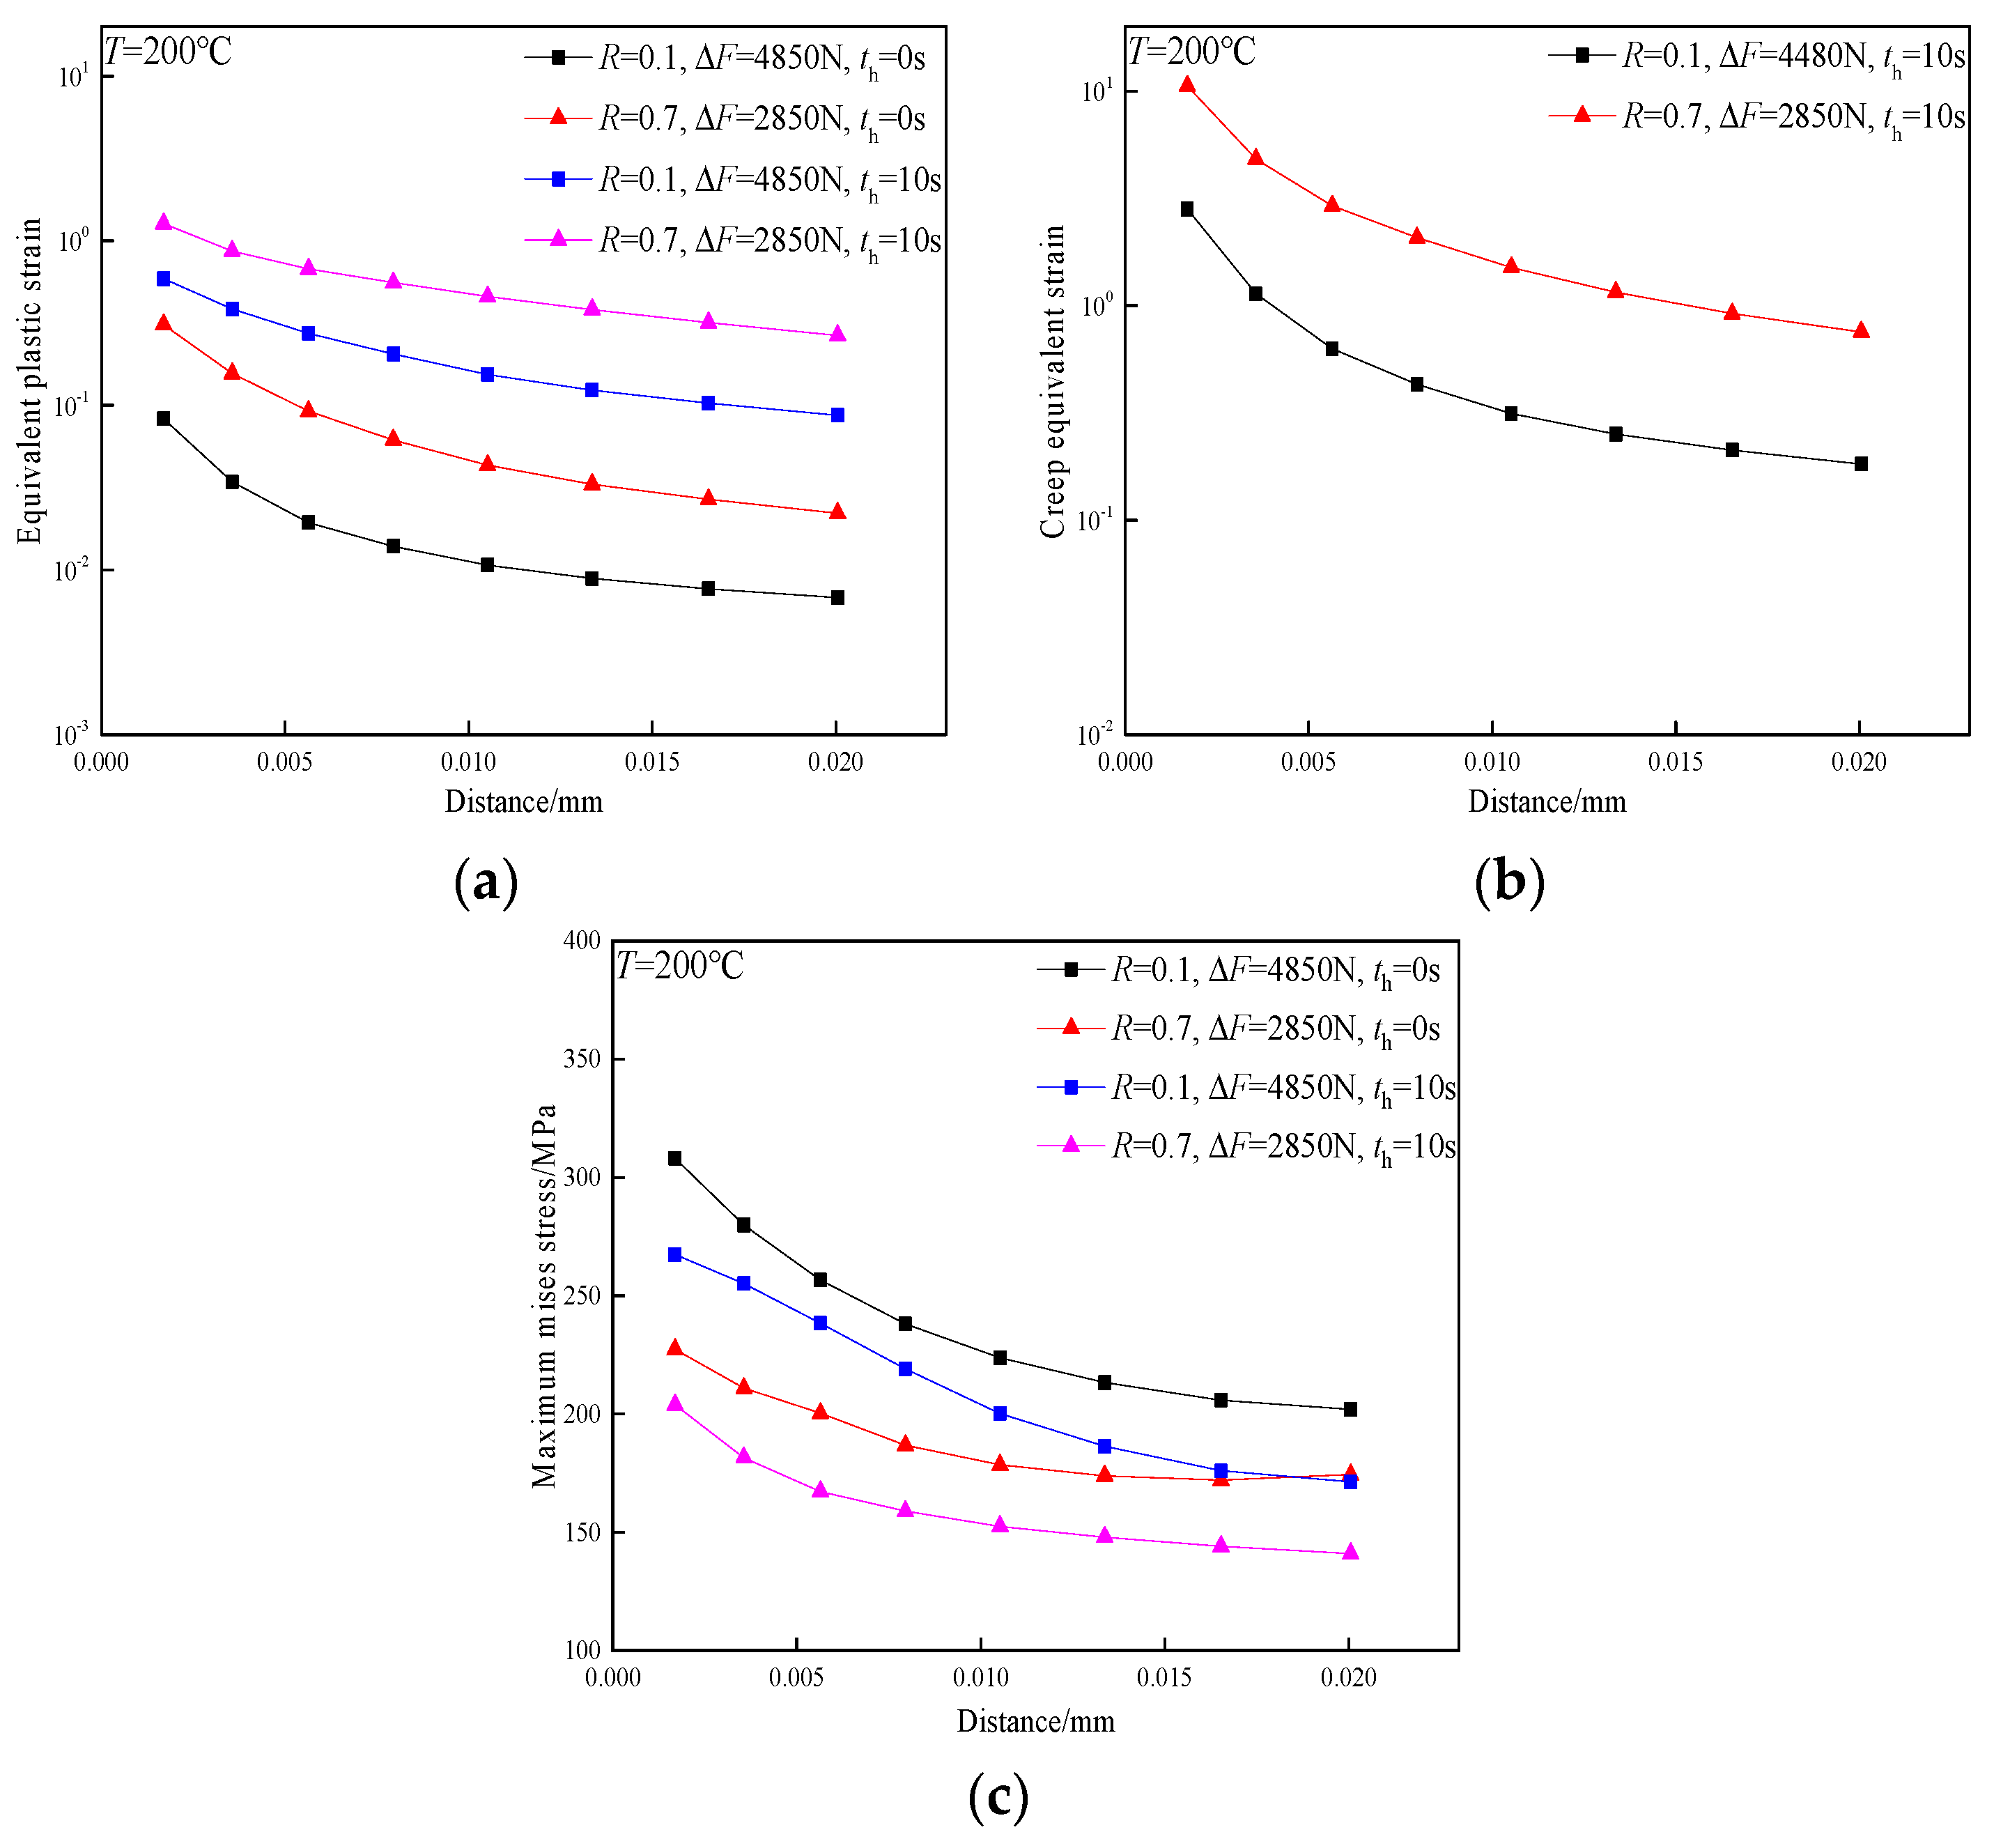
In order to further investigate the role of creep and fatigue during crack growth, Figure 9 shows the evolution of stress and strain near the crack tip of the TA2 weld joint. In Figure 9a, the increased equivalent plastic strain under the dwell condition promotes crack growth, although stress relaxation in Figure 9c caused by creep may reduce stress concentration in front of the crack tip. Moreover, the accumulation of creep strain in Figure 9b is more significant than plastic strain in Figure 9a, which confirms the dominant role of creep on the FCG behavior under the condition of dwell at 200 °C. Thus, the FCG rate can be significantly accelerated by additional creep deformation at 200 °C.

3.3. Fracture Surface Analysis

3.3.1. SEM Study at the Temperature of 25 °C

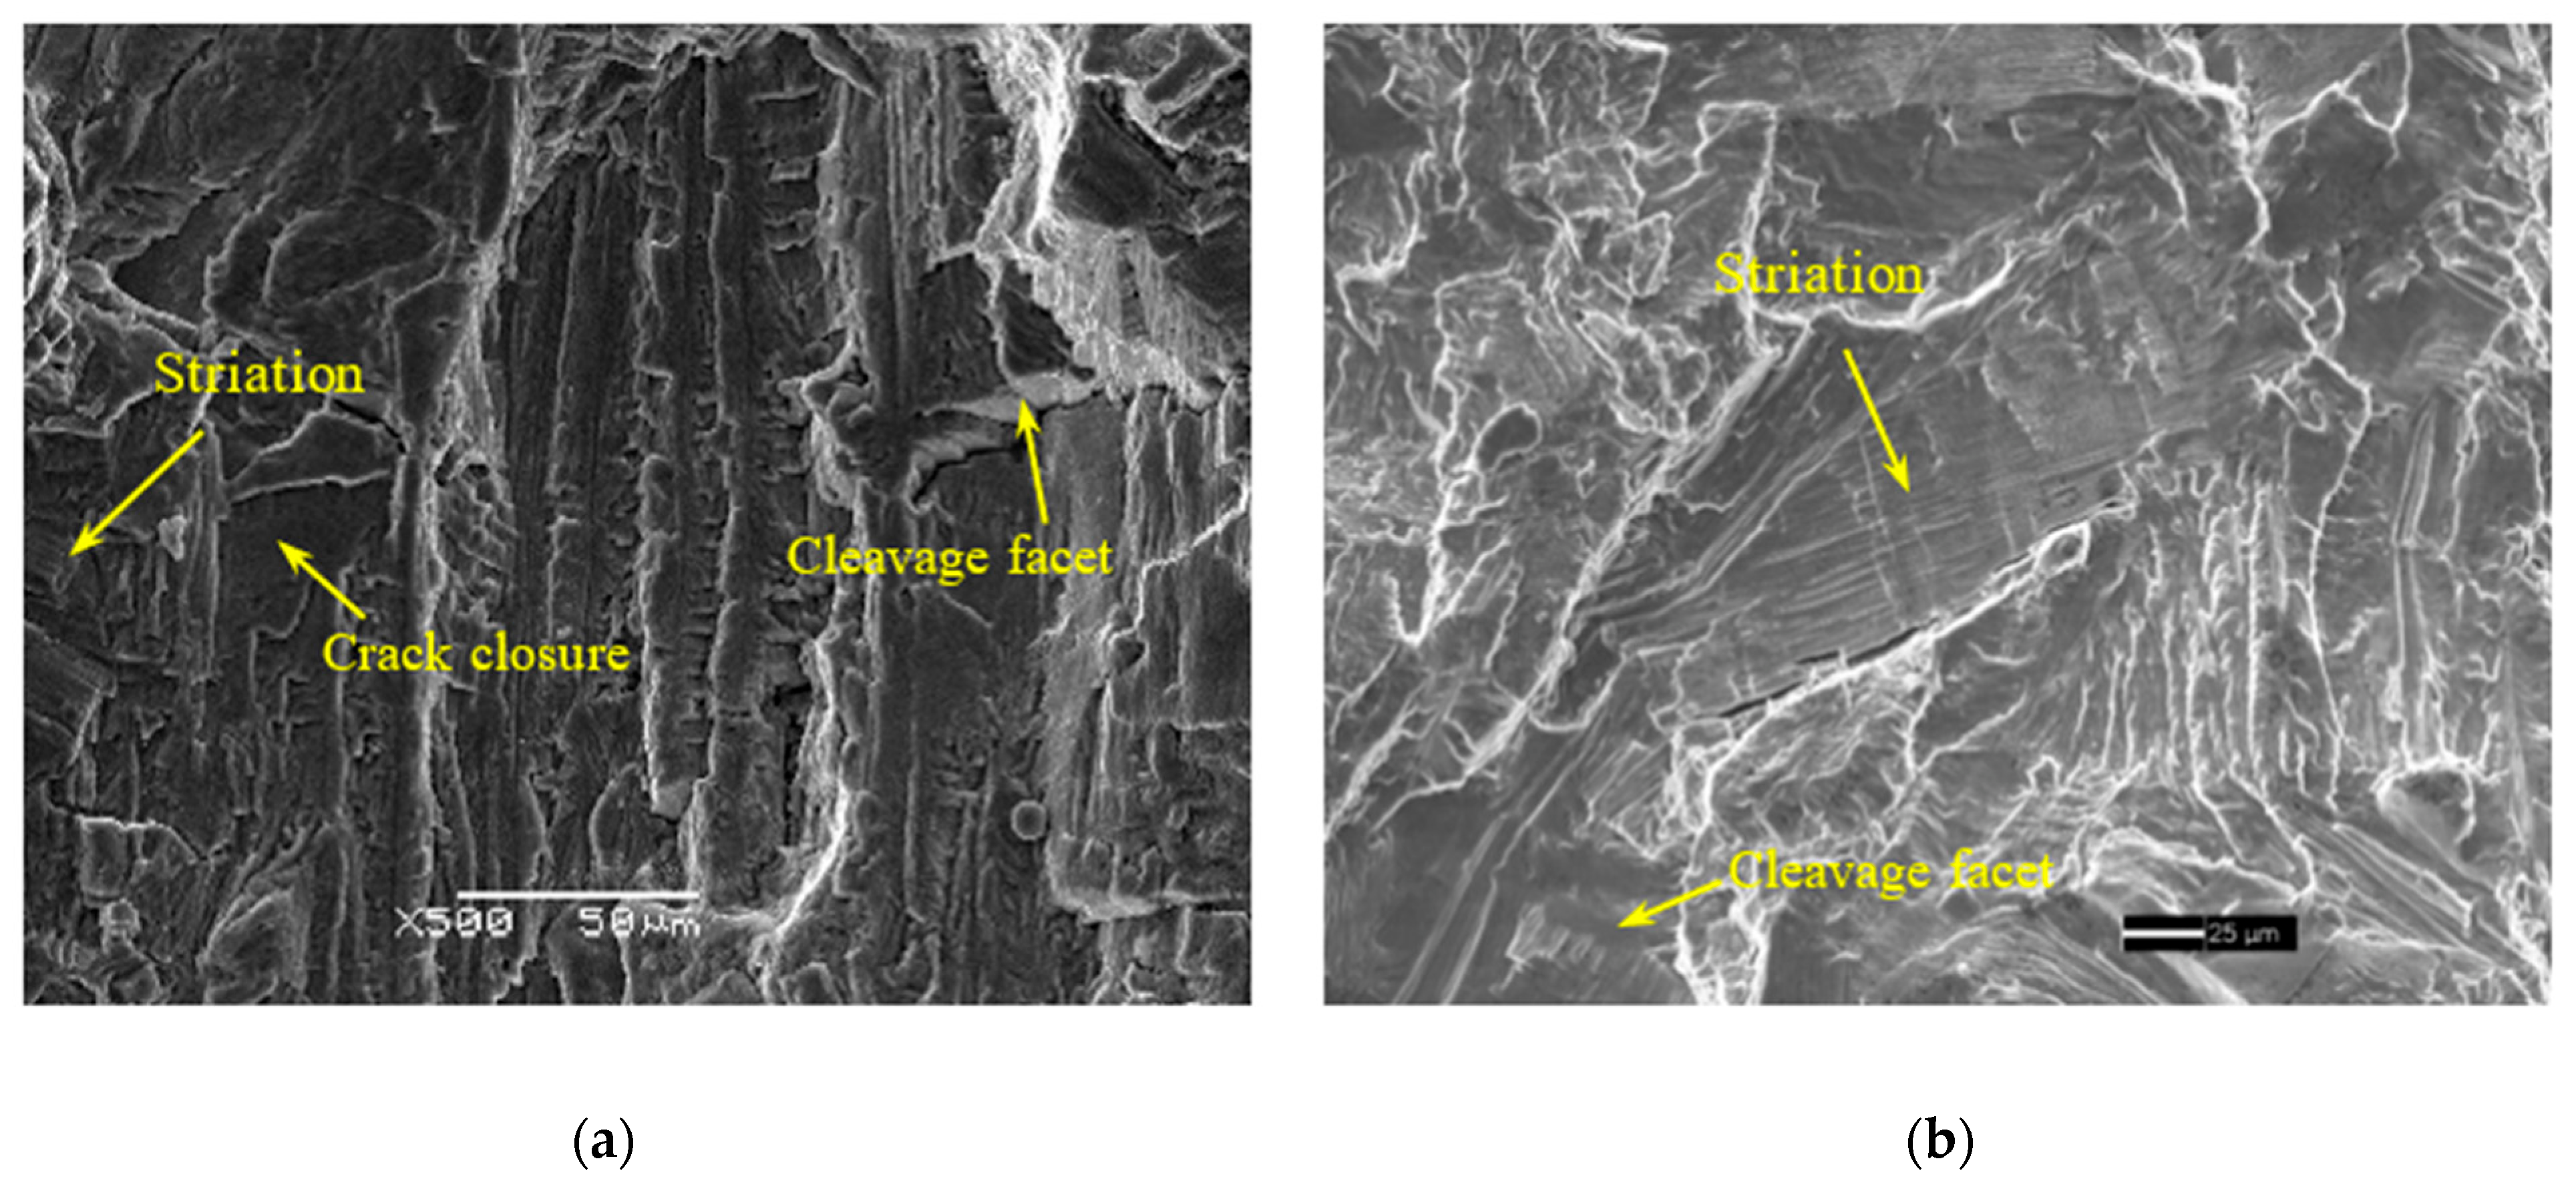
Figure 10 shows the fracture surface for specimens with and without room-temperature dwell at the load ratio of 0.1. In Figure 10a, smeared fracture features resulting from crack closure can be observed, which disappear at the loading condition of room-temperature dwell. The absence of a crack closure feature in Figure 10b is due to the application of dwell at the maximum load, which is effective in avoiding crack closure. As a consequence, the FCG rate can be increased by room-temperature creep in the near-threshold stage, as already shown in Figure 4. Except for this, other features displayed in the fracture surfaces with and without dwell are similar, which can be characterized by massive fatigue striations and few cleavage facets, exhibiting fatigue characteristics of linear elastic fracture. Therefore, the application of dwell at a load ratio of 0.1 and a temperature of 20 °C has little influence on the FCG rate in the stage of stable crack growth.
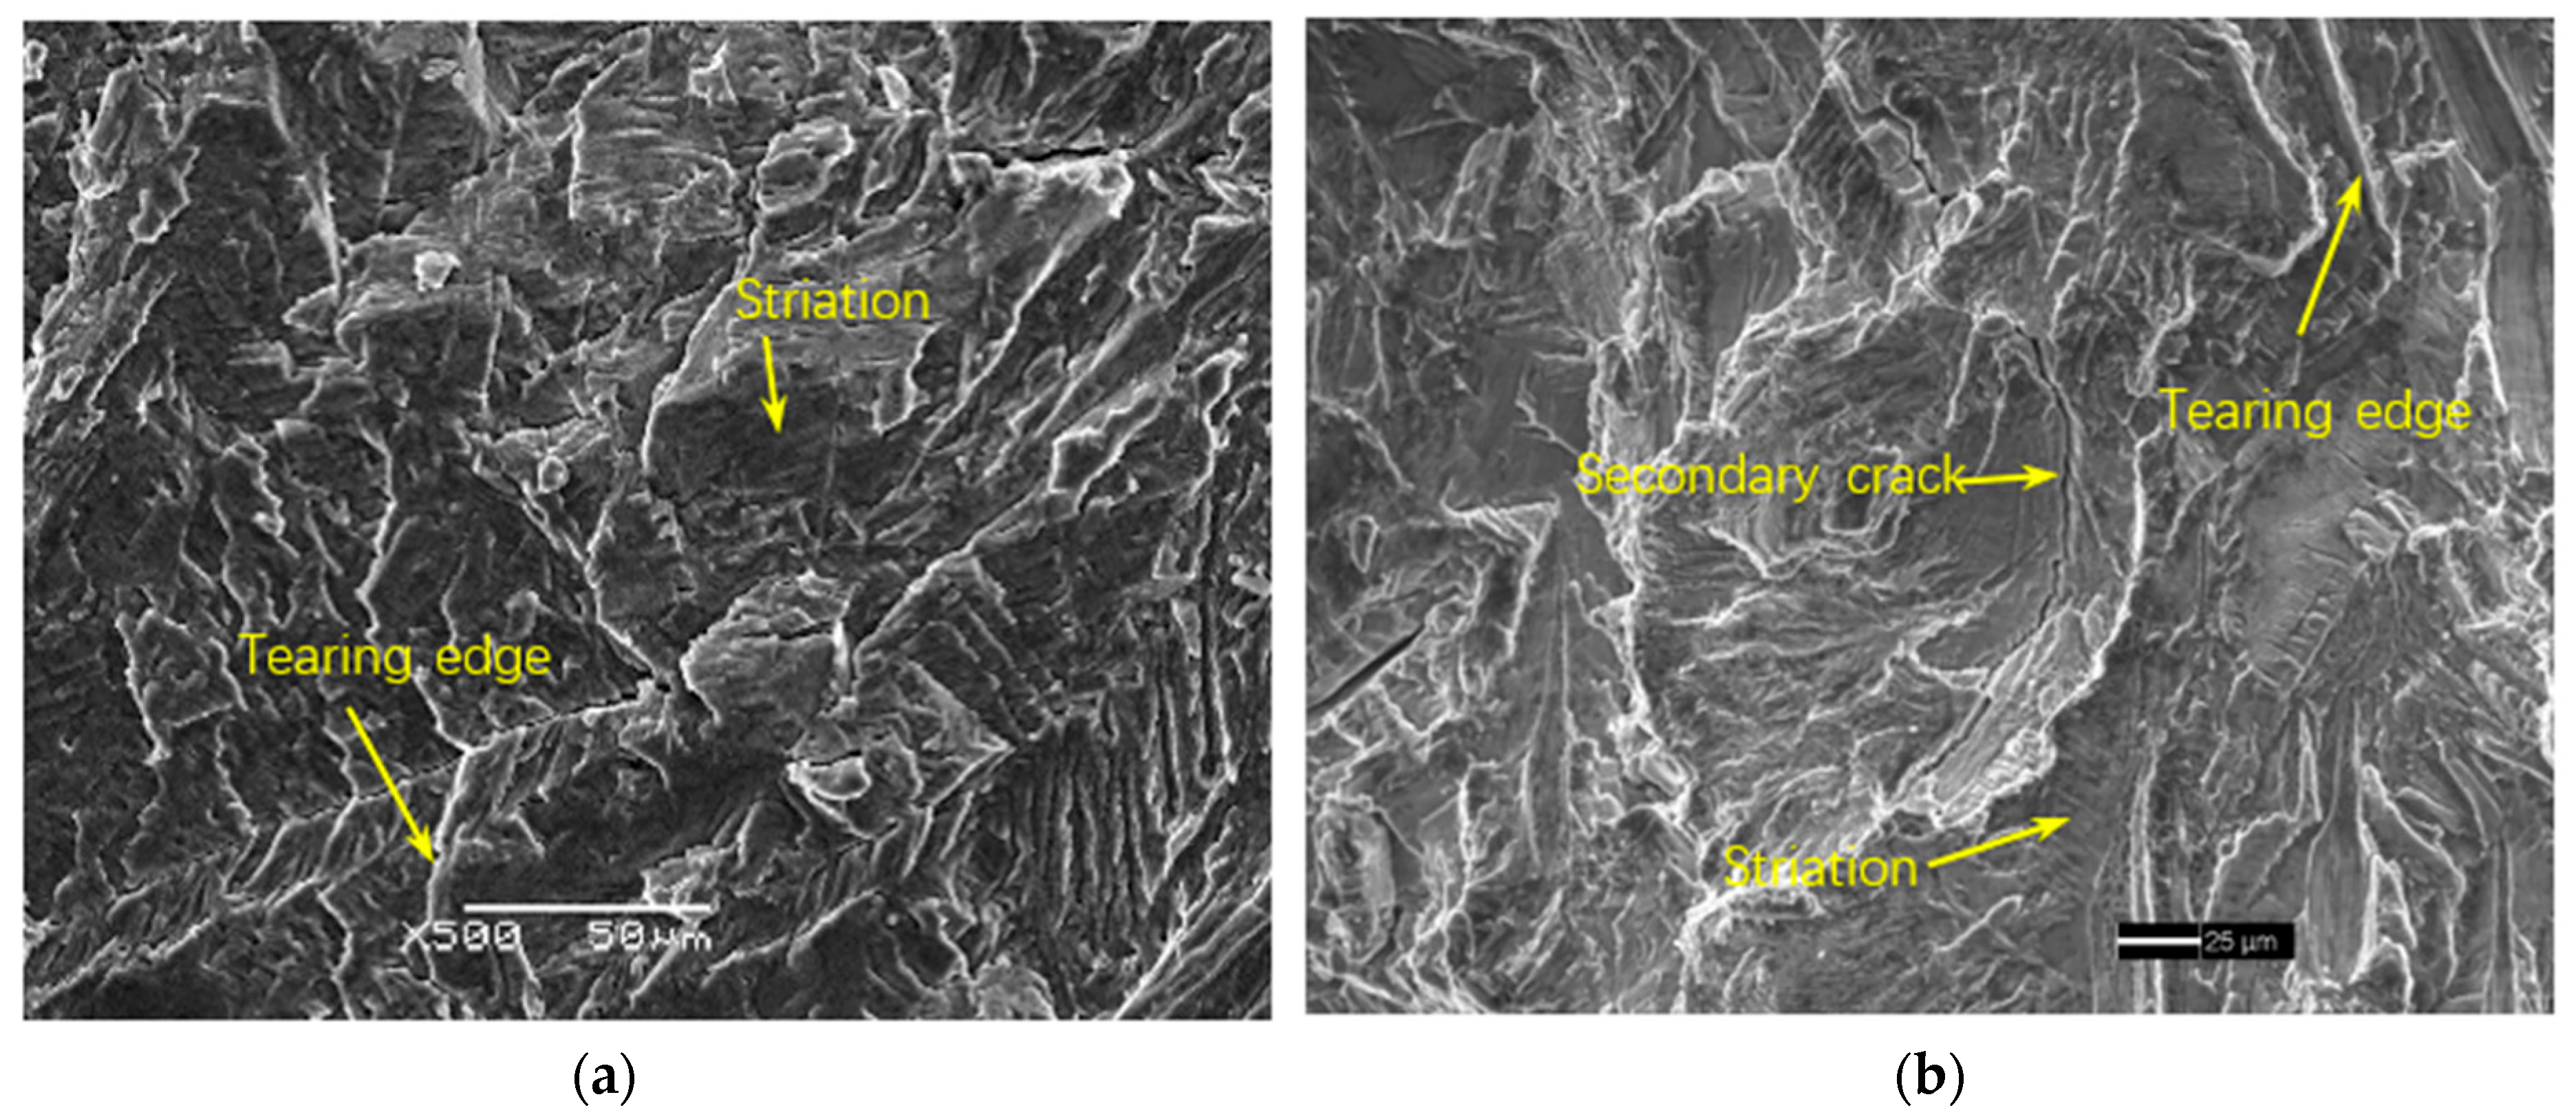
As the applied load ratio increases to 0.5, the overall feather of the fracture surface with dwell is also similar to that without dwell, as large amounts of short and dense fatigue striations appear in Figure 11a,b. The increased load ratio causes the appearance of torn edges, which is evidence of enhanced plastic deformation. In addition to this, a secondary crack along the grain boundary is detected in Figure 11b, indicating the appearance of an intergranular fracture trace resulting from creep. In the loading case of a high load ratio and low load amplitude, an intergranular fracture can be generated with the continuous accumulation of creep damage during the FCG process [24]. Although the intergranular crack is not detected in the fracture surface of the TA2 base metal [16], the dwell fatigue life of the TA2 weld joint with higher strength at room temperature is higher than that of the TA2 base metal, ensuring sufficient time for the accumulation of creep damage until the generation of secondary crack with an intergranular fracture feature. Since the creep damage characteristic in the microstructure is not predominant, room-temperature creep at this load ratio is unable to change the FCG rate significantly in the stage of stable crack growth.
At a load ratio of 0.7, the corresponding fracture morphologies of TA2 under pure fatigue and creep–fatigue loading conditions are displayed in Figure 12a–d, respectively. Distinct differences can be found between the microstructures in Figure 12a,b. The most remarkable difference in the microstructures after the creep–fatigue process is the appearance of cavities, as shown in Figure 12c. According to the enlarged view in Figure 12d, the diameters of the micro-cavities are approximately 10 μm. The increase in load ratio facilities the formation of these cavities. Various defects, such as pores and slags, are easily formed during the welding process. These initial defects tend to evolve into cavities under the loading condition of high load ratio and dwell, as the enhanced plastic deformation resulting from creep around these defects expands the size of the initial defects. A previous SEM study on the TA2 base metal failed to find the existence of cavities under the loading condition of high load ratio and dwell [15], as the microstructure of base metal did not provide the initial defects, favoring the formation of cavities during the subsequent FCG process. In Figure 12c, the appearance of a cleavage facet is consistent with reference [25], which is evidence of a dislocation-related creep mechanism. Overall, compared to that at a lower load ratio, an apparent difference of the feature in the fracture surface at a load ratio of 0.7 is detected, including the longer secondary crack, rougher fracture surface, and the appearance of cavities. From the above analysis, it can be concluded that the application of dwell at a load ratio of 0.7 has a certain influence on the fracture morphology, leading to the increase in the FCG rate in the stable growth region. However, as the room-temperature creep of the TA2 weld joint is limited, the increase in the FCG rate is relatively small.

3.3.2. SEM Study at the Temperature of 200 °C

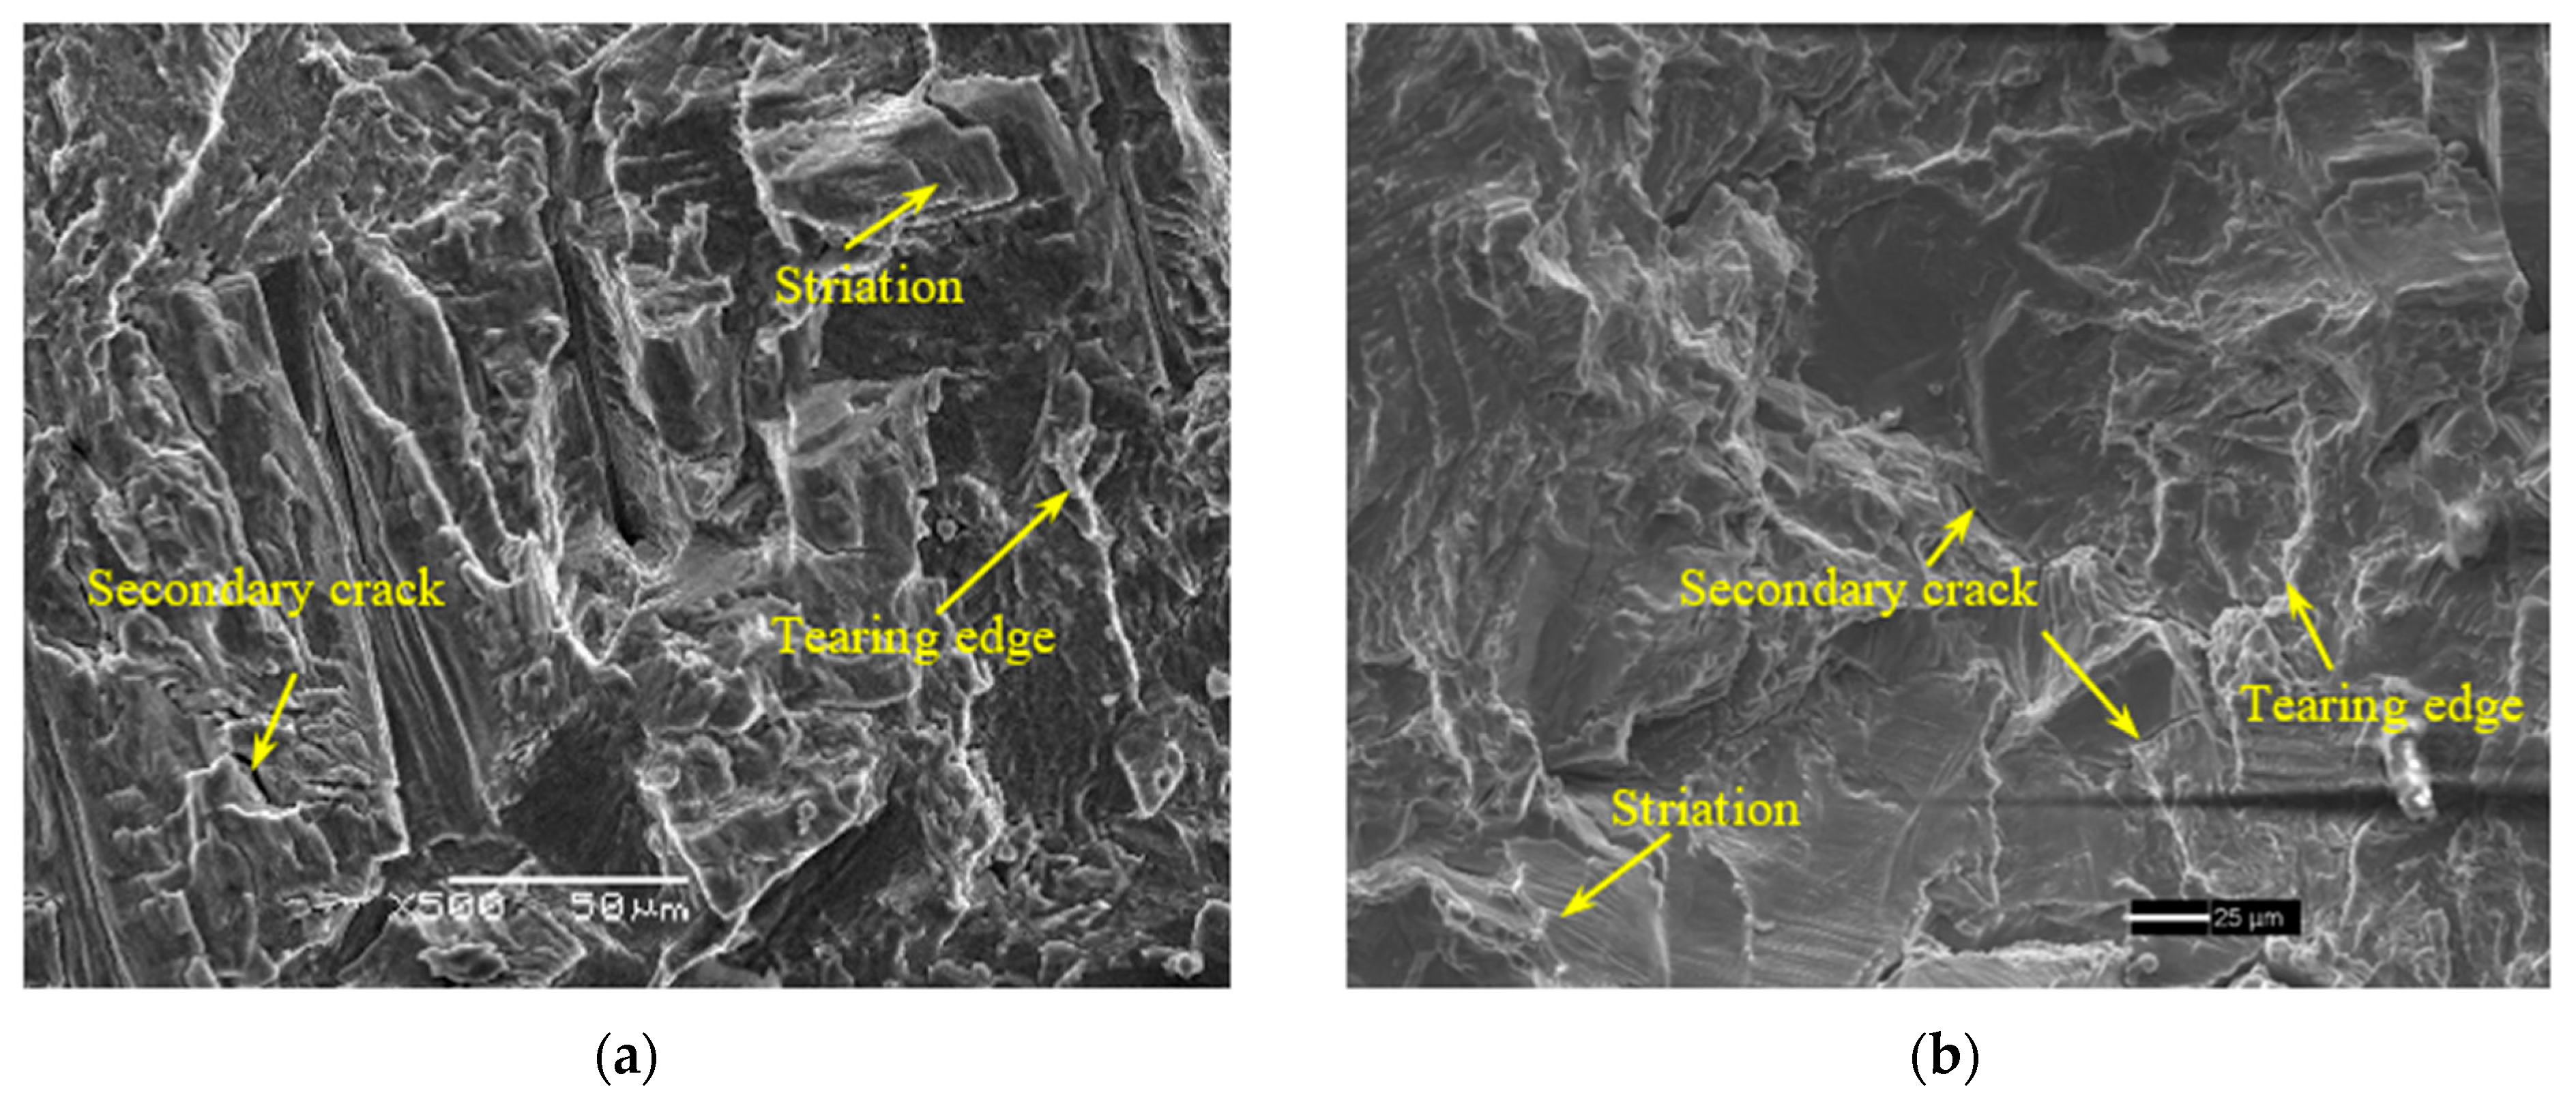
At a temperature of 200 °C and a load ratio of 0.1, more uneven surfaces, a great number of torn edges and secondary cracks, and fatigue striations of larger size can be observed in the dwell fatigue fracture surface of the TA2 weld joint. Compared with pure fatigue results in Figure 13a, the TA2 weld joint under the dwell fatigue loading condition experiences more significant plastic deformation.
As the applied load ratio increases to 0.5, creep increases the number of secondary cracks in the fracture surface. In addition, a secondary crack along the grain boundary can be observed in Figure 14b, indicating the appearance of an intergranular fracture feature. Overall, compared to the fracture surface at room temperature, the number of secondary cracks in Figure 13 and Figure 14 is increased.
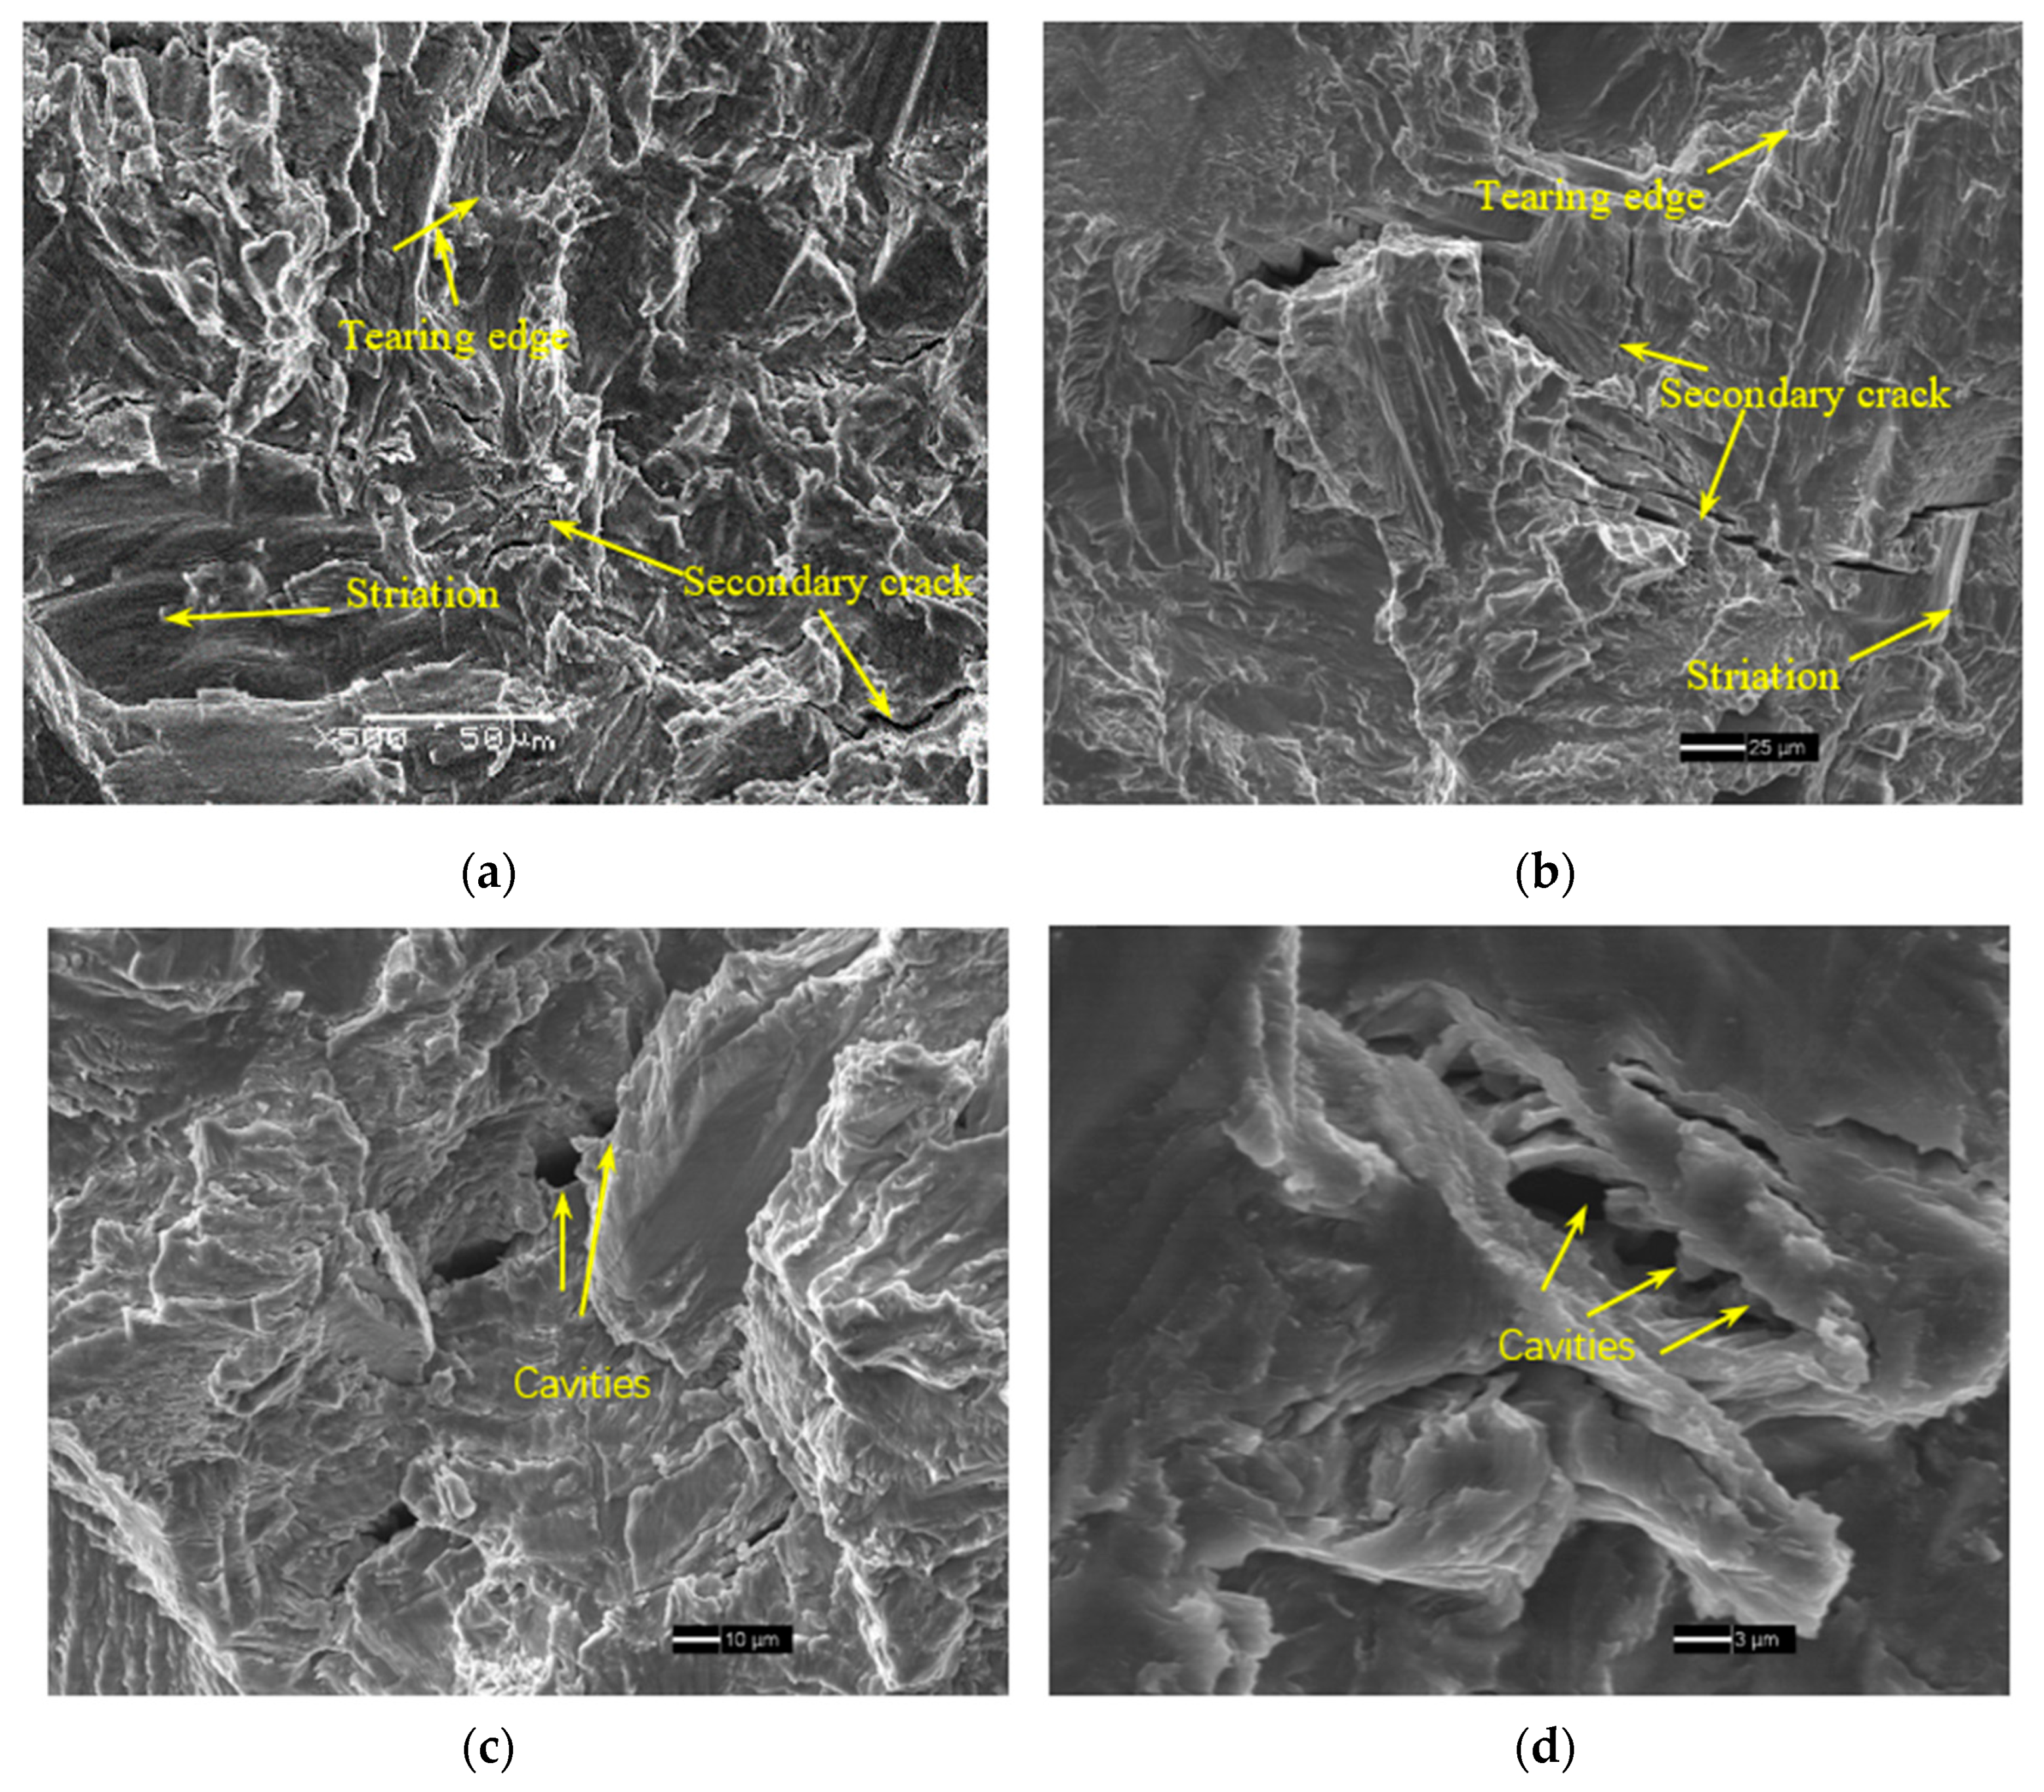
Figure 15a,b shows pure fatigue and dwell fatigue fracture surface at a relatively high load ratio of 0.7. Comparing with Figure 13 and Figure 14, a distinct difference can be observed in the dwell fatigue fracture surface. Massive cavities are manifested, as shown in Figure 15c,d. The appearance of cavities at a load ratio of 0.7 implies that the threshold load ratio for the cavities is high. Creep under a relatively high load level ensures the appearance of these cavities. A creep–fatigue study of P91 steel also reported the appearance of massive creep cavities and significant plastic deformation under a high load level [10]. Furthermore, the FCG rate could be significantly accelerated by creep. With an increasing load level, the more remarkable creep deformation resulted in a greater number of cavities. In the current study, the load level is relatively high at a load ratio of 0.7, which promotes the accumulation of creep strain. Consequently, massive cavities can be observed under this loading condition. Meanwhile, the number of secondary cracks is increased. Overall, by comparing fracture characteristics in Figure 10, Figure 11, Figure 12, Figure 13, Figure 14 and Figure 15, it can be concluded that with increasing the load ratio and dwell temperature, the more significant creep deformation leads to a more remarkable plastic deformation trace and a greater number of secondary cracks.

4. Conclusions

In this work, the dwell FCG behavior of the TA2 weldment is studied considering the effects of dwell temperature and load ratio. The interaction between creep and fatigue is analyzed through finite element simulations from the perspective of crack tip deformation. Fracture mechanisms were revealed in the SEM study. The main conclusions of this work are as follows:
  • At a relatively low load ratio and room temperature, dwell has little effect on the FCG behavior of the TA2 weld joint. At 200 °C, the FCG rate is significantly accelerated by dwell. Regardless of temperature, the increase in the FCG rate resulting from dwell becomes more apparent at the higher load ratio.
  • Dwell leads to a reduction of the stress level at the crack tip and an increase in plastic deformation. With the increase in the load ratio and dwell temperature, creep deformation is increased, thereby leading to a more pronounced dwell effect.
  • At room temperature and a low load ratio, dwell has little effect on the morphology of the fracture surface. At a high load ratio, a small number of secondary cracks and cavities appear on the fracture surface. At a temperature of 200 °C, the plastic deformation trace is more significant. With the increase in load ratio, the number of creep cavities and secondary cracks increases.

Author Contributions

L.C. and L.L. conceptualized the study; L.C., L.L. and B.Z. carried out the tests; C.Z. evaluated the tests; L.C. wrote the original draft; L.L., B.Z. and C.Z. reviewed and edited the paper. All authors have read and agreed to the published version of the manuscript.

Funding

This work is supported by the National Natural Science Foundation of China (Grant No. 51905260 and 51975271), the Natural Science Foundation of the Jiangsu Higher Education Institutions of China (Grant No. 22KJB410003), and the Starting Research Fund of Nanjing Vocational University of Industry Technology (Grant No. YK20-14-05).

Data Availability Statement

The data presented in this study are available on request from the corresponding author.

Conflicts of Interest

The authors declare no conflict of interest.

References

  1. Cuddihy, M.A.; Stapleton, A.; Williams, S.; Dunne, F.P.E. On cold dwell facet fatigue in titanium alloy aero-engine components. Int. J. Fatigue 2017, 97, 177–189. [Google Scholar] [CrossRef]
  2. Wu, Z.; Kou, H.; Chen, N.; Xi, Z.; Fan, J.; Tang, B.; Li, J. Recent developments in cold dwell fatigue of titanium alloys for aero-engine applications: A review. J. Mater. Res. Technol. 2022, 20, 469–484. [Google Scholar] [CrossRef]
  3. Lepore, M.A.; Maligno, A.R.; Berto, F. A unified approach to simulate the creep-fatigue crack growth in P91 steel at elevated temperature under SSY and SSC conditions. Eng. Fail. Anal. 2021, 127, 105569. [Google Scholar] [CrossRef]
  4. Zhao, J.; Mo, T.; Nie, D. The occurrence of room-temperature creep in cracked 304 stainless steel specimens and its effect on crack growth behavior. Mater. Sci. Eng. A 2008, 483, 572–575. [Google Scholar] [CrossRef]
  5. Wang, K.; Wang, F.; Cui, W.C.; Tian, A.L. Prediction of cold dwell-fatigue crack growth of titanium alloys. Acta Metall. Sin. 2015, 285, 619–627. [Google Scholar] [CrossRef] [Green Version]
  6. Gustafsson, D.; Moverare, J.J.; Johansson, S. Influence of high temperature hold times on the fatigue crack propagation in Inconel 718. Int. J. Fatigue 2011, 33, 1461–1469. [Google Scholar] [CrossRef] [Green Version]
  7. Gustafsson, D.; Moverare, J.J.; Simonsson, K. Fatigue crack growth behavior of Inconel 718—The concept of a damaged zone caused by high temperature hold times. Procedia Eng. 2011, 10, 2821–2826. [Google Scholar] [CrossRef] [Green Version]
  8. Lu, Y.L.; Chen, L.J.; Liaw, P.K. Effects of temperature and hold time on creep-fatigue crack-growth behavior of HAYNES alloy. Mater. Sci. Eng. A 2006, 429, 1–10. [Google Scholar] [CrossRef]
  9. Iyer, A.H.S.; Stiller, K.; Leijon, G. Influence of dwell time on fatigue crack propagation in Alloy 718 laser welds. Mater. Sci. Eng. A 2017, 704, 440–447. [Google Scholar] [CrossRef]
  10. Bassi, F.; Foletti, S.; Lo Conte, A. Creep fatigue crack growth and fracture mechanisms of T/P91 power plant steel. Mater. High. Temp. 2015, 32, 250–255. [Google Scholar] [CrossRef]
  11. Tanaka, H.; Yamada, T.; Sato, E.; Jimbo, I. Distinguishing the ambient-temperature creep region in a deformation mechanism map of annealed CP-Ti. Scrip. Mater. 2006, 54, 121–124. [Google Scholar] [CrossRef]
  12. Yamada, T.; Kawabata, K.; Sato, E.; Sato, E. Presences of primary creep on various phase metals and alloys at ambient temperature. Mater. Sci. Eng. A 2009, 387, 719–722. [Google Scholar] [CrossRef]
  13. Oberson, P.G.; Wyatt, Z.W.; Ankem, S. Modeling interstitial diffusion controlled twinning in alpha titanium during low-temperature creep. Scrip. Mater. 2011, 65, 638–641. [Google Scholar] [CrossRef]
  14. Oberson, P.G.; Ankem, S. The effects of time-dependent twinning on low temperature (<0.25*Tm) creep of an alpha-titanium alloy. Int. J. Plast. 2009, 25, 881–900. [Google Scholar]
  15. Li, J.; Lu, L.; Zhang, P.; Miao, X.T.; Chang, L.; Zhou, B.B.; Wang, Y.Z.; He, X.H.; Zhou, C.Y. Effect of cold creep on fatigue crack growth behavior for commercial pure titanium. Theor. Appl. Fract. Mec. 2018, 97, 177–188. [Google Scholar] [CrossRef]
  16. Su, C.Y.; Zhou, C.Y.; Lu, L.; Li, J.; Sun, P.Y. Effect of temperature and dwell time on fatigue crack growth behavior of CP-Ti. Metals 2018, 8, 1031. [Google Scholar] [CrossRef] [Green Version]
  17. Chang, L.; Zhou, C.Y.; Peng, J.; Li, J.; He, X.H. Creep behavior of CP-Ti TA2 at low temperature and intermediate temperature. Rare Met. Mater. Eng. 2017, 7, 1463–1468. [Google Scholar]
  18. Lu, L.; Li, J.; Su, C.Y.; Sun, P.Y.; Chang, L.; Zhou, B.B.; He, X.H.; Zhou, C.Y. Research on fatigue crack growth behavior of commercial pure titanium base metal and weldment at different temperatures. Theor. Appl. Fract. Mec. 2019, 100, 215–224. [Google Scholar] [CrossRef]
  19. ASTM E647-15; Standard Test Method for Measurement of Fatigue Crack Growth Rates. American Society for Testing and Materials: West Conshohocken, PA, USA, 2015.
  20. Chaboche, J.L. Time-independent constitutive theories for cyclic plasticity. Int. J. Plast. 1986, 2, 149–188. [Google Scholar] [CrossRef]
  21. Sun, P.Y.; Zhu, Z.K.; Su, C.Y.; Lu, L.; Zhou, C.Y.; He, X.H. Experimental characterisation of mechanical behavior for a TA2 welded joint using digital image correlation. Opt. Laser. Eng. 2019, 115, 161–171. [Google Scholar] [CrossRef]
  22. Ravi Chandran, K.S. A new approach to the mechanics of fatigue crack growth in metals: Correlation of mean stress (stress ratio) effects using the change in net-section strain energy. Acta Mater. 2017, 135, 201–214. [Google Scholar] [CrossRef]
  23. Peng, J.; Zhou, C.Y.; Dai, Q.; He, X.H. The temperature and stress dependent primary creep of CP-Ti at low and intermediate temperature. Mater. Sci. Eng. A 2014, 611, 123–135. [Google Scholar] [CrossRef]
  24. Chen, Z.; Holdsworth, S. High-R low growth rate fatigue crack propagation at elevated temperatures. Int. J. Fatigue 2018, 106, 114–122. [Google Scholar] [CrossRef]
  25. Evans, W.J.; Bache, M.R. Dwell-sensitive fatigue under biaxial loads in the near-alpha titanium alloy IMI685. Int. J. Fatigue 1994, 16, 443–452. [Google Scholar] [CrossRef]
Figure 1. The standard compact tensile (CT) specimen.
Metals 13 00553 g001
Figure 2. Comparison of hysteresis loops at the strain amplitude of 0.8% obtained by low cycle fatigue test and Chaboche model: (a) 25 °C and (b) 200 °C.
Metals 13 00553 g002
Figure 3. Finite element model.
Metals 13 00553 g003
Figure 4. FCG rate of TA2 weld joint at 25 °C under different load ratios R and hold times th: (a) R = 0.1; (b) R = 0.5; (c) R = 0.7.
Metals 13 00553 g004aMetals 13 00553 g004b
Figure 5. Strain energy of TA2 weld joint under different load ratios R and hold times th: (a) R = 0.1 plastic energy; (b) R = 0.7 plastic energy; (c) creep energy.
Metals 13 00553 g005
Figure 6. Distribution of stress and strain at crack tip of weld joint under different holding times: (a) equivalent plastic strain; (b) creep strain; (c) maximum Mises stress.
Metals 13 00553 g006
Figure 7. FCG rate of TA2 weld joint at 200°C under different load ratios and hold times th: (a) R = 0.1; (b) R = 0.5; (c) R = 0.7.
Metals 13 00553 g007
Figure 8. Strain energy for TA2 weld joint under different loading conditions: (a) plastic energy at R = 0.1; (b) plastic energy at R = 0.7; (c) creep energy.
Metals 13 00553 g008aMetals 13 00553 g008b
Figure 9. Evolution of stress and strain near the crack tip of weld joint under different loading conditions: (a) equivalent plastic strain; (b) creep strain; (c) maximum Mises stress.
Metals 13 00553 g009
Figure 10. Typical SEM micrographs of the fracture surface at R = 0.1 and 25 °C: (a) th = 0 s; (b) th = 10 s.
Metals 13 00553 g010
Figure 11. Typical SEM micrographs of the fracture surface at R = 0.5 and 25 °C: (a) th = 0 s; (b) th = 10 s.
Metals 13 00553 g011
Figure 12. Typical SEM micrographs of the fracture surface at R = 0.7 and 25 °C: (a) th = 0 s; (b) th = 10 s; (c) cavities under dwell loading condition; (d) enlarged view of cavities.
Metals 13 00553 g012
Figure 13. Typical SEM micrographs of the fracture surface at R = 0.1 and 200 °C: (a) th = 0 s; (b) th = 10 s.
Metals 13 00553 g013
Figure 14. Typical SEM micrographs of the fracture surface at R = 0.5 and 200 °C: (a) th = 0 s; (b) th = 10 s.
Metals 13 00553 g014
Figure 15. Typical SEM micrographs of the fracture surface at R = 0.7 and 200 °C: (a) th = 0 s; (b) th = 10 s; (c) cavities under dwell loading condition; (d) enlarged view of cavities.
Metals 13 00553 g015
Table 1. Chemical composition of TA2 (weight %).
FeCNHOTi
0.0610.0280.0060.0020.087Other
Table 2. Welding parameters.
Welding
Method
Joint
Profile
Filler MetalAcceleration Voltage U (V)Focus Current
If (A)
Welding Speed
v/(mm s−1)
GTAWX grooveCP-Ti 13–20160–2201.7–2.5
Table 3. Fatigue crack growth tests of TA2 weld joint under different load ratios and temperatures.
Specimen No.Temperature (°C)Dwell Time (s)RRelative Error of R∆F (N)Relative Error of ∆F
W12500.12.78%44808.64%
W225100.12.78%44808.71%
W32500.50.40%35008.00%
W425100.51.23%35008.88%
W52500.70.78%28508.81%
W625100.70.79%28508.95%
W720000.13.54%44808.90%
W8200100.15.91%44808.92%
W920000.50.72%35008.98%
W10200100.50.95%35008.69%
W1120000.70.81%28508.82%
W12200100.70.76%28508.80%
Table 4. Material constants of the Chaboche model and the creep model for TA2 weld joint at 25 °C and 200 °C.
T (°C)σ0 (MPa)C1 (MPa)γ1C2 (MPa)γ2Anm
25350413108802650.291 × 10−92.42834−0.80059
2001801007721353990.3 × 10−176.78653−0.88797
Disclaimer/Publisher’s Note: The statements, opinions and data contained in all publications are solely those of the individual author(s) and contributor(s) and not of MDPI and/or the editor(s). MDPI and/or the editor(s) disclaim responsibility for any injury to people or property resulting from any ideas, methods, instructions or products referred to in the content.