Article

Spherical CdS Nanoparticles Precipitated from a Cadmium Thiosulfate Complex Using Ultraviolet Light for Photocatalytic Dye Degradation

1
School of Materials Science and Engineering, Henan University of Science and Technology, Luoyang 471023, China
2
Provincial and Ministerial Co-Construction of Collaborative Innovation Center for Non-Ferrous Metal New Materials and Advanced Processing Technology, Luoyang 471023, China
3
Research Center for High Purity Materials, Henan University of Science and Technology, Luoyang 471023, China
*
Author to whom correspondence should be addressed.
Metals 2023, 13(3), 554; https://doi.org/10.3390/met13030554
Submission received: 10 February 2023 / Revised: 28 February 2023 / Accepted: 1 March 2023 / Published: 9 March 2023

Abstract

:
Thiosulfate is an inorganic ligand that forms a soluble light-sensitive cadmium thiosulfate complex, and cadmium sulfide (CdS) with a “size effect” can be produced via ultraviolet (UV) irradiation. This study investigated the activity of CdS nanoparticles (NPs) precipitated from a cadmium thiosulfate complex via UV irradiation on photocatalytic dye degeneration. Scanning electron microscopy (SEM) and transmission electron microscopy (TEM) demonstrated that the decomposition products were spherical CdS NPs. The photocatalytic activity of the CdS NPs was evaluated based on the degradation rates of methylene blue, rhodamine B, and methyl orange. With 25 mg of CdS NPs and a dye concentration of 10 mg L−1, the degradation rates of the three dyes under visible light were 36%, 90%, and 80%, respectively. A kinetic study revealed that the photocatalytic degradation rate of the CdS NPs followed first-order kinetics, and the rate constants for the three dyes were determined to be 0.0051, 0.0762, and 0.0144 min−1, respectively. The CdS NPs exhibited a stable photocatalytic performance after three cycles of methylene blue degradation. This indicates that CdS NPs formed from a cadmium thiosulfate complex after UV irradiation can be used for photocatalysis, which will save resources and help in environmental conservation.

1. Introduction

The depletion of mineral resources has increased globally; therefore, it is necessary to improve the utilization efficiency and secondary recovery of materials. Notably, non-ferrous metals, such as cadmium, which is highly toxic and more likely to be absorbed by crops than other pollutants, must be recovered from electronic waste [1]. Cadmium pollution can have serious consequences, such as the “bone-pain disease” reported in Ishitongchuan, Toyama Prefecture, Japan, in 1931 [2]. Therefore, the effective recycling of cadmium from electronic waste has been widely studied.
Non-ferrous metals are commonly recovered from electronic waste via hydrometallurgical recovery processes, which are simple recycling technologies with minimal equipment requirements. In particular, thiosulfate systems have the advantages of low toxicity, high efficiency, and environmental protection, which makes them potential green metallurgical systems [3,4]. Soluble complex ions, such as Ag(S2O3)23−, Pt(S2O3)46−, Hg(S2O3)22−, and Pb(S2O3)46− are formed in the leaching solution; therefore, thiosulfate systems are extensively used to leach noble and heavy metals [5,6]. In particular, the traditional copper-ammonia-thiosulfate systems are better for the environment than the cyanide leaching of carbonate and copper ores. With the rapid development of the thiosulfate leaching system, researchers have found that it has numerous problems, such as the high consumption of thiosulfate and serious pollution of ammonia. So, nickel-based, cobalt-based, and iron-based catalysts are used instead of copper, and several non-ammonia thiosulfate leaching systems (e.g., oxygen-thiosulfate, copper-thiosulfate, copper-ethylenediamine (EDA)-iron thiosulfate, and ferric-oxalate-thiosulfate) have also been developed to solve the above problems [7]. Owing to the shortage of mineral resources and the large number of valuable noble metals, such as Au, Ag, and Cd, contained in electronic waste, some researchers have considered using thiosulfate systems to leach metals from electronic waste. For example, Ha et al. [8] studied the kinetics and mechanisms of selective gold leaching from printed circuit boards using a thiosulfate system. The results demonstrated that under optimal conditions, i.e., thiosulfate, copper (II), and ammonia contents of 72.71 mmol L−1, 10.0 mmol L−1, and 0.266 mol L−1, the leaching performance of gold in the printed circuit board (PCB) was the best. In addition, a kinetic model of the gold leaching process was also established. Petter et al. [9] studied the leaching effect of sodium and ammonium thiosulfate on gold and silver in the PCB of a mobile phone. The results showed that under the conditions of a sodium thiosulfate concentration of 0.1 mol L−1, an ammonium hydroxide concentration of 0.2 mol L−1, and a copper concentration of 0.015–0.03 mol L−1, the leaching rates of gold and silver were 15% and 3%, respectively. Based on the leaching of gold/silver by thiosulfate, copper, and ammonia, Murali et al. [10] studied the effects of pH, the concentration of the extractant, the mixing time, and the concentration of H2SO4 on the recovery of copper from an e-waste leaching solution. The results demonstrated that the transfer rate of copper in the e-waste leaching solution was more than 94%, the transfer rate of iron was less than 10%, the electrodeposition purity of the electric effusion was 99%, and the current efficacy was 94.5%. The separation factor of copper and iron was determined, which provided valuable guidance for the optimization of process parameters in an industrial environment. Although the use of the thiosulfate system to leach noble metals (i.e., gold and silver) from electronic waste has been widely studied, research reports on whether it can be used to leach heavy metals (such as cadmium) from electronic waste are still limited. The formation of cadmium thiosulfate complexes indicates the possibility of selectively leaching cadmium from electronic waste using a thiosulfate system.
However, thiosulfate leaching systems have poor stability, and the technology used to recover metals from leaching solutions requires further research [11,12]. It is reported that metallic thiosulfate complexes (Hg/Pb/Cd) are sensitive to UV light [13], which indicates that the metal thiosulfate complexes undergo decomposition reactions to form metal sulfides under UV light. Wang et al. [14] studied the effects of the initial pH, thiosulfate concentration, and temperature on the UV photolysis of a mercury thiosulfate solution. The results of the characterization of decomposition products showed that after exposure to UV light for 240 min, the decomposition of the S-S bond in the mercury thiosulfate complex was accelerated, so the recovery rate of mercury was greatly improved, reaching 87.94%, which solves the problem of the slow kinetics of mercury recovery limits. Egorov et al. [15] studied the effect of the concentration, ratio, and irradiation time of thiosulfate ions on the preparation of lead sulfide (PbS) from the lead thiosulfate complex under UV light. The spectroscopy and microscopy results showed that PbS NPs were formed from solutions of the lead thiosulfate complex under the irradiation of UV light, and their yield and size were determined by their concentration and the ratio of thiosulfate ions in the solution. In addition, the yield and size of (PbS) NPs could be used to produce quantum dot materials. Han et al. [16] studied the effect of the initial concentration of silver, the concentration of thiosulfate, pH, and temperature on silver-thiosulfate complex photolysis under UV-C irradiation. The results of characterization showed that the S-S bond in the silver-thiosulfate complex was dissociated because the activated complex ions reacted with hydroxide ions during the photolysis process, leading to the oxidation of silver-thiosulfate ions and the reduction of silver ions. Therefore, the final composition of the photolysis products was Ag2S, S, and Ag. In addition, the recovery rate of silver was as high as 80.46%. Egorov et al. [17] studied the composition of photolysis products of cadmium thiosulfate aqueous solutions, in which cadmium sulfide with a “size effect” was observed. These results indicate that metal sulfides can be obtained from thiosulfate leaching solutions using photodecomposition technology.
In recent years, transition-metal sulfides have been extensively used in electronic components, catalysts, and antibacterial materials owing to their excellent physical and photoelectrical properties [18,19]. In particular, CdS is a photoelectric semiconductor nanomaterial with a reasonable band gap (2.4 eV) and excellent photocatalytic performance.
The preparation method of CdS plays an important role in the photocatalytic activity of CdS. Therefore, many research methods have been carried out, including precipitation, hydrothermal, ion-exchange, template, and other methods. Devi et al. [20] studied the effects of different temperatures on the size, band gap, and morphology of NPs by using the precipitation method with cadmium chloride as the cadmium source, sodium sulfide as the sulfur source, and water as the solvent. The results showed that with the increase in temperature, the crystallinity, particle size, and agglomeration increase, and the band gap decreases. Bie et al. [21] studied the photocatalytic activity of CdS nanosheets with different thicknesses using the oil-bath method. The experimental results showed that the ultrathin CdS nanosheets could significantly shorten the charge-transfer distance, increase the surface-active potential density, and supply a sufficient negative conduction band edge so as to enhance the photocatalytic performance. Xia et al. [22] used the hydrothermal method to study the photocatalytic activity of CdS NPs under visible and near-infrared light. Xiang et al. [23] synthesized hierarchical porous CdS nanosheet-assembled flowers using an ion-exchange strategy and studied their photocatalytic properties. The results showed that the hierarchical structure of nanosheets and porous nanosheets could effectively enhance the light absorption ability and provide more active adsorption sites, which improved the photocatalytic activity of CdS. Hemandez-Gordillo et al. [24] prepared nanostructured CdS nanofibers based on an ethylenediamine template by using the simple precipitation method. The results demonstrated that the prepared nanostructured CdS nanofibers had a hexagonal structure, similar specific surface areas, and optical absorption in the blue region. Under the condition of synthesizing these nanofibers in different organic solvents at 200 ℃, ethylenediamine would link to the CdS surface and thus be eliminated. CdS promotes a charge transition through band-gap transmission to form photogenerated electron–hole pairs under visible light, which can undergo oxidation–reduction reactions with organic dyes [25,26,27,28]. CdS prepared by conventional methods has certain photocatalytic properties. Therefore, this provides a basis for the photocatalytic performance of CdS as a product of UV decomposition.
In summary, utilizing cadmium from electronic waste in the field of photocatalysis can reduce the need for conducting the difficult process of metal recovery from thiosulfate leaching solutions and protect the environment. Moreover, it has the potential to facilitate the high-value utilization of cadmium from electronic waste, as proposed in this study. A thiosulfate system was used to selectively leach cadmium from electronic waste, and subsequently, UV photodecomposition technology was used to produce spherical CdS NPs. The degradation of organic dyes using the spherical CdS NPs was investigated, and the morphology, microstructure, and recycling stability of the CdS NPs were analyzed.

2. Experimental Section

2.1. Materials

Sodium thiosulfate (Na2S2O3) was obtained from Damao Chemical Reagent Factory (Yantai, China). Cadmium chloride (CdCl2) and methyl orange (MO) were purchased from Tianjin Kemiou Chemical Reagent Co., Ltd. (Tianjin, China). Methylene blue (MB) was purchased from Beijing Chemical Plant (Beijing, China), and rhodamine B (RhB) was purchased from Sinopharm Chemical Reagent Co., Ltd. (Beijing, China). All reagents were analytically pure and used without further purification. Deionized water produced by a high-purity water system with a typical resistivity of 18.24 M Ω cm was used for all experiments.

2.2. Procedure

As shown in Figure 1, the experimental procedure used in this study was divided into three parts: UV photolysis, photocatalytic activity evaluation, and stability testing of the CdS NPs. A cadmium thiosulfate complex was prepared by mixing aqueous solutions of Na2S2O3 (0.01 mol) and CdCl2 (80 mg L−1). Subsequently, it was employed to simulate the leaching solution used to extract cadmium from electronic waste. In the UV photolysis test, first, the cadmium thiosulfate complex was placed in a quartz beaker (250 mL, 80–240 mg L−1) in a confined space. Next, it was exposed to UV light (single-ended, four-wire, 24 W, 254 nm, and 50 μW cm−2) for 4 h. The decomposition products were filtered via a brand-new filter head and needle; it was naturally dried, and subsequently, the yellow precipitate was collected. In the photocatalytic activity evaluation test, MB, RhB, and MO were used as raw materials to simulate an organic dye solution, and the visible-light catalytic activity of the CdS NPs was evaluated based on their degradation. CdS NPs (25 mg) were added to the organic dye solution (100 mL), and the dark adsorption test was conducted under dark conditions. Once the adsorption reached equilibrium, the organic dye (100 mL) with CdS NPs (25 mg) was added to a condensing beaker under magnetic stirring, and then condensing water was used to maintain the reaction temperature (room temperature) during the photocatalytic process; a xenon lamp (current of 15 A, distance of 20 cm) was switched on, and the solution was sampled (5 mL) at various time intervals. In the stability test of CdS NPs, the degradation of MB (100 mL, 10 mg L−1) was used as an example. The photocatalyzed CdS NPs (25 mg) were filtered so as to recycle and use them to degrade the recently configured MB. The concentration of the organic dyes was measured using a UV–visible (UV–vis) spectrophotometer.

2.3. Analytical Methods

The morphology and microstructure of the decomposition products were examined using emission-gun scanning electron microscopy (SEM; JSM-IT100, JEOL Ltd., Tokyo, Japan) and transmission electron microscopy (TEM; JEM-2100, JEOL Ltd., Tokyo, Japan); the TEM samples were prepared using a copper mesh. The lattice spacing was calculated using Digital Micrograph software (Gatan, Inc., Warrendale, PA, USA), and the particle size was measured by using the software ImageJ (NIH, Bethesda, MD, USA). A UV–vis spectrometer (UV-2550, Shimadzu, Japan) was used to measure the concentrations of the organic dyes. The prepared samples were analyzed using a Fourier transform infrared (FT-IR) spectrophotometer (Spectrum 65, Perkin Elmer, Waltham, MA, USA); subsequently, the measured data were analyzed using Origin software (OriginLab Corp., Northampton, MA, USA).

3. Results

3.1. Characterization of UV-Decomposition Products

SEM was used to investigate the morphologies of the UV-decomposition products, as shown in Figure 2a,b. The decomposition products comprised spherical particles of various sizes with compact surface structures. TEM was used to further investigate the morphology and structural characteristics of the UV-decomposition products, as shown in Figure 2c–e, where the arrow in Figure 2d is the lattice spacing “d”. The particle-size distribution was uneven, and most of the particles had a diameter of 50–100 nm, as shown by the histogram of the particle size in Figure 2f, which is consistent with the SEM analysis. As shown in Figure 2d, the 0.349 and 0.291 nm lattice spacings corresponded to the (111) and (200) crystal planes of the cubic phase of CdS, respectively. These results show that the cadmium thiosulfate complex decomposed and formed precipitates under UV irradiation, and the precipitates consisted of spherical CdS NPs.

3.2. Photocatalytic Activity of the Spherical CdS NPs

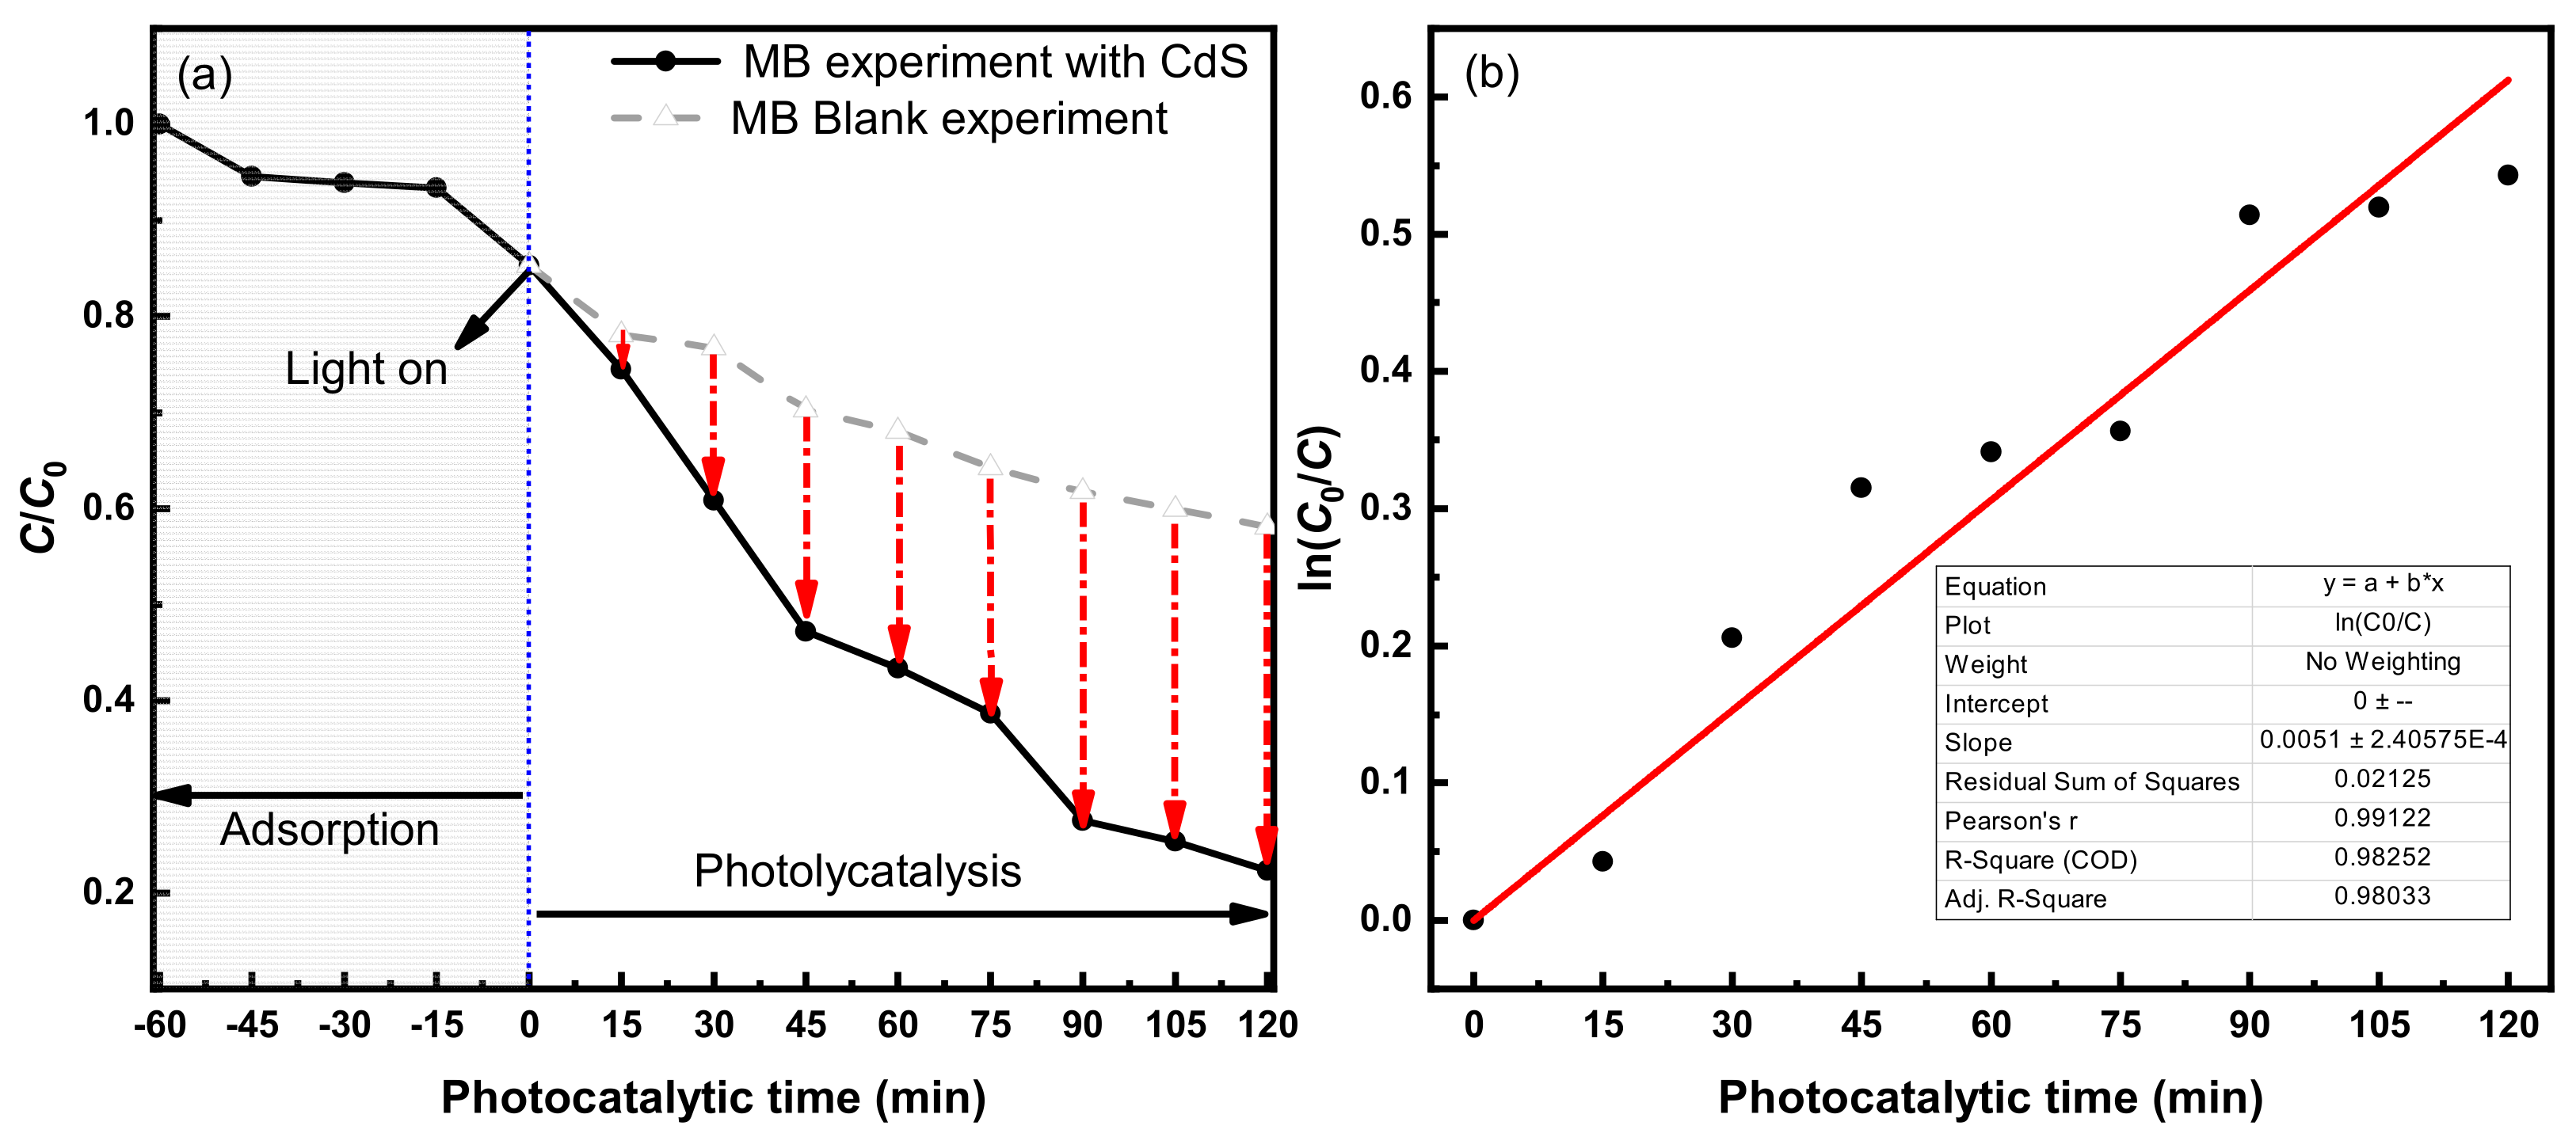
3.2.1. Photocatalytic Degradation Effect of MB

The absorption spectra of the CdS NPs at various time intervals after MB photocatalysis are shown in Figure 3a; the adsorption experiment was conducted from −60 to 0 min, and the photocatalytic experiment was conducted from 0 to 120 min. With the increase in the time of adsorption, the position of the adsorption peak shifted toward the blue end of the spectrum (660–610 nm), which indicates that MB underwent photocatalytic degradation into intermediate products.
The observed blue shift of the absorption spectrum is due to the electrons (e) of CdS NPs being excited from the valence band (VB) to the conduction band (CB) under visible light. In this process, photogenerated e with negative charges and photogenerated holes (h+) with positive charges were generated in the CB and the VB, respectively, and formed photogenerated electron–hole (e/h+) pairs. In addition, MB was oxidized by h+ to realize dealkylation, which indicates that the directional structure of MB varied, resulting in the shift of the maximum absorption peak wavelength of its absorption band to the short wave, i.e., a blue shift.

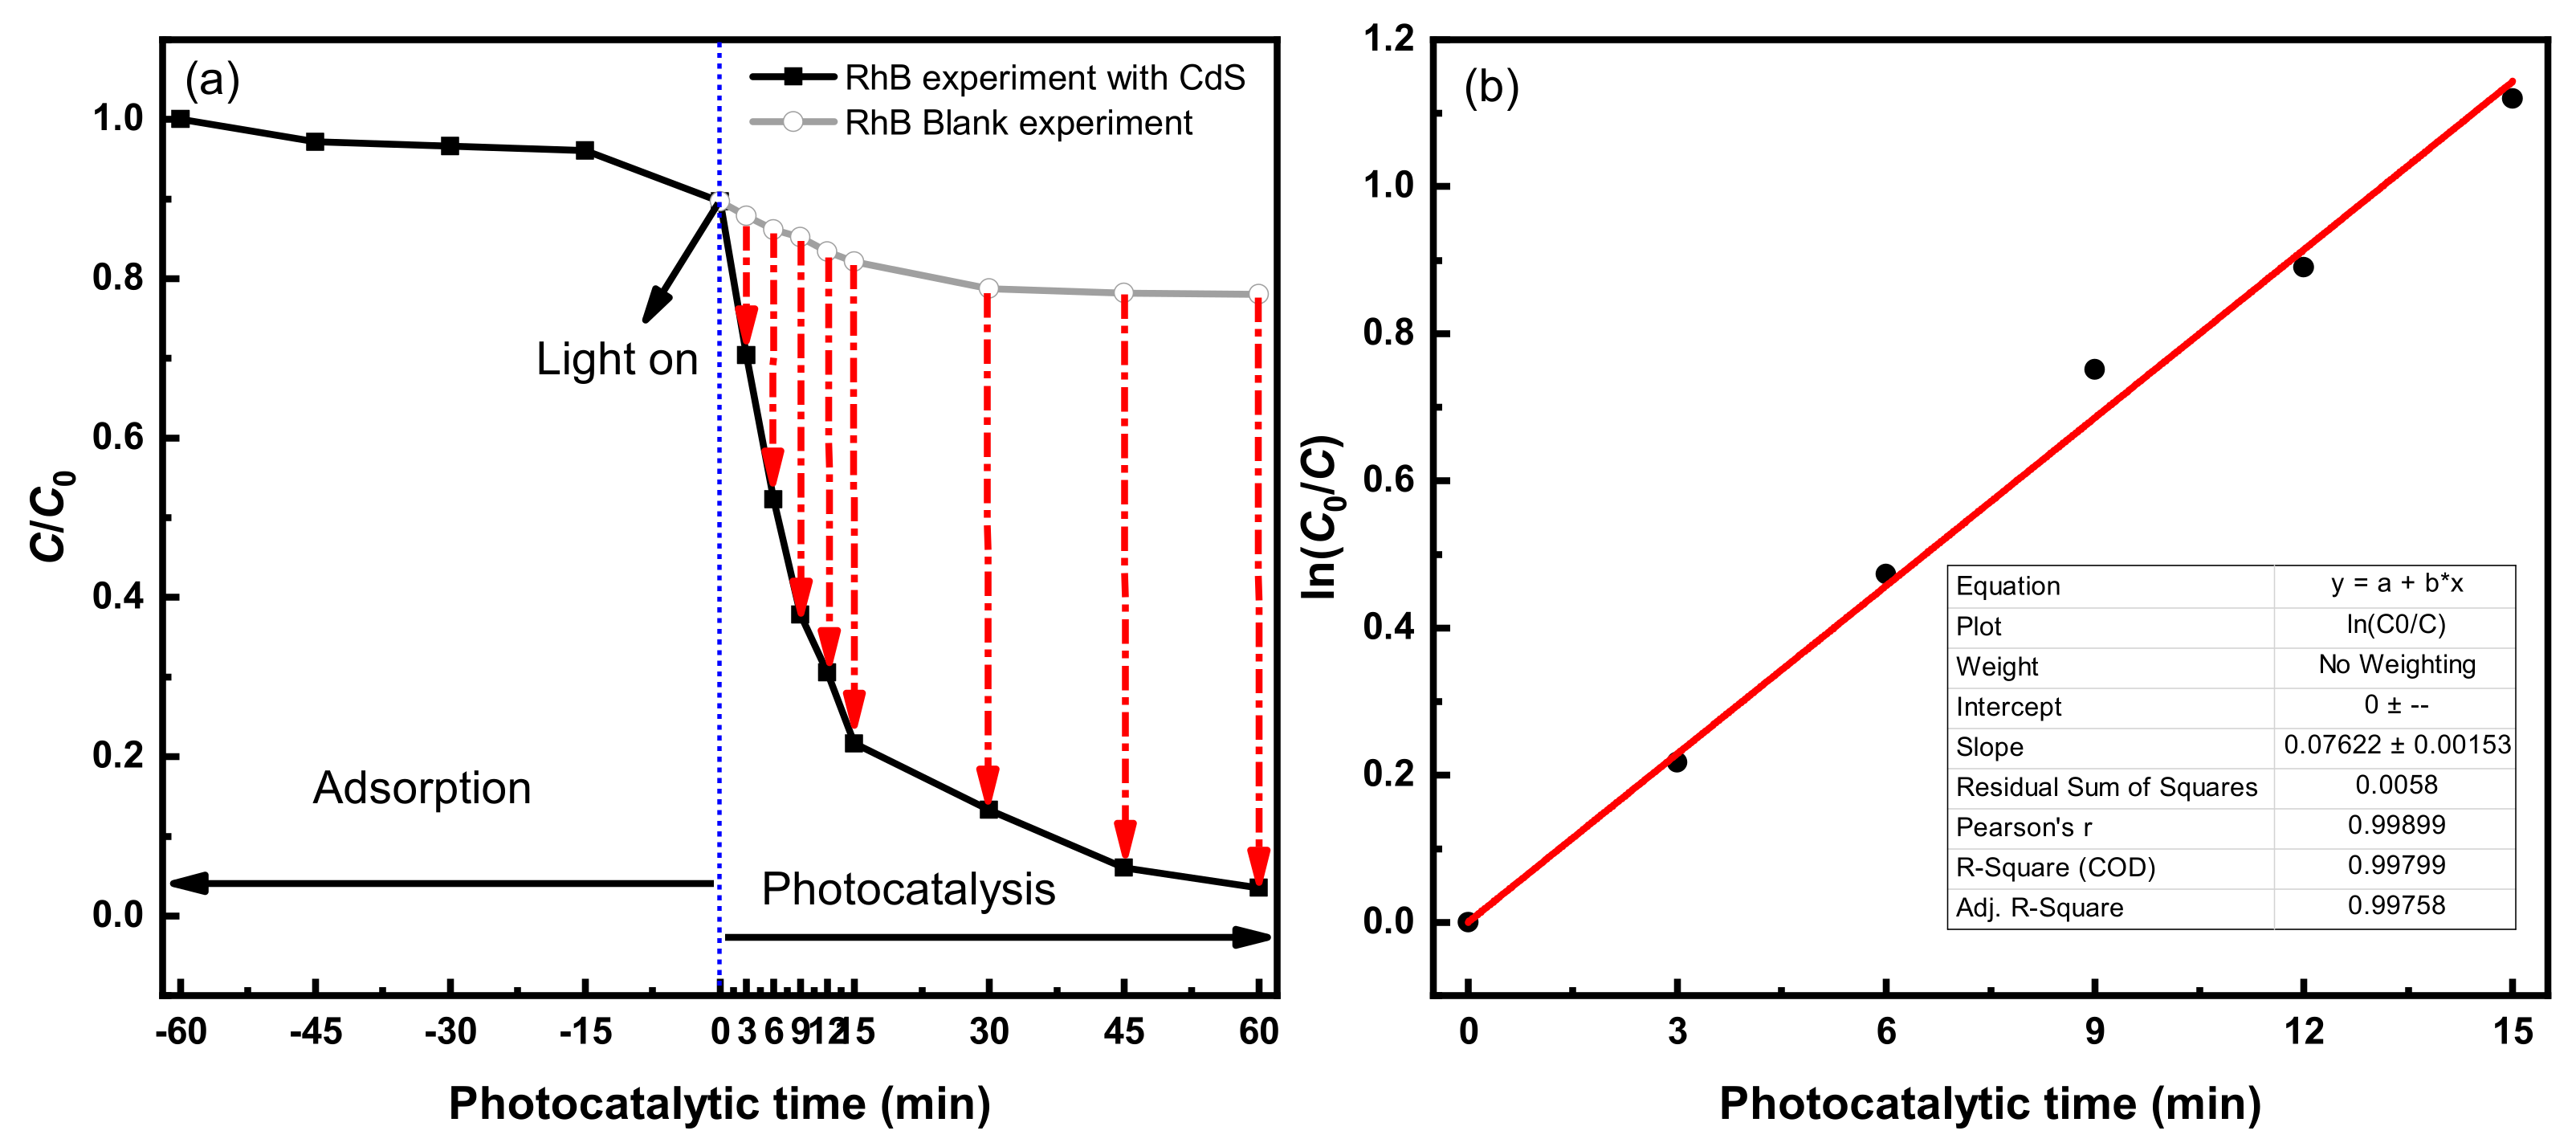
3.2.2. Photocatalytic Degradation Effect of RhB

The absorption spectra of the CdS NPs over time during RhB photocatalysis are shown in Figure 3b; the adsorption experiment was conducted from −60 to 0 min, and the photocatalytic experiment was conducted from 0 to 60 min. Over time, the position of the adsorption peak shifted toward the blue end of the spectrum (550–500 nm), which indicates that RhB underwent photocatalytic degradation into intermediate products.
Similar to the result of the photocatalytic degradation of MB, there is also a blue shift in the absorption spectrum of RhB. Due to the formed photogenerated e/h+ pairs, RhB was oxidized by the h+ generated in the VB of the CdS NPs under visible light, resulting in demethylation. This indicates that the directional structure of RhB varied and resulted in the shift of the maximum absorption peak wavelength of its absorption band to the short wave. Therefore, the absorption spectrum of RhB after photocatalytic degradation using the CdS NPs demonstrates a blue shift.

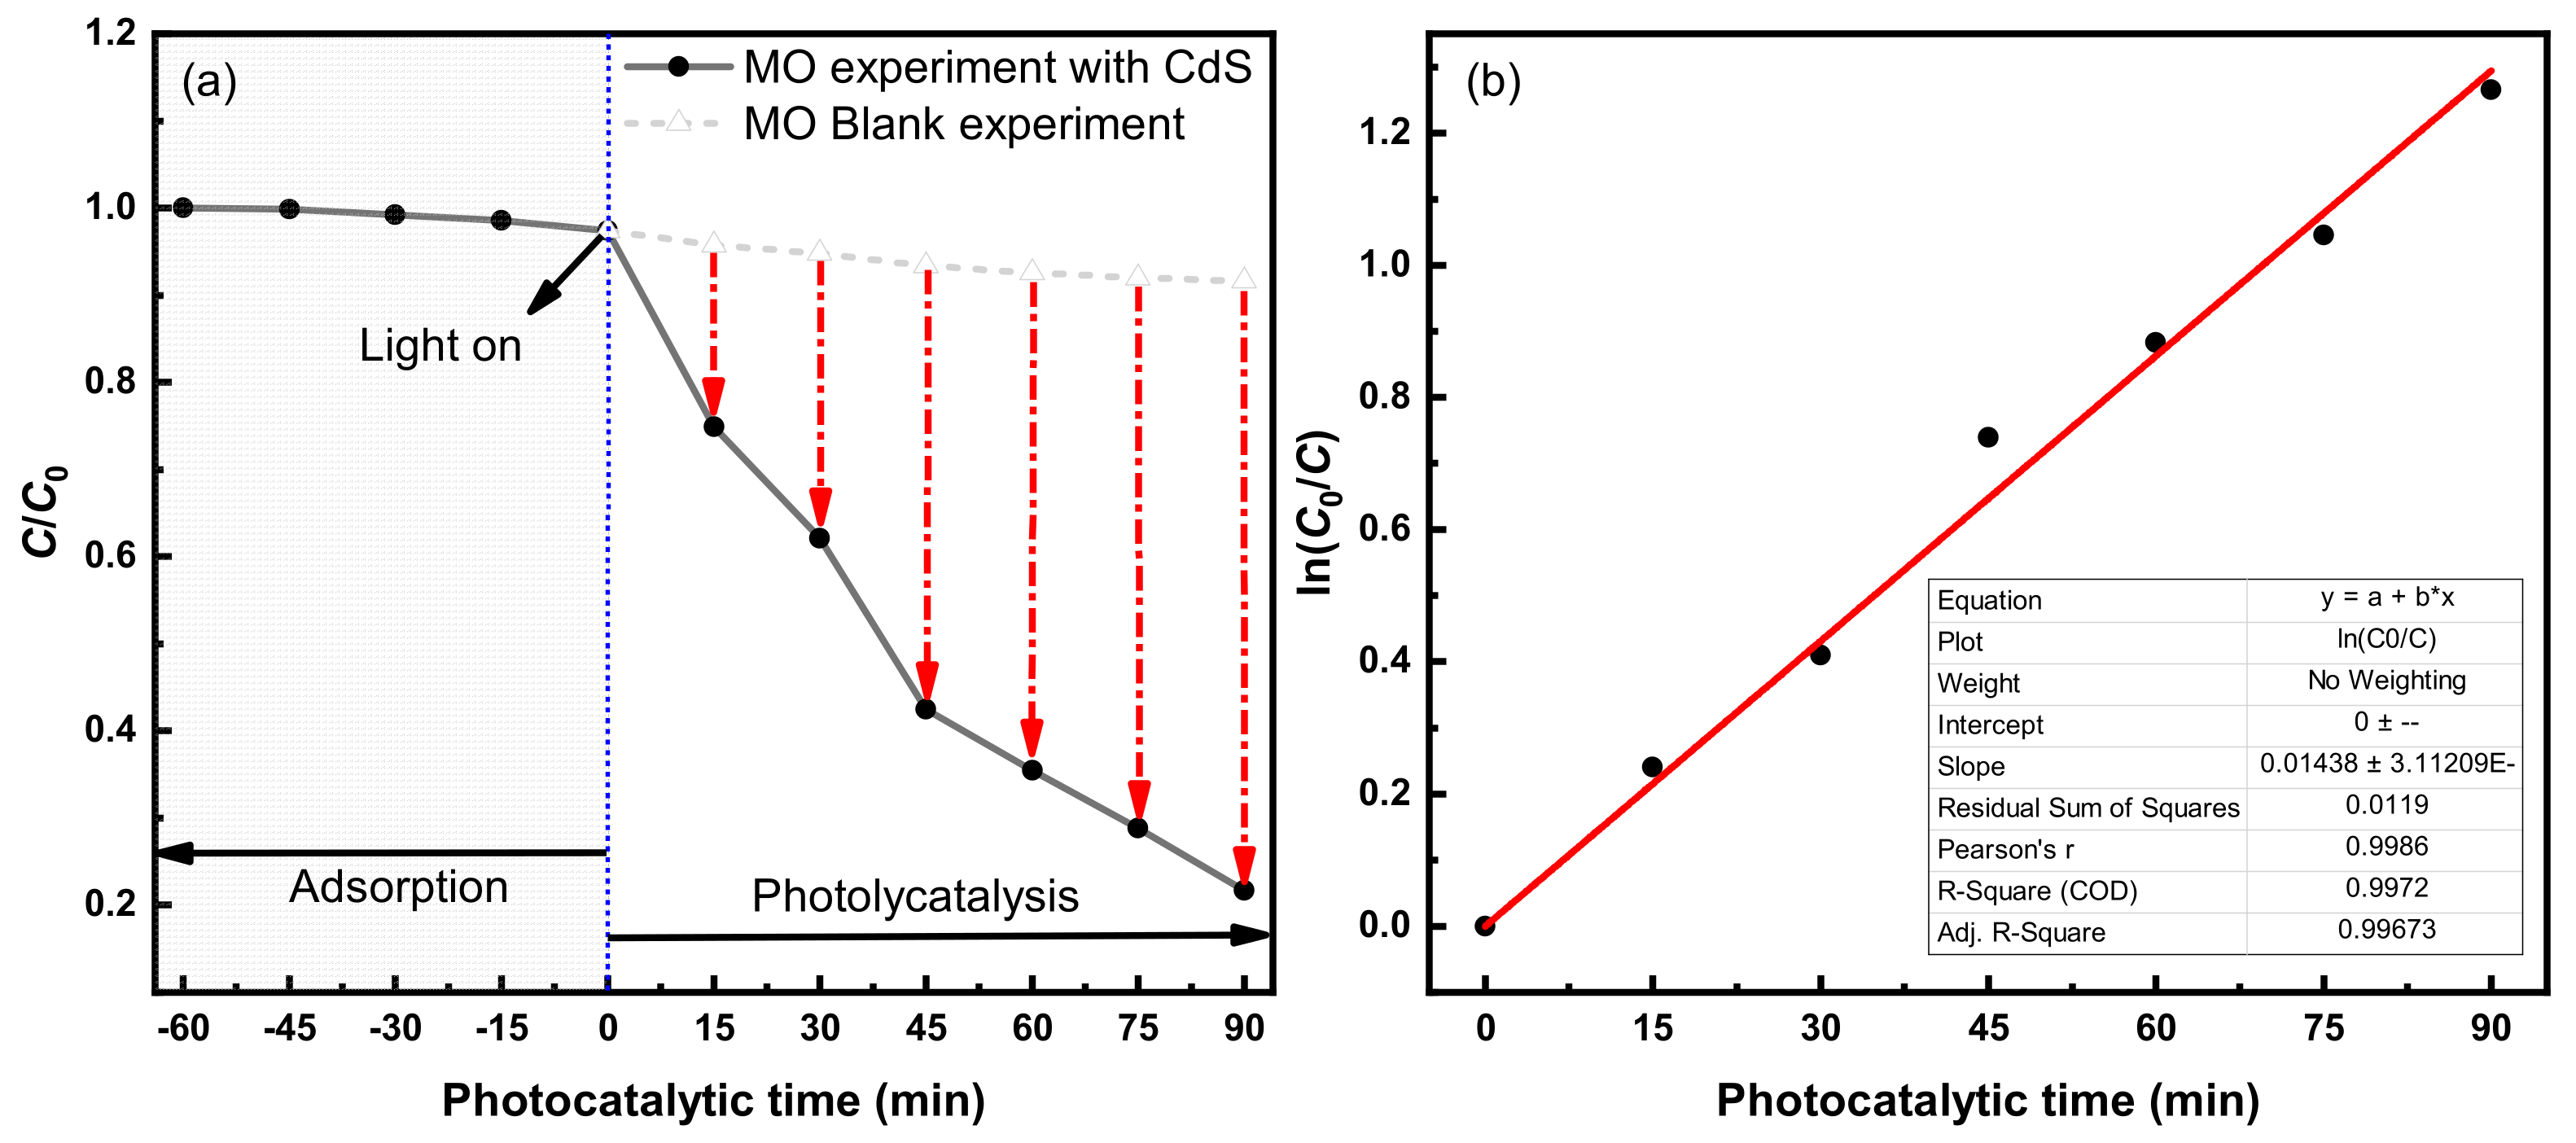
3.2.3. Photocatalytic Degradation Effect of MO

The absorption spectra of the CdS NPs over time during MO photocatalysis are shown in Figure 3c. The adsorption experiment was conducted from −60 to 0 min, and the photocatalytic experiment was conducted from 0 to 90 min. Over time, MO underwent photocatalytic degradation into intermediate products. However, there was barely a blue shift in the absorption spectrum during the photocatalytic degradation of MO. In contrast to the above two organic dyes, MO is a relatively difficult organic pollutant to degrade. The main reason is that its chemical molecular structure is relatively stable. Therefore, MO was too difficult to oxidize by the h+ generated in the VB of the CdS NPs under visible light, which indicates that the directional structure of MO did not vary, so the phenomenon of the shift of the maximum absorption peak wavelength of its absorption band was not obvious.

3.3. Photocatalyst Stability Experiments

The stability of CdS NPs is vital to their photocatalytic activity in organic dye degradation. So, the photocatalytic activity of the CdS NPs for the photocatalytic degradation of organic dyes was studied through an experiment on the recovery of the CdS NPs that had degraded MB under visible light. Specifically, the photocatalytic CdS NPs were recycled, and the newly configured MB was degraded again. Similar experimental conditions needed to be followed in each round of the cyclic degradation experiment. The MB degradation effect under visible light over several cycles is shown in Figure 4. After one, two, and three cycles, the MB degradation rates were 89%, 89%, and 88%, respectively. Consequently, there was no significant reduction in the photocatalytic activity of the CdS NPs after three cycles, indicating their stability and reuse for MB degradation.
The FT-IR spectrum of the photoproduct was also obtained to verify the stability of the CdS NPs, as shown in Figure 5, where the arrows in the figure are toward the functional group or chemical bond. Peaks corresponding to various functional groups were observed at 3423, 1638, 1158, 1008, 658, and 536 cm−1 in the obtained CdS NPs. No notable differences in the spectra before and after photocatalysis were observed. The peaks at 3423, 1638, and 1128 cm−1 can be attributed to OeH stretching (surface-absorbed water in the CdS precipitate) [29], metal–O–H bonds [30], and the –OH mode of water molecules [31], respectively. The absorption band at approximately 1110 cm−1 (1008–1156 cm−1) can be attributed to the formation of S–O bonds between CdS and the adsorbed thiosulfate solution [32]. Finally, the peaks at 670 and 536 cm−1 can be attributed to stretching vibrations of the S–C bonds and Cd–S stretching mode, respectively [33]. Therefore, we conclude that the precipitated CdS NPs contain thiosulfate molecules, and the structure and properties of the CdS NPs are stable before and after photocatalysis.

4. Discussion

4.1. Photocatalytic Degradation Kinetics of the Spherical CdS NPs

4.1.1. Photocatalytic Degradation Rate of MB

The degree of MB degradation was determined from the absorption characteristics at 660 nm. The concentration ratio (C/C0) against the irradiation time under various conditions is shown in Figure 6a, which illustrates the adsorption rate of CdS NPs in the dark (−60–0 min) and their photocatalytic degradation under visible light (0–120 min). The effect of other experimental conditions (e.g., adsorption) on the degradation of organic dyes could be eliminated by dark adsorption. When the adsorption reached equilibrium, the photocatalytic degradation effect of CdS NPs on organic dyes under visible light could be separately studied, which enhanced the accuracy of the experiment [28]. The self-degradation of MB (gray dotted line) was also recorded for comparison. In the dark adsorption stage, approximately 18% of MB was adsorbed; however, in the photocatalytic stage, the self-degradation of MB occurred, and approximately 30% of MB was decomposed. In order to further research the photocatalytic activity of the degradation of MB by using CdS NPs, the first-order kinetic equation of MB degradation using CdS NPs under visible light was studied using the equation ln (C0/C) = kt (see Equation (1)), where C0 and C are the initial concentration of MB and the concentration at t, respectively, and k is the rate constant. The photocatalysis results demonstrate that the concentration ratio (C/C0) decreased to approximately 36% in response to visible-light irradiation after 120 min. As shown in Figure 6b, the blank data were subtracted from the results, and a plot of ln(C0/C) over time (0–120 min) was produced and fitted with a straight line (R2 = 0.98). This graph indicates that the photocatalytic degradation of MB followed a first-order equation with a rate constant of 0.0051 min−1.
r = d C d t = k C 0 ,   ln C 0 C = k t .

4.1.2. Photocatalytic Degradation Rate of RhB

The degree of RhB degradation was determined from the characteristic absorption at 550 nm. The concentration ratio (C/C0) against the irradiation time under various conditions is shown in Figure 7a, which illustrates the adsorption rate of CdS NPs in the dark (−60–0 min) and photocatalytic degradation under visible light (0–60 min). The self-degradation of RhB (gray dotted line) was also recorded for comparison. In the dark adsorption stage, approximately 10% of RhB was adsorbed, and in the photocatalytic stage, the self-degradation of RhB was insignificant (less than 10%), which indicates the conduciveness of photocatalysis. The photocatalysis results demonstrate that the concentration ratio (C/C0) decreased to approximately 90% after 60 min in response to visible-light irradiation, which indicates the significant photocatalytic degradation of RhB. The first-order kinetic equation of the degradation of RhB using CdS NPs under visible light is consistent with the kinetic equation of MB degradation, where C0 and C are the initial concentration of RhB and the concentration at t, respectively, and k is the rate constant. As shown in Figure 7b, the blank data were subtracted from the results, and a plot of ln(C0/C) over time (0–15 min) was produced and fitted with a straight line (R2 = 0.99). This graph indicates that the photocatalytic degradation of RhB followed a first-order equation with a rate constant of 0.0762 min−1.

4.1.3. Photocatalytic Degradation Rate of MO

The degree of MO degradation was determined from the characteristic absorption at 465 nm. The concentration ratio (C/C0) against the irradiation time under various conditions is shown in Figure 8a, which illustrates the adsorption rate of CdS NPs in the dark (−60–0 min) and their photocatalytic degradation under visible light (0–90 min). The self-degradation of MO (gray dotted line) was also recorded for comparison. In the dark adsorption stage, hardly any of the MO was adsorbed. In the photocatalytic stage, the self-degradation of MO was insignificant (approximately 5%), which indicates the conduciveness of photocatalysis. The photocatalysis results demonstrate that the concentration ratio (C/C0) decreased by approximately 80% after 90 min in response to visible-light irradiation, which indicates its good photocatalytic degradation performance. The equation is similar to the kinetic equations of MB and RhB photocatalytic degradation, where C0 and C are the initial concentration of MO and the concentration at t, respectively, and k is the rate constant. As shown in Figure 8b, the blank data were subtracted from the results, and a plot of ln(C0/C) over time (0–90 min) was produced and fitted with a straight line (R2 = 0.99). This graph indicates that the photocatalytic degradation of MO followed a first-order equation with a rate constant of 0.0144 min−1.

4.2. The Degradation Mechanism Study of CdS NPs

Photogenerated e/h+ play a crucial role in the photocatalytic degradation of organic dyes. Based on the above conclusions, the mechanism of photocatalytic degradation of organic dyes by CdS NPs is explained through the degradation reaction of organic dyes. Under visible-light irradiation, when the light energy is more than the band-gap breadth of CdS NPs, the excited e in the VB form photogenerated e with negative charges in the CB and photogenerated h+ with positive charges in the VB; therefore, photogenerated e/h+ pairs are observed. Subsequently, the e and h+ are delivered to the particle surface and react with oxygen (O2) and water (H2O) to form superoxide anion radicals (. O 2 ) and hydroxyl radicals (.OH), which are used as the main active substances of photocatalysts for the degradation of organic dyes. Therefore, photocatalysis relies on the absorption of light by the CdS NPs, which requires excited e to produce photogenerated e/h+ pairs and cause redox reactions, as reported in Murali’s work [34]. The photocatalytic degradation mechanism of the three organic dyes is as follows (see Equations (2)–(7)):
CdS + hv E > Eg CdS + h + + e
h + + H 2 O OH + H +
h + + OH OH ·
e + O 2 O 2
2 H 2 O + O 2 + e 2 OH + 2 OH
OH · + Dye MB   RhB   MO Degradation   products

5. Conclusions

Herein, CdS NPs with high photocatalytic performance were prepared by utilizing the photosensitivity of a cadmium thiosulfate complex. SEM and TEM images revealed that the CdS NPs were spherical with typical diameters of 50–100 nm. The CdS NPs degraded MB, RhB, and MO; there was a blue shift in the absorption spectrum for photocatalytic degradation of MB and RhB when using CdS NPs, which is due to the holes oxidizing the organic dyes to realize dealkylation and demethylation and changing their oriented structures; under the specific visible-light conditions, the photocatalytic degradation efficiencies of the CdS NPs with MB, RhB, and MO were 36%, 90%, and 80%, respectively. Kinetic studies showed that the photocatalytic degradation of the three organic dyes, MB, RhB, and MO, by the CdS NPs followed first-order kinetics with corresponding rate constants of 0.0051, 0.0762, and 0.0144 min−1, respectively. Furthermore, the CdS NPs obtained using UV decomposition exhibited good stability after three cycles of MB degradation. There were no significant differences in the infrared spectra of the CdS NPs before and after photocatalysis, which indicates that their structure and properties were stable. Therefore, this study demonstrates that the photocatalytic activity of CdS NPs can be used to degrade toxic organic pollutants; this provides a basis for the ultimate application of Cd from electronic waste in the field of photocatalysis. In addition, for the multi-component problem of a practical e-waste system, the proposed technology in this work may be a potential method to achieve the expansion of the prospect of recovery in the application of the industrial thiosulfate system and solve the problem of environmental governance, which has high economic and environmental benefits.

Author Contributions

Conceptualization, C.H.; methodology, C.H. and F.L.; resources, F.L. and P.S.; writing—original draft preparation, F.L.; writing—review and editing, C.H.; supervision, G.W., J.L. and Q.C. All authors have read and agreed to the published version of the manuscript.

Funding

This research was funded by the National Natural Science Foundation of China (grant number 52104349), the China Postdoctoral Science Foundation (grant number 2021M690915), and the Key Technologies R & D Program of Henan Province (grant number 222102320435).

Data Availability Statement

Not applicable.

Conflicts of Interest

The authors declare no conflict of interest.

References

  1. Suhani, I.; Sahab, S.; Srivastava, V.; Singh, R.P. Impact of cadmium pollution on food safety and human health. Curr. Opin. Toxicol. 2021, 27, 1–7. [Google Scholar] [CrossRef]
  2. Yamagami, T.; Ezaki, T.; Moriguchi, J.; Fukui, Y.; Okamoto, S.; Ukai, H.; Sakurai, H.; Aoshima, K.; Ikeda, M. Low-level cadmium exposure in Toyama City and its surroundings in Toyama prefecture, Japan, with references to possible contribution of shellfish intake to increase urinary cadmium levels. Sci. Total Environ. 2006, 362, 56–67. [Google Scholar] [CrossRef] [PubMed]
  3. Wang, J.; Xie, F.; Wang, W.; Bai, Y.L.; Fu, Y.; Dreisinger, D. Eco-friendly leaching of gold from a carbonaceous gold concentrate in copper-citrate-thiosulfate solutions. Hydrometallurgy 2020, 191, 105204. [Google Scholar] [CrossRef]
  4. Xu, B.; Li, K.; Dong, Z.l.; Yang, Y.b.; Li, Q.; Liu, X.l.; Jiang, T. Eco-friendly and economical gold extraction by nickel catalyzed ammoniacal thiosulfate leaching-resin adsorption recovery. J. Clean. Prod. 2019, 233, 1475–1485. [Google Scholar] [CrossRef]
  5. Deutsch, J.L.; Dreisinger, D.B. Silver sulfide leaching with thiosulfate in the presence of additives Part I: Copper–ammonia leaching. Hydrometallurgy 2013, 137, 156–164. [Google Scholar] [CrossRef]
  6. Han, C.; Wang, W.; Xie, F.; Zhang, T.A. Mechanism and kinetics of mercuric sulfide leaching with cuprous-thiosulfate solutions. Sep. Purif. Technol. 2017, 177, 223–232. [Google Scholar] [CrossRef]
  7. Xie, F.; Chen, J.N.; Wang, J.; Wang, W. Review of gold leaching in thiosulfate-based solutions. T. Nonferr. Metal. Soc. 2021, 31, 3506–3529. [Google Scholar] [CrossRef]
  8. Ha, V.H.; Lee, J.C.; Huynh, T.H.; Jeong, J.; Pandey, B.D. Optimizing the thiosulfate leaching of gold from printed circuit boards of discarded mobile phone. Hydrometallurgy 2014, 149, 118–126. [Google Scholar] [CrossRef]
  9. Petter, P.M.; Veit, H.M.; Bernardes, A.M. Evaluation of gold and silver leaching from printed circuit board of cellphones. Waste Manag. 2014, 34, 475–482. [Google Scholar] [CrossRef]
  10. Murali, A.; Zhang, Z.; Shine, A.E.; Free, M.L.; Sarswat, P.K. E-wastes derived sustainable Cu recovery using solvent extraction and electrowinning followed by thiosulfate-based gold and silver extraction. J. Hazard. Mater. 2022, 8, 100196. [Google Scholar] [CrossRef]
  11. Dong, Z.L.; Jiang, T.; Xu, B.; Yang, Y.B.; Li, Q. Recovery of Gold from Pregnant Thiosulfate Solutions by the Resin Adsorption Technique. Metals 2017, 7, 555. [Google Scholar] [CrossRef] [Green Version]
  12. Dong, Z.L.; Jiang, T.; Xu, B.; Yang, Y.B.; Li, Q. An eco-friendly and efficient process of low potential thiosulfate leaching-resin adsorption recovery for extracting gold from a roasted gold concentrate. J. Clean. Prod. 2019, 229, 387–398. [Google Scholar] [CrossRef]
  13. Han, C.; Wang, G.X.; Zou, M.J.; Shi, C.Y. Separation of Ag and Cu from Their Aqueous Thiosulfate Complexes by UV-C Irradiation. Metals 2019, 9, 1178. [Google Scholar] [CrossRef] [Green Version]
  14. Wang, W.; Han, C.; Xie, F. Efficient mercury recovery from mercuric-thiosulfate solutions by ultraviolet photolysis. Environ. Chem. Lett. 2018, 16, 1049–1054. [Google Scholar] [CrossRef]
  15. Egorov, N.B.; Eremin, L.P.; Usov, V.F.; Larionov, A.M. Preparation of lead sulfide nanoparticles in the photolysis of aqueous solutions of lead thiosulfate complex. High Energ. Chem. 2007, 41, 251–254. [Google Scholar] [CrossRef]
  16. Han, C.; Wang, G.X.; Cheng, C.; Shi, C.Y.; Yang, Y.C.; Zou, M.J. A kinetic and mechanism study of silver-thiosulfate complex photolysis by UV-C irradiation. Hydrometallurgy 2020, 191, 105212. [Google Scholar] [CrossRef]
  17. Egorov, N.B.; Eremin, L.P.; Larionov, A.M.; Usov, V.F.; Tsepenko, E.A.; D’yachenko, A.S. Products of photolysis of cadmium thiosulfate aqueous solutions. High Energ. Chem. 2011, 42, 119–122. [Google Scholar] [CrossRef]
  18. Iqbal, T.; Ali, F.; Khalid, N.R.; Tahir, M.B.; Ijaz, M. Facile synthesis and antimicrobial activity of CdS-Ag2S nanocomposites. Bioorg. Chem. 2019, 90, 103064. [Google Scholar] [CrossRef]
  19. Jafari, L.; Pourahmad, A.; Asadpour, L. Rice husk based MCM-41 nanoparticles loaded with Ag2S nanostructures by a green and room temperature method and its antimicrobial property. Inorg. Nano-Met. Chem. 2017, 47, 1552–1559. [Google Scholar] [CrossRef]
  20. Devi, R.A.; Latha, M.; Velumani, S.; Oza, G.; Reyes-Figueroa, P.; Rohini, M.; Becerril-Juarez, I.G.; Lee, J.H.; Yi, J. Synthesis and Characterization of Cadmium Sulfide Nanoparticles by Chemical Precipitation Method. J. Nanosci. Nanotechnol. 2015, 15, 8434–8439. [Google Scholar] [CrossRef]
  21. Bie, C.; Fu, J.; Cheng, B.; Zhang, L. Ultrathin CdS nanosheets with tunable thickness and efficient photocatalytic hydrogen generation. Appl. Surf. Sci. 2018, 462, 606–614. [Google Scholar] [CrossRef]
  22. Xia, Z.L.; Yu, R.; Yang, H.; Luo, B.F.; Huang, Y.Y.; Li, D.; Shi, J.Y.; Xu, D.B. Novel 2D Zn-porphyrin metal organic frameworks revived CdS for photocatalysis of hydrogen production. Int. J. Hydrogen Energy 2022, 47, 13340–13350. [Google Scholar] [CrossRef]
  23. Tan, Y.; Zhang, Z.; Guo, F.Q.; Guo, R.Q.; Bai, H.N.; Zhang, B.H.; Li, X.; Qian, Y.; Liu, X.B. Facile Synthesis of Hexagonal CdS Nanofilm on FTO Glass Substrate via Hydrothermal Method. Int. J. Electrochem. Sci. 2020, 15, 10129–10140. [Google Scholar] [CrossRef]
  24. Hernandez-Gordillo, A.; Oros-Ruiz, S.; Gomez, R. Preparation of efficient cadmium sulfide nanofibers for hydrogen production using ethylenediamine (NH2CH2CH2NH2) as template. J. Colloid Interface Sci. 2015, 451, 40–45. [Google Scholar] [CrossRef]
  25. Bie, C.; Zhu, B.; Xu, F.; Zhang, L.; Yu, J. In Situ Grown Monolayer N-Doped Graphene on CdS Hollow Spheres with Seamless Contact for Photocatalytic CO(2) Reduction. Adv. Mater. 2019, 31, e1902868. [Google Scholar] [CrossRef]
  26. He, B.W.; Bie, C.B.; Fei, X.G.; Cheng, B.; Yu, J.G.; Ho, W.K.; Al-Ghamdi, A.A.; Wageh, S. Enhancement in the photocatalytic H2 production activity of CdS NRs by Ag2S and NiS dual cocatalysts. Appl. Catal. B-Environ. 2021, 288, 119994. [Google Scholar]
  27. Shen, R.; Ren, D.; Ding, Y.; Guan, Y.; Ng, Y.H.; Zhang, P.; Li, X. Nanostructured CdS for efficient photocatalytic H2 evolution: A review. Sci. China Mater. 2020, 63, 2153–2188. [Google Scholar] [CrossRef]
  28. Wang, C.; Zhai, J.l.; Jiang, H.; Liu, D.c.; Zhang, L. CdS/Ag2S nanocomposites photocatalyst with enhanced visible light photocatalysis activity. Solid State Sci. 2019, 98, 106020. [Google Scholar] [CrossRef]
  29. Oghabi, H.; Haghshenas, D.F.; Firoozi, S. Selective separation of Cd from spent Ni-Cd battery using glycine as an eco-friendly leachant and its recovery as CdS nanoparticles. Sep. Purif. Technol. 2020, 242, 116832. [Google Scholar] [CrossRef]
  30. Maleki, M.; Haghighi, M. Sono-dispersion of CuS-CdS over TiO 2 in one-pot hydrothermal reactor as visible-light-driven nanostructured photocatalyst. J. Mol. Catal. A-Chem. 2016, 424, 283–296. [Google Scholar] [CrossRef]
  31. Lu, X.; Yu, Y.; Chen, L.; Mao, H.; Zhang, W.; Wei, Y. Preparation and characterization of polyaniline microwires containing CdS nanoparticles. Chem. Commun. 2004, 13, 1522–1523. [Google Scholar] [CrossRef]
  32. Banizi, Z.T.; Seifi, M.; Askari, M.B.; Dehaghi, S.B.; Zadeh, M.H.R. Photoluminescence and photocatalytic studies of cadmium sulfide/multiwall carbon nanotube (CdS/MWCNT) nanocomposites. Optik 2018, 158, 882–892. [Google Scholar] [CrossRef]
  33. Nandi, P.; Das, D. ZnO/CdS/CuS heterostructure: A suitable candidate for applications in visible-light photocatalysis. J. Phys. Chem. Solids 2022, 160, 110344. [Google Scholar] [CrossRef]
  34. Murali, A.; Sarswat, P.K.; Free, M.L. Adsorption-coupled reduction mechanism in ZnO-Functionalized MWCNTs nanocomposite for Cr (VI) removal and improved anti-photocorrosion for photocatalytic reduction. J. Alloy. Compd. 2020, 843, 155835. [Google Scholar] [CrossRef]
Figure 1. Flow chart of the whole experiment.
Metals 13 00554 g001
Figure 2. SEM images of CdS (a,b), TEM images of CdS (ce), and histogram of particle size (f).
Metals 13 00554 g002
Figure 3. The absorption spectra of CdS NPs during MB (a), RhB (b), and MO (c) photocatalysis at different times (298 K, mCdS = 25 mg; [MB, RhB, and MO] = 10 mg L−1; V = 100 mL).
Metals 13 00554 g003
Figure 4. Photocatalytic stability test of CdS NPs in recycling reactions.
Metals 13 00554 g004
Figure 5. The FT-IR study of CdS NPs before and after photocatalysis ([Cd] = 80 mg L−1; [S2O32−] = 0.01 mol L−1; 298 K; uncontrolled pH).
Metals 13 00554 g005
Figure 6. Time-course variation of C/C0 toward MB ((a) C/C0 vs. time; (b) ln(C0/C) vs. time).
Metals 13 00554 g006
Figure 7. Time-course variation of C/C0 toward RhB ((a) C/C0 vs. time; (b) ln(C0/C) vs. time).
Metals 13 00554 g007
Figure 8. Time-course variation of C/C0 toward MO ((a) C/C0 vs. time; (b) ln(C0/C) vs. time).
Metals 13 00554 g008
Disclaimer/Publisher’s Note: The statements, opinions and data contained in all publications are solely those of the individual author(s) and contributor(s) and not of MDPI and/or the editor(s). MDPI and/or the editor(s) disclaim responsibility for any injury to people or property resulting from any ideas, methods, instructions or products referred to in the content.

