Article

Deformation and Fracture Characterization of an Mg-Sn-Ca Alloy Using 3D Processing Maps

1
College of Mechanical Engineering, Taiyuan University of Science and Technology, Taiyuan 030024, China
2
Heavy Machinery Engineering Research Center of the Ministry of Education, Taiyuan University of Science and Technology, Taiyuan 030024, China
3
Part Rolling Key Laboratory of Zhejiang Province, Ningbo University, Ningbo 315211, China
*
Author to whom correspondence should be addressed.
Metals 2023, 13(4), 645; https://doi.org/10.3390/met13040645
Submission received: 17 February 2023 / Revised: 14 March 2023 / Accepted: 21 March 2023 / Published: 24 March 2023
(This article belongs to the Special Issue Advances in Machining Processes of Metallic Materials)

Abstract

:
The deformation and fracture characterization of an Mg−2Sn−1Ca alloy were studied through uniaxial isothermal compression tests. The flow stress curves, the efficiency of power dissipation, the instability parameter and the fracture behavior of an Mg−2Sn−1Ca alloy under the condition of various hot working parameters were investigated according to the experimental data. Processing maps were established by superimposing the instability map over the power dissipation map. It was found that flow stress reduces with increases in the deformation temperature and decreases in the strain rate. The processing of Mg−2Sn−1Ca alloys should avoid the instability region in which the conditions are high strain under high temperature and low strain under low temperature. At 473 K or a high strain rate, unidirectional cracks and fish scale cracks can be produced, and cracks can be avoided under the optimum processing area of 623–723 K/0.001–0.1 s−1.

1. Introduction

Magnesium alloys are extremely useful structural materials for automotive and aerospace industries because of their high strength, low density and good machinability compared to other metals and alloys [1,2]. Alloying is one of the most effective approaches to improve both mechanical properties and corrosion resistance of magnesium alloys [3].
In order to study the effect of the Ca element on the properties of magnesium alloy, Zeng et al. [4] monitored the texture evolution during the cold rolling process of Mg-Zn-Ca and Mg-Zn alloys by using a quasi-in situelectron backscatter diffraction (EBSD) technique. The Ca addition delays the development of a strong basal texture by reducing the growth of deformation twins instead of causing any texture weakening effect. Zhu et al. [5] observed that the pyramidal I slip lines were associated with <a> dislocations instead of <c + a> dislocations by ex situ transmission electron microscopy (TEM). Pyramidal II <c + a> slip lines were occasionally found when the strain was higher than 8%. According to the Schmid factor, the critical shear stresses of prismatic slip and pyramidal <a> slip were approximately twice that of basal slip in extrusion Mg-0.47 wt% Ca alloy. The enhanced activity of non-basal <a> slips improved the material’s ductility. The magnesium alloy containing Ca can also improve the strength of material effectively. Both Ca concentrations and strain rates could be used to control the activation of stacking faults (SFs) in Mg alloys, which can affect the formation of deformation twins. Increasing Ca concentration may promote deformation twinning, shifting the dominant deformation mode from basal slipping in a TX21 alloy to activations of SFs in an X2 alloy under a lower strain rate. An increasing strain rate can also promote deformation twinning and contribute to the higher density of SFs [6]. After adding an Sn element, the ultimate tensile strength of an as-extruded Mg−2Sn−1Ca alloy could reach ≥300 MPa, and elongation is as high as ~12% [7]. At the same time, alloys based on the system Mg-Sn-Ca could compete with AZ91 in corrosion properties, and the creep resistance was remarkably improved, which is equivalent to the creep resistance of AE42 [8]. Thus, the new Mg-Sn-Ca alloy has the potential to improve the properties of magnesium alloys and expand the application range of magnesium alloys.
However, Mg and its alloys have poor mechanical properties and formability under room temperature because of the hexagonal pack (HCP) crystal structure [9]. Thermal machining is ideal for enhancing workability and obtaining satisfactory mechanical properties. It is generally considered that the deformation ability of alloys can be expressed by the true stress–strain curve [10]. However, the quality of hot processing is highly dependent on the extremely complex nonlinear relationship between machining parameters and the microstructure transformations of the alloy. Therefore, it is necessary to reveal the thermal deformation characteristics of the alloy. In addition, the flow stress changes under different thermal working parameters, such as deformation temperature, strain and strain rate, could be described by the constitutive equations [11]. More importantly, the hot processing map proposed by Prasad is a powerful tool to control the hot processing parameters of various alloys and improve the hot processing ability of various alloys [12]. Many scholars have applied this method to Mg and its alloys. For example, the hot deformation behavior of the as-extruded and extruded Mg-2.5Gd-0.5Zr alloy was compared by Ebrahimpourghandi [13]—the processing map of an alloy was established, and the optimum processing parameters were acquired. Zhang et al. [14] carried out hot compression tests on a new Mg-Al-based alloy and analyzed its thermal deformation behavior, microstructure evolution, texture and dynamic recrystallization (DRX). These studies are significant for developing and applying new Mg alloys.
In this paper, the hot processing map of an Mg−2Sn−1Ca alloy was established through uniaxial isothermal compression tests, and the alloy’s flow stress–strain curve, activation energy and fracture morphology were studied. The deformation and fracture behavior of the as-cast alloy under different deformation conditions were analyzed.

2. Experimental

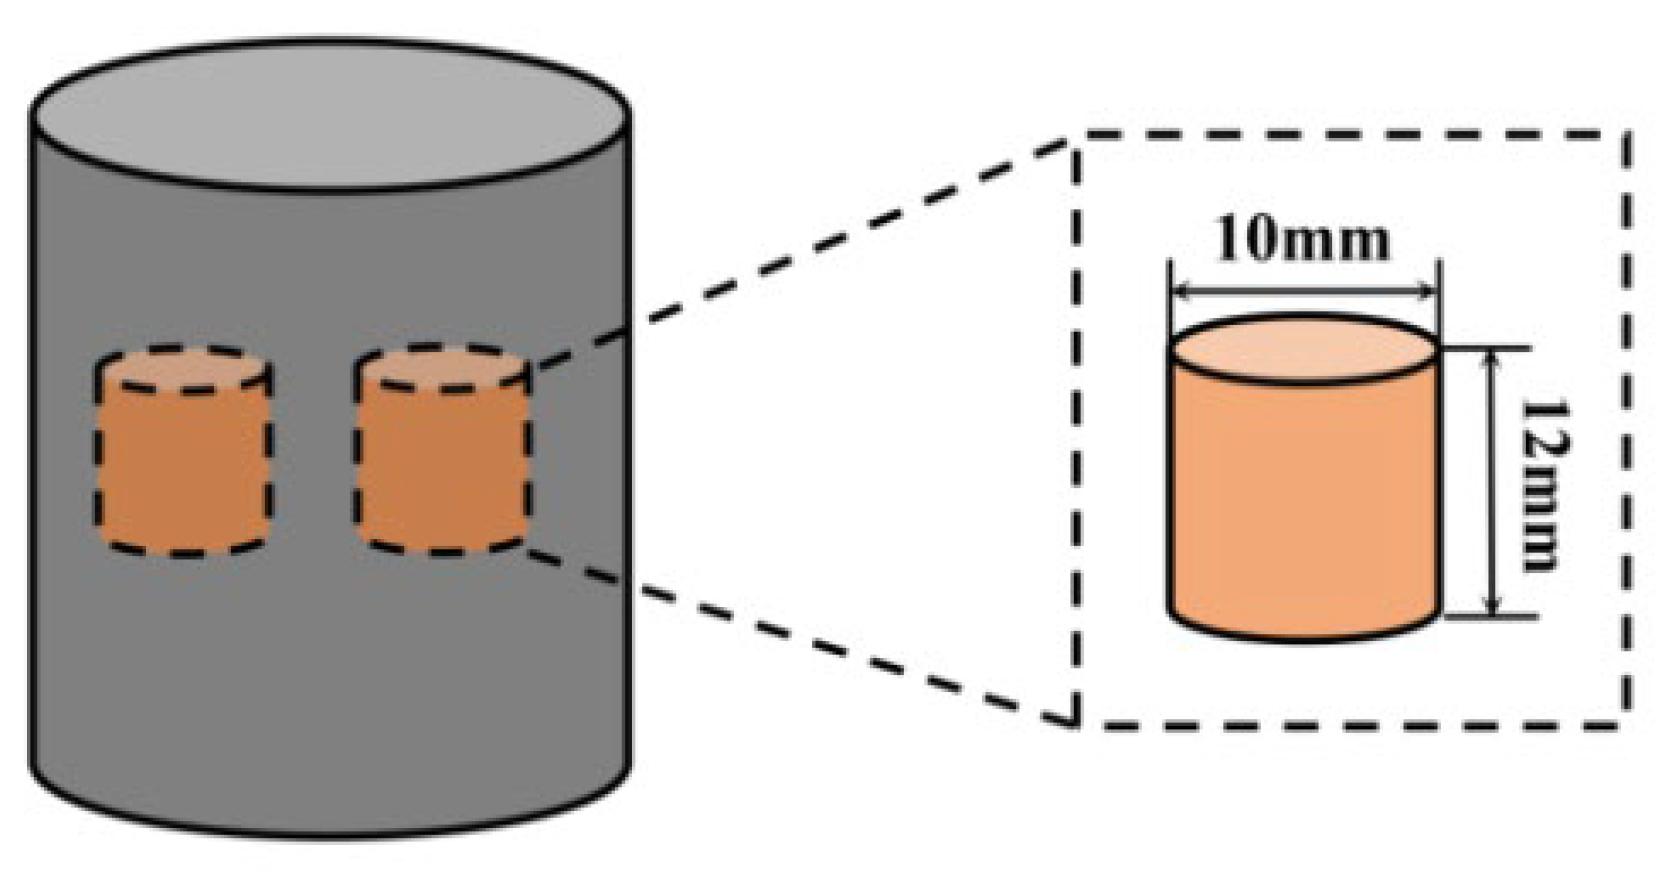
2.1. Experiment Materials

An ingot with a nominal composition of Mg−2Sn−1Ca was prepared by melting pure commercial Mg (>99.99%), Sn (>99.95%) and Ca (>99.99%) in an electrical resistance furnace. After grinding pure magnesium, it was put into a preheated crucible for melting under 993 K. The crucible was made of medium carbon steel coated with heat-resistant steel. It should be noted that about 0.1% wt Mn was added to remove Fe impurities in the Mg raw material during the melting of the Mg-Sn-Ca alloy, and a shielding gas mixed with CO2 and SF6 (100:1) was injected simultaneously. Sn and Ca pieces were added when the magnesium was melted entirely, and impurity was removed. The alloy solution was kept at 993 K for 25 min and stirred for 2 min to dissolve the alloy elements completely. The ingot with dimensions of Φ 40 mm × 160 mm was prepared after being cast at 973 K and cooled at room temperature for 3 min. After the ingot was obtained, it was homogenized at a temperature of 783 K for 11 h before being subjected to hot compression. The microstructure is shown in Figure 1.
As shown in Figure 1, elements of Ca and Sn are distributed in grains and grain boundaries, and the segregation degree at the grain boundaries is more significant than that in grains. This indicates that the rod particles inhibit the growth of recrystallized grains during homogenization. EDS elemental maps clearly show that these nanoscale particles are mainly compounds composed of Ca and Sn, which were proven to be Mg2Sn and Mg2Ca phases, according to the report from Nayyeri [15].

2.2. Experiment Methods

The hot deformation behavior of the Mg−2Sn−1Ca alloy was studied by the Gleeble 3800 thermal simulation test. The compression samples were 10 mm in diameter and 12 mm in height. The schematic illustration of cutting out samples from ingot is shown in Figure 2. The initial deformation temperature was 473 K, 523 K, 573 K, 623 K, 673 K, and the strain rate was 0.001 s−1, 0.01 s−1, 0.1 s−1and 1 s−1, respectively. A resistance furnace was adopted to increase the temperature at the rate of 5 K/s and keep them for 180 s after reaching the specified temperature. The maximum deformation reduction in the experiment was 60%. After the deformation, the microstructure state at high temperature was retained by water quenching. The relationship between deformation conditions and deformation microstructure was analyzed, and the possible deformation mechanism of the new alloy was discussed. The microstructure and fracture morphology under different processing parameters were characterized by optical microscopy (OM) and scanning electronic microscopy (SEM). The specimens were mechanically ground and polished with diamond sandpaper and silica suspension. The particle size of silica suspension is 0.1 μm. Then, specimens were etched with picric acid (3 g), acetic acid (20 mL), distilled water (20 mL), and an ethanol (50 mL) solution to observe grain structure and fractures through a Zeiss SIGMA300 scanning electron microscope.

3. Results and Discussion

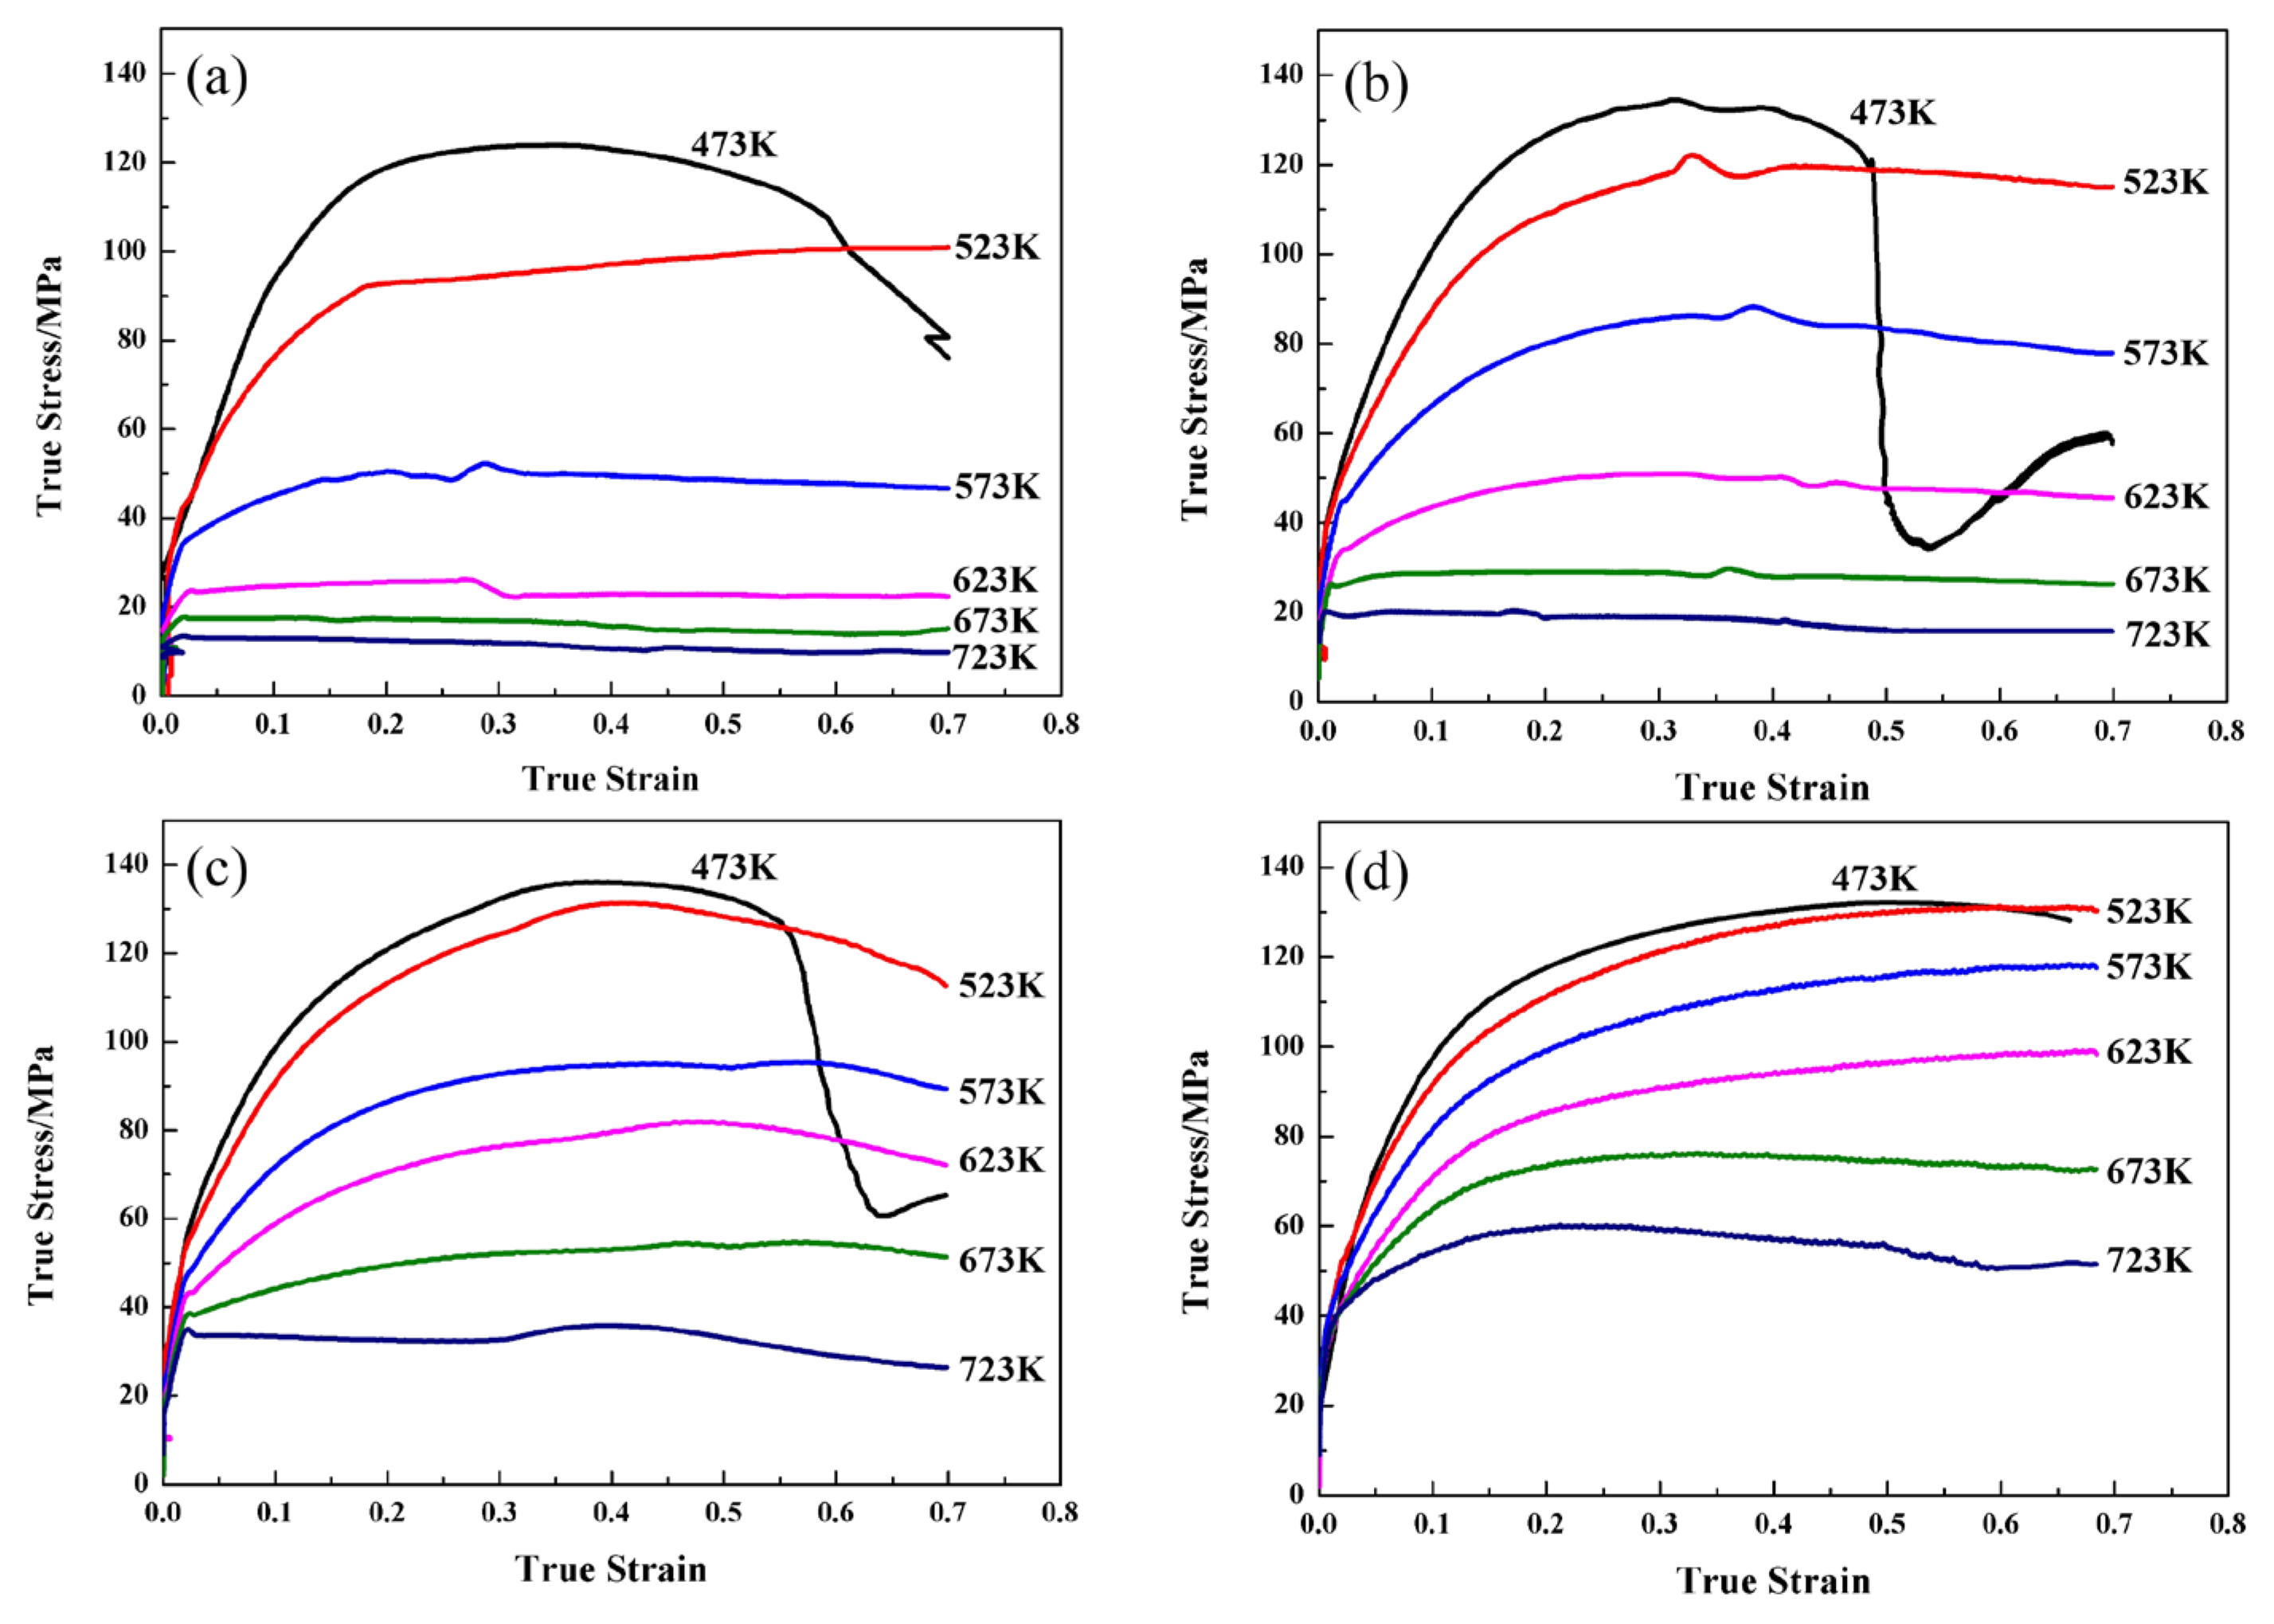
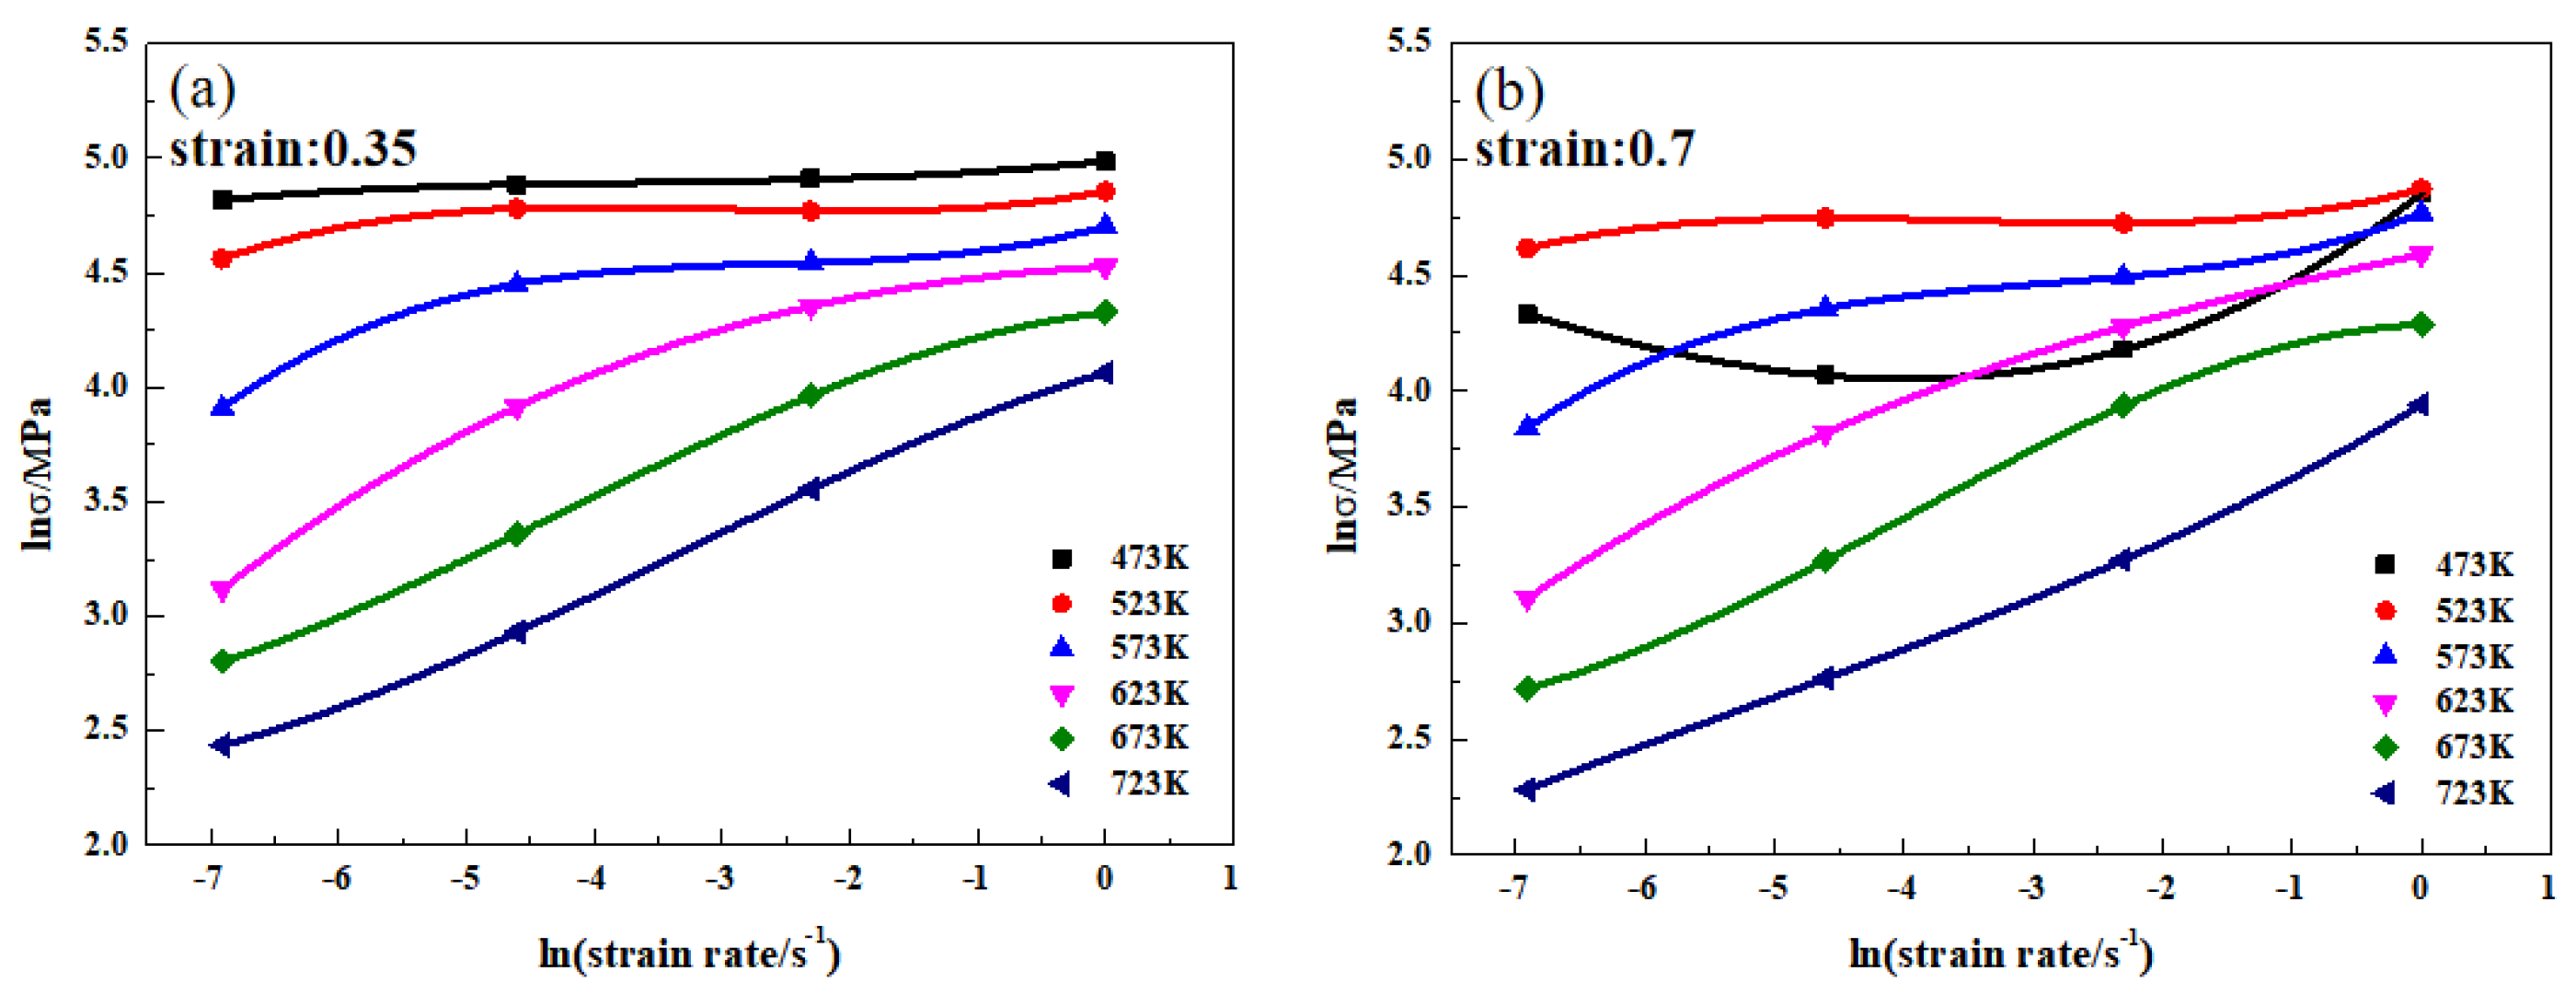
3.1. Flow Curves and Softening Analyses

The stress–strain curves of the specimens are shown in Figure 3. It can be seen from Figure 3 that the true stress-true strain curves of the Mg−2Sn−1Ca alloy have similar trends under different deformation conditions. The flow stress decreases with the increase in test temperature and the decrease in strain rate. First, the stress increases rapidly under a small strain, which can be ascribed to work-hardening. The dislocation increases and accumulates rapidly in the work-hardening stage, leading to a rapid increase in flow stress. Then, following the flow softening stage, the stress increases slowly. The effect of hardening can be partially offset by the occurrence of the dynamic softening mechanism in the softening stage, resulting in a slow increase or decrease in flow stress. Finally, the stabilization phase at high strain arrives. In addition, specimens tested at high temperatures indicate a steady-state flow region, and the lower the initial strain rate, the longer the stable flow stress is sustained. It is thought that dynamic recovery (DRV) or recrystallization occurs and deformation progresses with the balancing of work-hardening in the steady-state flow region [16].

3.2. Establishment of the Processing Map

3.2.1. The Principle of the Processing Map

The dynamic materials model (DMM), first proposed by Prasad et al. [17], is widely used in the establishment of processing maps, which combine the power dissipation diagram and the instability diagram to select the appropriate processing area. The per unit of input energy P is divided into two parts: dissipation quantity (G) and dissipation co-quantity (J). Their relationship can be expressed as follows:
P = σ ε = G + J = 0 ε σ d ε + 0 σ ε d σ
where G content is the power generated by the occurrence of plastic deformation, and J is the energy consumed by the material in the process of tissue evolution during deformation, such as DRV and DRX. In addition, strain sensitivity (m) is defined by the ratio of G to J in the hot deformation:
m = J G = ε σ σ = ln σ ln ε ε , T
Obviously, m has a nonlinear relationship with deformation temperature and strain rate. The value of J reaches the maximum and m reaches 1 when the material is under an ideal linear dissipation state.
The m value can be calculated from the fitting line shown in Figure 4. η is the power consumption efficiency, and its value is the ratio of J to Jmax. Dimensionless parameters are expressed as microstructure changes during thermal deformation and as a function of strain rate sensitivity:
J max = 1 2 σ ε = P 2
η = J J max = 2 m m + 1
The different calculated η will be expressed in the form of isolines on the plane of T ε , which is the power dissipation diagram [18]. In general, materials with excellent processability have higher power dissipation values. It can be inferred that lower power dissipation values characterize the materials with some microscopic defects. However, this statement does not hold water in the opposite direction. That is to say, when the power dissipation value is relatively high, the material is likely to have superior processing properties. However, the power dissipation value is also high when there are micro cracks or even breaks inside the materials. Prasad established the instability criterion of the plastic deformation of materials according to the principle of irreversible thermodynamics applied to large plastic rheology. The rheological instability criterion is shown in Equation (5). When the value is negative, the material is considered unstable over the corresponding deformation temperature and strain rate range, mainly occurring in the form of abiabtic shear bands, cracks or flow localization in the microstructure [19].
ξ ( ε , T ) = ln ( m m + 1 ) ln ( ε ) + m < 0

3.2.2. Values of the Power Dissipation (η%) under Different Parameters

As seen in Figure 5, power dissipation efficiency fluctuates greatly with the increase in temperature and strain rate under different strains. The regularity of η with temperature is similar at 0.01 s−1 and 0.1 s−1 strain rates. There is a linear relationship between temperature and power dissipation value. The higher the temperature, the greater the power dissipation value. It indicates that the alloy may have superior workability under these conditions. However, η fluctuates greatly with temperature at 0.001 s−1 and 1 s−1 strain rates.
Figure 6 shows the 3D distribution diagram of power dissipation efficiency changing with deformation temperature, strain rate and strain, where the color scale bar represents the power dissipation efficiency. It can be seen from Figure 6 that the region of high-power dissipation efficiency expands with the increase in temperature. The efficiency of power dissipation increases with the increase in temperature and the decrease in strain rate. This is because dislocation such as DRX occurs with the increase in strain. During this period, the rearrangement or annihilation of dislocations and some micro-structure variations will consume stored energy according to the report from Ke et al. [20].

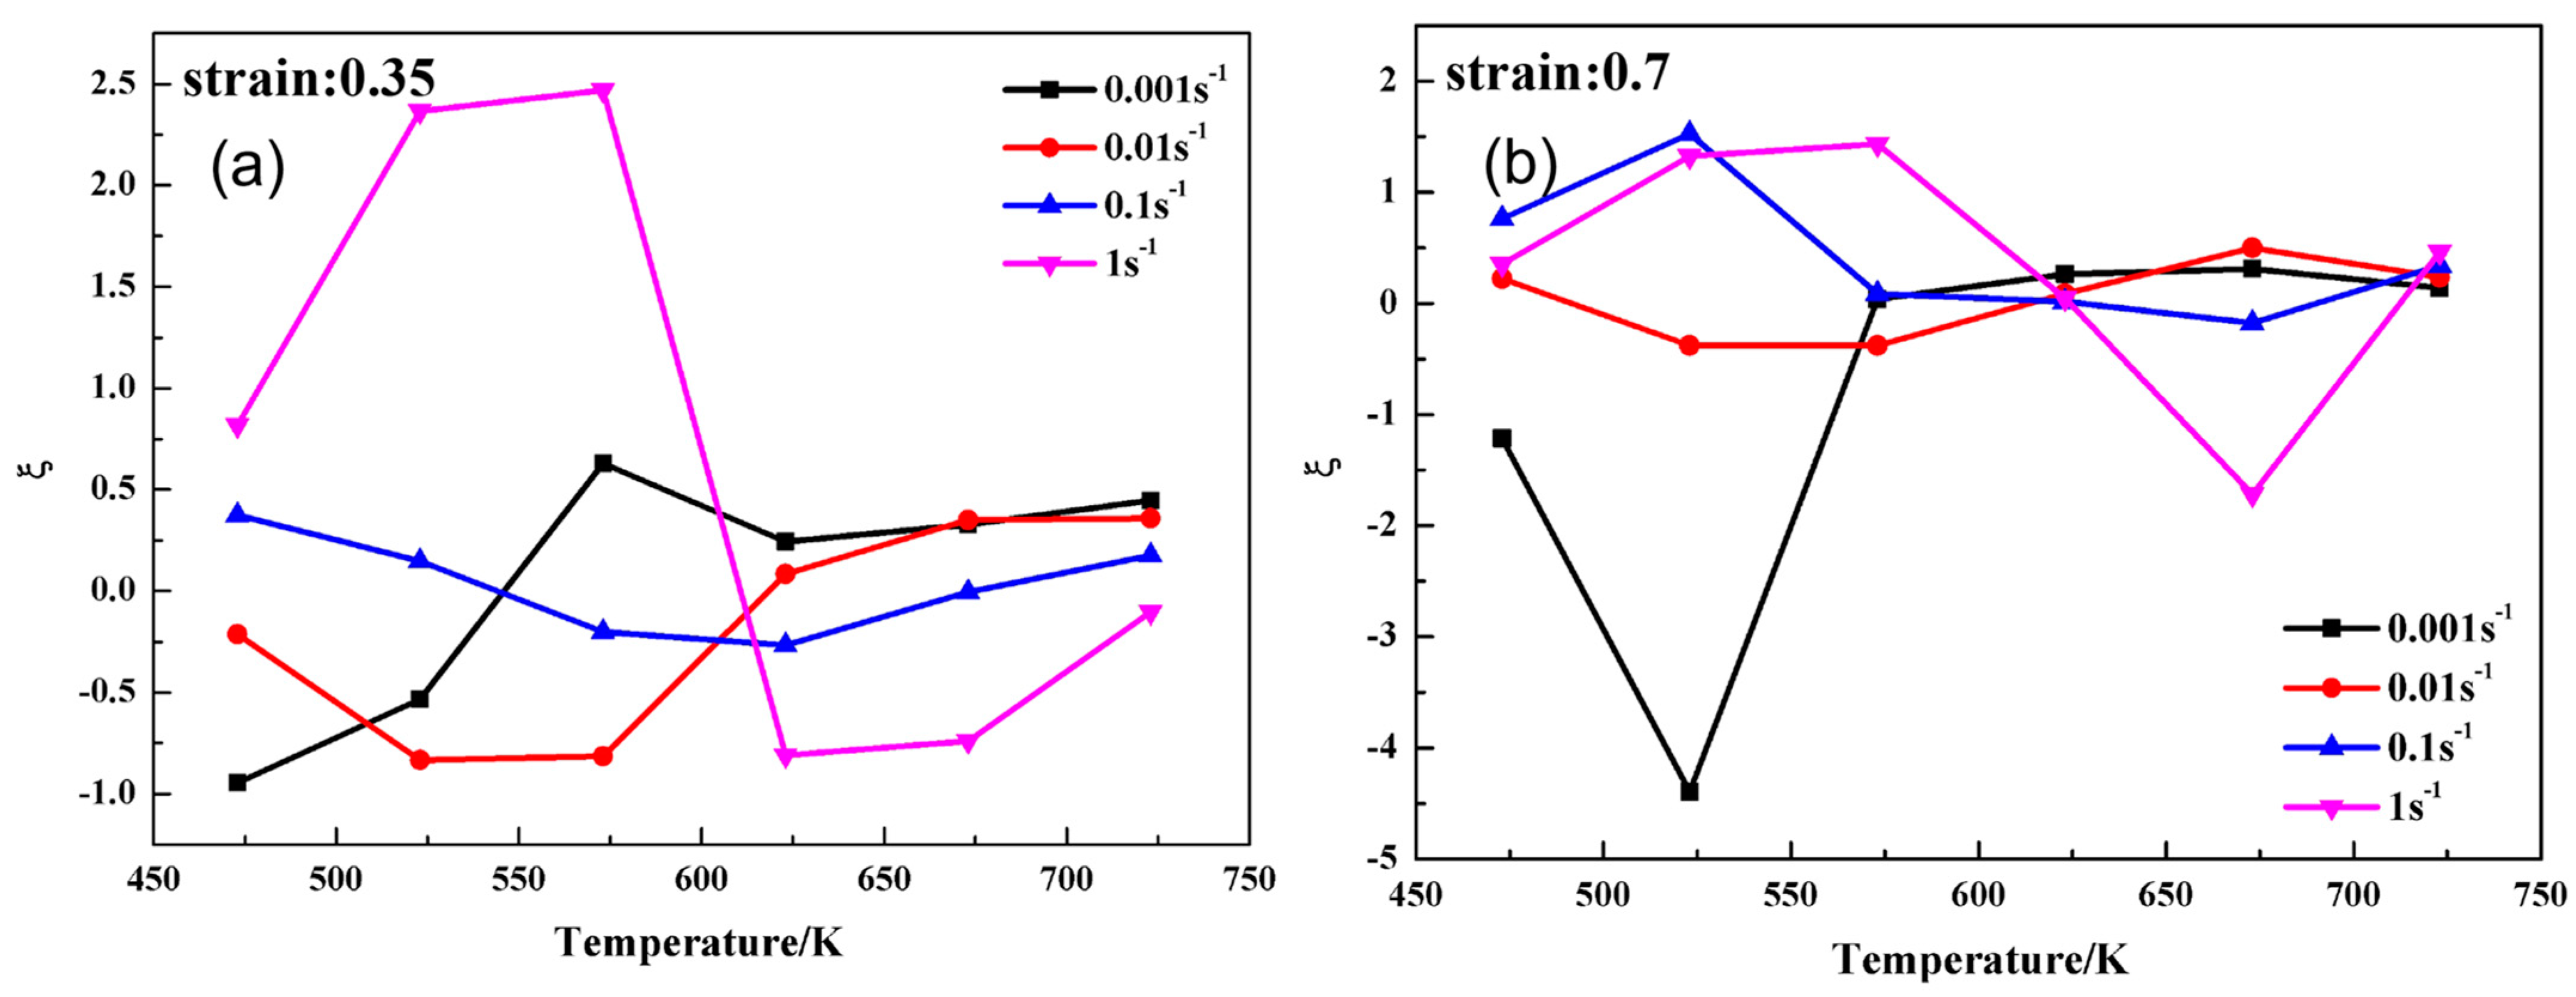
3.2.3. Values of the Instability Parameter (ξ) under Different Parameters

The variation in the instability parameter of the Mg−2Sn−1Ca alloy under different conditions is shown in Figure 7. Obviously, the variation trend of the instability parameter is similar under different strains when the strain rate is 0.01 s−1. The law of ξ varying along with processing parameters can be divided into two groups—the high strain rate group (0.1 s−1, 1 s−1) and low strain rate group (0.001 s−1, 0.01 s−1). Overall, the instability parameter (ξ) of the low strain rate group increases with and then exceeds the ξ value of the high strain rate group with the increase in deformation temperature. This indicates that the material is relatively stable under high temperatures with low strain rates and low temperatures with high strain rates. A uniform, fine deformation microstructure can be obtained under high strain rates while instability phenomena occur more easily, thus identifying that the variation of ξ is the cause of microstructure changes, according to the report from Sun et al. [21].
The ξ values fluctuate under low deformation temperatures. The instability parameter approaches zero when the temperature is up to 700 K. It can be referred that the high deformation temperature condition is more suitable for the processing of the material.
A 3D distribution diagram of instability parameters changing with the deformation temperature, strain rate and strain is shown in Figure 8, where four strain sections are instability graphs of 0.2, 0.35, 0.5 and 0.7, respectively. The instability map is divided into two parts by ξ; the region where ξ is less than 0 is defined as “instability”, shown in yellow, while the purple region is “stable”, in which ξ is greater than 0. Overall, the instability domain for each strain accounts for a large part, more than half. Compared with different strain sections, most instability areas are concentrated in areas with high strain rates at high temperatures and low strain rates at low temperatures.

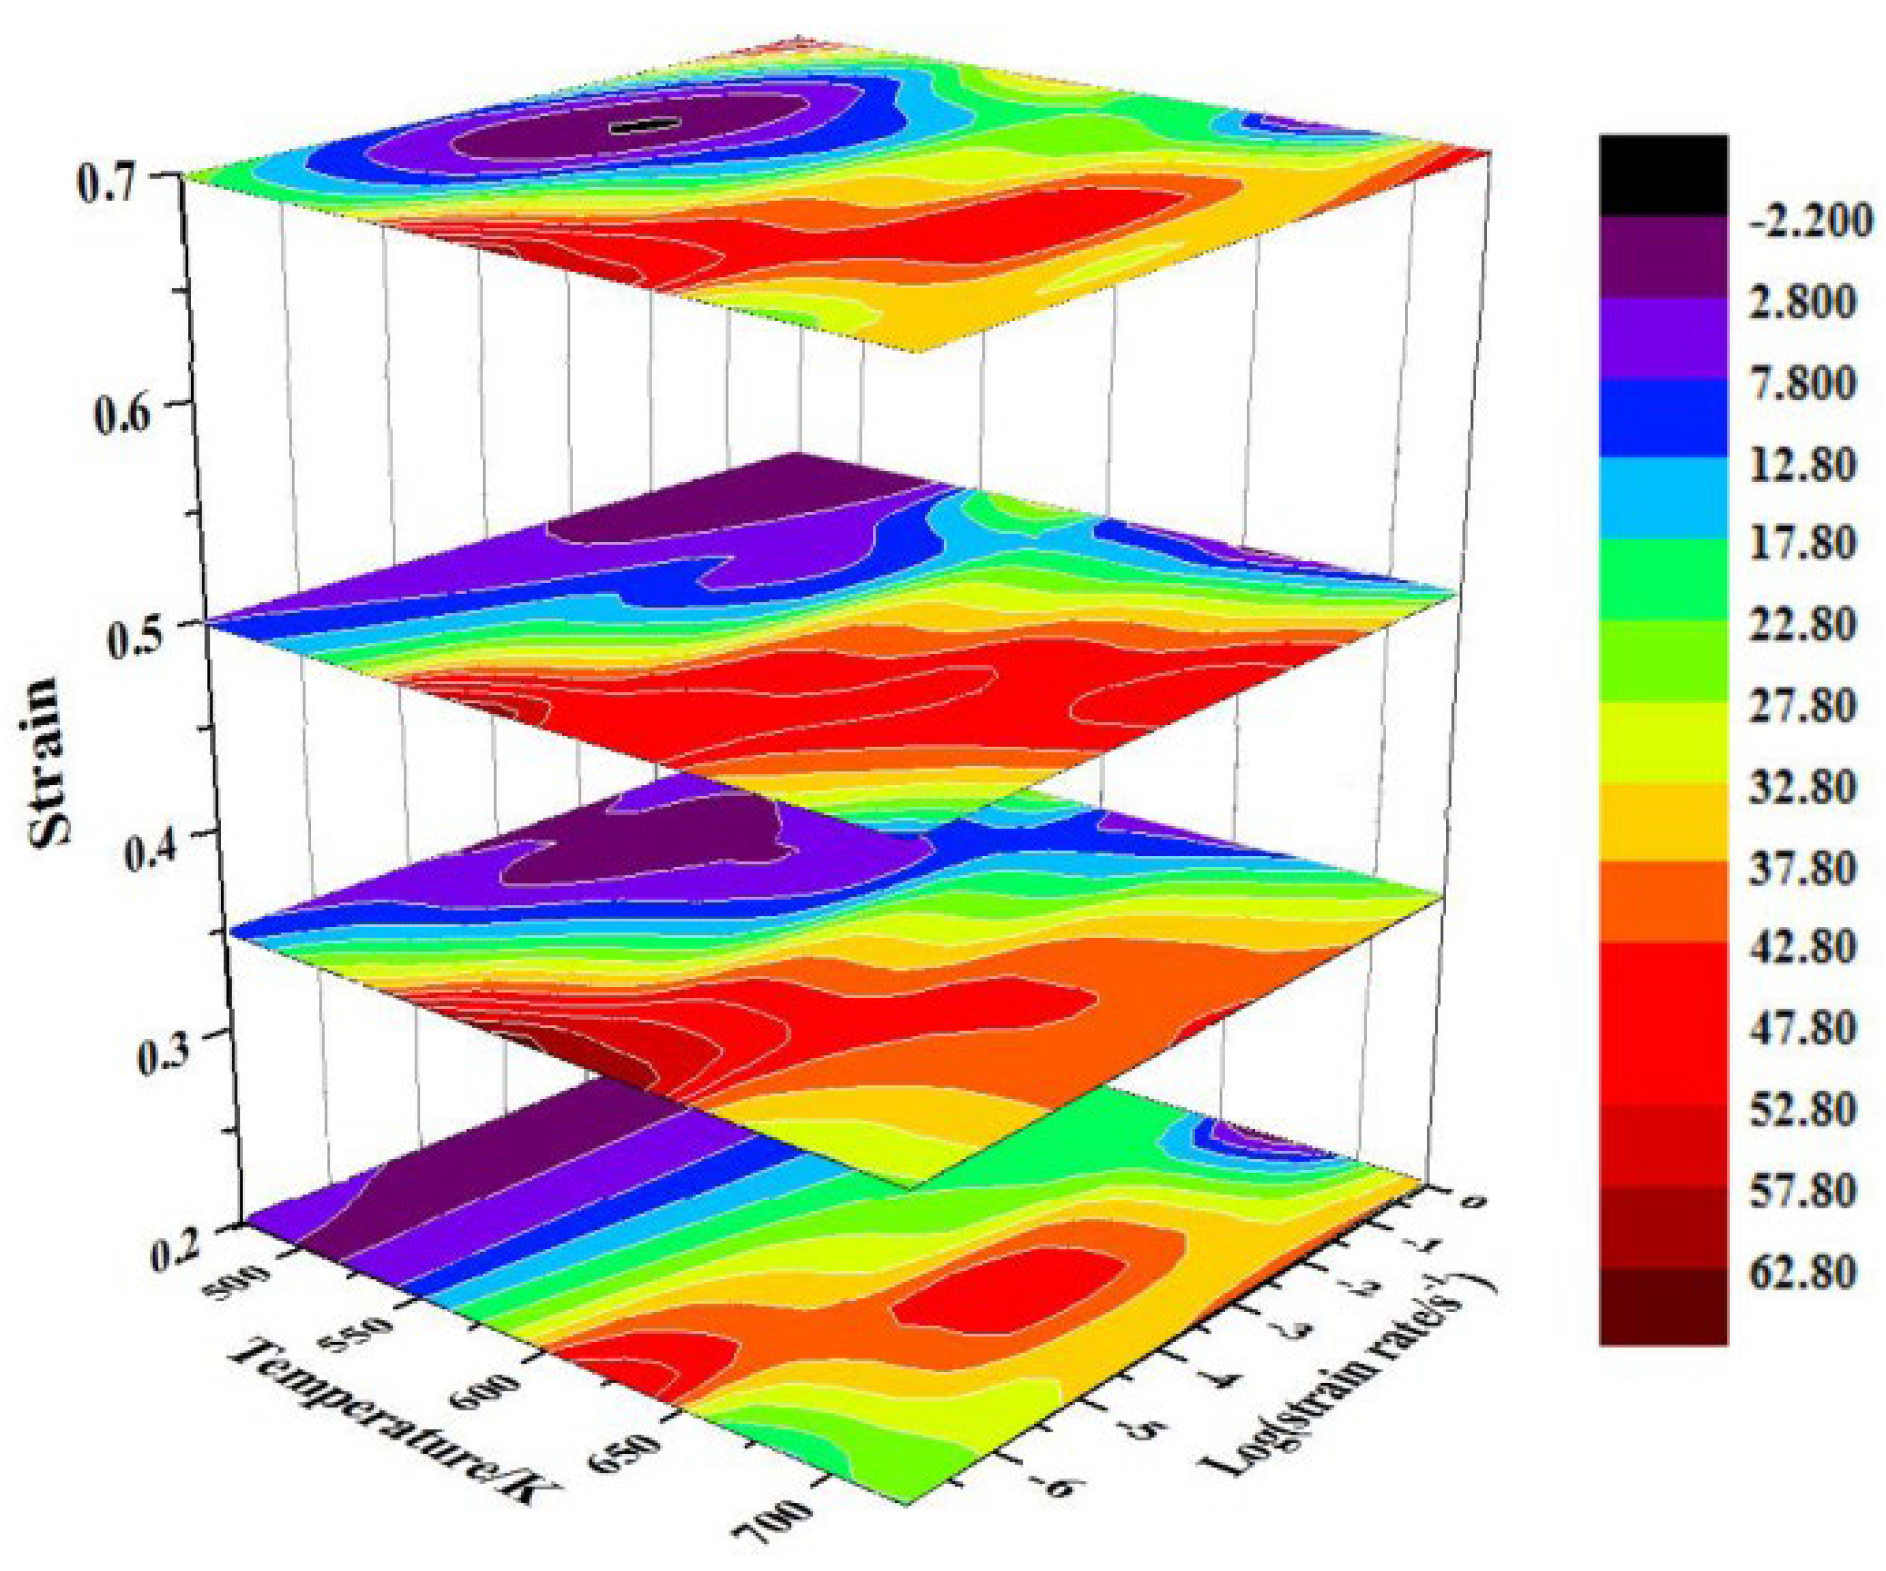
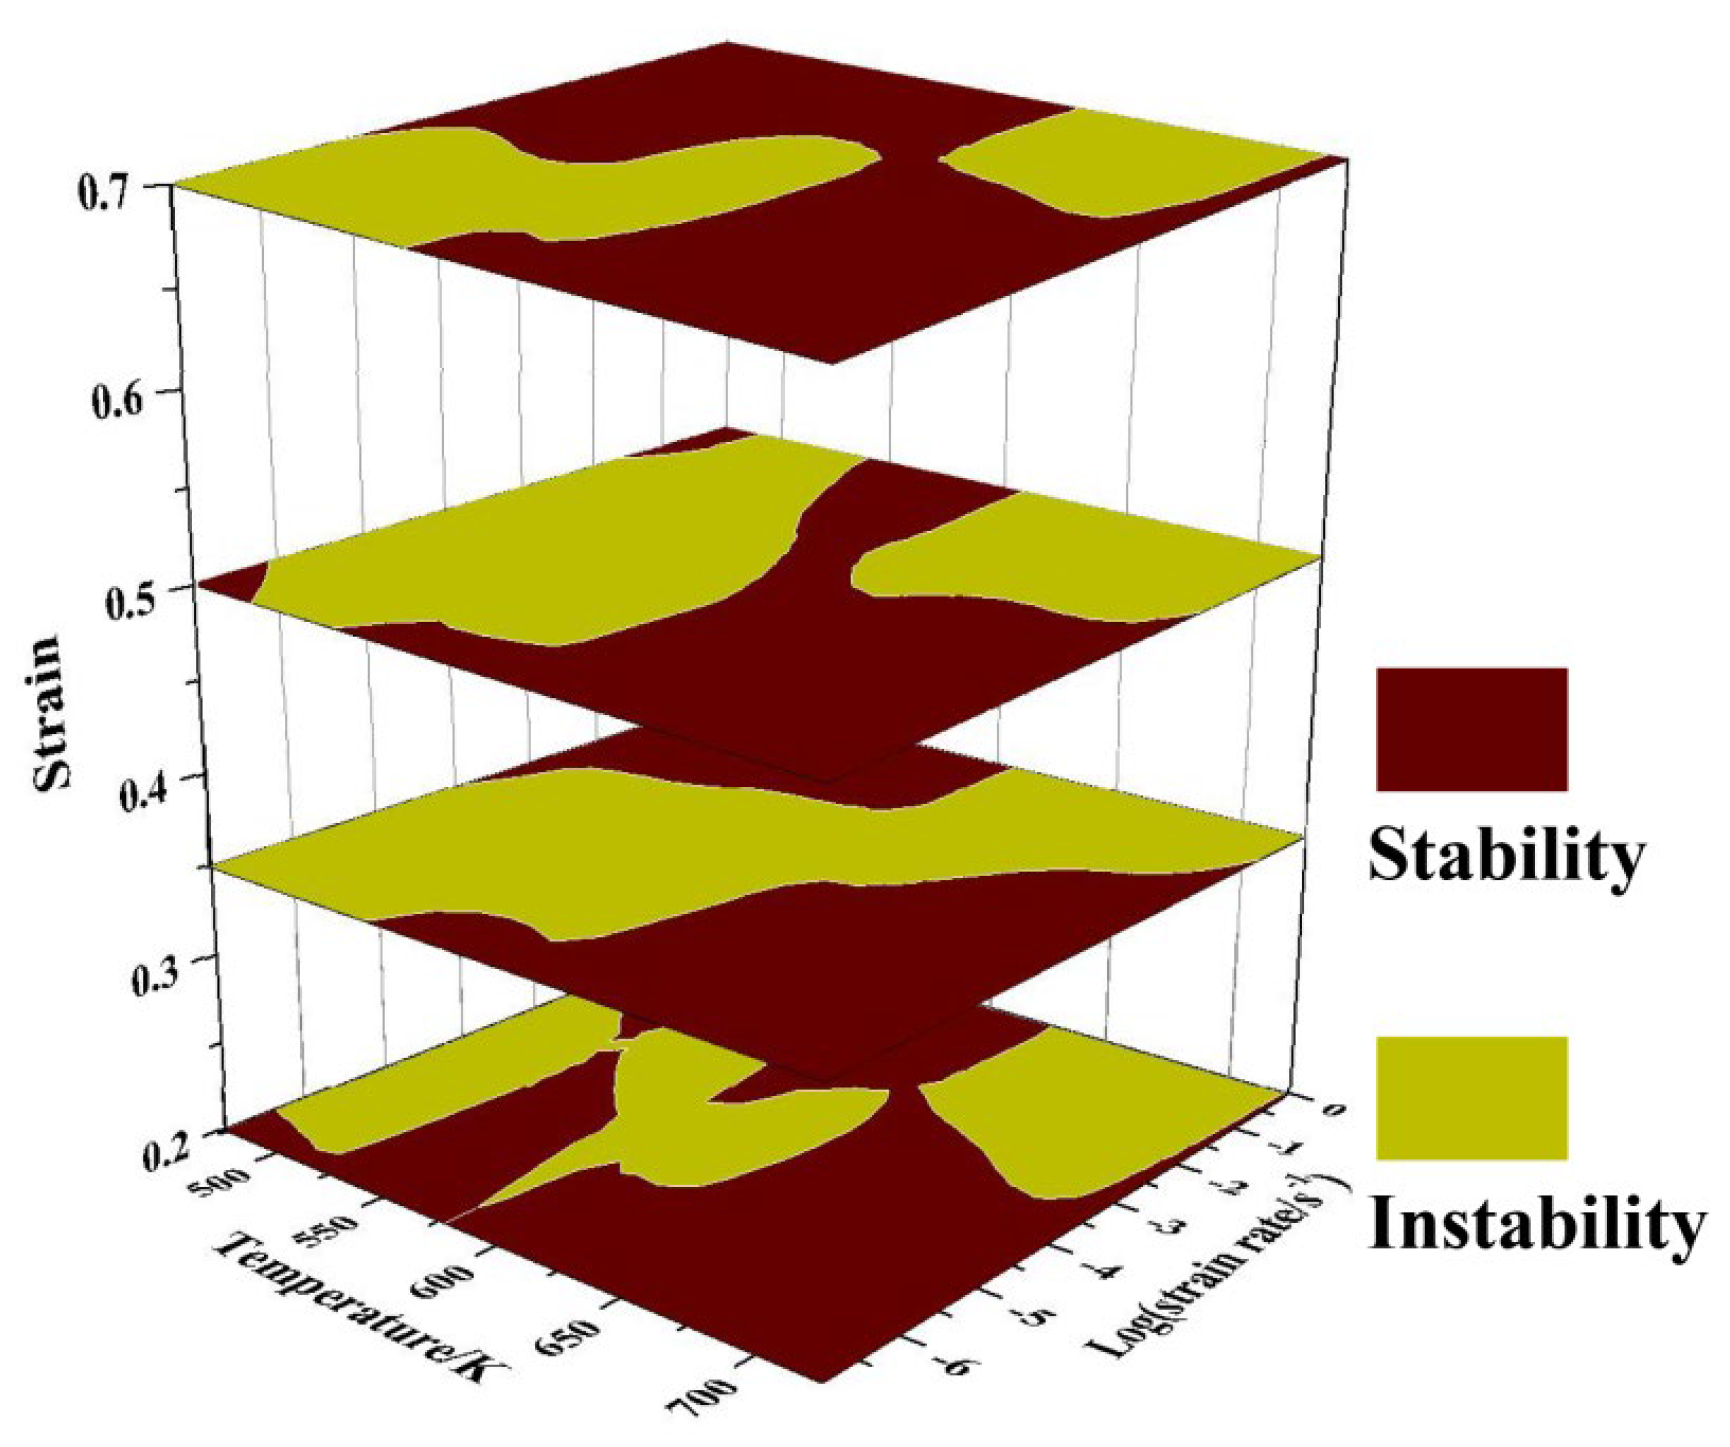
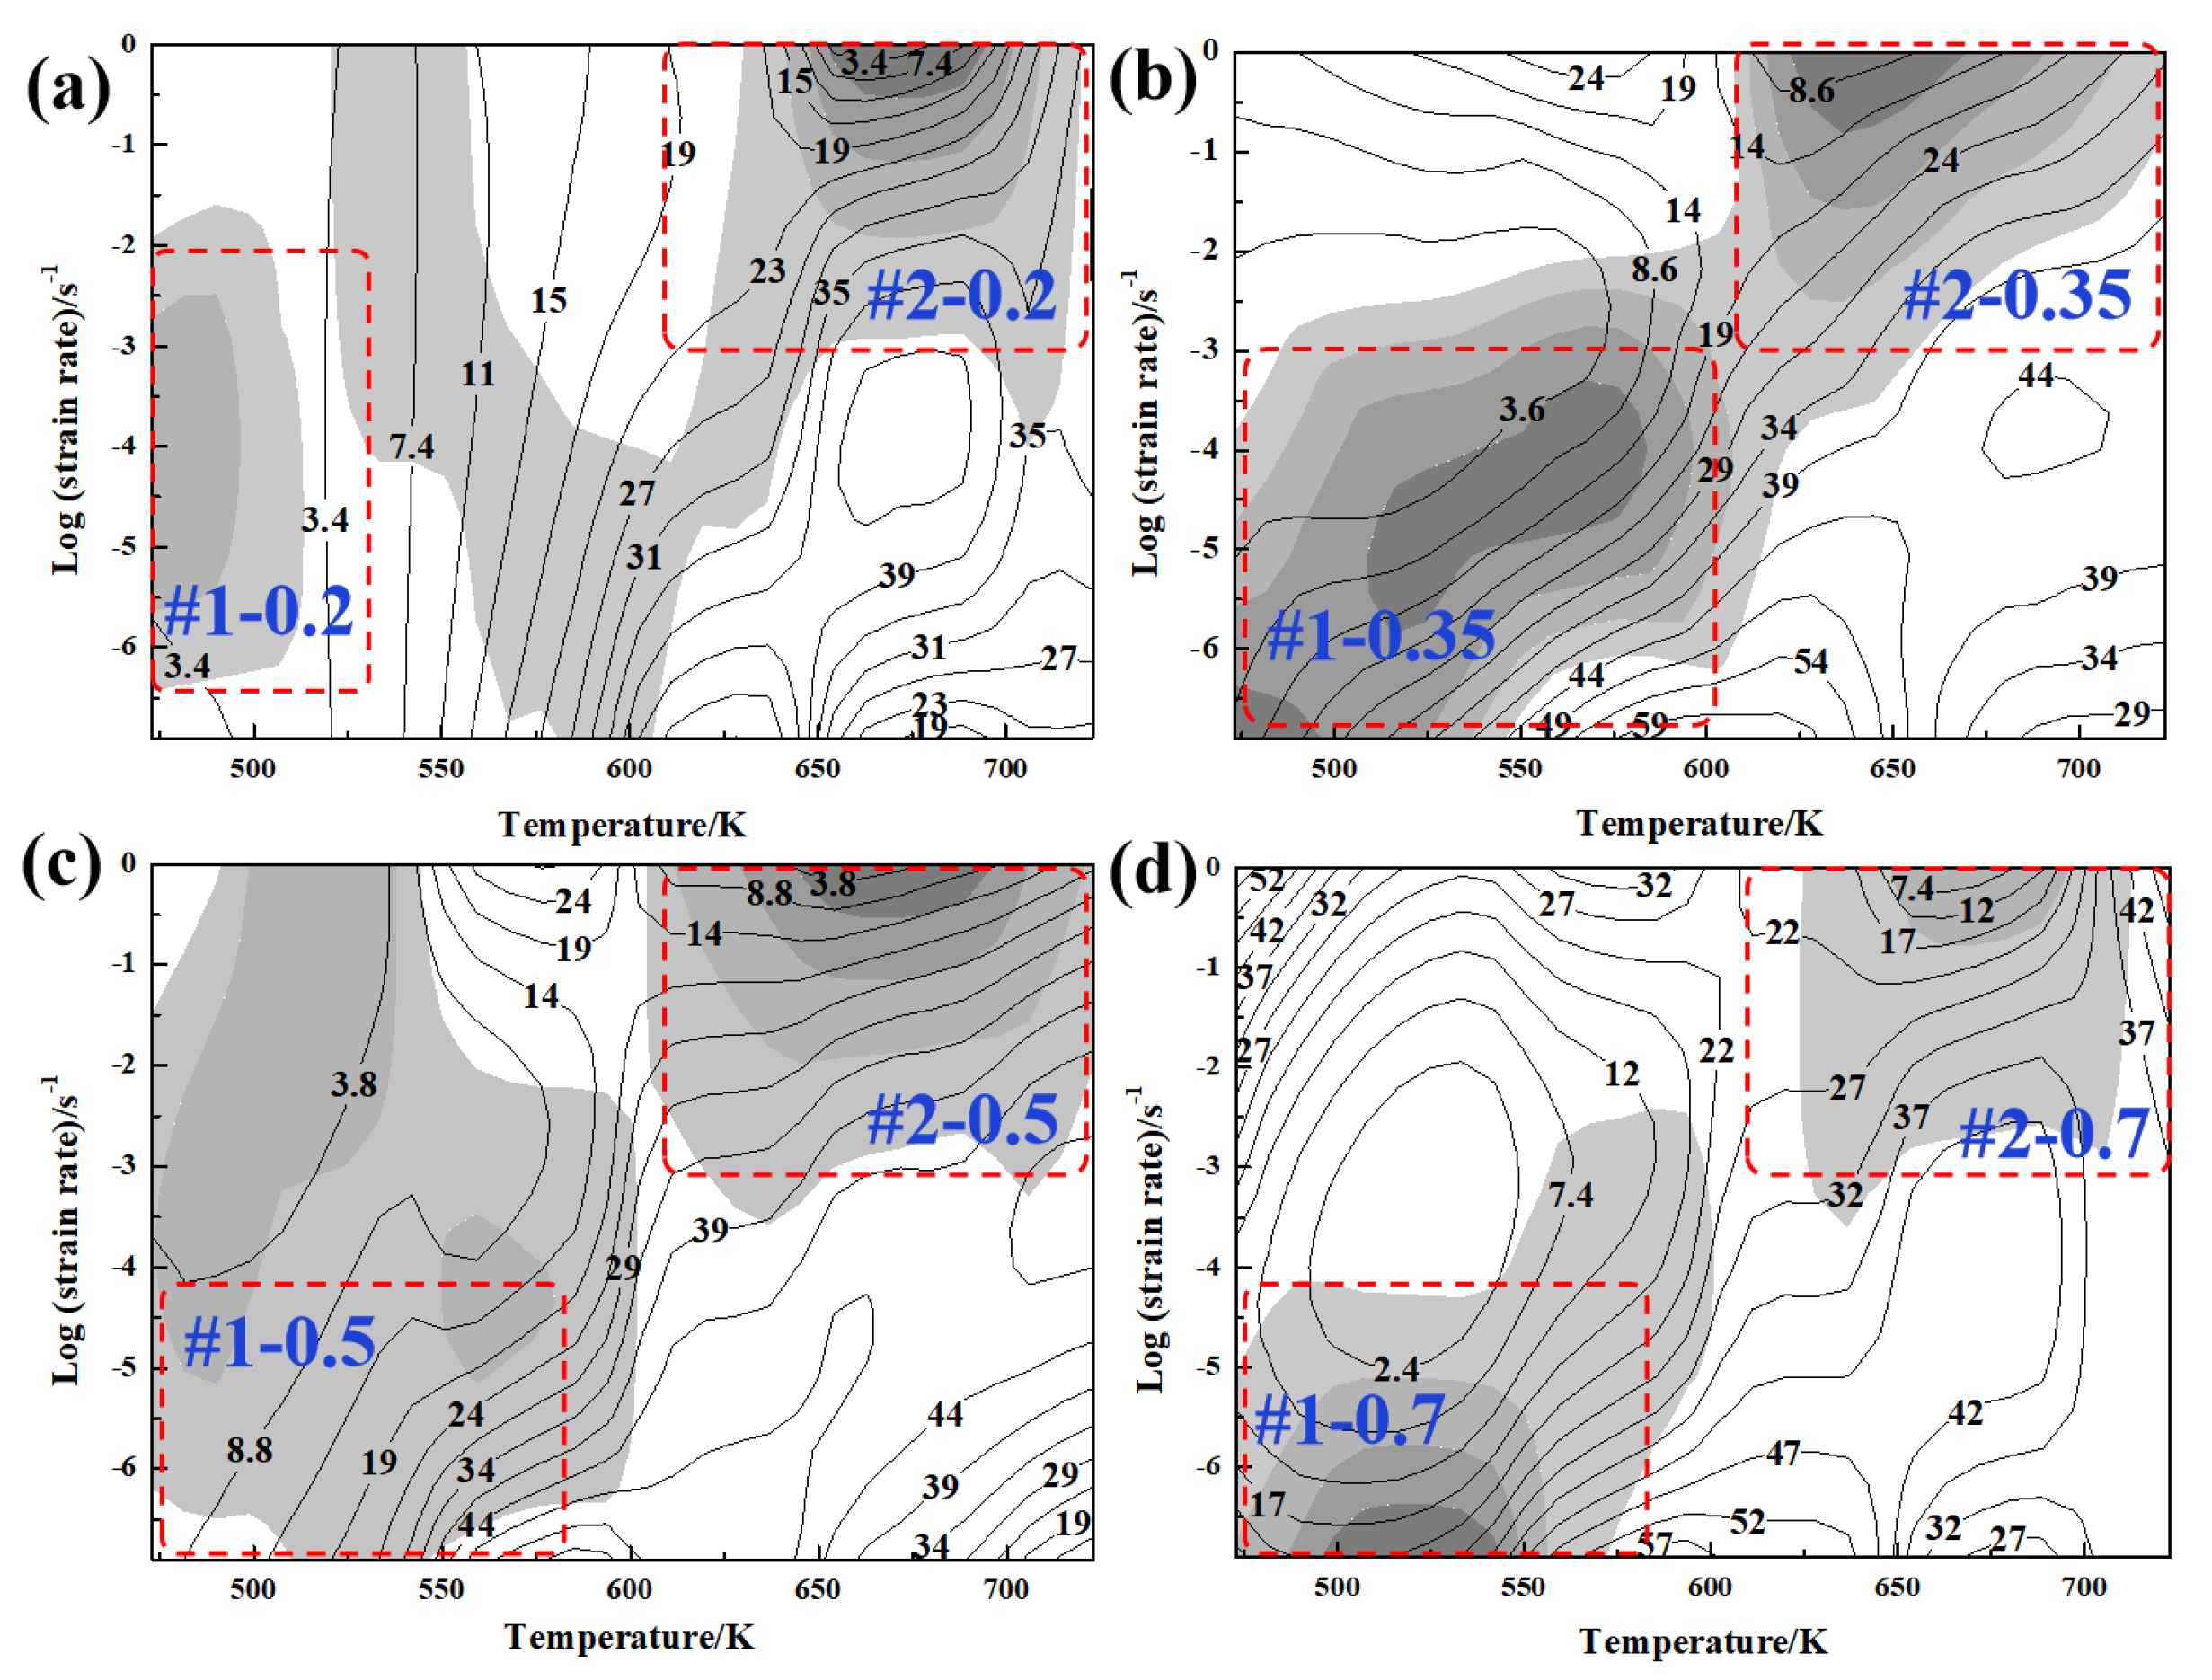
3.2.4. The 3D Processing Map Development

The 3D processing maps of the Mg−2Sn−1Ca alloy under high temperature compression deformation with different strains are shown in Figure 9. The shaded parts represent the instability region, and the figure marked on the contour lines is the power dissipation value. The processing maps show obvious differences under various strains, indicating that the hot processing map is sensitive to strain. The instability region could be divided into two regions (Region 1 and Region 2) according to the changing law of the instability shadow region. Region 1 is mainly located in the low temperature region with a lower strain rate, while Region 2 is located in the high temperature with high strain.
It can be seen from Figure 9 that the range of region 1 expands with the increase in strain variables in the early stage of deformation. When the strain is large, the instability range of region 1 shrinks, while the power dissipation value of the corresponding region also increases. The reason is that a larger shape variable can provide a larger deformation potential and a greater driving force for crystallization migration under low temperatures, which increases the possibility of the DRX of grains and reduces the probability of instability. Region 2 is mainly around the region of high temperature and high strain rate, especially when the deformation temperature is 650–700 K and the strain rate is 1 s−1. It shows strong instability characteristics under all strains. However, this instability region decreases slightly with the increase in strain, but the change is not obvious.
With the increase in strain, the strain rate region in the medium temperature region changed from instability to a safe machining area, but the safe machining area was still narrow. As shown in the figure, the peak value of the power dissipation value under all strain conditions occurs in the region where the strain rate is lower than 0.01 s−1. However, one of the peak power dissipation regions overlaps with the unstable region when the temperature range is 473 K to 600 K, which is manifested as the formation and occurrence of cracks in the microstructure. Meanwhile, with the increase in deformation temperature, the active capacity of the alloy is enhanced, and plastic deformation such as cylinder and cone slip occurs. In addition, due to a low strain rate and prolonged deformation time, the nucleation rate and amount of nucleation increase in sufficient time, the dislocation density is low, and recrystallization phenomenon is obvious [22]. The other peak power dissipation was at temperatures ranging from 630 K to 723 K and was in the safe processing zone. It was suggested that processing in this region could provide better conditions for DRX.

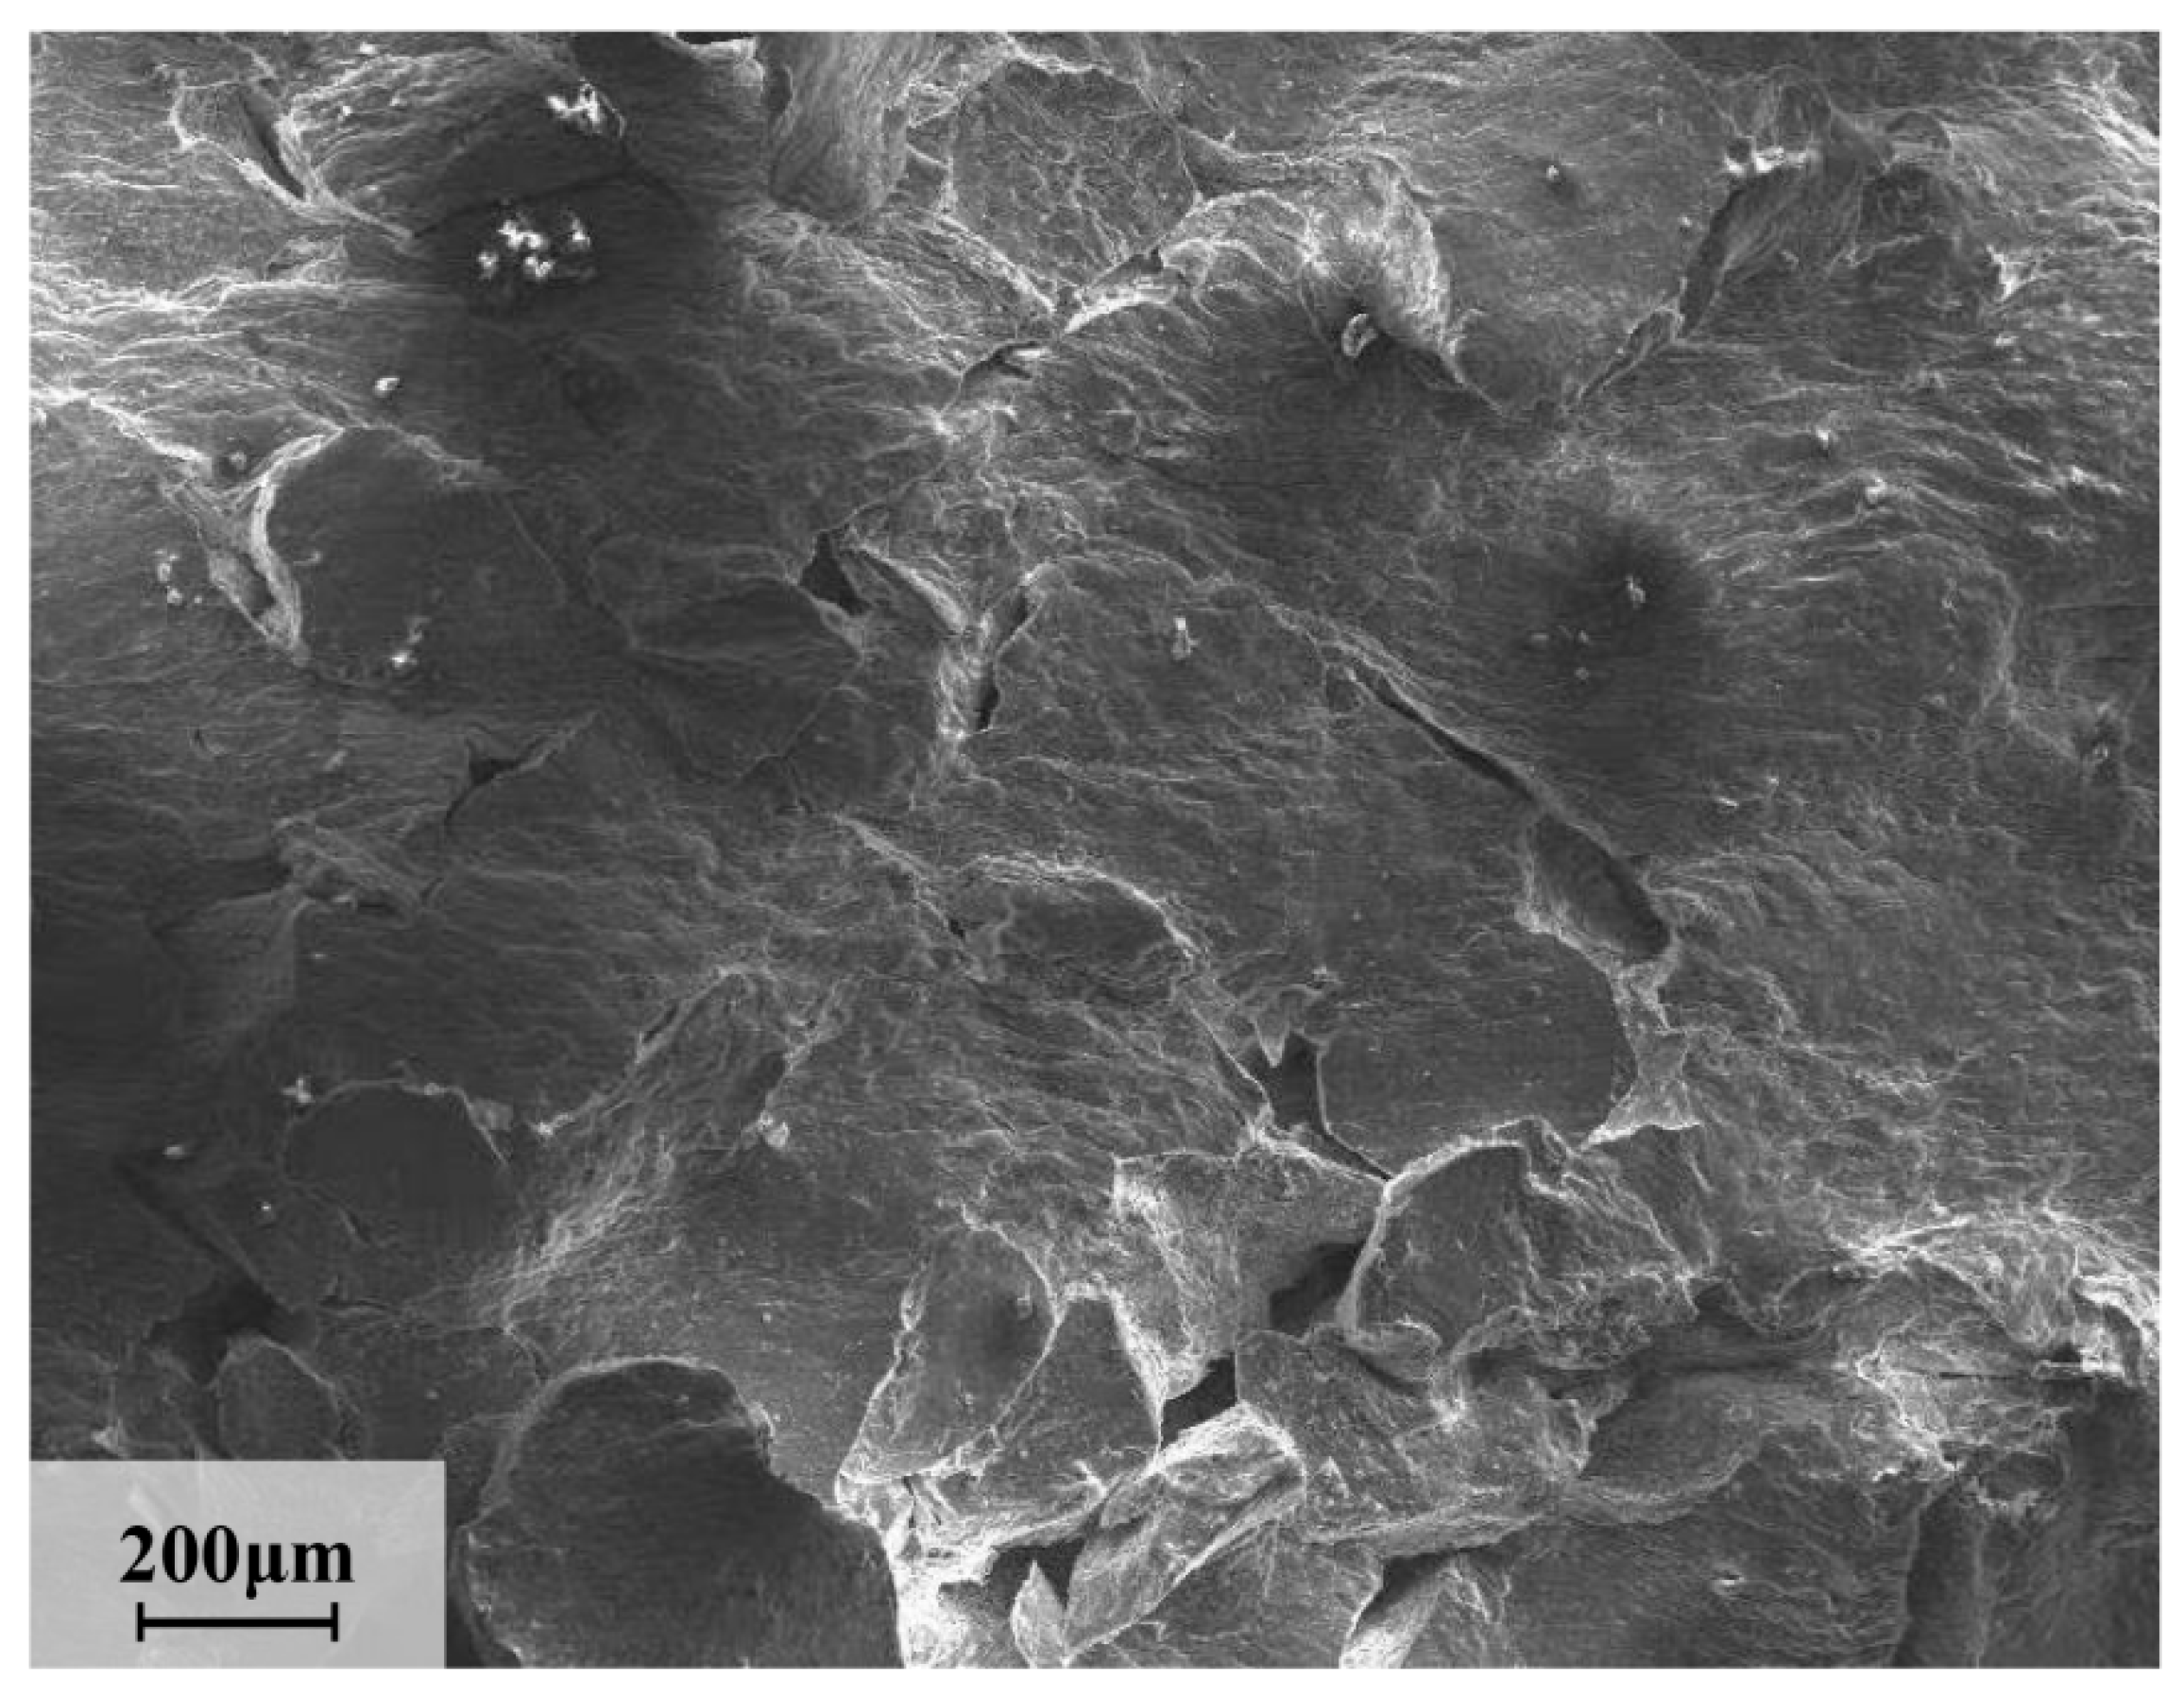
4. Fracture Behavior

The existence of the instability zone is closely related to the properties of the material under compression. In order to explore the suitable window for the Mg−2Sn−1Ca alloy, the processing map, the power dissipation coefficients, the instability parameters and the compressed specimens were combined to analyze the condition and reason for the crack.
The macroscopic cracks of the compressed Mg−2Sn−1Ca alloy specimens under test conditions are shown in Figure 10. The results suggest that the crack modes of the Mg−2Sn−1Ca alloy can be divided into the following two kinds: (a) unidirectional crack and (b) fine crack. Cracks mainly occurred in low temperature and low strain regions and high temperature and high strain regions, and the compression conditions are 473 K/0.001s −1 and 673 K/1 s−1, respectively. At low strain rates, the development of cracks decreased with the increase in compression temperature. Under the compression condition of 723 K, the change in strain rates did not lead to cracks in specimens. Only microcracks occurred on the specimens’ surface at strain rate of 1 s−1 and high temperature. The specimens with high temperatures and low strain rates have almost no cracks.
Due to the setting of the reduction amount in the hot compression test and the setting of the non-human interference stopping test, the compression behavior will not stop even if the crack is generated in deformation processing. However, the occurrence of cracks and other defects will lead to a certain degree of pressure unloading. Macro instability occurred at 473 K, and unidirectional cracks shown by the dotted line and the cracks with an angle of about 45° can be found in the compressed cylinder samples. The microstructure of crack under 423 K/1 s−1 is shown in Figure 11. Obviously, the power dissipation coefficient is the smallest, the instability parameter is less than 0 under this temperature and the processing conditions could match with the instability region 1 according to the processing maps shown in Section 3.2.3. The main reason is that the forming performance of a magnesium alloy is poor when it deforms at low temperatures because there is not enough independent sliding system to coordinate deformation. This will cause the dislocation to cause stress concentration at the grain boundary or in some areas, resulting in macroscopic cracks and severe stress load unloading. The results show that the deformation temperature and strain rate mainly affect the fracture mode of an Mg−2Sn−1Ca alloy under compression. Low temperature and high strain rate are conducive to crack generation.
At a high strain rate, crack propagation decreased with the increase in temperature. Figure 12 shows that only fish scale cracks appeared on the specimen when the strain rate is 1 s−1 and the temperature is higher. Obviously, the strain localization under a high strain rate could be avoided by increasing the deformation temperature, which will curve the occurrence of unidirectional cracks. The power dissipation value is nearly 20–30% under this condition shown in processing maps. The reason for the powerful ability of DRX is that the smaller deformation and dislocation density is not conducive to the nucleation of DRX when power dissipation values are less than 30% [23]. Bajargan et al. [24] studied the reason for this mode being non-basement slip—they found that they could be activated only at higher temperatures. With the increase in temperature, the critical shear stress of prismatic plane and pyramid plane slip decreases, and the deformation tends to be homogenized as the non-base plane slip extends to the interior of the particle.
The specimens do not have a crack under high temperatures and low strain rates. By analyzing processing maps, this condition belongs to a stable region. In this region, power dissipation coefficients are higher than 30% and the instability parameters are greater than 0. It is reported that DRX is more likely to occur than DRV when the power dissipation efficiency coefficients are greater than 30% for magnesium [25]. The experimental conditions of high temperature and low strain rate are most suitable for Mg−2Sn−1Ca alloy processing. It can conclude that the optimum area for an Mg−2Sn−1Ca alloy is the deformation temperature at 623–723 K and the favorable strain rate at 0.001–0.1 s−1.

5. Conclusions

The hot deformation behaviors of an Mg−2Sn−1Ca alloy were investigated for a large amount of working conditions in this research. Based on the experimental data of compression experiments on an Mg−2Sn−1Ca alloy at temperatures varying from 473 K to 723 K, strain rate varying from 0.001 to 1 s−1 and strain varying from 0.2 to 0.7, the 3D processing maps, combining instability maps with power dissipation efficiency maps, were successfully constructed and hot deformation was analyzed. The following conclusions on the processing of the alloy can be drawn:
(1)
The hot processing parameters of the Mg−2Sn−1Ca alloy exert a great impact on the isothermal deformation feature parameters, such as strain rate sensitivity (m), the efficiency of power dissipation (η) and instability parameters (ξ) for the establishment of the processing map.
(2)
Combined with the 3D processing diagram, the instability region of the Mg−2Sn−1Ca alloy could be divided into two regions: region 1 is within the range of 450–600 K/0.001–0.1 s−1; region 2 is within the range of 600–723 K/0.1–1 s−1. The processing conditions are within the temperature range of 630–723 K and within the safe processing area, which can effectively promote the occurrence of DRX.
(3)
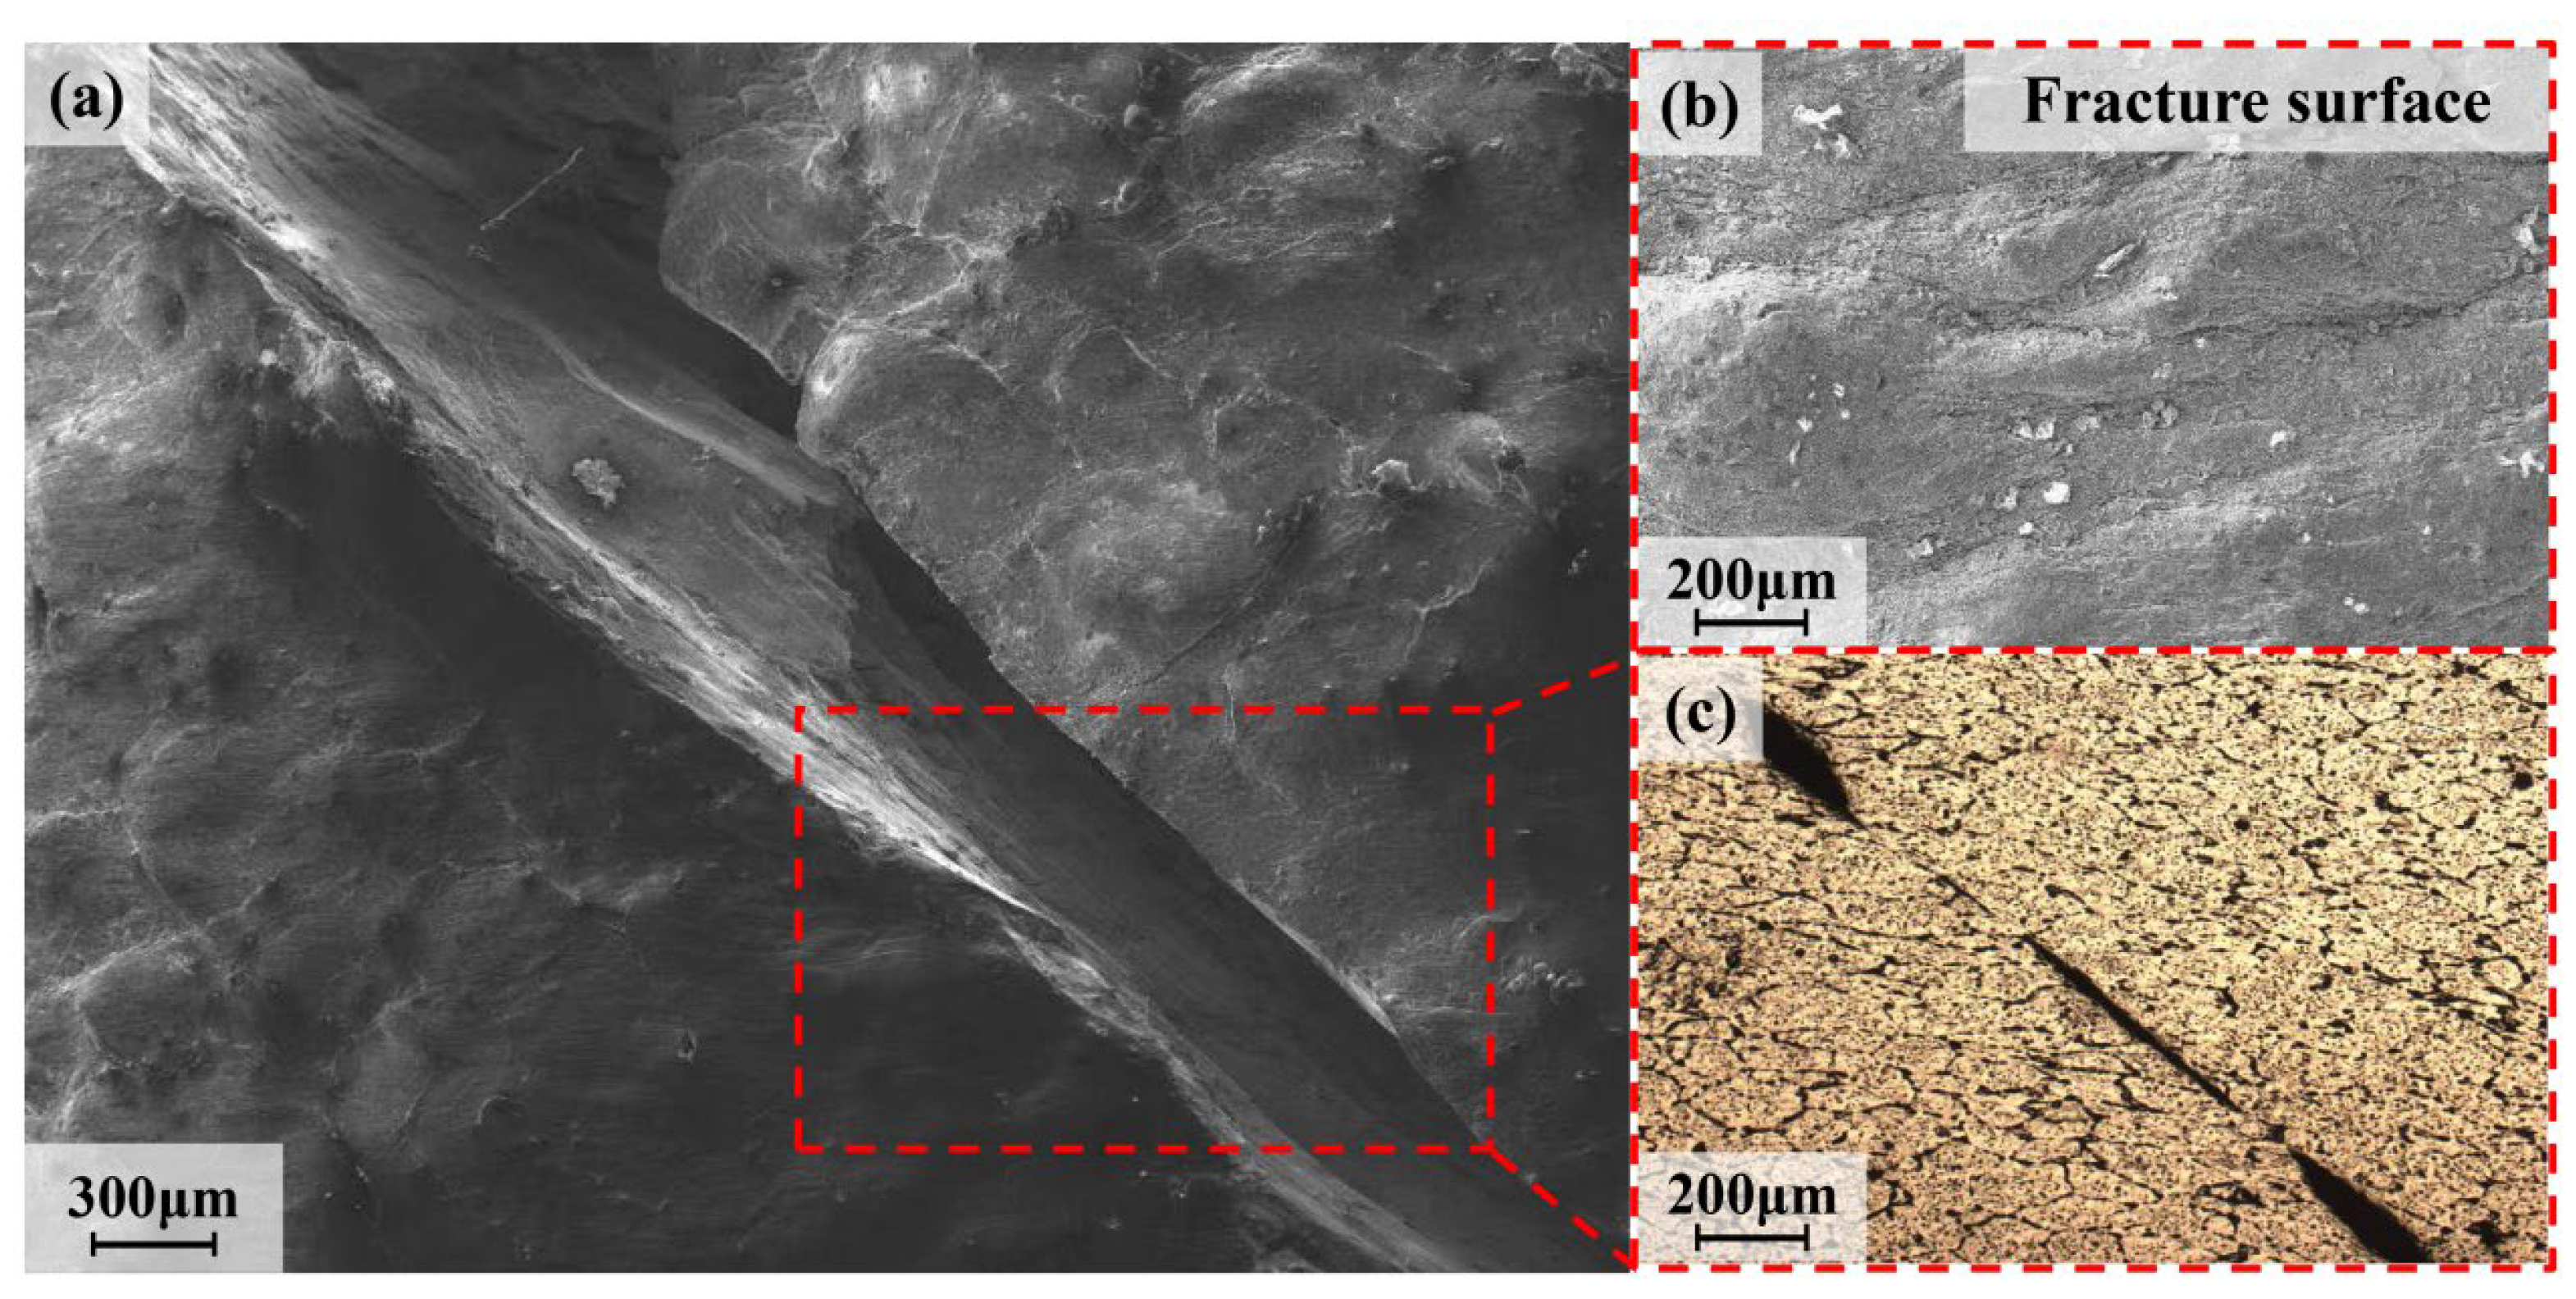
Because of the poor forming performance of a magnesium alloy under low temperatures, specimens show unidirectional cracks under 473 K. The propagation of cracks decreased with an increase in temperature under a high strain rate. The area of 623–723 K/0.001–0.1 s−1 can be considered the optimum hot working parameters.

Author Contributions

Investigation, Date curation, C.Z.; Writing—original draft, Z.W.; Methodology, J.L.; Writing—review and editing, Z.H.; Investigation, H.X.; Investigation, Y.Z.; Editing, W.J.; Investigation, P.L.; Validation, L.M. All authors have read and agreed to the published version of the manuscript.

Funding

This work was supported by the National Natural Science Foundation of China (U1910213, 52201047 and 52075357), Fundamental Research Program of Shanxi Province (20210302124446), Taiyuan University of Science and Technology Scientific Research Initial Funding (TYUSTSRIF) (20212007), and Award Grants for Outstanding Doctor Working in Shanxi (20212072).

Data Availability Statement

Data are contained within the article.

Conflicts of Interest

The authors declare that they have no conflict of interest.

References

  1. Liu, X.; Mao, P.; Zhou, L.; Wang, X.; Wang, Z.; Wang, F.; Wei, Z.; Liu, Z. Effect of Grain Size on Dynamic Compression Behavior and Deformation Mechanism of ZK60 Magnesium Alloy. Metals 2023, 13, 314. [Google Scholar] [CrossRef]
  2. Wu, Z.Y.; Zhi, C.C.; Ma, L.F.; Zheng, Z.B.; Zhu, Y.C.; Jia, W.T. Effect of initial temperature on the microstructure and properties of cryogenic rolled AZ31 magnesium alloy. Mater. Tehnol. 2022, 56, 571–577. [Google Scholar] [CrossRef]
  3. Zhao, C.Y.; Pan, F.S.; Pan, H.C. Microstructure, mechanical and bio-corrosion properties of as-extruded Mg–Sn–Ca alloys. Trans. Nonferrous Met. Soc. China 2016, 26, 1574–1582. [Google Scholar] [CrossRef]
  4. Zeng, Z.R.; Bian, M.Z.; Xu, S.W.; Davies, C.; Nie, J.F. Texture evolution during cold rolling of dilute Mg alloys. Scr. Mater. 2015, 108, 6–10. [Google Scholar] [CrossRef]
  5. Zhu, G.; Wang, L.; Zhou, H.; Wang, J.; Zeng, X. Improving ductility of a Mg alloy via non-basal slip induced by Ca addition. Int. J. Plast. 2019, 120, 164–179. [Google Scholar] [CrossRef]
  6. Pan, H.; Huang, Q.; Qin, G.; Fu, H.; Xu, M.; Ren, Y.; She, J.; Song, B.; Li, B. Activations of stacking faults in the calcium-containing magnesium alloys under compression. J. Alloys Compd. Interdiscip. J. Mater. Sci. Solid State Chem. Phys. 2017, 692, 898–902. [Google Scholar] [CrossRef]
  7. Pan, H.; Qin, G.; Ren, Y.; Wang, L.; Sun, S.; Meng, X. Achieving high strength in indirectly-extruded binary Mg–Ca alloy containing Guinier–Preston zones. J. Alloys Compd. 2015, 630, 272–276. [Google Scholar] [CrossRef]
  8. Bowles, A.L.; Dieringa, H.; Blawert, C.; Hort, N.; Kainer, K.U. Investigations in the Magnesium-Tin System. Mater. Sci. Forum 2005, 488–489, 135–138. [Google Scholar] [CrossRef]
  9. Jia, W.; Tang, Y.; Le, Q.; Cui, J. Air-cooling analysis of AZ31B magnesium alloy plate: Experimental verification, numerical simulation and mathematical modeling. J. Alloys Compd. 2017, 695, 1838–1853. [Google Scholar] [CrossRef]
  10. Liu, Y.; Yao, Z.; Ning, Y.; Yang, N.; Guo, H.; Qin, C.; Shi, Z. The flow behavior and constitutive equation in isothermal compression of FGH4096-GH4133B dual alloy. Mater. Des. 2014, 63, 829–837. [Google Scholar] [CrossRef]
  11. Liao, S.L.; Zhang, L.W.; Yue, C.X.; Pei, J.B.; Gao, H.J. Hot deformation behaviors and flow stress model of GCr15 bearing steel. J. Cent. South Univ. Technol. 2008, 15, 575–580. [Google Scholar] [CrossRef]
  12. Prasad, Y. Recent advances in the science of mechanical processing. Indian J. Technol. 1990, 28, 435–451. [Google Scholar]
  13. Ebrahimpourghandi, B.; Mahmudi, R. Hot deformation constitutive analysis and processing maps of the as-cast and wrought Mg–2.5Gd–0.5Zr alloy. J. Alloys Compd. 2023, 942, 169132. [Google Scholar] [CrossRef]
  14. Zhang, L.; Yuan, S.; Wang, J.; Chen, L.; Jin, P. Hot deformation behavior, processing map, microstructure evolution and dynamic recrystallization mechanism of Mg-5Al-0.6Sc alloy. J. Alloys Compd. 2022, 922, 166244. [Google Scholar] [CrossRef]
  15. Nayyeri, G.; Mahmudi, R.; Salehi, F. The microstructure, creep resistance, and high-temperature mechanical properties of Mg-5Sn alloy with Ca and Sb additions, and aging treatment. Mater. Sci. Eng. A 2010, 527, 5353–5359. [Google Scholar] [CrossRef]
  16. Sun, Y.; Wang, R.; Ren, J.; Peng, C.; Feng, Y. Hot deformation behavior of Mg-8Li-3Al-2Zn-0.2Zr alloy based on constitutive analysis, dynamic recrystallization kinetics, and processing map. Mech. Mater. 2019, 131, 158–168. [Google Scholar] [CrossRef]
  17. Prasad, Y.V.R.K.; Gegel, H.L.; Doraivelu, S.M.; Malas, J.C.; Morgan, J.T.; Lark, K.A.; Barker, D.R. Modeling of dynamic material behavior in hot deformation: Forging of Ti-6242. Metall. Trans. A 1984, 15, 1883–1892. [Google Scholar] [CrossRef]
  18. Liu, J.; Cui, Z.; Li, C. Analysis of metal workability by integration of FEM and 3-D processing maps. J. Mater. Process. Technol. 2008, 205, 497–505. [Google Scholar] [CrossRef]
  19. Kwak, T.Y.; Kim, W.J. Effect of refinement of grains and icosahedral phase on hot compressive deformation and processing maps of mg-zn-y magnesium alloys with different volume fractions of icosahedral phase. J. Mater. Sci. Technol. 2019, 35, 11. [Google Scholar] [CrossRef]
  20. Bk, A.; Lya, B.; Jta, B.; Yong, Z.A.; Sla, B.; Hl, C.; Yu, D.A.; Xl, A. Hot deformation behavior and 3D processing maps of AA7020 aluminum alloy. J. Alloys Compd. 2020, 845, 156113. [Google Scholar]
  21. Sun, Y.; Cao, Z.; Wan, Z.; Hu, L.; Ye, W.; Li, N.; Fan, C. 3D processing map and hot deformation behavior of 6A02 aluminum alloy. J. Alloys Compd. 2018, 742, 356–368. [Google Scholar] [CrossRef]
  22. Wang, Q.; Ma, L.; Wang, Q.; Lin, J.; Ren, W. In-Situ Study on Deformation Behavior of ZK60 Alloy Processed by Cyclic Extrusion and Compression. Mater. Trans. 2014, 55, 1180–1183. [Google Scholar]
  23. Zhi, C.; Ma, L.; Jia, W.; Huo, X.; Lin, J. Dependence of deformation behaviors on temperature for twin-roll casted AZ31 alloy by processing maps. J. Mater. Res. Technol. 2019, 8, 5217–5232. [Google Scholar] [CrossRef]
  24. Bajargan, G.; Singh, G.; Sivakumar, D.; Ramamurty, U. Effect of temperature and strain rate on the deformation behavior and microstructure of a homogenized AZ31 magnesium alloy. Mater. Sci. Eng. A 2013, 579, 26–34. [Google Scholar] [CrossRef]
  25. Saxena, K.K.; Yadav, S.D.; Sonkar, S.; Pancholi, V.; Chaudhari, G.P.; Srivastava, D.; Dey, G.K.; Jha, S.K.; Saibaba, N. Effect of Temperature and Strain Rate on Deformation Behavior of Zirconium Alloy: Zr-2.5Nb. Procedia Mater. Sci. 2014, 6, 278–283. [Google Scholar] [CrossRef]
Figure 1. (a) Optical micrograph and (b) EDS elemental maps of the homogenized Mg−2Sn−1Ca alloy.
Metals 13 00645 g001
Figure 2. Schematic illustration of compression samples.
Metals 13 00645 g002
Figure 3. The true stress–true strain curves of the as-cast Mg−2Sn−1Ca magnesium alloy at different strain rates: (a) 0.001 s−1; (b) 0.01 s−1; (c) 0.1 s−1; (d) 1 s−1.
Metals 13 00645 g003
Figure 4. Fitting curves to describe the relationship between ln σ and ln ε with strains of (a) 0.35; (b) 0.7.
Metals 13 00645 g004
Figure 5. Relationship between the power dissipation value (η%) and the deformation temperature under different strains: (a) 0.35; (b) 0.7.
Metals 13 00645 g005
Figure 6. The 3D maps of power dissipation efficiency of the Mg−2Sn−1Ca alloy at various strains.
Metals 13 00645 g006
Figure 7. Relationship between the instability parameter (ξ) and the deformation temperature under different strains: (a) 0.35; (b) 0.7.
Metals 13 00645 g007
Figure 8. The 3D maps of the flow instability diagram of the Mg−2Sn−1Ca alloy at various strains.
Metals 13 00645 g008
Figure 9. The processing maps of the Mg−2Sn−1Ca alloy under various strains. (a) 0.2 (b) 0.35 (c) 0.5 (d) 0.7.
Metals 13 00645 g009
Figure 10. The macroscopic of compression samples at different deformation conditions.
Metals 13 00645 g010
Figure 11. The microstructure of an Mg−2Sn−1Ca alloy in 423 K/1 s−1 thermal compression. (a) The crack of the specimen; (b) Fracture surface; (c) local magnification of crack.
Metals 13 00645 g011
Figure 12. Microstructure of Mg−2Sn−1Ca alloy in 623 K/1 s−1 thermal compression.
Metals 13 00645 g012
Disclaimer/Publisher’s Note: The statements, opinions and data contained in all publications are solely those of the individual author(s) and contributor(s) and not of MDPI and/or the editor(s). MDPI and/or the editor(s) disclaim responsibility for any injury to people or property resulting from any ideas, methods, instructions or products referred to in the content.

