Article

Quality Monitoring of Resistance Spot Welding Based on a Digital Twin

School of Materials Science and Engineering, Tianjin University, Tianjin 300354, China
*
Author to whom correspondence should be addressed.
Metals 2023, 13(4), 697; https://doi.org/10.3390/met13040697
Submission received: 18 February 2023 / Revised: 25 March 2023 / Accepted: 31 March 2023 / Published: 3 April 2023
(This article belongs to the Special Issue New Technologies in Resistance Spot Welding)

Abstract

:
As an important means to realize intelligent manufacturing, a digital twin is a digital expression of physical entities, which realizes virtual–real interaction and the iterative optimization of product design and manufacturing by constructing a bridge of information mapping between the physical world and the virtual world. Resistance spot welding technology is widely used in automotive manufacturing, aerospace and other fields as a spot linking process for the manufacture of thin sheet structures. The fusion nugget growth process of resistance spot welding is particularly important for its joint quality. Resistance spot welding is a highly nonlinear coupled process, and physical models make it difficult to accurately monitor its quality. Taking 2219/5A06 aluminum plates with different thicknesses as the research object, digital twin technology is applied to monitor the welding process of aluminum plate. In order to improve the key technologies such as information interaction in the digital twin system, a data acquisition system for resistance spot welding process is established and a real-time data processing technology based on wavelet threshold analysis is proposed. Based on real-time data, the processed process parameters are tested in twin space to validate the feasibility of the solution.

1. Introduction

Resistance spot welding technology is a kind of point connection technology widely used in the manufacture of thin plate structures. Its principle is to apply a certain pressure between two electrodes and the workpiece to be welded and use the resistance heat generated when the current passes through the workpiece to melt the local metal and form a welding spot process. Resistance spot welding is widely used in the automotive, aerospace, home appliance and other manufacturing fields due to its advantages of low cost and high production efficiency [1].
As an important process in traditional automobile manufacturing, resistance spot welding is widely used in the welding process of body floor, roof, and body assembly. In the manufacturing and welding process of the car body, each car body has about 4000–6000 resistance spot welding joints. Therefore, the quality of the solder joints directly determines the quality of the car body, which in turn affects the manufacturing quality of the vehicle. In the petrochemical industry, chemical materials in petroleum and natural gas are all transported through pipelines. In the early days, only seamless steel pipes were used for pipeline steel. Due to their manufacturing cost, the application of high-frequency resistance-welded pipes in petroleum and other fields has gradually increased [2]. Resistance welding is also widely used in the home appliance manufacturing industry. Because it is suitable for welding thin steel plates and the joint quality is high, it has been widely used in the manufacture of refrigerator and washing machine shells [3]. In the medical field, dentists also use small-scale resistance welding for dimensional restorations of metal molars. However, the resistance spot welding process involves force, heat, electricity, magnetism and flow, which is a highly nonlinear coupling process, which makes it difficult to accurately monitor the quality of the physical model [4]. At the same time, it is affected by interference factors such as assembly gaps and electrode wear, as well as welding quality problems such as spatter and cracks appear, which increase the uncertainty of the welding process. Therefore, an effective resistance spot welding monitoring technology is needed to realize real-time monitoring of process elements in the welding process and ensure product welding quality.
Since resistance spot welding is a fully closed process, direct observation of the nucleation process is not possible, so the nucleation process can only be inferred by monitoring the physical phenomena accompanying the spot-welding process. The former process signals that can be applied to monitor spot weld quality in real time include dynamic resistance [5,6], electrode pressure [7] and electrode displacement [8]. Dynamic resistance is one of the most widely used process signals in the field of resistance spot welding quality monitoring. In 1950, Roberts first experimentally discovered the change in dynamic resistance during resistance spot welding of mild steel [9]. The dynamic resistance signal is obtained by measuring the welding current and the voltage signal across the electrode and calculating it using Ohm’s law. In the welding high current operating environment, the time-varying characteristics of the current lead to large induced noise in the voltage signal, and the traditional current/voltage ratio algorithm produces serious calculation errors. Gong [10] proposed the current-over-zero derivative ratio method to achieve the calculation of dynamic resistance by analyzing the voltage and current signals of the primary circuit of resistance spot welding and retrograde modeling, which requires calibration of the inductance value of the secondary circuit of the welding equipment before use. Su et al. [11] performed dynamic resistance measurements using a recursive least squares algorithm based on a forgetting factor, and optimized the genetic factor using sensitivity analysis, which can effectively eliminate inductive noise. Ji et al. [12] found a significant trend in electrode displacement during resistance spot welding of thin aluminum alloys. Panza et al. [13] used the analysis of the electrode unique signal from a non-contact sensor installed in the welding machine to monitor the electrode degradation during the welding process and thus analyze the quality of the welding process. In view of the influencing factors of spot welding quality and the shortcomings of the method to judge spot welding quality based on the monitoring waveform curve, a method to study the monitoring waveform curve of welding machine process parameters and establish the HMM (hidden Markov model) model to realize the quality judgment of resistance spot welding was presented by Wang [14]. Tang’s [15] experimental studies have shown that different electrode pressure signals are obtained when spot welding with different welding equipment is applied to the same material, so the study of electrode pressure signals needs to be differentiated according to the type of welding equipment. Sensing and detection technology for different signals of the resistance spot welding process is relatively mature; however, achieving accurate measurement of dynamic resistance under variable current conditions has not been practically solved and failed to break through the electrode displacement measurement technology of the weld clamp mechanism.
A welding quality inspection method using signal processing and artificial intelligence was proposed by Wang [16]. This method uses a non-invasive Rogowski coil to extract electrical signal features, uses RNN (recurrent neural network) to evaluate the size of the hot zone in the welding process, and implements a new self-organizing map classifier to detect the time of occurrence. At the same time, in order to achieve a rapid monitoring strategy, only the easily obtained electrical signals are monitored for data reading. To improve the efficiency of acquiring monitored features, a reliable quality assessment method for resistance spot welding was proposed by Zhang [17]. This method reserves weld quality information as much as possible and it avoids complex algorithm for extracting and selecting monitored features. A method based on generative adversarial networks (GANs) data enhancement technology to improve the quality of resistance spot welding was proposed by Dai [18]. This method is based on GANs data enhancement, classifier construction and image splitting. Firstly, defective welding images and their characteristics are described. Secondly, transfer learning technique is used to construct the defect spot welding classifier. Using simple geometric transformations and balancing GANs and gradient penalty (BAGAN-GP) to enlarge the dataset, the resulting image is added to the original training dataset. Finally, the trained classifier is used to classify the defective solder joints. Most of the above methods rely on historical data analysis in the process of welding monitoring, making it difficult to guide timely quality monitoring and subsequent process decisions.
The concept of the digital twin was originally developed by Grieves [19] and is used in the military and aerospace sectors. Digital twin technology has gained widespread attention and practical application in various fields of industry due to its features of virtual–real integration and real-time interaction, iterative operation and optimization, and full-factor data drive. Tao et al. [20] described a digital twin as a virtual model of a physical entity created digitally to simulate the behavior of the physical entity in the real environment with the help of data, providing a more real-time, efficient and intelligent service oriented toward the whole product lifecycle process. A method of optimizing the spot welding sequence for the assembly quality was proposed by Tabar [21], which uses a digital twin model to simulate the parameters of the welding sequence for each assembly, and by using the simulation time as the basis for the optimal sequence, the method reduces the spot welding sequencing time by more than 60%. A digital twin with deep learning empowerment was applied to pulsed gas tungsten arc welding (GTAW-P) for welded joint monitoring and penetration control, and this method achieved a graphical user interface (GUI) for the user to more intuitively feel the weld growth [22]. For the welding cell in the manufacturing process of large excavation motor arm workpieces, a system framework, based on a digital twin welding robot cell, was proposed and constructed in order to optimize the robotic collaboration process of the welding workstation with digital twin technology. This method realized the simulation verification of welding assisted by virtual twin environment [23].
In summary, most of the above-mentioned studies have contributed to the rapid development of resistance spot welding quality monitoring technology. However, there are limitations in the practical application of the current research results, and there is a mismatch between the actual welding conditions and the experimental conditions. To this end, this paper proposes a digital twin-based approach aimed at monitoring the resistance spot welding process in real time, establishing a high-precision quality evaluation model capable of adapting to a variety of situations, achieving dynamic control of welding quality, and ensuring product stability.
The main contributions of this paper are as follows: establishing a multi-scale twin model based on a real resistance spot welding environment, synchronizing the twin model with the physical model in real-time, and realizing resistance spot welding process optimization and quality monitoring on the basis of data collected in the field. Based on historical data and future data, the optimized process parameters are tested in twin space to validate the feasibility of the optimized solution afterward. Feedback of process parameters to physical entities for the online quality control of resistance spot welding is provided to promote the stability of product quality during production.

2. Resistance Spot Welding System and Digital Twin Environment

With the change in the manufacturing industry to flexible and intelligent, traditional welding process monitoring cannot meet the modern demand for fine and high-quality production, and it is difficult to realize the intelligent control of welding processes. Therefore, this paper proposes a digital twin model for the resistance spot welding process. This model consists of five modules: a physical entity layer, a model layer, a data layer, a communication layer, and an application layer, as shown in Figure 1.
Physical entity layer. The physical entity layer is the physical foundation of the digital twin technology and is also the underlying source for acquiring data. The physical entity layer is composed of elements such as the resistance spot welding equipment, work environment, workpieces, and operators, which contain a large amount of dynamic and static data that affect the quality of the weld.
Model layer. The model layer is a key vehicle for weld quality prediction by using the data obtained from the physical layer to build a high-fidelity simulation model. Its main function is to model the system on a multi-physical and multi-scale level.
Data layer. The data layer is the basis for the operation of the digital twin system. The constituent elements contain welding site sensor data, service data, and knowledge data, such as welding current, welding voltage, electrode pressure, and workpiece geometry information. The data layer is mainly responsible for data representation, classification, storage, maintenance, and pre-processing, driving the fusion of physical entities and twin models to realize their intelligent services.
Communication layer. According to the communication model, the communication layer can configure a wired network (industrial Ethernet) and a wireless network (such as industrial WiFi, ZigBee) to form a data transmission network, and use communication protocols such as MQTT to realize the transmission and analysis of multi-source heterogeneous data, and open up data link. Its main purpose is to aggregate and transmit all kinds of collected data online to realize two-way communication between the physical layer, model layer, data layer and service layer.
Application layer. The application layer contains two modules for real-time data processing and welding process monitoring. First, the data pre-processing module provides technical support for realizing the real-time monitoring of the welding process, and its main function is to monitor and analyze the real-time collected data and extract the data features. Second, the welding process monitoring module represents the technical embodiment of resistance spot welding process optimization. Its main function is to realize the dynamic formation process of resistance spot welding nucleus based on the twin model.

3. Welding Quality Monitor of Spot Welding Based on Digital Twin

3.1. System Working Framework and Process

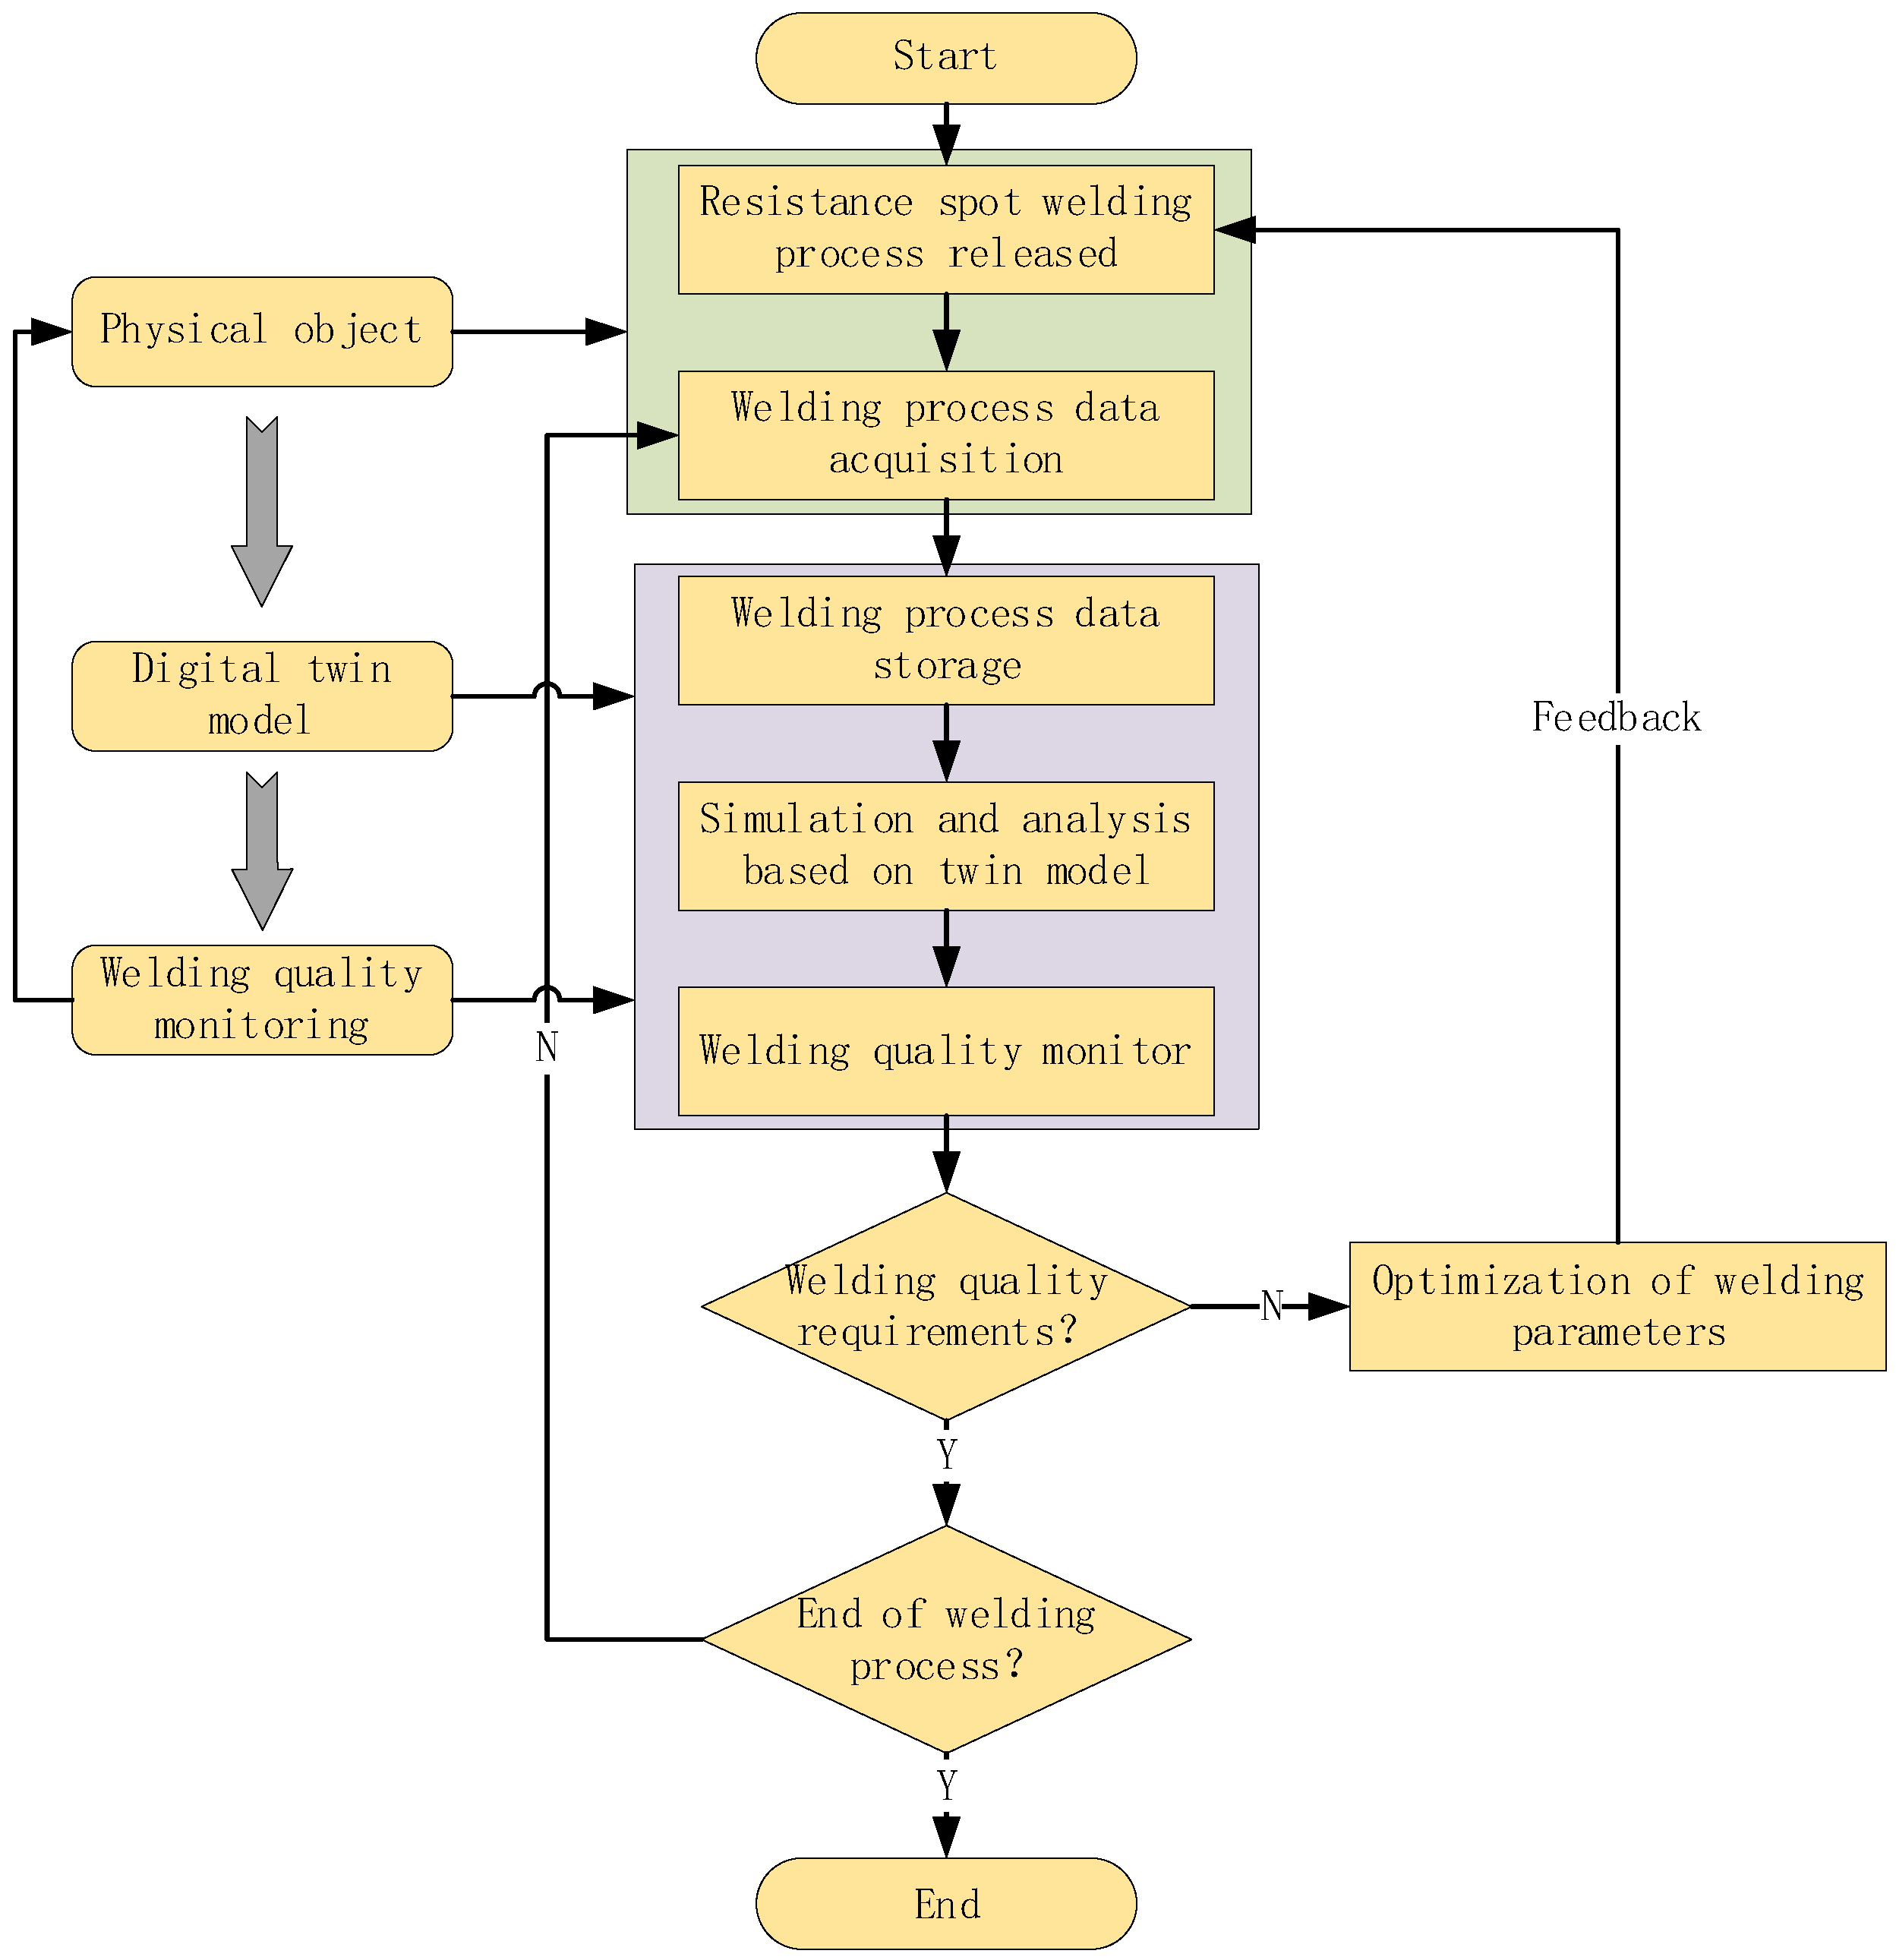
The flowchart of the digital twin-based system proposed in this paper is shown below. As shown in Figure 2.

3.2. Data Acquisition System for Resistance Spot Welding Process

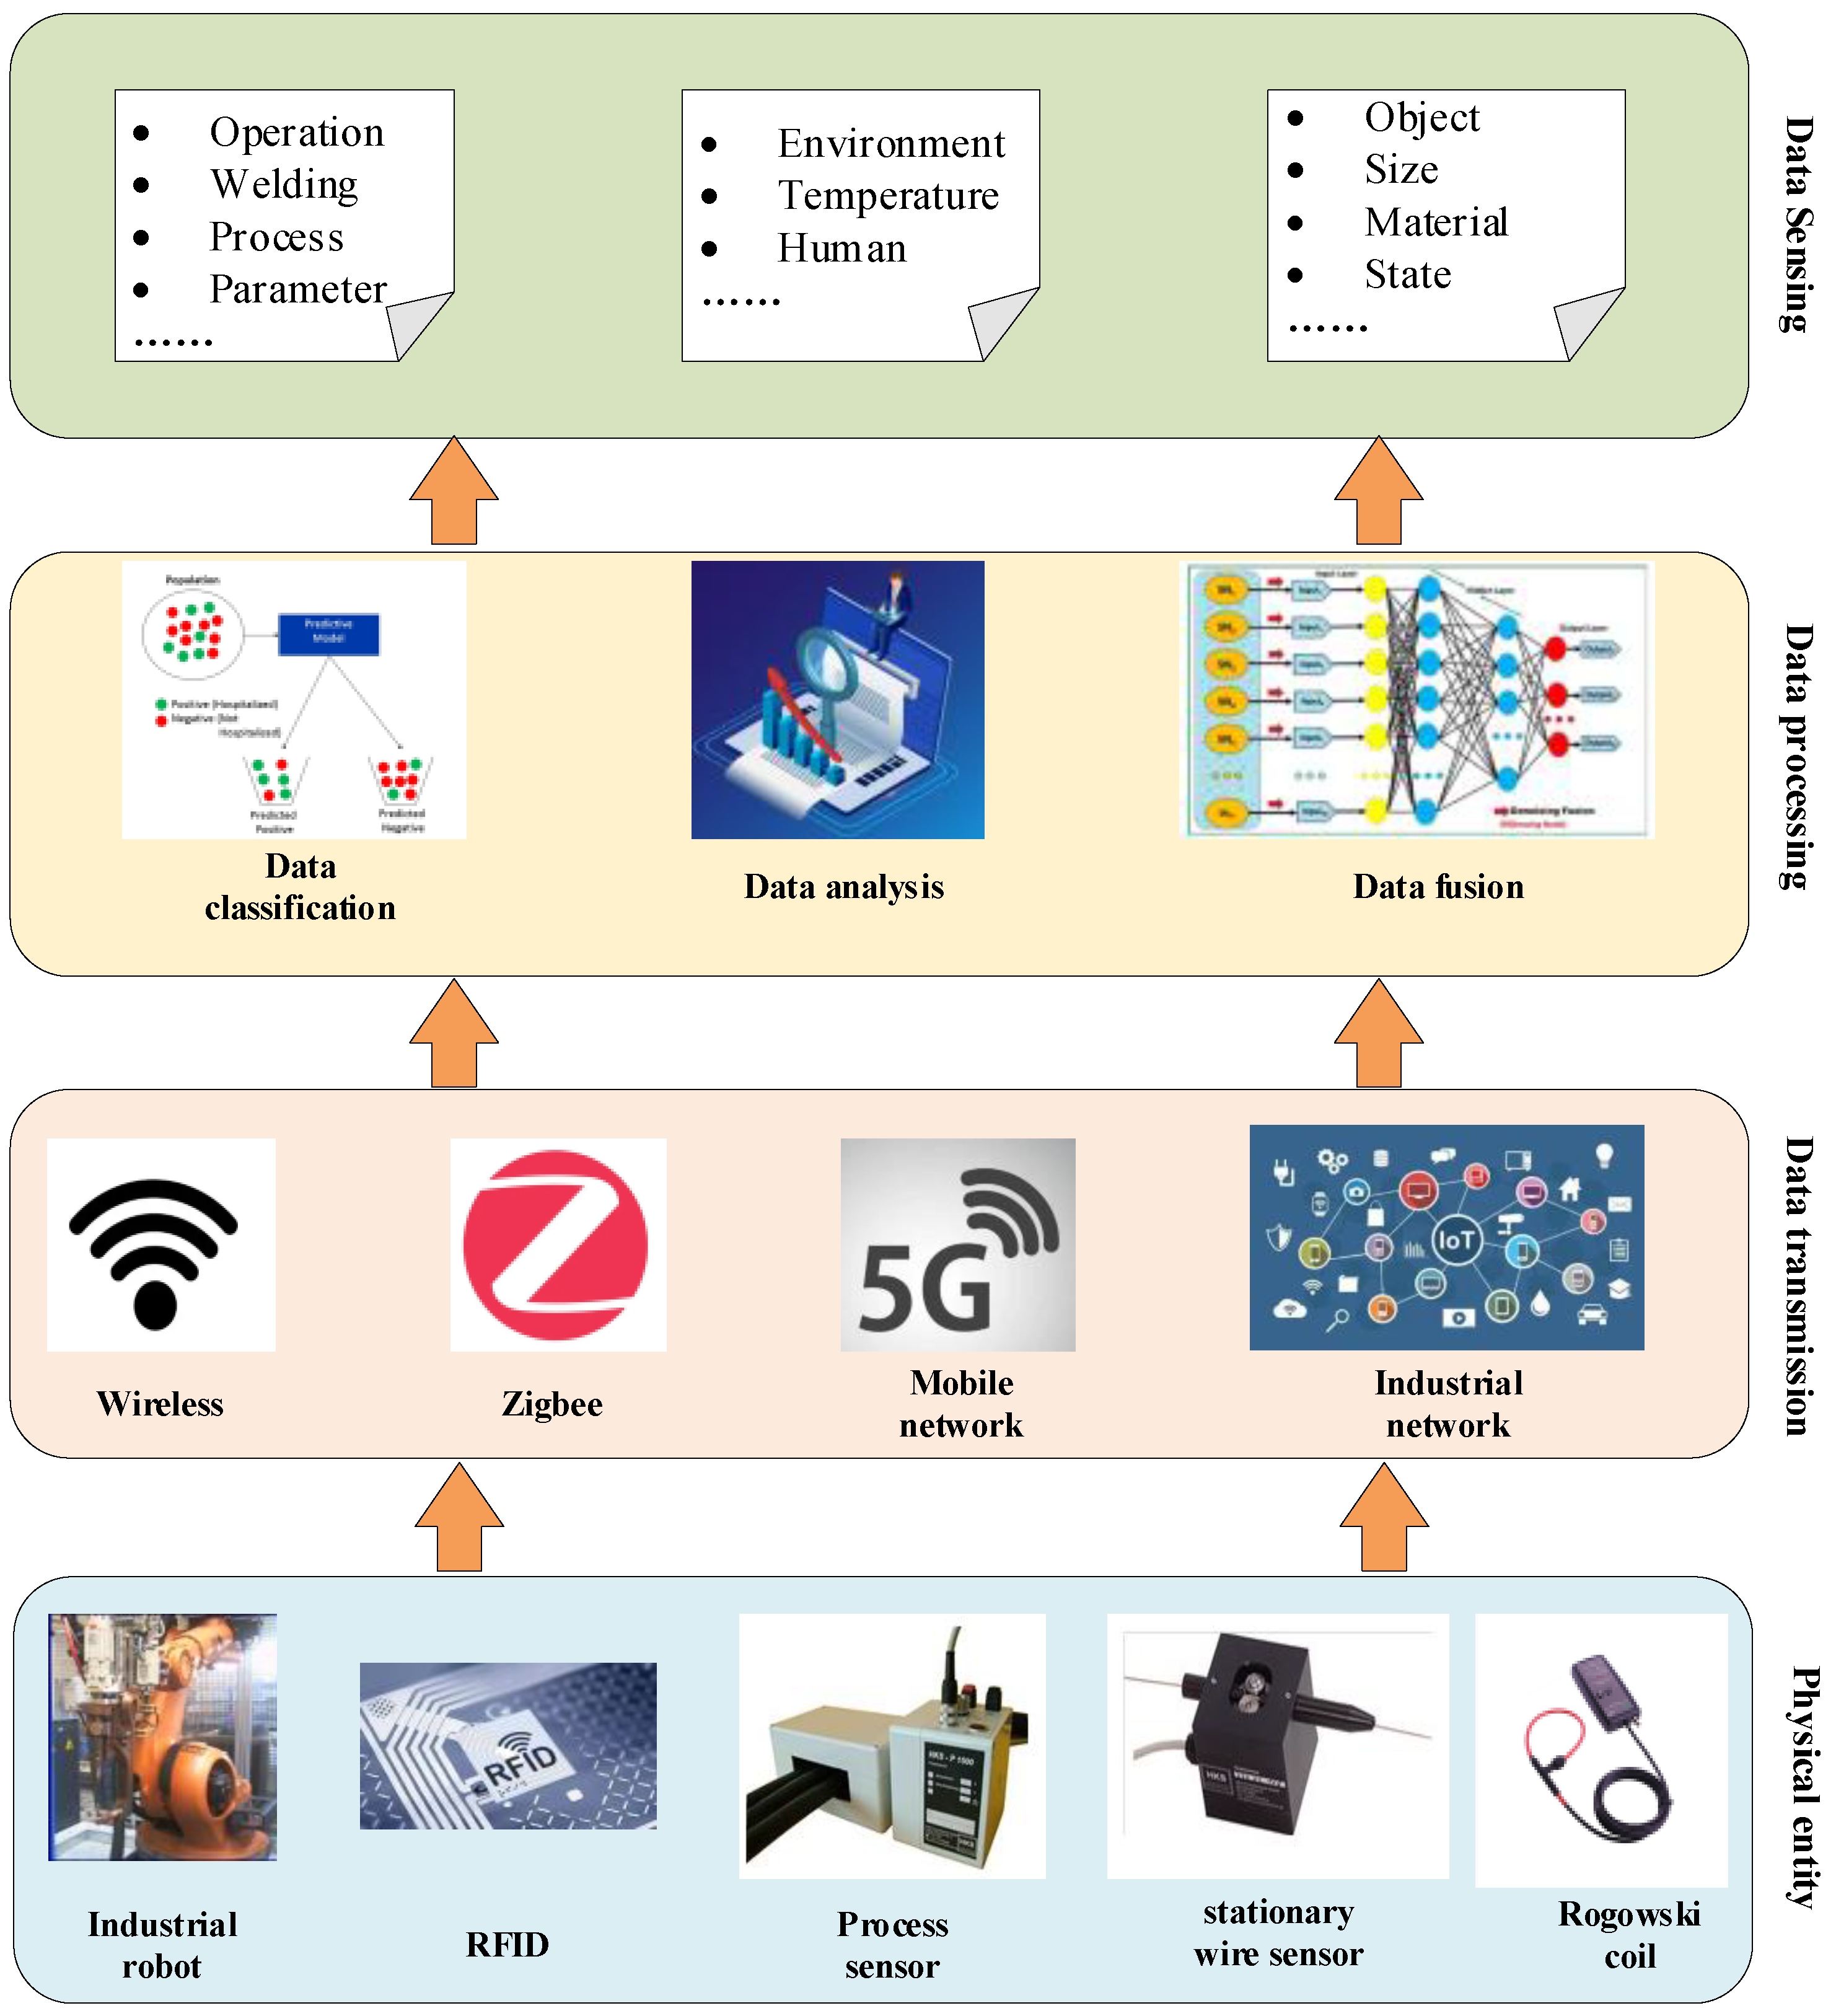
The digital twin system performs real-time dynamic mapping of physical entities, and the real-time data collection and updating are of vital importance for the digital twin system. The system expresses the welding status through distributed sensors collecting various types of physical quantity information from the system, while using the built transmission network to transmit the welding status information to the twin model in an efficient, real-time and accurate manner to establish data support for realizing real-time monitoring of the resistance spot welding process. As shown in Figure 3, the data acquisition system for resistance spot welding process includes four layers: the physical entity, data transmission, data processing and data sensing. The physical entity contains the physical manufacturing unit. The manufacturing unit is the main body that builds the data acquisition system and is the source of the quality data required for resistance spot welding quality monitoring; data transmission is an important step to support data fusion and integration. In the welding process, welding quality information is multi-sourced and heterogeneous, usually acquired from different sensors, and the data transmission part is able to meet the compatibility and scalability of processing welding quality information; Welding data processing ensures the integrity and accuracy of the original data and other quality prerequisites. Welding data processing is mainly responsible for the necessary processing of the collected data for review, screening and transformation, including data cleaning, data conversion, data fusion and data feature extraction methods, which can effectively improve the quality and efficiency of data analysis and reduce the complexity and time cost of the actual analysis. The data sensing via data awareness uses the original data, is real-time, effective and accurate, and provides accurate data for building digital twin models.

3.3. Real-Time Monitoring Data Processing and Storage

The monitoring data involved in the resistance spot welding process is detected and dynamically updated in real time using a data acquisition system, and the data are transmitted to the virtual space through technologies such as the Internet of Things. Real-time data collected by intelligent sensing devices have massive and redundant characteristics and cannot be used directly for welding process monitoring, requiring data pre-processing to identify redundant and abnormal data, and data-model mapping technology is used to drive a virtual space digital twin model to run simulations.
The resistance spot welding process releases a large number of acoustic, optical and thermal signals; while these signals are susceptible to interference from external conditions, the collected welding electrical signals need to be denoised to reduce the impact of interference. Common denoising methods include low-pass filtering, smoothing filtering and wavelet filtering in the frequency domain, among which wavelet filtering has good time–frequency localization characteristics to remove noise while retaining the detailed information of the original signal.

3.3.1. Theory of Wavelet Analysis

Since the time-domain sliding window processing of the conventional short-time Fourier transform is equivalent to the filtering of a frequency-domain filter bank, the frequency characteristics of each filter are the same, and the center frequencies are distributed at equal intervals along the analyzed frequency band, the time-domain equal-width method of analyzing non-smooth signals is not applicable. The wavelet transform is a multi-resolution signal analysis method which uses a grid to divide the time–frequency surface so that different time–frequency locations have different resolutions.
The theory of wavelet analysis is as follows.
Let x ( t ) be a square-integrable function, denoted as x ( t ) L 2 ( R ) , and ψ ( t ) is the fundamental wavelet function. Then
W T x ( α , τ ) = 1 α + x ( t ) ψ ( t τ α ) d t
where α is the scale factor, α = x ( t ) , ψ α τ ( t ) > 0 . τ indicates displacement. The above equation is called continuous wavelet transform. Its equivalent frequency domain is expressed as
W T x ( α , τ ) = α 2 π + X ( ω ) ψ ( α , ω ) e + j w τ d ω
By performing a denoising linear transformation of a signal using wavelet analysis, the wavelet transform of a signal can be viewed as a wavelet transform of the original signal and the noise.

3.3.2. Wavelet Threshold Noise Cancellation Analysis of Welding Process Signals

Since the electrical signals of the resistance spot welding process collected by the welding data acquisition system are interspersed with environmental noise, switching noise and other unavoidable interference, the collected signals need to be processed for noise reduction in order to eliminate the influence of external noise on the later data analysis results [24].
The wavelet threshold noise cancellation method is formulated as follows: assume that a one-dimensional signal model containing Gaussian noise is expressed in the following form,
y i = x i + e z i ( i = 0 , 1 , 2 , , n 1 ) ,
where x i is the true signal, and z i is the standard Gaussian white noise z i i i d N ( 0 , 1 ) , e is the noise level. y i indicates the signal with noise. Wavelet multi-resolution analysis can perform multi-resolution decomposition of the signal at different scales, decomposing the original signal into components of different frequency bands. In the actual welding process, the useful signal usually behaves as a low-frequency signal, while the noise component has high-frequency characteristics. By processing the noise part of the signal through wavelet thresholding, the original signal y i is recovered from the noise-containing signal x i to achieve the purpose of noise cancellation. The steps of wavelet threshold noise cancellation are as follows.
(1)
Perform orthogonal wavelet transform on the noise-containing signal, select the appropriate wavelet and wavelet decomposition level j, and obtain the corresponding wavelet decomposition coefficients.
(2)
Thresholding of wavelet coefficients at different scales is shown below.
The hard threshold method is as follows:
x = T h ( y , T ) = Y | y | T 0 | y | < T
where y is the original signal, T is the threshold value, and T h ( y , T ) is the signal after quantization by threshold.
The soft threshold method is shown below.
x = T h ( y , T ) = sgn ( y ) ( y T ) y T 0 y < T
The soft thresholding approach first makes the elements with absolute values less than the threshold zero, and second shrinks the remaining non-zero elements toward zero. The hard threshold is discontinuous at y = ±T, while the soft threshold is continuous at y = ±T.
(3)
Wavelet reconstruction. The signal is reconstructed by the low-frequency coefficients of the jth layer of wavelet decomposition and the high-frequency coefficients of the first to jth layers after quantization to obtain a signal with noise components eliminated.

4. Case Study

4.1. Case Background

In order to verify the effectiveness of the proposed digital twin-based resistance spot welding process quality monitoring method, simulations were performed with 2219 and 5A06 aluminum alloy resistance spot welding process data. The validation process of the digital twin-based resistance spot welding process quality monitoring method consists of three aspects. (1) A digital twin system. A physical-virtual welding process system is required to assist the process personnel in welding process monitoring, parameter tuning and evaluation of process instructions. (2) Real-time data pre-processing of the welding process. Sensor devices are used to obtain parameters such as welding current and electrode force in the resistance spot welding process, which are processed for noise reduction to obtain the input data needed for simulation. (3) Digital twin-based monitoring of the resistance spot welding process.

4.2. Welding Conditions and Materials

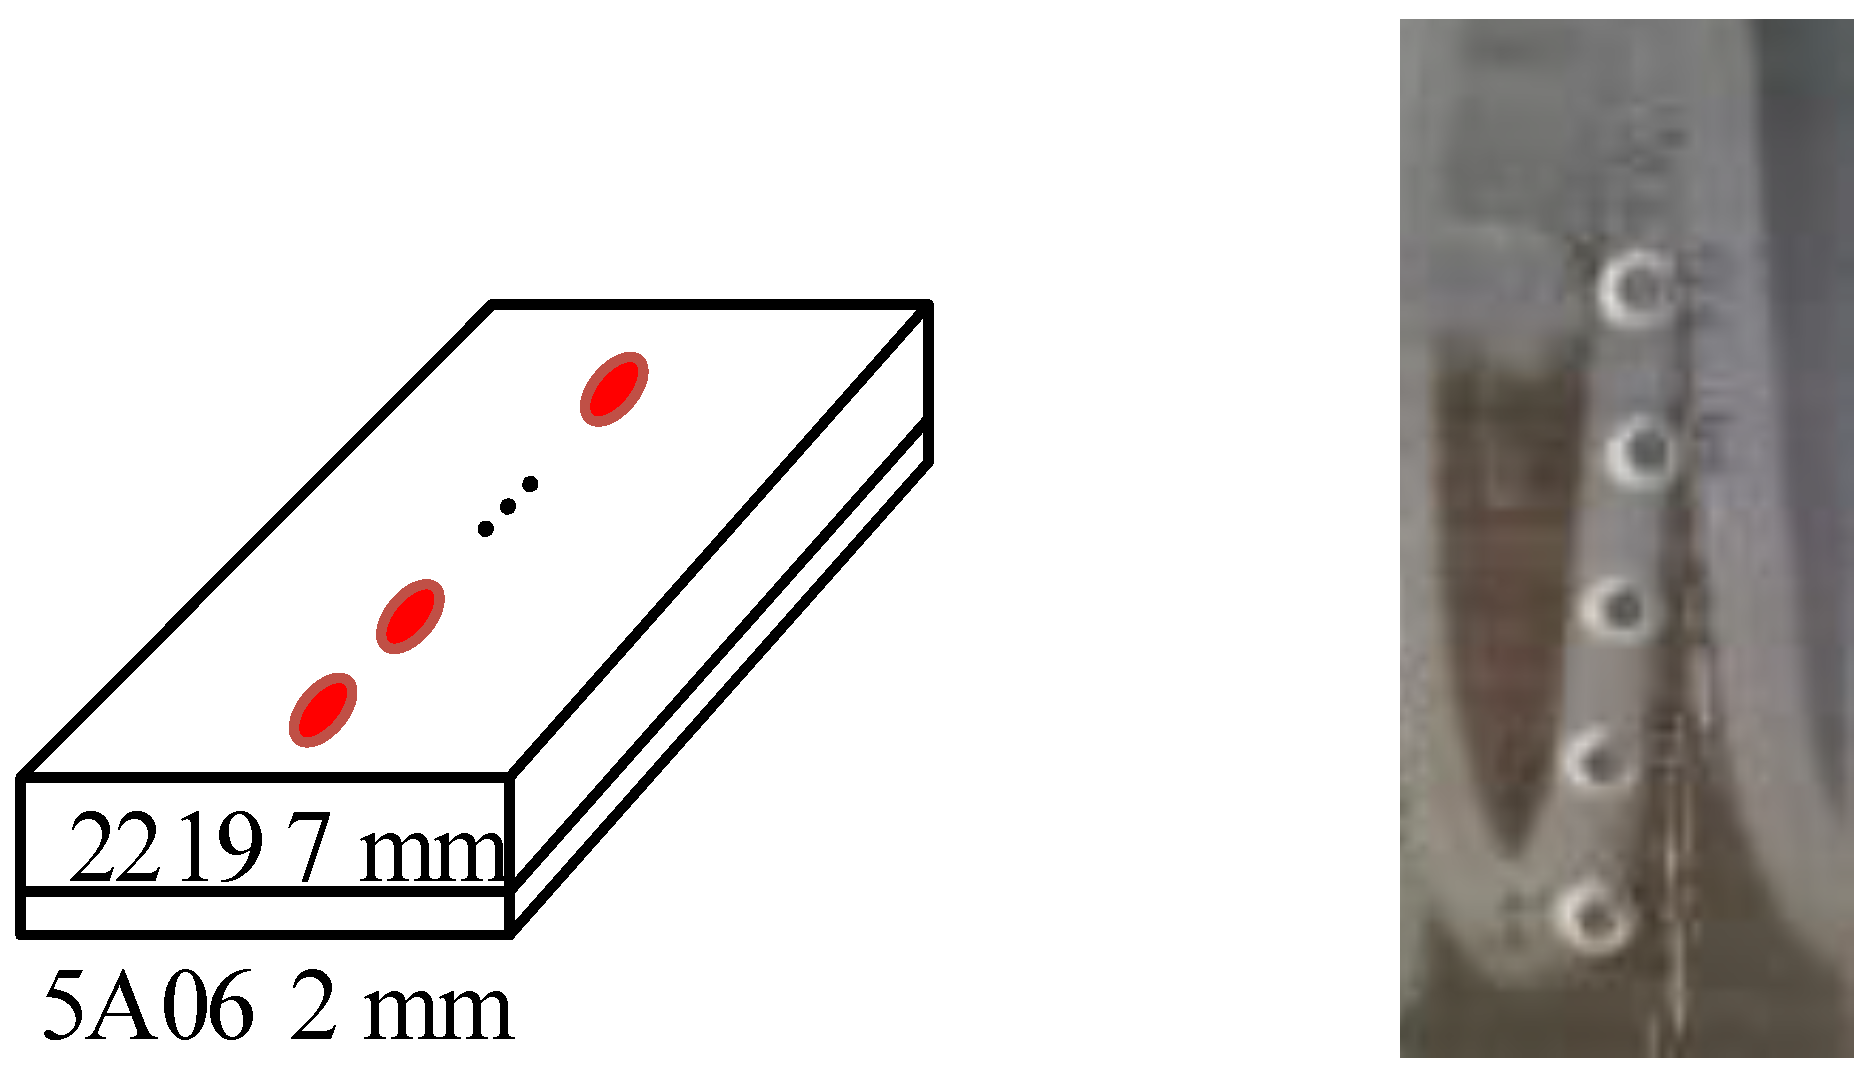
Figure 4 shows the size of the specimens used in the experiment and the working conditions of the margins. The specimen size is 30 × 300 × 7 (mm) and 30 × 280 × 2 (mm), respectively.
Two kinds of plates with different thicknesses and strengths were selected for the experiments: 2219 and 5A06, and their chemical composition and mechanical and thermal properties are shown in Table 1 and Figure 5.

4.3. Finite Element Modeling

In this section, Simufact Welding simulation software is used to study heat transfer behavior and nucleation law in the resistance spot welding of unequal-thickness aluminum plates [25]. The finite element model established in this section is shown in Figure 6 and contains 14,428 nodes and 25,850 nodes. The welded parts are two plates, the materials are 2219 and 5A06, the thicknesses are 7 mm and 2 mm, and the lengths and widths of the welded parts are 30 mm × 300 mm and 30 mm × 280 mm, respectively. Electrodes are selected from ISO5821 A0-16-20-100 and A0-13-18-100, with two welders completely fixed. A gap of 0.1 mm is set in the middle of the weld to simulate the assembly gap in the actual spot welding process. Due to the different degrees of roughness and cleanliness of the contact interface between the electrode and the weld and between the welds, there are different degrees of additional film resistance between the contact interface, and by setting the contact film thickness to take into account the influence of film resistance on the calculation, this section sets the contact film thickness to 0.05 mm. The elastic deformation of the electrode is not considered in the calculations in this paper—that is, the electrode is set as a rigid body. The finite element simulation of resistance spot welding of aluminum plates with unequal thicknesses was carried out by using the spot welding heat source model of Simufact software.
The initial mesh of the welded part is a 2 mm × 2 mm × 0.75 mm hexahedron, and the mesh of the central area of the spot weld is automatically refined during the calculation. This section sets the refinement level to 2 and the refinement radius to 5 mm, i.e., the mesh is refined within 5 mm of the weld joint location, and one refinement can cut a hexahedral mesh into 8 small hexahedra. The refinement level is 2, i.e., the weld joint area is tangentially refined twice. The software automatically performs the connection process for the excess area of the coarse and fine mesh.
The contact resistance used in this paper is calculated by the following formula:
ρ = 3 ( σ s σ n ) ( ρ 1 + ρ 2 2 ) + ρ c
where σ n is the contact surface pressure; σ s is the temperature-dependent rheological stress of the softer material; ρ 1 and ρ 2 are the temperature- and phase-organization-dependent resistances of the two materials on the contact surface; and ρ c is the contact resistance resulting from the coating and impurities.
The electrodes are made of chromium-zirconium copper, and the physical parameters of the electrodes are shown in the Table 2.
It is assumed that the welding current is uniformly distributed on the upper surface of the upper electrode and is allowed to pass through the contact area of the electrode–workpiece and workpiece–workpiece interfaces, eventually reaching the lower surface of the lower electrode. The bottom of the lower electrode is set to zero voltage. The convective heat transfer coefficients of the air to electrode and the cooling water to electrode were 19.4 and 3800 Wm 2 K 1 , respectively. The temperature of the cooling water and air was determined to be 20 °C.
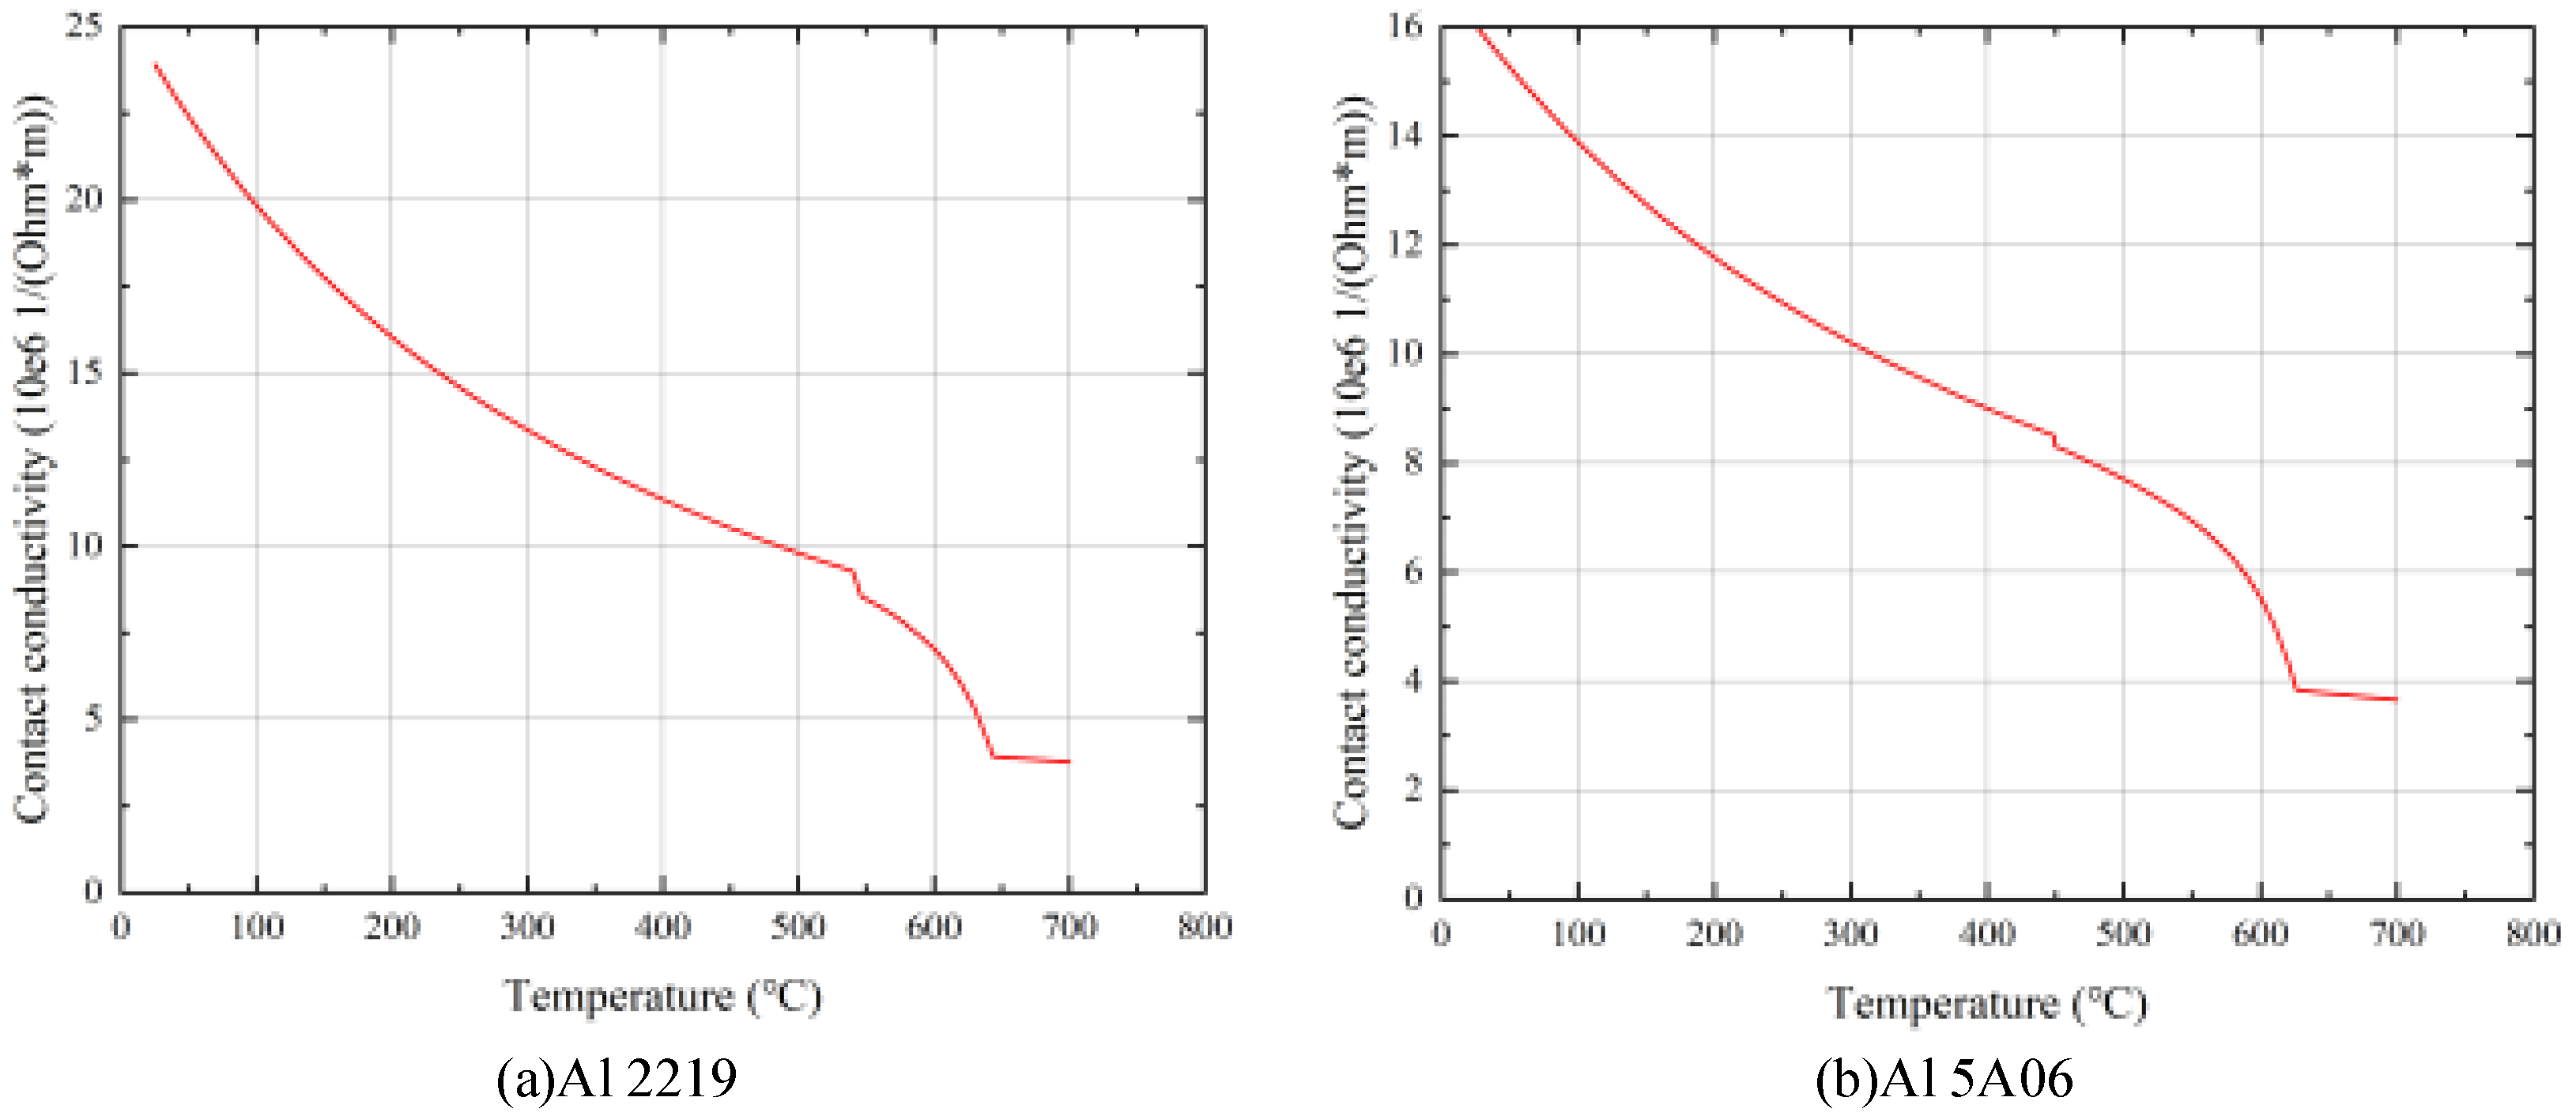
We set the contact conductivity between the electrodes and 5A06 and 2219, respectively, to the valuesshown in Figure 7.

4.4. Real-Time Data Collection and Processing of the Welding Process

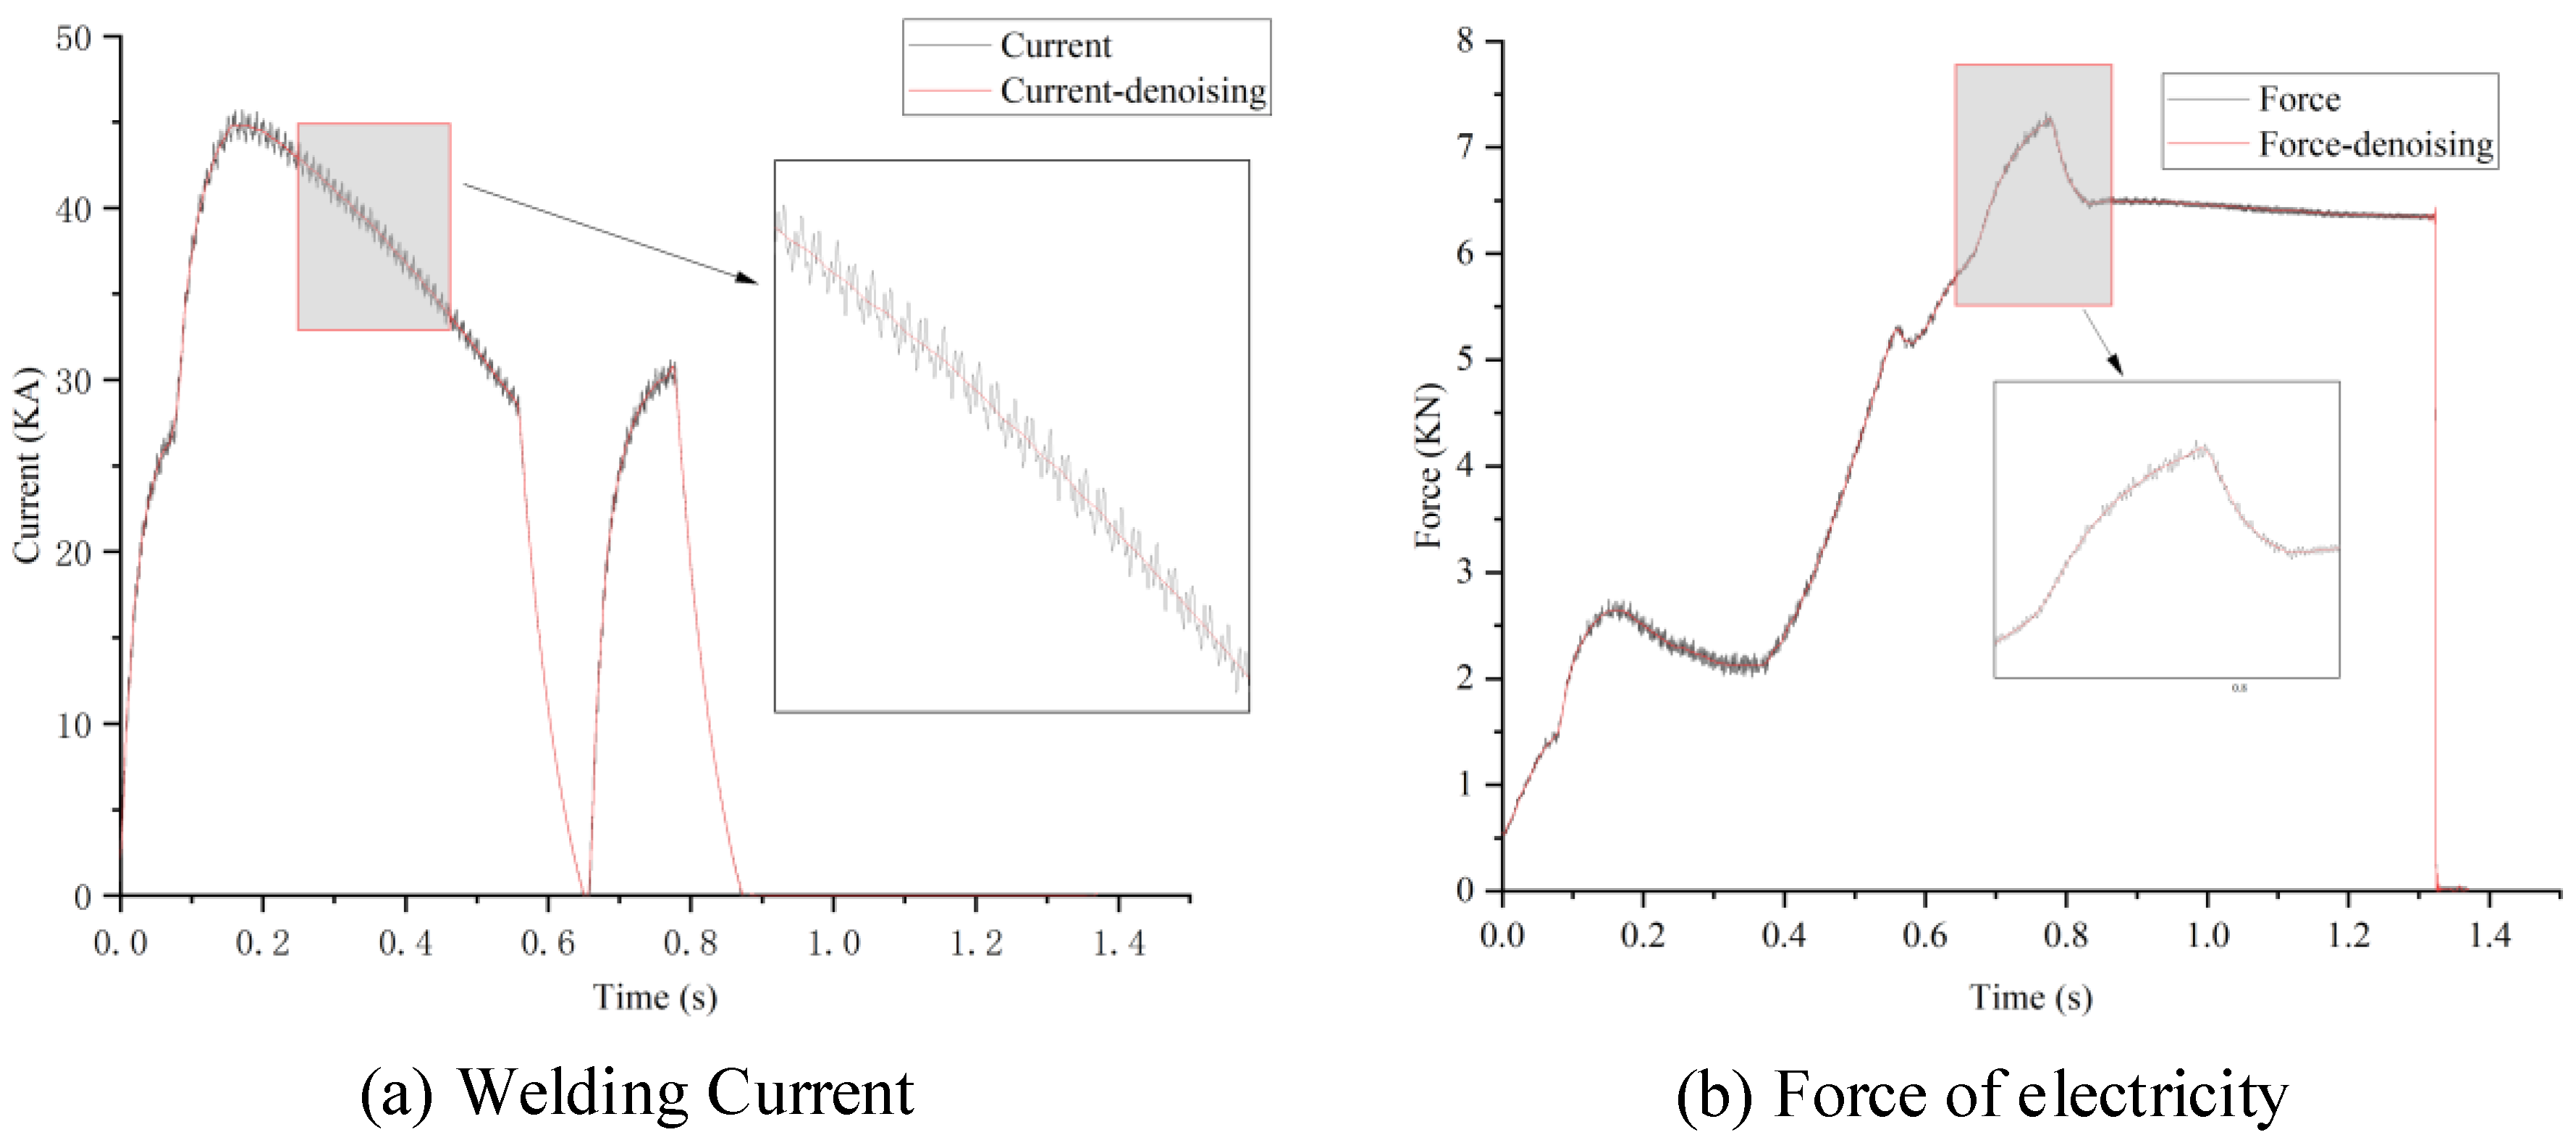
The welding process data acquisition system is produced by HKS Technology GmbH, Halle, Germany, with a sampling rate of 8000 HZ. The welding signal is collected from 0.012 s before power on, and the collected signal contains the welding current, welding voltage and electrode force. Figure 8 shows the original curve collected during the resistance spot welding experiment, and the pre-processed curve after noise elimination is obtained by using wavelet threshold noise elimination analysis with the following specific parameters—the wavelet type is DB4, the number of noise eliminations is 6, and the threshold value is 50% each time.
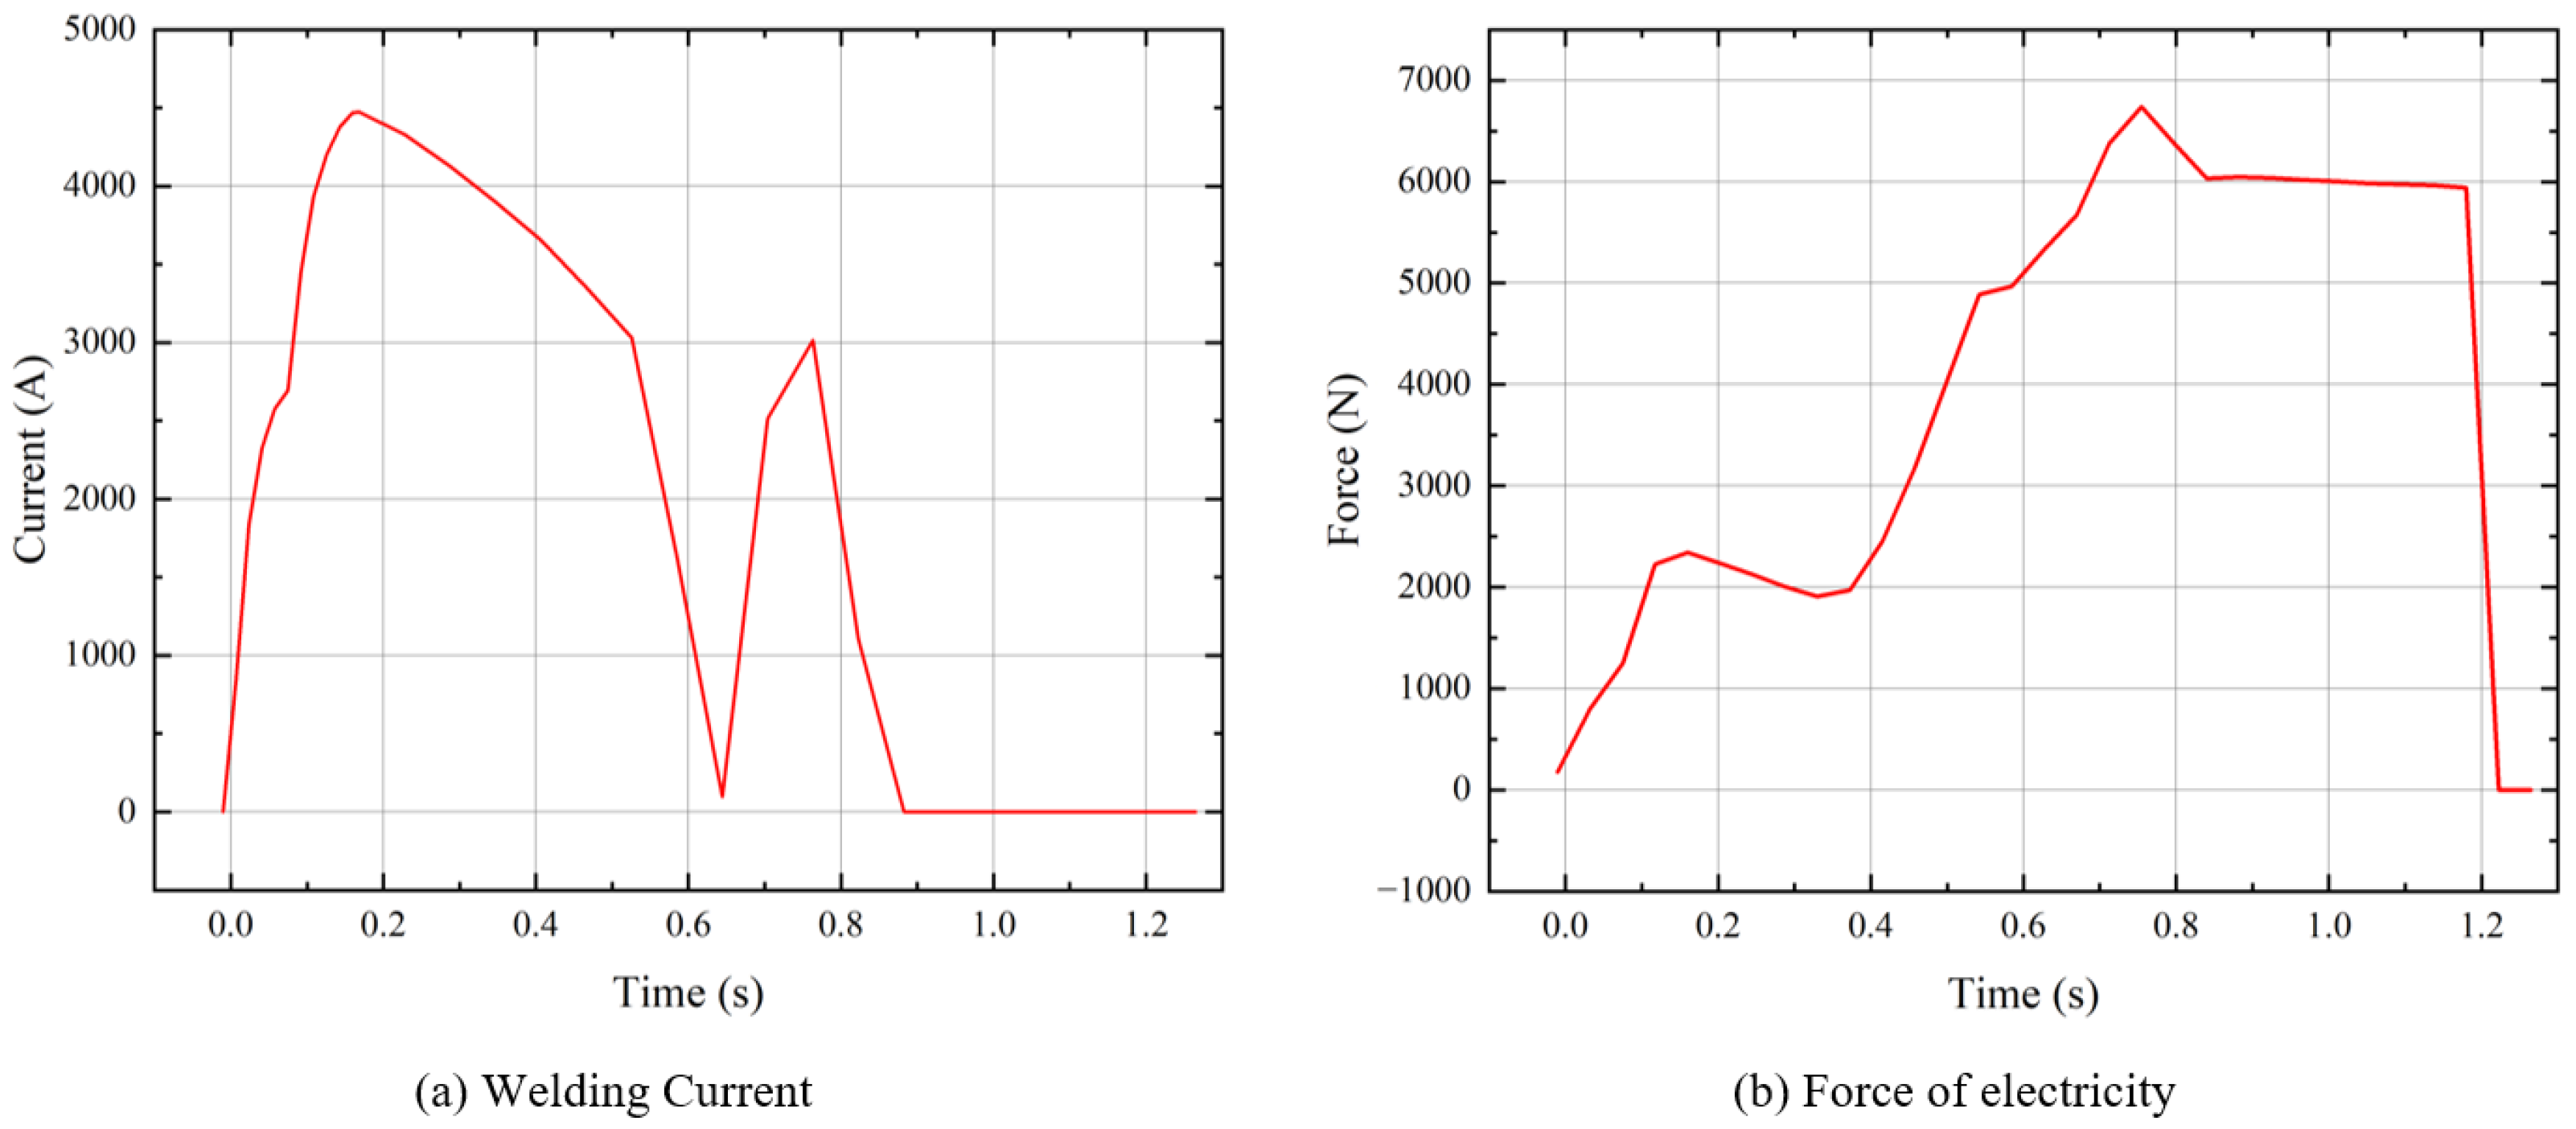
The data from the wavelet threshold noise elimination analysis are used as inputs for the resistance spot weld simulation to implement a finite element simulation based on real-time data acquisition. The finite element simulation welding parameters are shown in Figure 9.

5. Results and Discussion

The use of a digital twin model for 5A06/2219 spot welding process temperature field and current density changes with time simulation is presented in this paper. At the beginning of spot welding, the temperature field after 100 ms of welding current is shown in Figure 10a, and it can be seen from the figure that the temperature of the contact area between the spherical electrode and the aluminum plate is significantly higher than in other parts; at this time, the contact resistance is the dominant factor affecting the heat generation, and the heat is mainly generated at the interface.
Setting the spot welding time to 150 ms (Figure 10b), the time spent in the preheating phase of the second heating pulse is greater compared with the time spent in the preheating of the initial temperature field, when the heat production gradually increased from the contact resistance to the body resistance. Setting the spot welding time to 200 ms, for which the temperature field is shown in Figure 10c, the time entered the welding phase, the highest temperature of the workpiece reached 910 K, began to melt, and the overall source of heat at this time was the body resistance dominated by the resistance heat effect, causing the rapid growth of the molten nucleus. At 400 ms, for which the temperature field is shown in Figure 10d, the temperature field distribution trend did not change significantly, and the welding process tended to stabilize, at which point the welding process was complete, followed by the spot welding maintenance phase. After 1.25 s, the spot welding process ends.
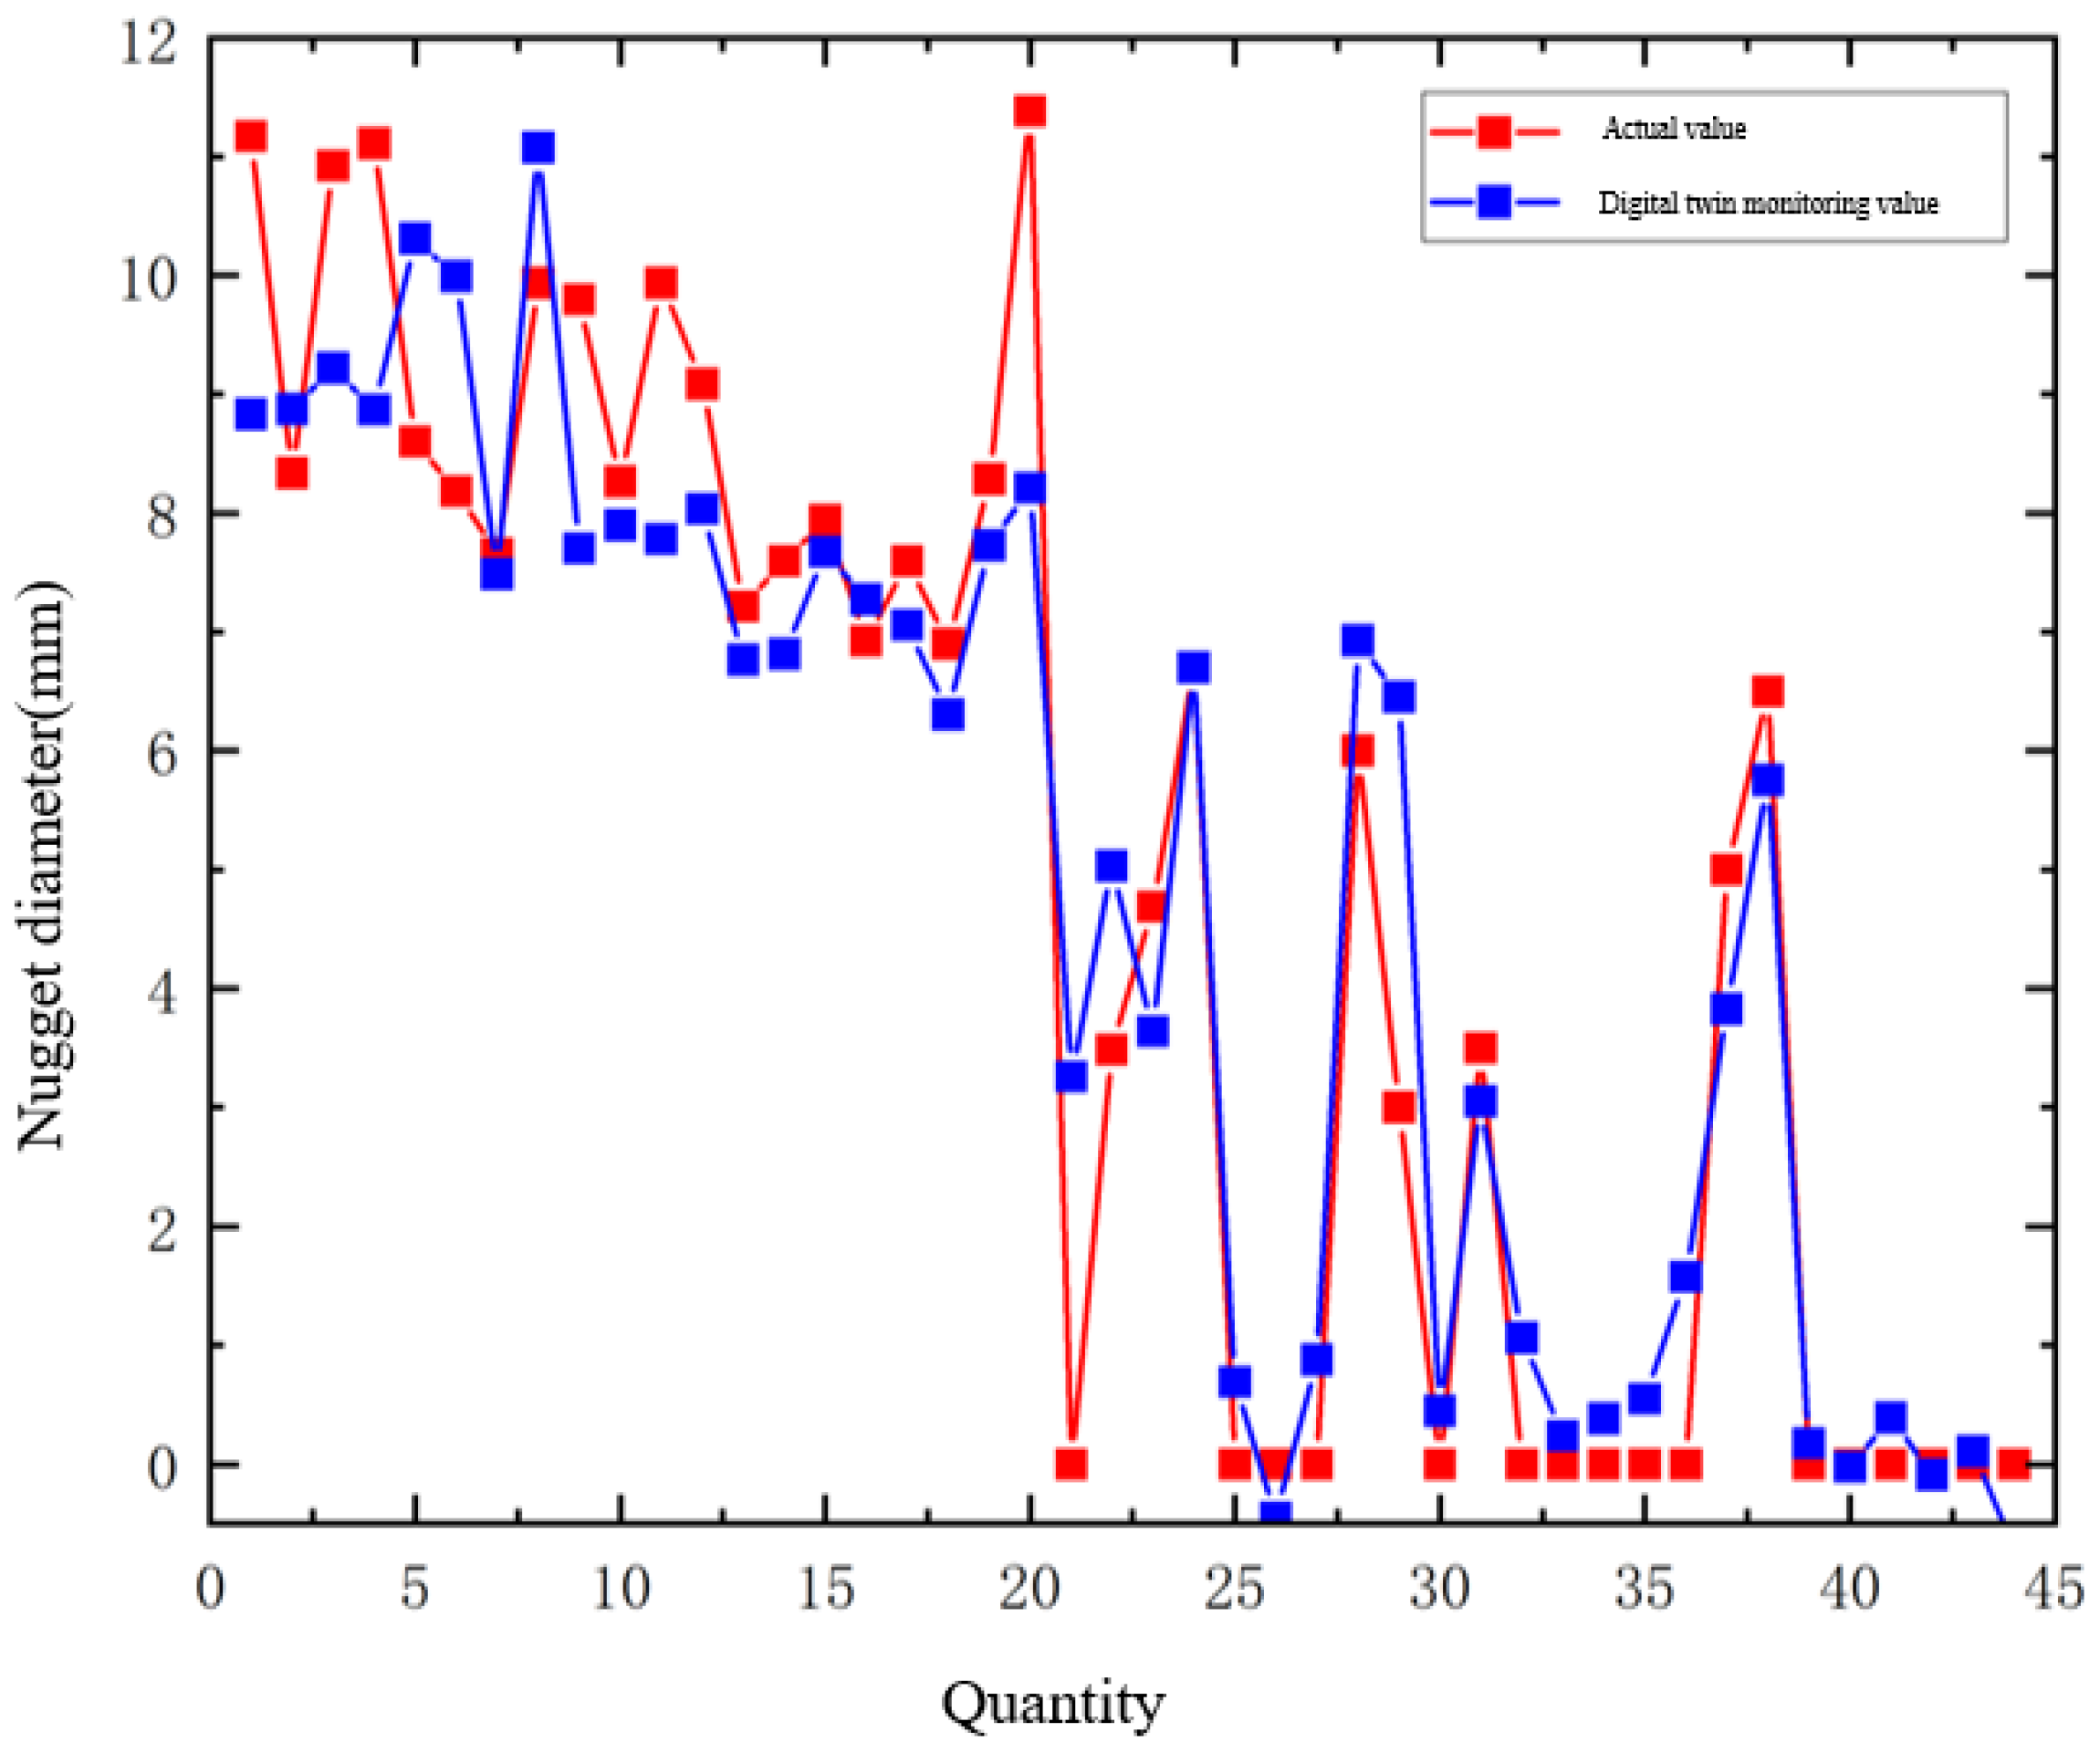
As shown in Figure 11, in the current study, the diameter of the molten core was monitored by means of the digital twin technique for the resistance spot welding process with 96% accuracy. The time consumption of the digital twin technique is negligible compared to the iterative calculation of the FEM. Real-time monitoring of the welding process can be achieved using digital twin technology, whereas FEM requires a significant amount of computation time. With the support of a data acquisition system, the digital twin technique allows for real-time monitoring of the welding process.
Through the comprehensive comparison of digital twin simulation and experimental verification, the results of monitoring the resistance spot welding process using digital twin technology accurately reflect the shape of the heat-affected zone and melting zone of the plastic adhesion of resistance spot welding, providing a theoretical reference for actual production.

6. Conclusions

Digital twin technology is a key technology to realize the fusion of physical and virtual models. In this paper, we propose a simulation calculation of the temperature field of the resistance spot welding process of heterogeneous materials using the digital twin model. A data acquisition system for the resistance spot welding process is established, and the data obtained are processed as an input source for the welding simulation using wavelet threshold noise elimination analysis. A case study of resistance spot welding of 5A06/2219 aluminum alloy is analyzed.
The digital twin model is used to obtain the temperature distribution of the workpiece at different times, and the formation and size change of the nuggets, so that the nugget formation process of resistance spot welding is clear and intuitive, and the numerical simulation based on sensor data is synchronized with the physical resistance spot welding process. The digital twin modeling of the resistance spot welding process proposes a feasible physical fusion method, which can provide a theoretical reference for production practice.
Meanwhile, the results of resistance spot weld monitoring with the application of digital twin technology are in general agreement with experimental measurements. The results show the practicality of digital twin technology for real-time monitoring of resistance spot welds.

Author Contributions

All authors contributed to the study conception and design. Conceptualization, J.D., J.H.; Experimental test and analysis, Z.L. All authors have read and agreed to the published version of the manuscript.

Funding

This research was funded by the National Natural Science Foundation of China, grant number 52075378.

Data Availability Statement

Data sharing is not applicable to this article.

Acknowledgments

Thanks for the great efforts of editors and reviewers.

Conflicts of Interest

The authors declare no conflict of interest.

References

  1. Zhou, K.; Yao, P. Overview of recent advances of process analysis and quality control in resistance spot welding. Mech. Syst. Signal Process. 2019, 124, 170–198. [Google Scholar] [CrossRef]
  2. Yamagishi, H. High-productivity and high-strength Fe/Al dissimilar metal joining by spot forge welding. Mater. Lett. 2020, 278, 128412. [Google Scholar] [CrossRef]
  3. Mallaradhya, H.M.; Kumar, M.V.; Chandra, M. Optimization of Parameters and Prediction of Response Values Using Regression and ANN Model in Resistance Spot Welding of 17-4 Precipitation Hardened Stainless Steel. J. Adv. Manuf. Syst. 2022, 21, 275–291. [Google Scholar] [CrossRef]
  4. Ghatei-Kalashami, A.; Zhang, S.; Shojaee, M.; Midawi, A.; Goodwin, F.; Zhou, N. Failure behavior of resistance spot welded advanced high strength steel: The role of surface condition and initial microstructure. J. Mater. Process. Technol. 2022, 299, 117370. [Google Scholar] [CrossRef]
  5. Fan, Q.; Xu, G.; Wang, T. The influence of electrode tip radius on dynamic resistance in spot welding. Int. J. Adv. Manuf. Technol. 2018, 95, 3899–3904. [Google Scholar] [CrossRef]
  6. Pérez de la Parte, M.; Espinel Hernández, A.; Sánchez Orozco, M.C.; Sánchez Roca, A.; Jiménez Macías, E.; Blanco Fernández, J.; Carvajal Fals, H. Effect of zinc coating on delay nugget formation in dissimilar DP600-AISI304 welded joints obtained by the resistance spot welding process. Int. J. Adv. Manuf. Technol. 2022, 120, 1877–1887. [Google Scholar] [CrossRef]
  7. Choi, D.-Y.; Sharma, A.; Uhm, S.-H.; Jung, J.P. Liquid metal embrittlement of resistance spot welded 1180 TRIP steel: Effect of electrode force on cracking behavior. Met. Mater. Int. 2019, 25, 219–228. [Google Scholar] [CrossRef]
  8. Panza, L.; De Maddis, M.; Spena, P.R. Use of electrode displacement signals for electrode degradation assessment in resistance spot welding. J. Manuf. Process. 2022, 76, 93–105. [Google Scholar] [CrossRef]
  9. Pandya, K.S.; Grolleau, V.; Roth, C.C.; Mohr, D. Fracture response of resistance spot welded dual phase steel sheets: Experiments and modeling. Int. J. Mech. Sci. 2020, 187, 105869. [Google Scholar] [CrossRef]
  10. Ko, W.-H.; Gu, J.-C.; Lee, W.-J. Energy efficiency improvement of a single-phase ac spot welding machine by using an advanced thyristor switched detuning capacitor bank. IEEE Trans. Ind. Appl. 2018, 54, 1958–1965. [Google Scholar] [CrossRef]
  11. Su, Z.-W.; Xia, Y.-J.; Shen, Y.; Li, Y.-B. A novel real-time measurement method for dynamic resistance signal in medium-frequency DC resistance spot welding. Meas. Sci. Technol. 2020, 31, 055011. [Google Scholar] [CrossRef]
  12. Ji, C.; Zhou, Y. Dynamic electrode force and displacement in resistance spot welding of aluminum. J. Manuf. Sci. Eng. 2004, 126, 605–610. [Google Scholar] [CrossRef]
  13. Zeng, J.; Cao, B.; Tian, R. Heat generation and transfer in micro resistance spot welding of enameled wire to pad. J. Manuf. Process. 2022, 82, 113–123. [Google Scholar] [CrossRef]
  14. Wang, B. A study on spot welding quality judgment based on hidden Markov model. ARCHIVE Proc. Inst. Mech. Eng. Part E J. Process Mech. Eng. 1989–1996 2020, 235, 095440892095395. [Google Scholar] [CrossRef]
  15. Tang, H.; Hou, W.; Hu, S.; Zhang, H. Force characteristics of resistance spot welding of steels. Weld. J. N. Y. 2000, 79, 175. [Google Scholar]
  16. Liu, M.; Fang, S.; Dong, H.; Xu, C. Review of digital twin about concepts, technologies, and industrial applications. J. Manuf. Syst. 2020, 58, 346–361. [Google Scholar] [CrossRef]
  17. Zhang, H.J.; Wang, F.J.; Gao, W.G.; Hou, Y.Y. Quality assessment for resistance spot welding based on binary image of electrode displacement signal and probabilistic neural network. Sci. Technol. Weld. Join. 2014, 19, 242–249. [Google Scholar] [CrossRef]
  18. Dai, W.; Li, D.; Tang, D.; Wang, H.; Peng, Y. Deep learning approach for defective spot welds classification using small and class-imbalanced datasets. Neurocomputing 2022, 477, 46–60. [Google Scholar] [CrossRef]
  19. Vda, B.; Sm, A. Digital Twin: Generalization, characterization and implementation. Decis. Support Syst. 2021, 145, 113524. [Google Scholar]
  20. Tao, F.; Qi, Q. Make more digital twins. Nature 2019, 573, 490–491. [Google Scholar] [CrossRef] [Green Version]
  21. Tabar, R.S.; Wrmefjord, K.; Sderberg, R.; Lindkvist, L. Efficient Spot Welding Sequence Optimization in a Geometry Assurance Digital Twin. J. Mech. Des. 2020, 142, 102001. [Google Scholar] [CrossRef]
  22. Wang, Q.; Jiao, W.; Zhang, Y.M. Deep learning-empowered digital twin for visualized weld joint growth monitoring and penetration control. J. Manuf. Syst. 2020, 57, 429–439. [Google Scholar] [CrossRef]
  23. Zhang, Q.; Xiao, R.; Liu, Z.; Duan, J.; Qin, J. Process Simulation and Optimization of Arc Welding Robot Workstation Based on Digital Twin. Machines 2023, 11, 53. [Google Scholar] [CrossRef]
  24. Yusof, M.; Ishak, M.; Ghazali, M.F. Classification of weld penetration condition through synchrosqueezed-wavelet analysis of sound signal acquired from pulse mode laser welding process. J. Mater. Process. Technol. 2020, 279, 116559. [Google Scholar] [CrossRef]
  25. Bauer, A.; Yupiter, H.; Sprungk, J.; Graf, M.; Awiszus, B.; Prajadhiana, K. Investigation on forming-welding process chain for DC04 tube manufacturing using experiment and FEM simulation. Int. J. Adv. Manuf. Technol. 2019, 102, 2399–2408. [Google Scholar] [CrossRef]
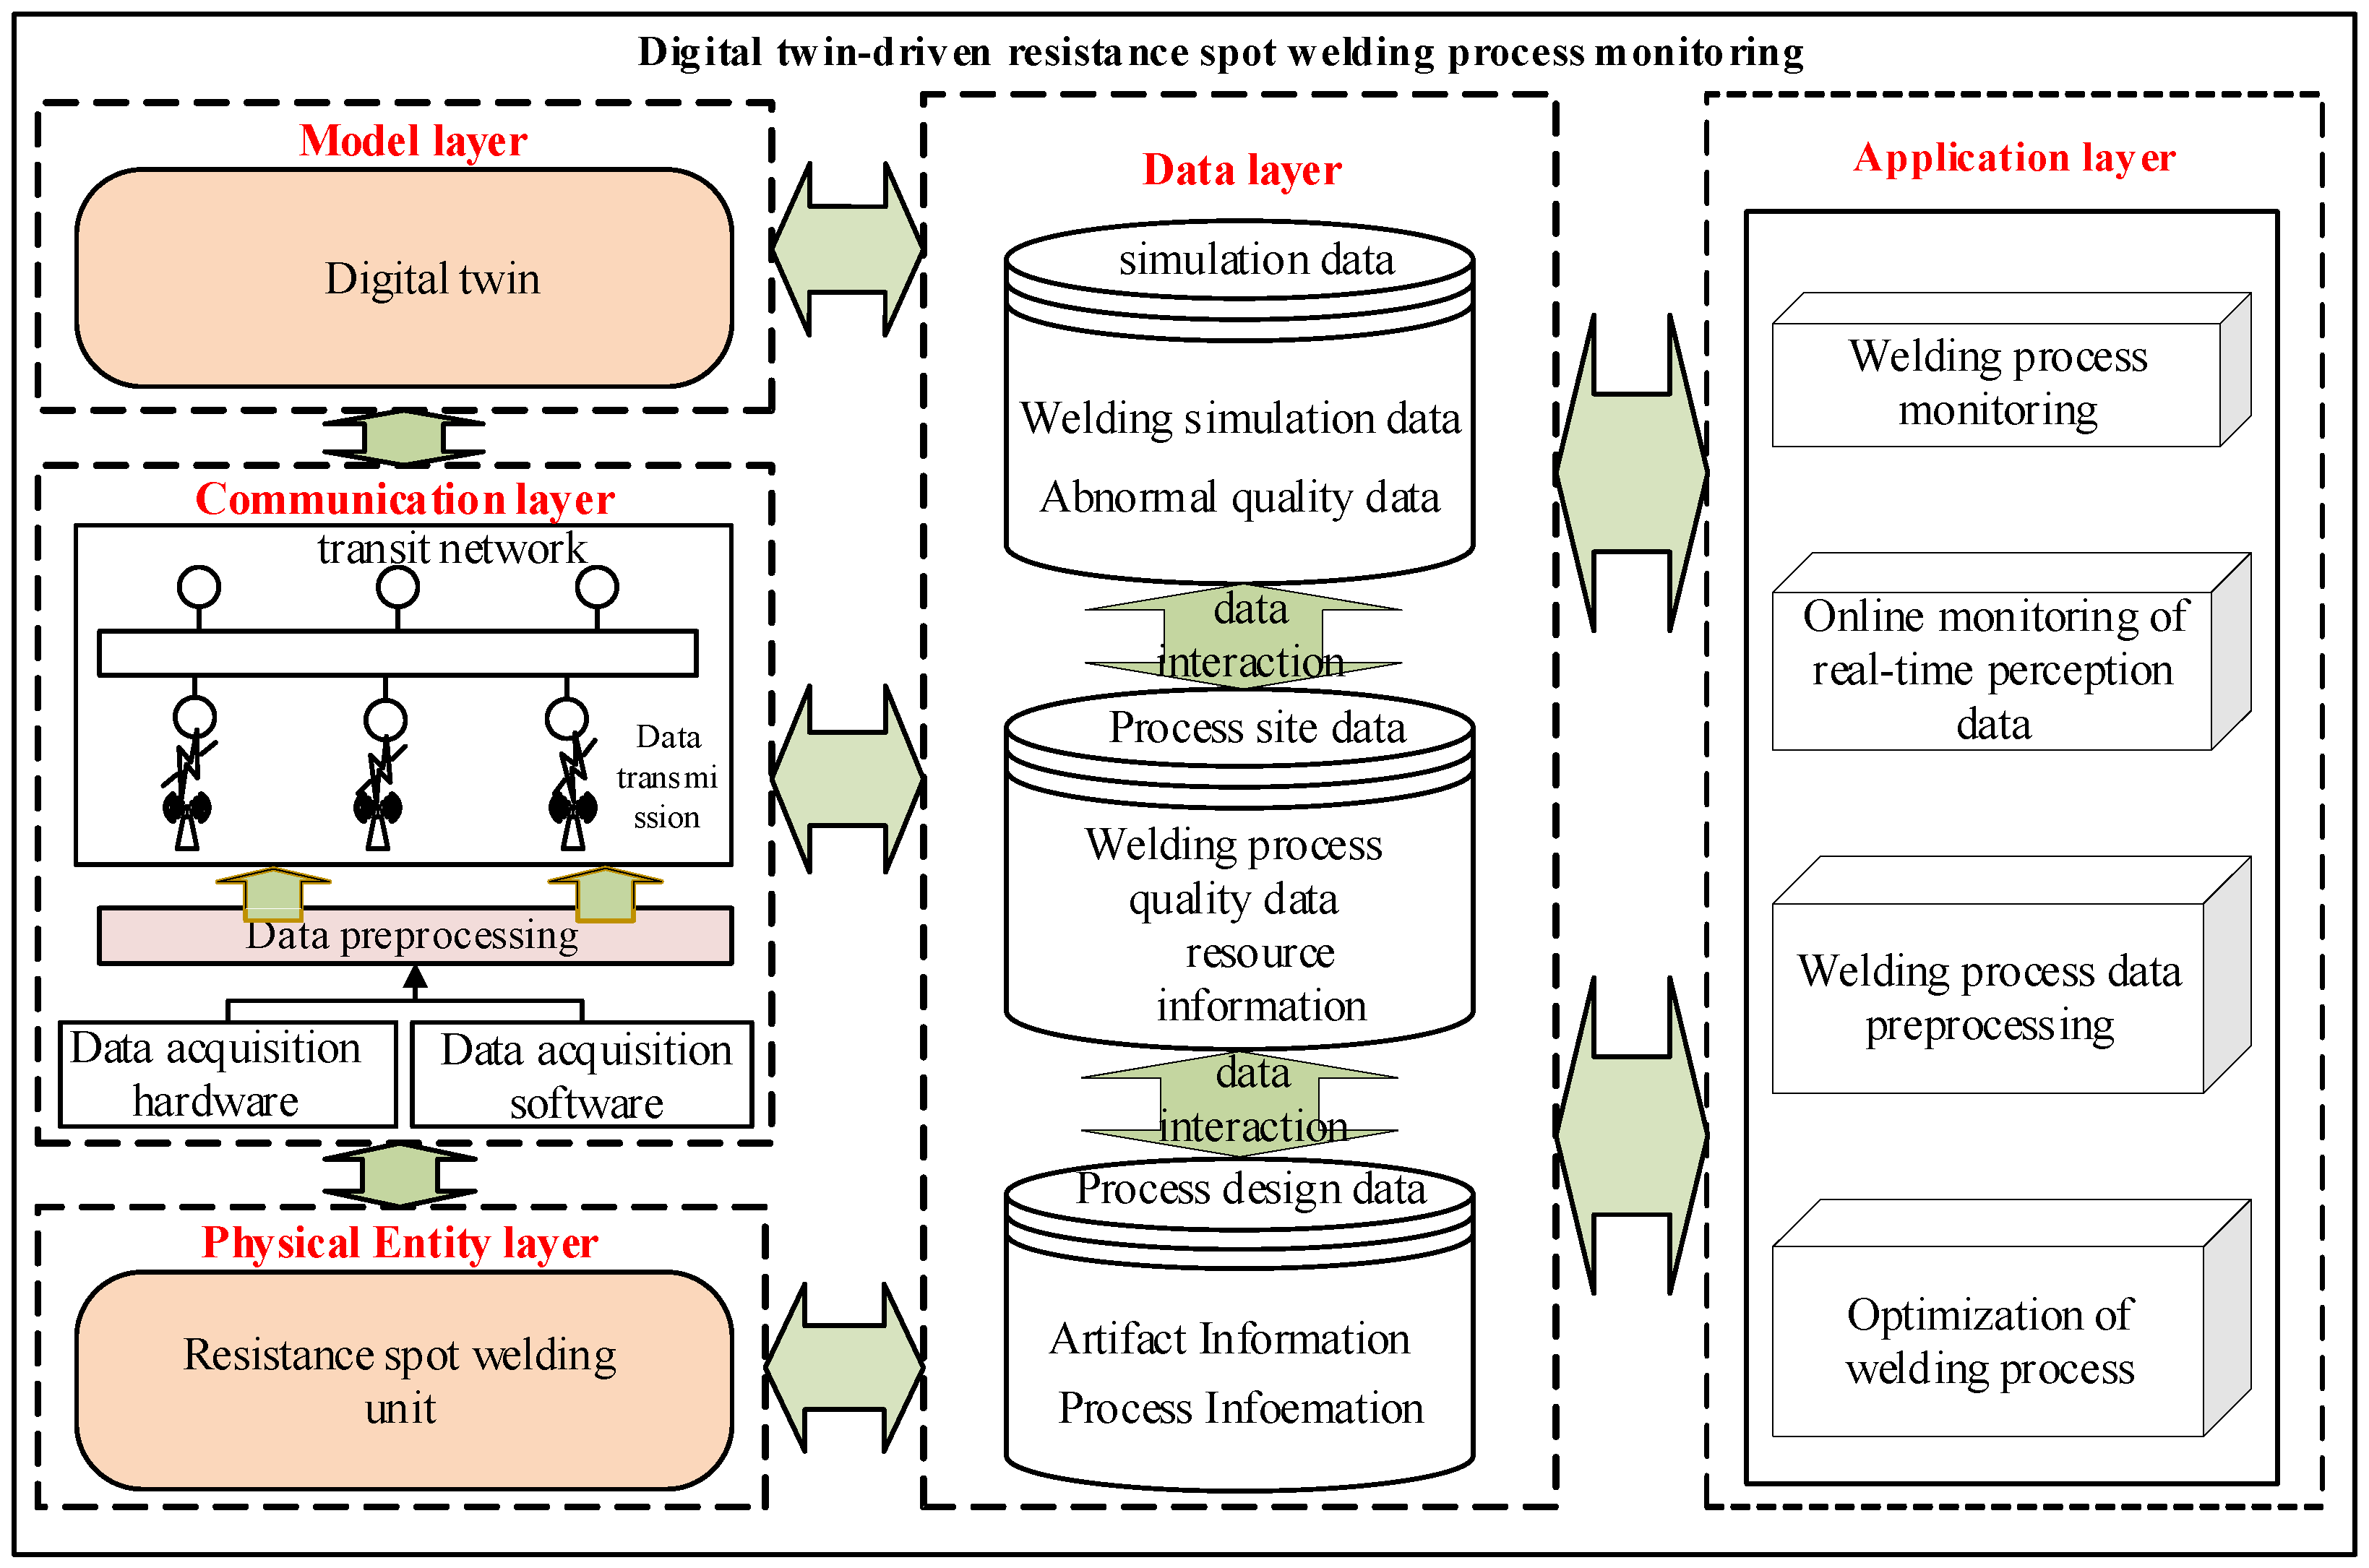
Figure 1. Framework of a digital twin system for the resistance spot welding process.
Metals 13 00697 g001
Figure 2. System workflow.
Metals 13 00697 g002
Figure 3. Real-time acquisition system for resistance spot welding process.
Metals 13 00697 g003
Figure 4. Specimen size and spacing working conditions.
Metals 13 00697 g004
Figure 5. Mechanical properties (af), electrical conductivity (d), thermal properties (e,f) of 2219 and 5A06.
Metals 13 00697 g005
Figure 6. 5A06/2219 finite element model.
Metals 13 00697 g006
Figure 7. (a) contact conductivity between 2219 and electrode, (b) contact conductivity between 5A06 and electrode.
Metals 13 00697 g007
Figure 8. Curves after wavelet threshold noise cancellation, welding current (a), force of electricity (b).
Metals 13 00697 g008
Figure 9. Digital twin model input data, (a) welding current, (b) force of electricity.
Metals 13 00697 g009
Figure 10. Twin model simulation of resistance spot welding temperature field changes.
Metals 13 00697 g010
Figure 11. Comparison between the actual value and the digital twin monitoring value.
Metals 13 00697 g011
Table 1. Chemical composition of 2219 and 5A06.
MaterialSiFeCuMgVMnZrZnTiAgLiAl
22190.060.176.30.020.10.310.150.020.07--Bal.
5A060.060.130.036.4 0.6 0.020.05--Bal.
Table 2. Physical properties of chromium-zirconium copper electrodes.
Temperature/°CThermal Conductivity/(W/(m·°C))Resistivity/(10−8Ω·m)Specific Heat CapacityPoisson’s RatioDensity
213902.6439.80.318900
2043703.9942.0
4263456.1944.3
6493208.0046.5
8713109.4848.0
10913019.4848.0
Disclaimer/Publisher’s Note: The statements, opinions and data contained in all publications are solely those of the individual author(s) and contributor(s) and not of MDPI and/or the editor(s). MDPI and/or the editor(s) disclaim responsibility for any injury to people or property resulting from any ideas, methods, instructions or products referred to in the content.