Article

Effect of Lean Alloyed Al and Ca on the Texture Development of Cold Rolled Mg Sheets

by
Wassilios J. Delis
*,
Lukas Berners
,
Sandra Korte-Kerzel
and
Stefanie Sandlöbes-Haut
Institute for Physical Metallurgy and Materials Physics, RWTH Aachen University, 52074 Aachen, Germany
*
Author to whom correspondence should be addressed.
Metals 2023, 13(4), 712; https://doi.org/10.3390/met13040712
Submission received: 10 March 2023 / Revised: 24 March 2023 / Accepted: 25 March 2023 / Published: 5 April 2023

Abstract

:
Lean alloyed Mg-Al-Ca alloys reveal weakened basal-type texture intensities and increased room-temperature ductility when compared to pure Mg. Since the combined effects of the alloying elements Al and Ca on texture evolution are not yet fully understood, in this study, two binary and seven ternary Mg-Al-Ca alloys (ranging between 0–2 wt.-% Al and 0–0.5 wt.-% Ca) were subjected to cold rolling with texture measurement after each rolling step. These measurements showed that the basal-type texture of Mg is weakened by the addition of Ca, while the addition of Al leads to stronger basal-type textures compared to the samples containing Ca. The joint effect of Al and Ca can, for specific alloy compositions, lead to a steady-state basal texture intensity, which does not become stronger with further rolling. We expect that the solubility limit of Ca in Mg affects this behaviour. For comparison, mechanical properties were obtained by compression testing, showing high degrees of deformation, of 15–25%.

1. Introduction

Magnesium and Mg alloys combine low density with moderate strengths, delivering a promising lightweight structural metal to replace common Al alloys and modern steels and further increase the efficiency of industrial applications [1]. However, their poor room-temperature ductility, which is mainly caused by their hexagonal structure, prevents wrought Mg alloys from entering commercial processing [2,3]. The activation of mainly basal slip and tension twinning limits the overall formability and leads to sharp basal-type textures during cold rolling [4,5].
Therefore, further cold rolling leads to premature failure and complex processing routes need to be applied. Extrusion [6,7], asymmetric/cross rolling [8,9,10], and microstructure optimisation with grain refinement [11,12,13] have been successfully used in previous research to modify the texture. Intrinsic alloy development approaches with the addition of alloying elements have also been established. In particular, the addition of rare earth (RE) elements [14,15,16,17], especially Y [18,19], Gd [18], Nd [15,20], and Ce [18,21], has been shown to lead to texture improvement.
To overcome the use of these costly and rare elements, Pei et al. [22] and Sandlöbes et al. [23] identified Mg-Al-Ca as a suitable alloy system with similar texture weakening behaviour. Even small amounts of the alloying elements showed a significant impact on the texture formation compared to pure Mg. Here, a higher level of non-basal slip activity was observed. Non-basal slip is known to contribute to texture weakening and to increase formability [14,24]. Recently, Jo et al. [25] investigated the impact of the Al content in Mg-Al-Ca alloys, confirming texture weakening and the improvement of the formability with decreasing amounts of Al. Further, Nandy et al. [26] indicated that the addition of Ca weakens the basal texture and decreases the critical resolved shear stress (CRSS) anisotropy, leading to enhanced ductility, while Al helps to increase strength. In our previous study [27], texture measurements of as-recrystallized (as-RX) samples with the same compositions as those investigated in this work also showed weaker basal textures and revealed that the alloy system is very sensitive towards compositional changes.
It has been shown that the initial texture is an important parameter influencing the formability during cold rolling. For an AZ31 alloy, Atik et al. [28] measured higher strains during cold rolling with off-basal textures and less strain localisation than with the initial basal-type texture. In addition, high amounts of tension twins were observed. Further, in the same alloy system, shear bands were observed after a height reduction of 10% during the cold rolling of a sample with a basal-type texture and no shear bands for an off-basal texture [29]. The lack of shear bands was attributed to the activation of both prismatic <a> slip and tension twinning. Recently, Lee et al. [30] showed large shear bands for AZ31, which they attributed to double twins occurring during cold rolling of a sample with a basal-type texture, whereas, in a sample of the same alloy with an off-basal texture, it was mainly the tension twins that were active, leading to very fine micro-shear bands and, therefore, a finer microstructure.
The influence of both the initial textures and the two alloying elements, Al and Ca, on the texture in Mg during cold rolling remains to be unraveled. This study aims to systematically determine the effect of the Al and Ca contents on the texture by varying their amounts and investigating the influence of different cold-rolling degrees, considering samples with basal normal direction (ND) as well as off-basal transverse direction (TD) orientations. To achieve this aim, we deformed two binary and seven ternary Mg-Al-Ca alloys by step-wise cold rolling, and analysed their texture and microstructure after each rolling step using x-ray diffraction (XRD) and electron backscatter diffraction (EBSD).

2. Experimental Methods

Sample synthesis was performed by casting and subsequent hot rolling to an overall thickness reduction of 50%. Elemental Mg, Al, and Ca with purities higher than 99.98% were used as starting materials. The casting procedure was conducted in an induction furnace under pressure and Ar atmosphere. The subsequent hot rolling was achieved in thickness-reduction steps of 10% at 430 °C, with intermediate reheating of 10 min. Next, at an annealing temperature of 450 °C, a recrystallization treatment with subsequent water quenching was carried out. Table 1 shows the investigated sample compositions in wt.-%, which is used throughout this study unless otherwise stated.
Samples for texture measurement were cut out of the sheets with electrical discharge machining (EDM). The ND samples had a fixed length of 3 cm and width of 1.5 cm, while the TD samples were 3 cm long and 1 cm high. The variable dimension was the initial sheet thickness, which varied between 11.9 and 13.4 mm. A rolling mill from Carl Wezel Mühlacker was used to perform cold rolling. The roll diameter was 250 mm and the rotation velocity was 15.7 m/min. The target height reduction (εh) per pass was 5%. Between the rolling steps, a slice of 4–5 mm was cut by EDM for texture investigation. This procedure was identical for both investigated rolling directions with ND and TD facing upwards, respectively. Throughout this paper, the sample nomenclature is “Sx_ND/TD_ε%”, with x indicating the sample composition and ε% denoting the height reduction. The mechanical properties were measured with compression tests in the same loading direction as during cold rolling with the TD orientation facing upwards. The cylindrical compression samples had a diameter of 6 mm and were 9 mm high. A ZWICK 1484 universal testing machine (ZwickRoell AG, Ulm, Germany) was used for testing, with an initial strain rate of 10−3 s−1.
Texture measurements were conducted with a D8 Advance X-ray texture diffractometer (Bruker, Karlsruhe, Germany) with a FeKα target. All specimens were mechanically ground and polished with diamond paste down to 1 µm. A total of six pole figures were measured per sample. Parameters used for the orientation distribution function (ODF) calculation were 3.5° for half width and resolution, respectively. For both ND- and TD-oriented samples, the rotation of the ODF from the ND–TD-plane to the RD–TD-plane was necessary to visualise basal (0002)-peak intensities.
For EBSD, the samples were further polished with diamond paste to 0.25 µm and finished with an electropolishing step using AC2 by Struers (30 V, 30 s, −20–−30 °C) (Struers GmbH, Willich, Germany). A Helios Nanolab 600i (FEI, Eindhoven, The Netherlands) was used for imaging using a current of 5.5 nA and acceleration voltage of 20 kV, with a 70° tilted sample setup. Further analysis of the texture components was performed with the MTEX package for MATLAB (2020a, MathWorks, Inc., MA, USA) [31] and Python (3.8, Python Software Foundation, DE, USA).
In addition to the representation of the texture in (0002) pole figures, two distinct features of the textures were analysed: the spread ratio of the basal peak towards TD and RD directions and the prevalence of a component in the pole figures. For the spread-ratio parameter, the basal peak was averaged in a range of 10° around TD and RD, respectively. The spread of the basal peak towards TD or RD is represented by the integral half width of both averaged peaks, which was calculated using Simpson’s rule. The ratio of TD over RD represents a prevalence of TD spread when the parameter was larger than one. With respect to the prevalent component, only the rim of the {10 1 ¯ 0} pole figure was plotted to obtain a one-dimensional representation, which is more intuitive to analyse.

3. Results

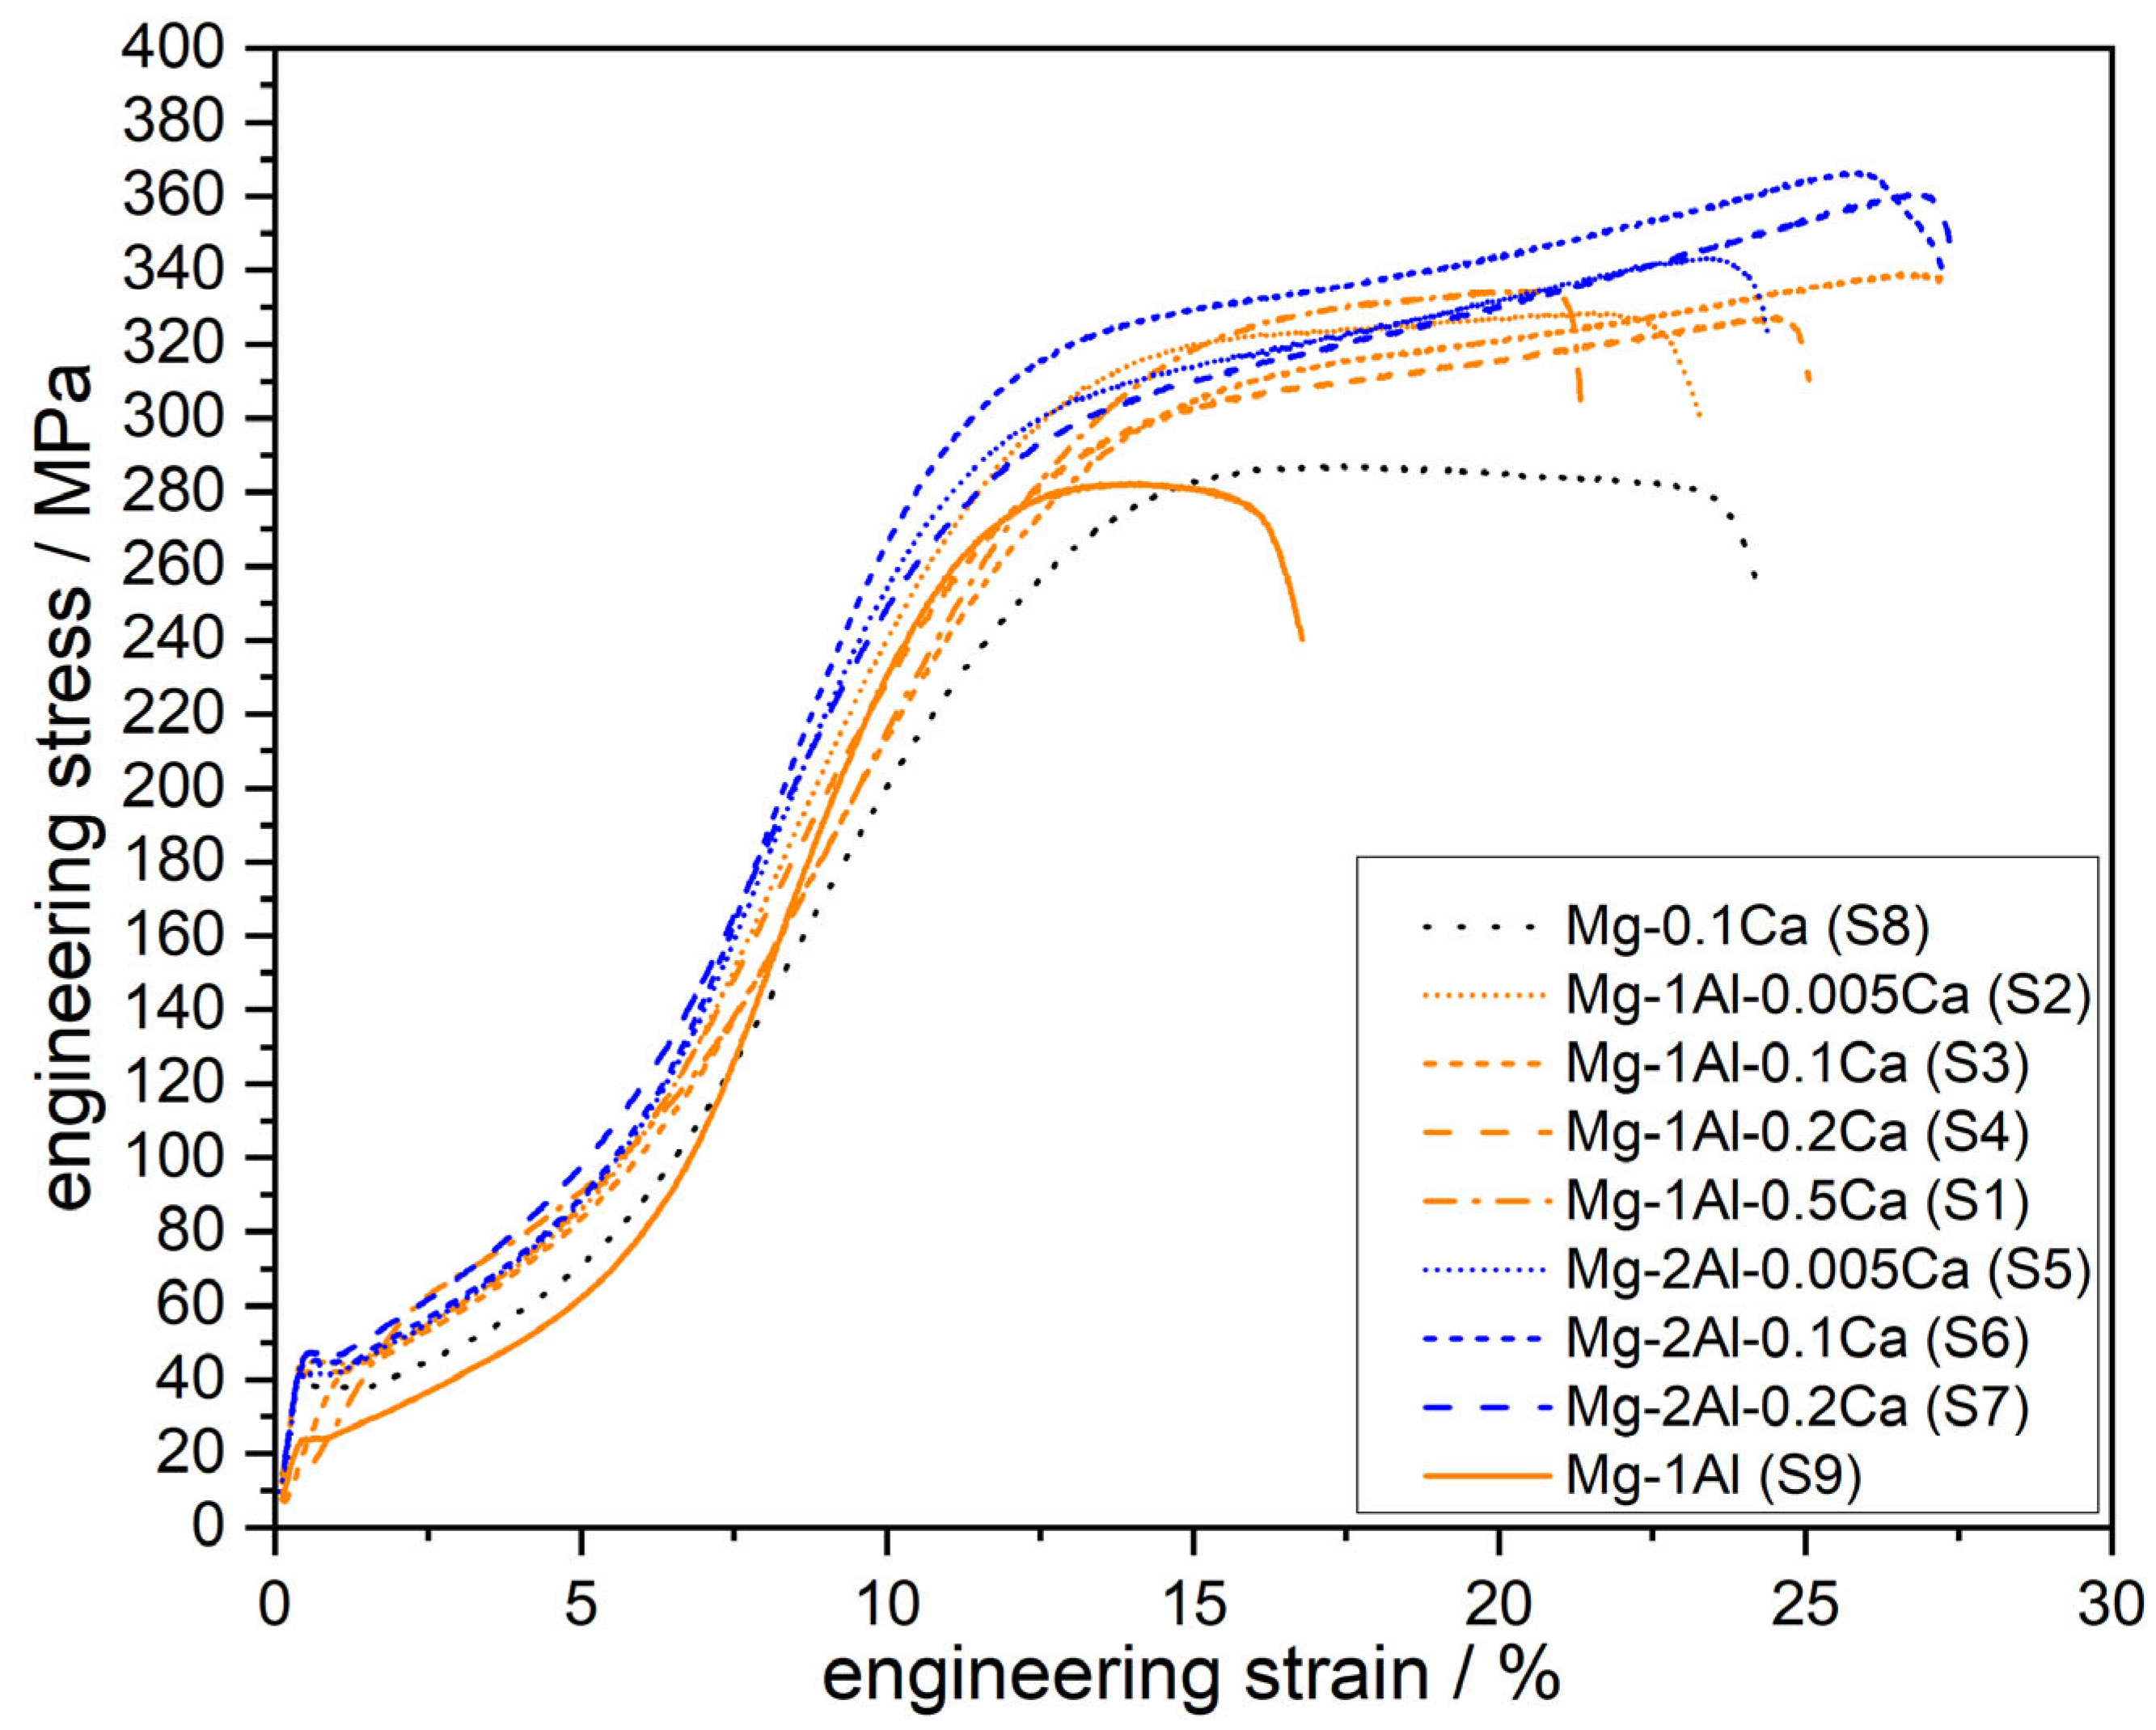
3.1. Mechanical Properties and Cold Rolling

The screening of the mechanical properties was performed through compression testing of the as-recrystallized material. Compression testing was selected, as the stress state during compression testing is more similar to the stress state during rolling than tensile testing. However, tensile tests on the same alloys were reported in [27]. The results of the compression tests are shown in Figure 1.
All the alloys showed clear ductile behaviour, with at least 15% compressive strain for alloy S9 (Mg-1Al) and up to 25% for alloy S7 (Mg-2Al-0.2Ca). While the yield stresses for all the alloys were similar, at around 45 MPa (except alloy S9 (Mg-1Al), with 22 MPa), the ultimate compressive strength (UCS) showed differences between the alloys. The binary alloys S8 and S9 delivered the lowest UCS values, at 286 MPa and 280 MPa, respectively. The highest UCS in the group of alloys containing 1 wt.-% Al was 338 MPa (S3 (Mg-1Al-0.1Ca)), while the highest UCS in the group of alloys with 2 wt.-% Al was 366 MPa (S6 (Mg-2Al-0.1Ca)).
A relative height reduction of up to 25% was reached for all the samples during cold rolling. Among the S_ND samples, S9_ND (Mg-1Al) reached the lowest height reduction, with 15%, S7_ND (Mg-2Al-0.2Ca), and S8_ND (Mg-0.1Ca) reached 25%; all the other alloys deformed to 20%. Among the S_TD samples, S9_TD (Mg-1Al) reached a height reduction of only 15%, S6_TD (Mg-2Al-0.1Ca) and S7_TD (Mg-2Al-0.2Ca) deformed to 20%, and all the other alloys reached 25%.

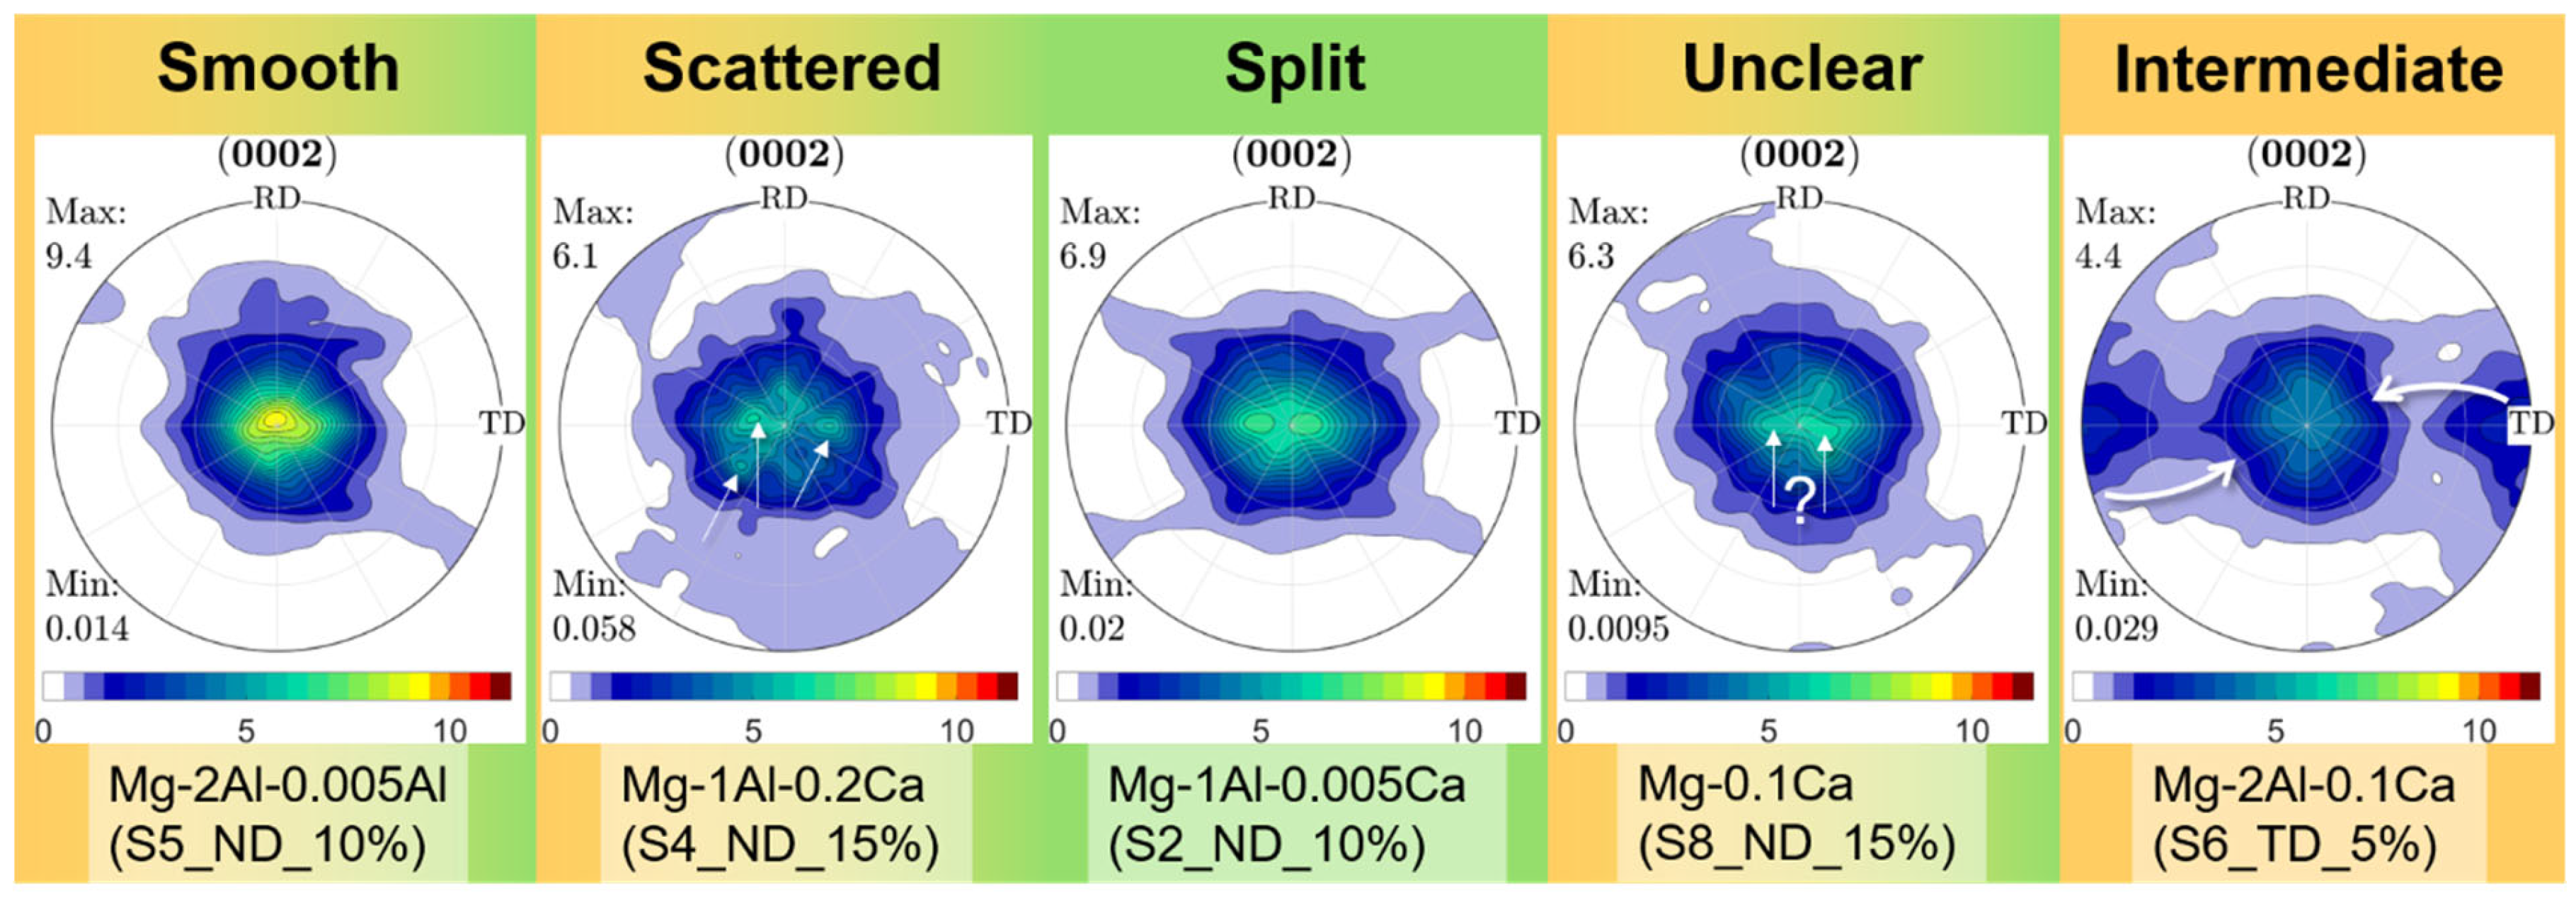
3.2. Texture Development—Pole Figure Types

To describe the texture evolution during cold rolling, a total of 64 pole figures were measured and evaluated. Five different types of pole figure shape were distinguished for both the S_ND and S_TD samples, as follows: ‘Smooth’ pole figures, with clear peaks; ‘scattered’ pole figures, with more than one peak in an undefined manner; and ‘split’ pole figures, with two peaks split in a defined direction. For the ‘unclear’ pole figures, it was difficult to categorise the peaks between the first three types and they did not show systematic connections among themselves (denoted by the question mark in Figure 2). The ‘intermediate’ pole figures showed peaks both at the rim and in the centre of the pole figure, indicating a peak rotation. An example of each type is depicted in Figure 2.
While the ‘smooth’, ‘scattered’, and ‘unclear’ types occur in both the S_ND sample and the S_TD sample, the TD split is only observed for two of the S_ND samples, namely the S1_ND_5% (Mg-1Al-0.5Ca) and S2_ND_10% (Mg-1Al-0.005Ca) samples. The ‘intermediate’ type only occur during the investigation of the S_TD samples. ‘Smooth’ pole figure types can be predominantly seen in the pole figures with higher maximum basal intensities (>6 multiples of a random distribution (m.r.d.)) and increasing degrees of cold rolling (10–25%). In contrast, the ‘scattered’ types are more frequently observed for the pole figures with lower maximum basal intensities (≤6 m.r.d.) and rolling degrees between 0 and 5%. ‘Unclear’ types can not be attributed to distinct samples or rolling degrees. The ‘intermediate’ type is found for the S_TD_5% samples, indicating the rotation of the grains after the change in the rolling orientation before rotating back into the basal orientation. An overview of the association of the measured pole figures with the types, depending on both the height reduction and the chemical composition, can be seen in Figure 3.

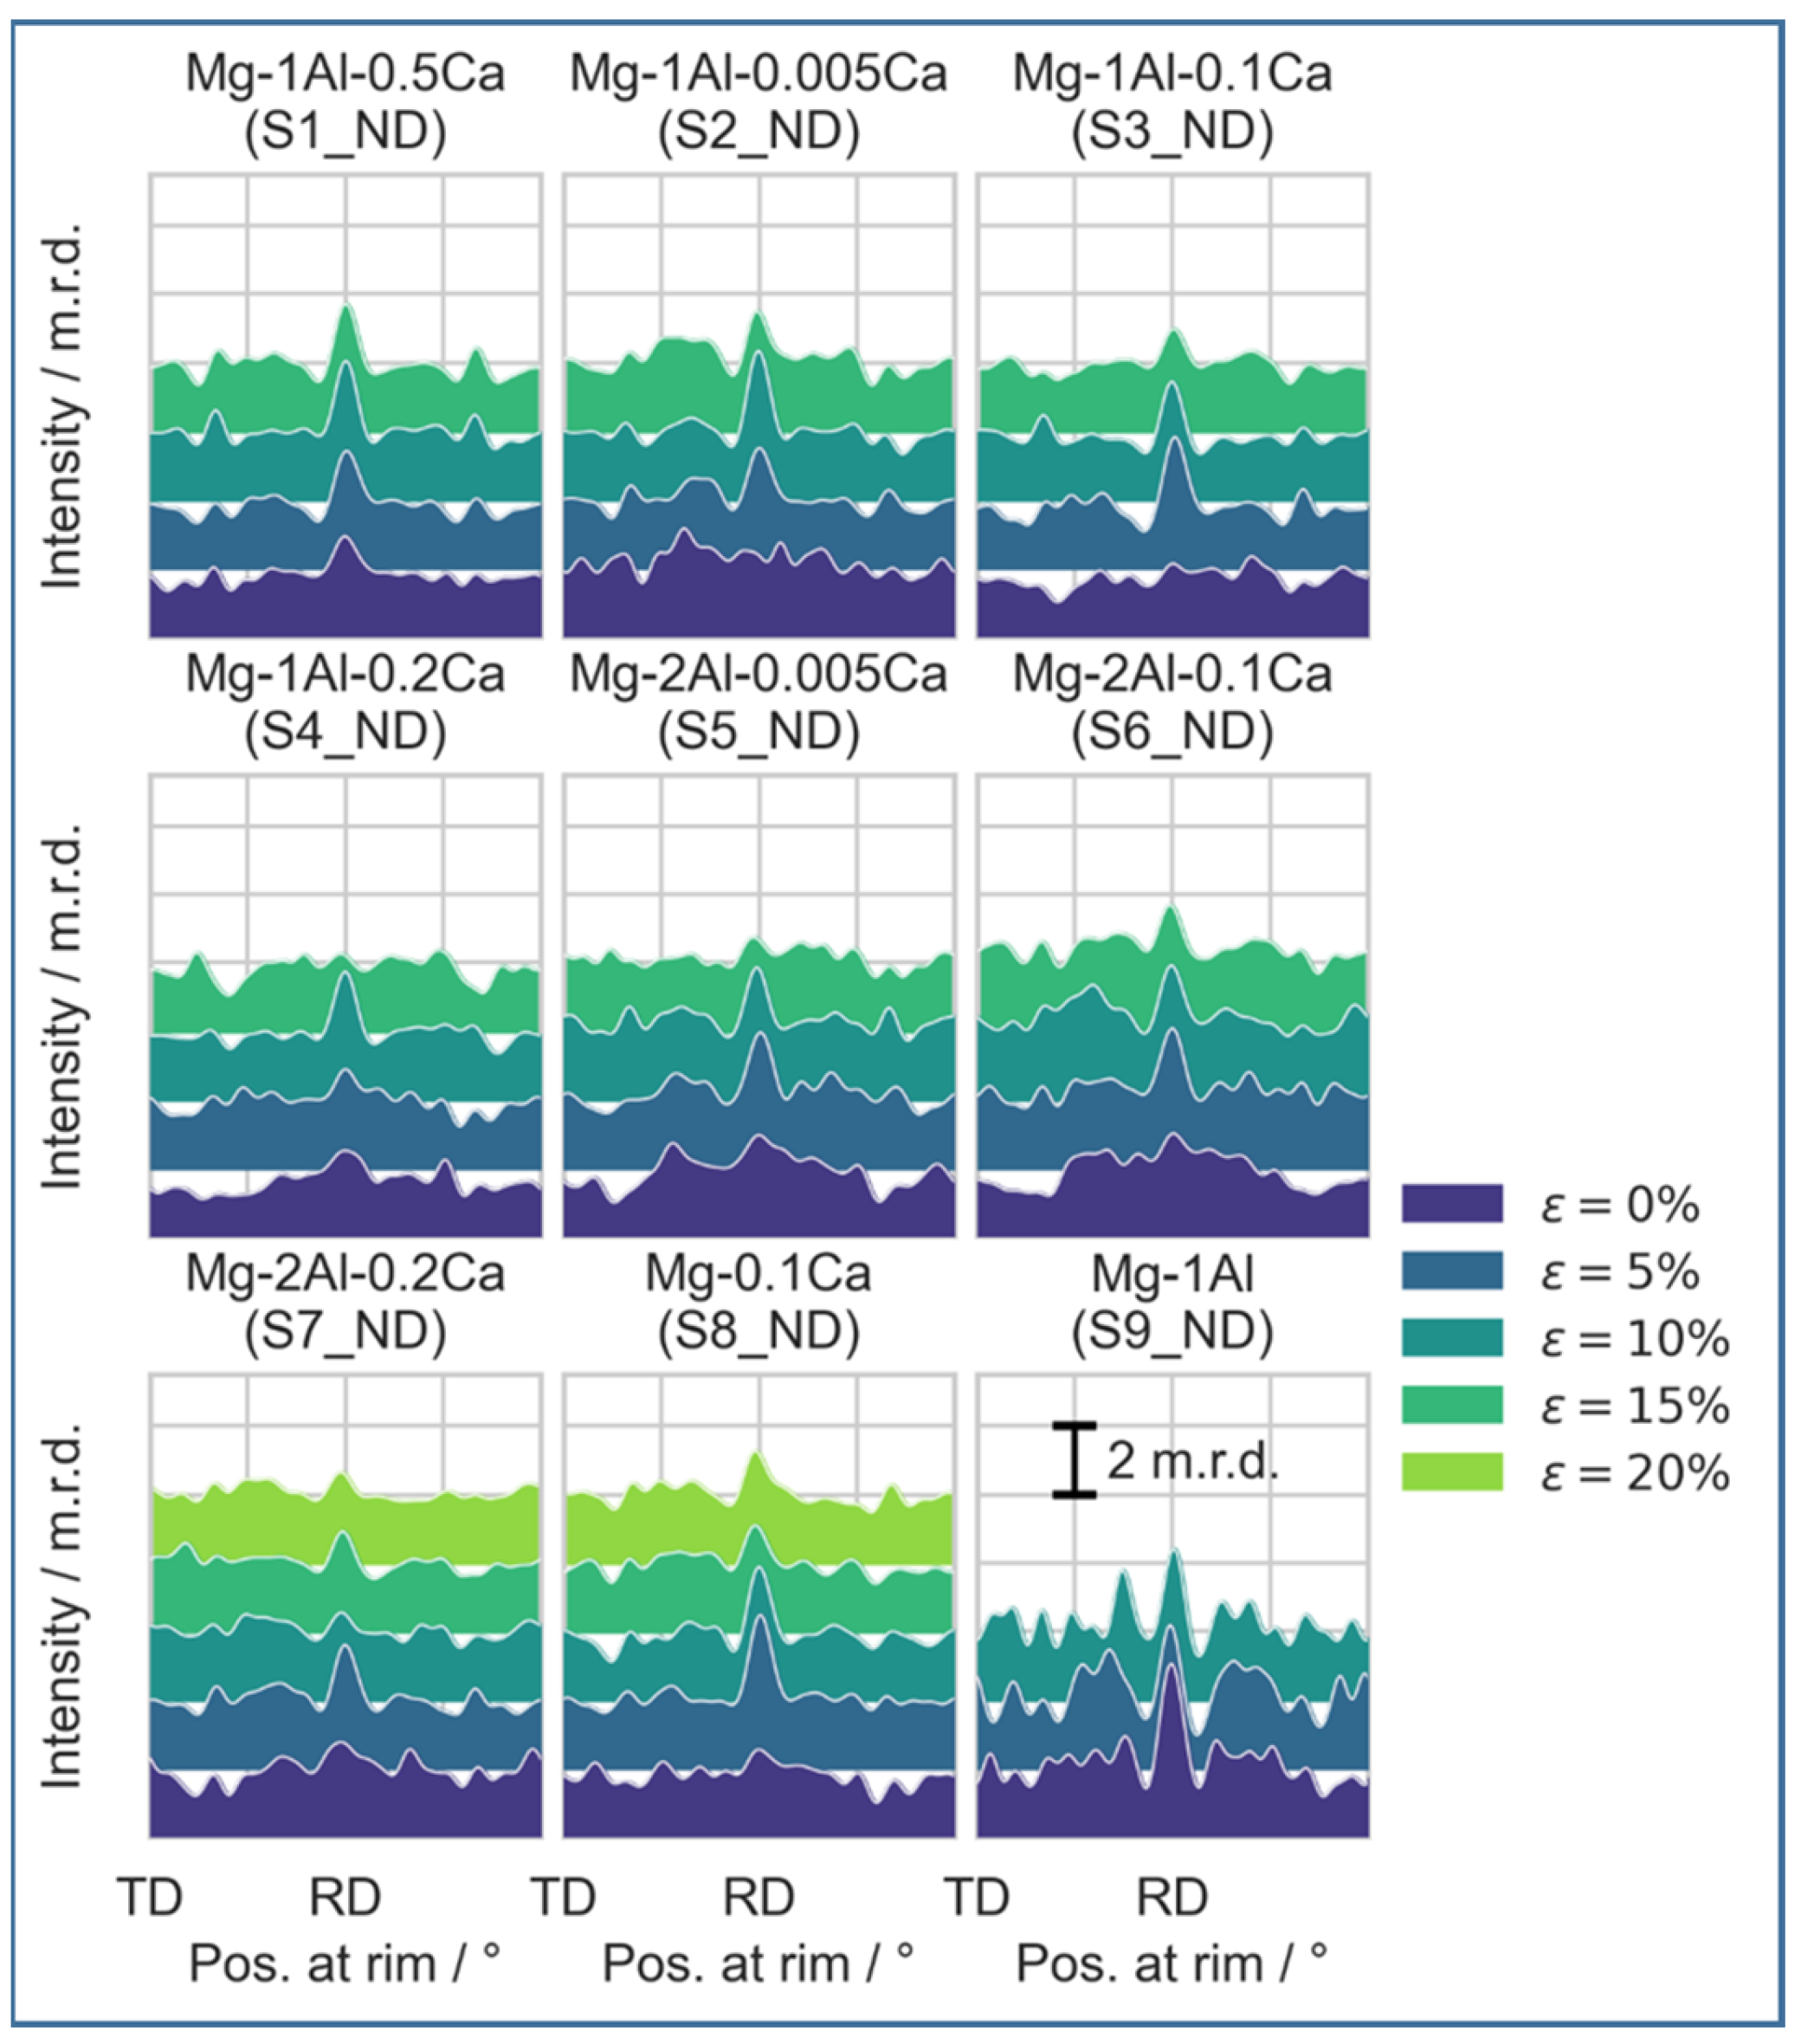
3.3. Texture Development—ND Samples

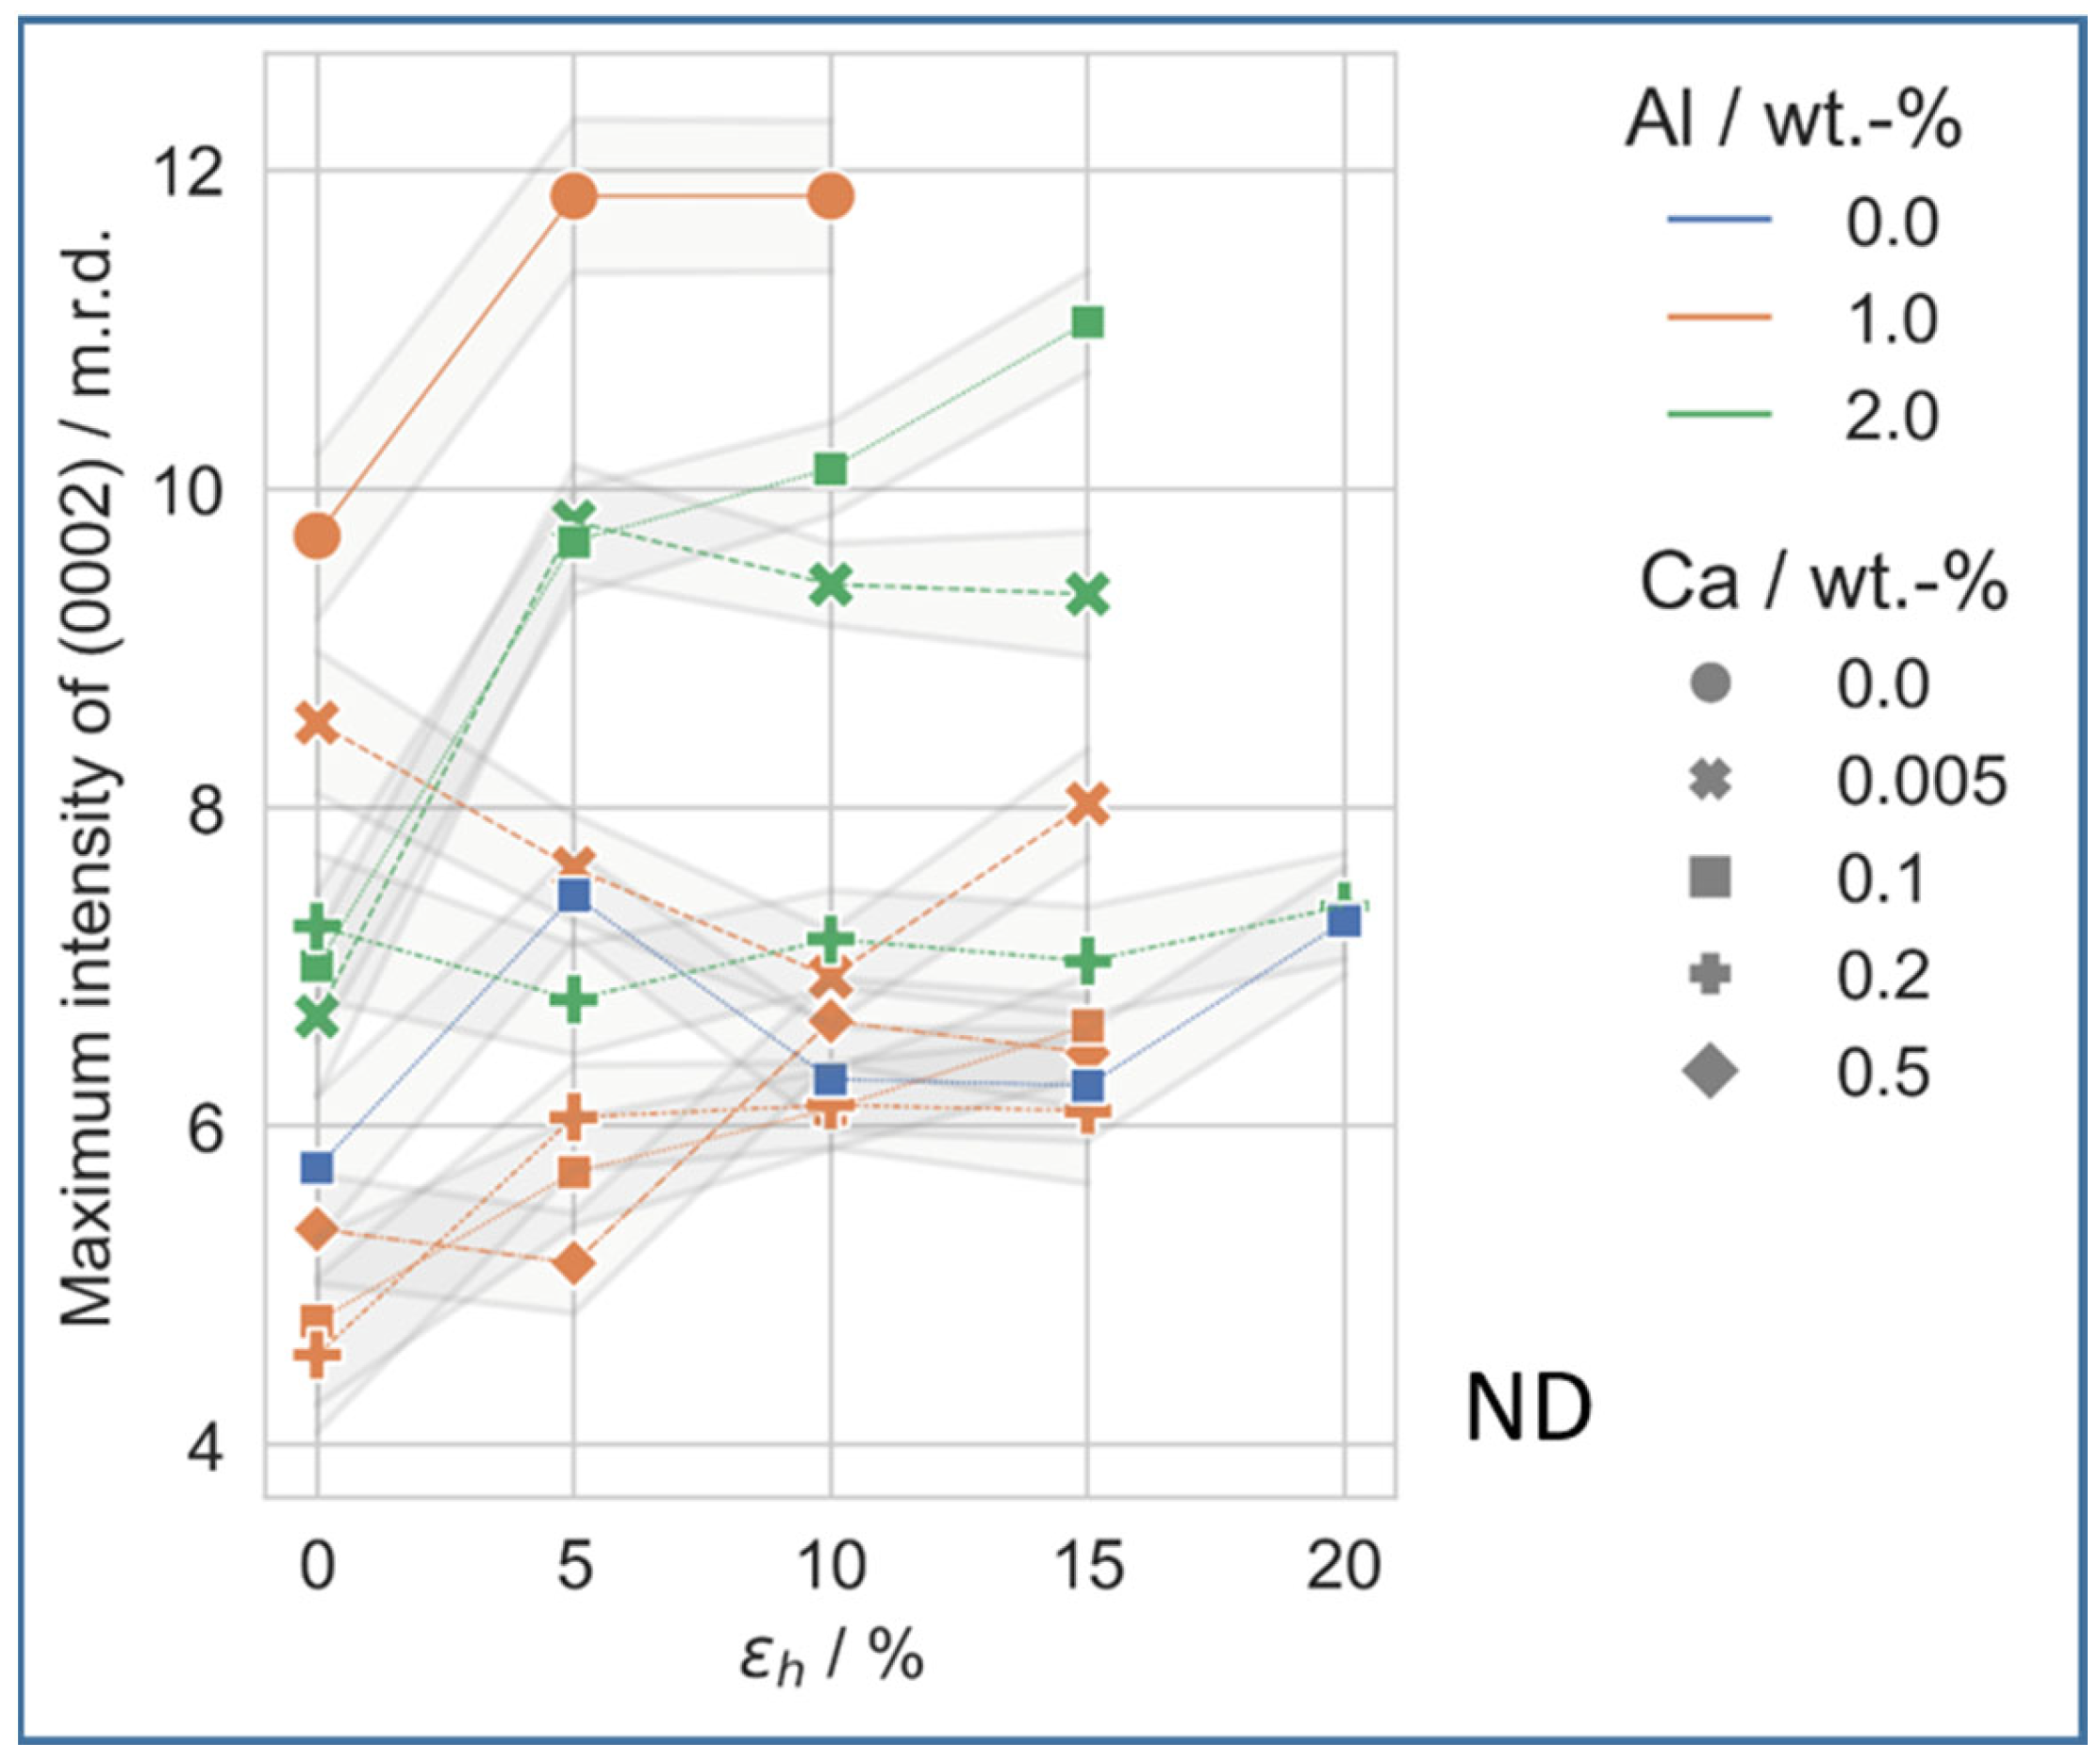
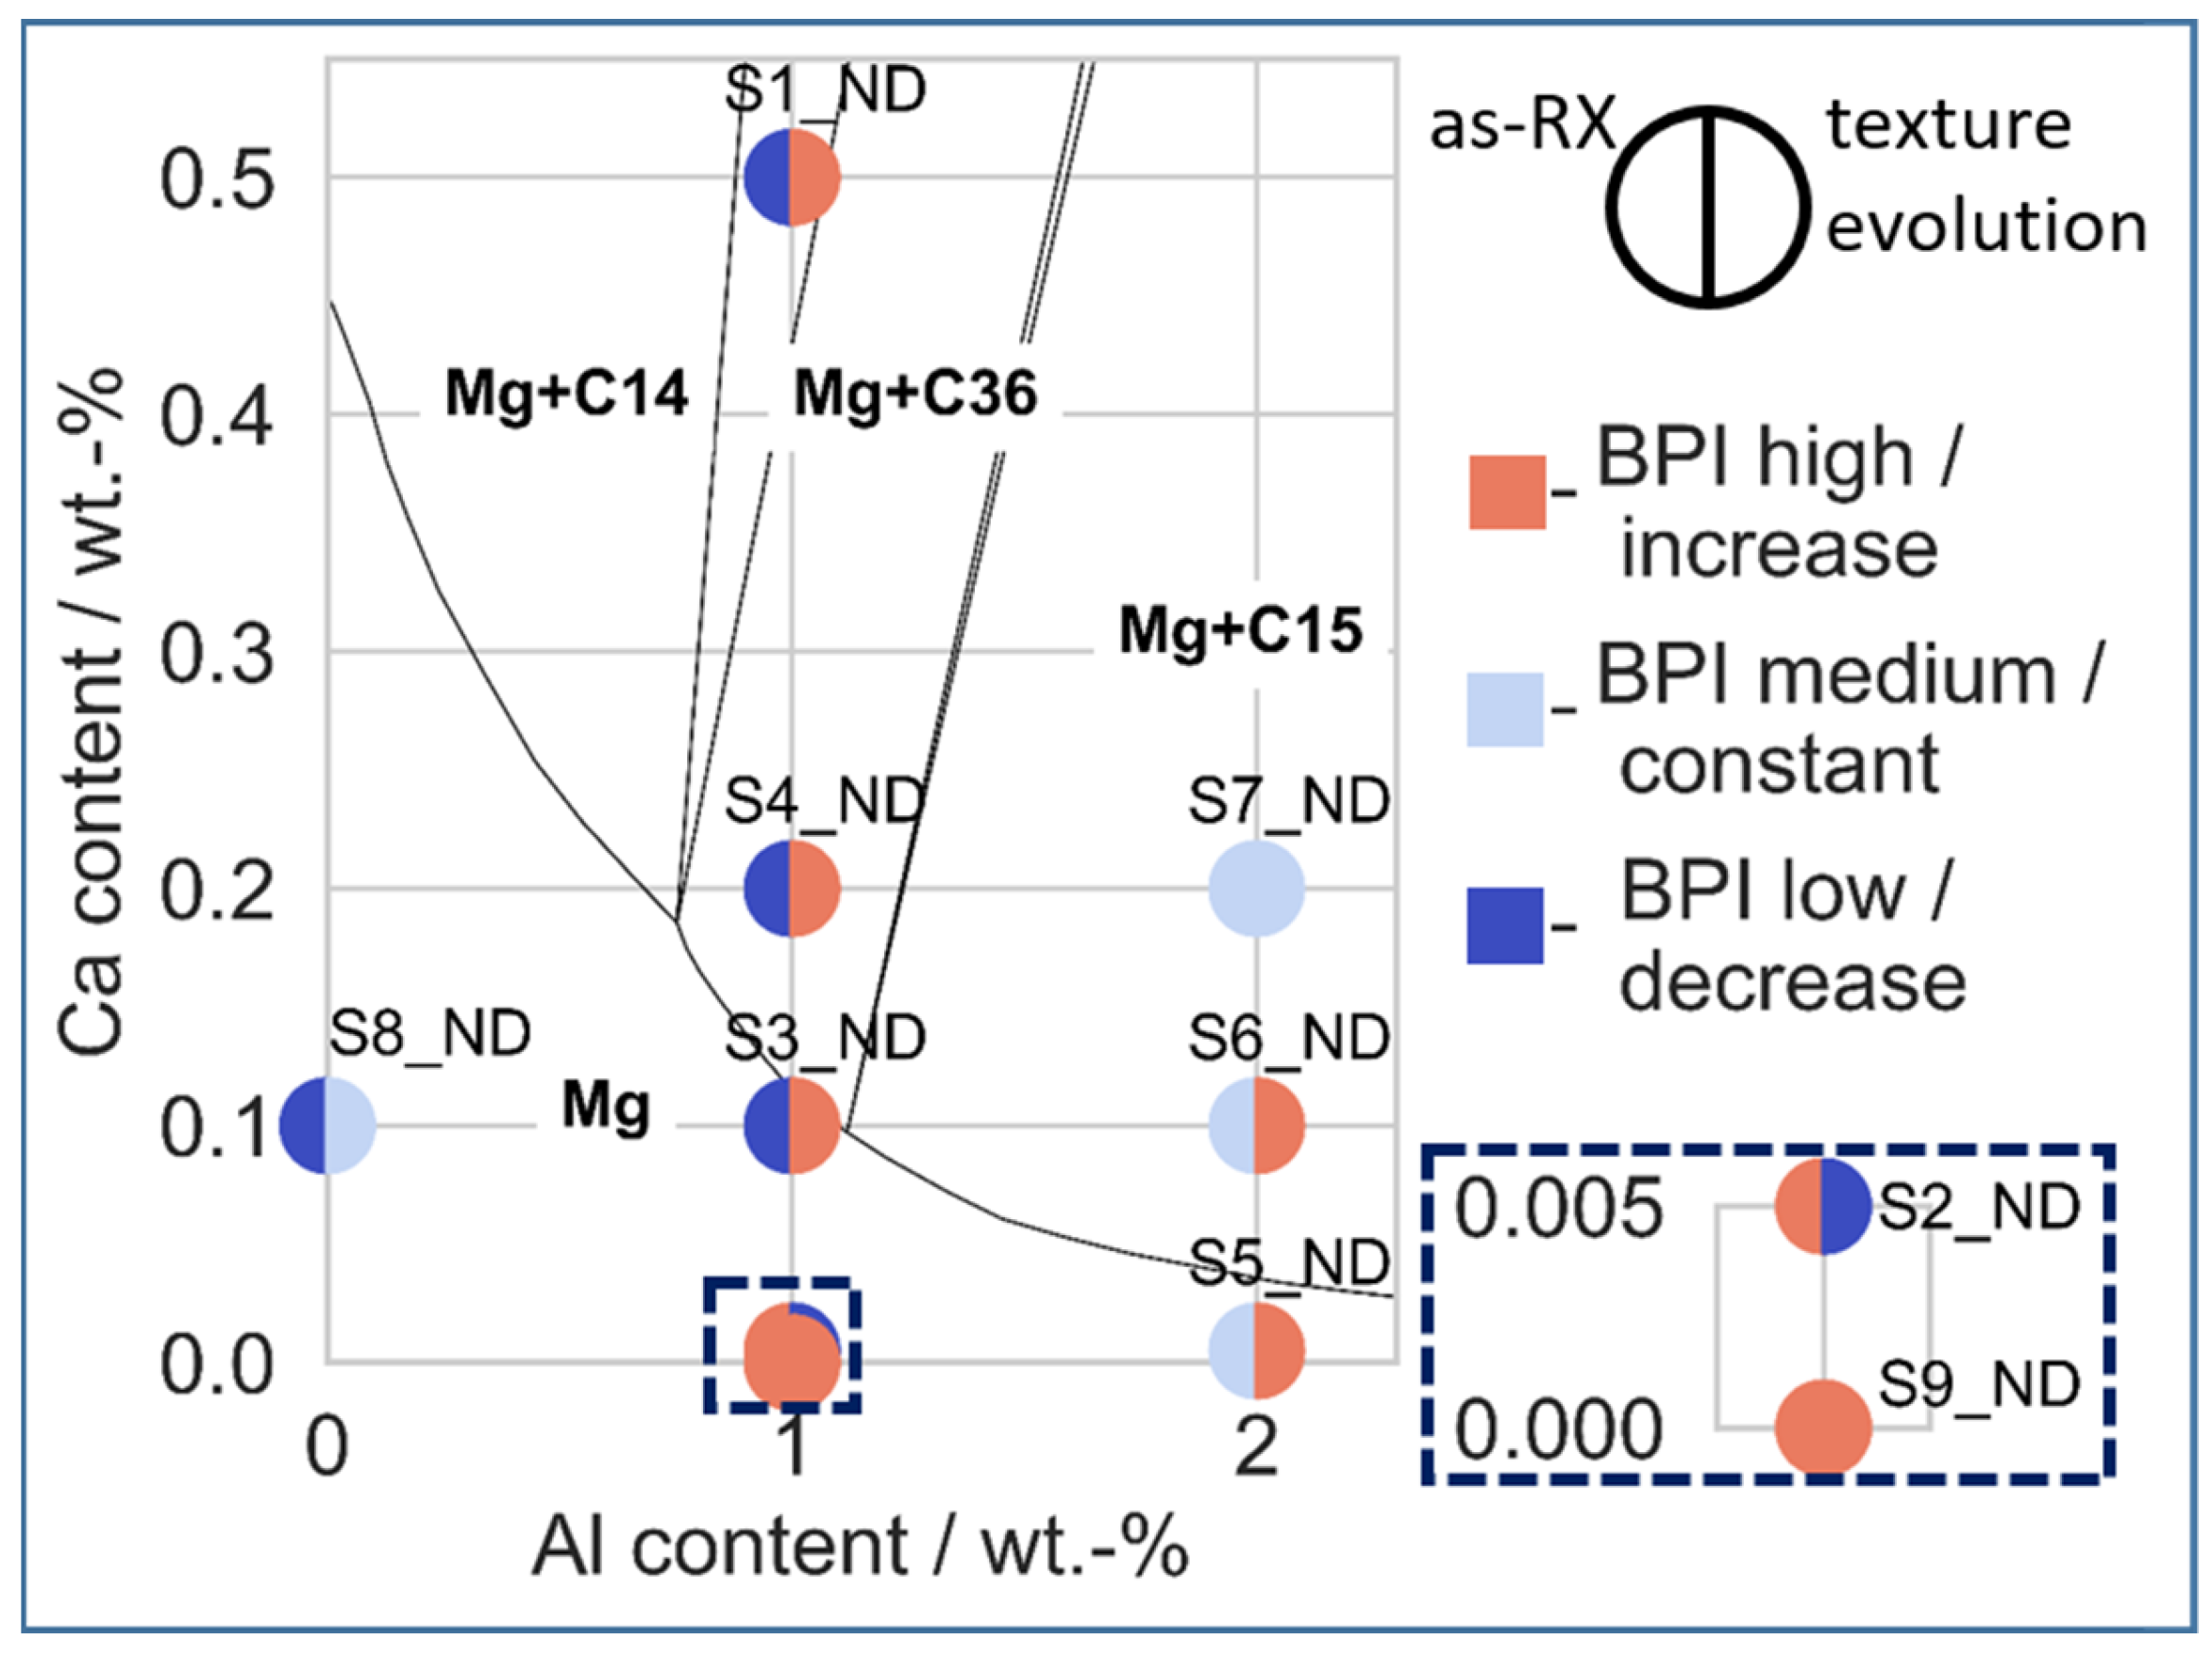
3.3.1. Development of the Basal Peak Intensity

For the ND samples, the development of the basal peak intensities for the different alloys is depicted in Figure 4.
The S9_ND (Mg-1Al) has the highest initial as-RX intensity, followed by the alloys with 2 wt.-% Al at around 7 m.r.d. All the other alloys with 1 wt.-% Al have lower initial intensities around 5 m.r.d. An exception is S2_ND (Mg-1Al-0.005Ca), which has an initial intensity of 8.5 m.r.d. The binary S8 lays in between, with an initial basal intensity of almost 6 m.r.d.
The different alloys show varying evolution in their basal peak intensity during the ongoing deformation. Regarding the alloys containing 2 wt.-% Al, the samples S5_ND (Mg-2Al-0.005Ca) and S6_ND (Mg-2Al-0.1Ca) show a sharp increase in basal texture intensity after the first rolling step, stable intensities in the case of the S5_ND (Mg-2Al-0.005Ca), and further slight increases in the case of the S6_ND (Mg-2Al-0.1Ca) sample during further rolling. The S9_ND (Mg-1Al) behaves similarly to the S5_ND (Mg-2Al-0.005Ca). In contrast, the S7_ND (Mg-2Al-0.2Ca) sample exhibits constant basal intensities throughout the rolling process. For the alloys containing 1 wt.-% Al, the alloys with low initial basal-texture intensities (S1_ND (Mg-1Al-0.5Ca), S3_ND (Mg-1Al-0.1Ca), and S4_ND (Mg-1Al-0.2Ca)) experience a slight increase, from around 5 m.r.d to around 6 m.r.d, during the rolling process. The S2_ND (Mg-1Al-0.005Ca) sample, on the other hand, shows a decrease in intensity until a height reduction of 10% was reached, while at 15%, an increase to similar basal intensities to the initial value is detected. For the S8_ND (Mg-0.1Ca) sample, a first increase is followed by a decrease to almost the initial intensity. In the last rolling step, another increase leads to a final basal peak intensity of 7.3 m.r.d.

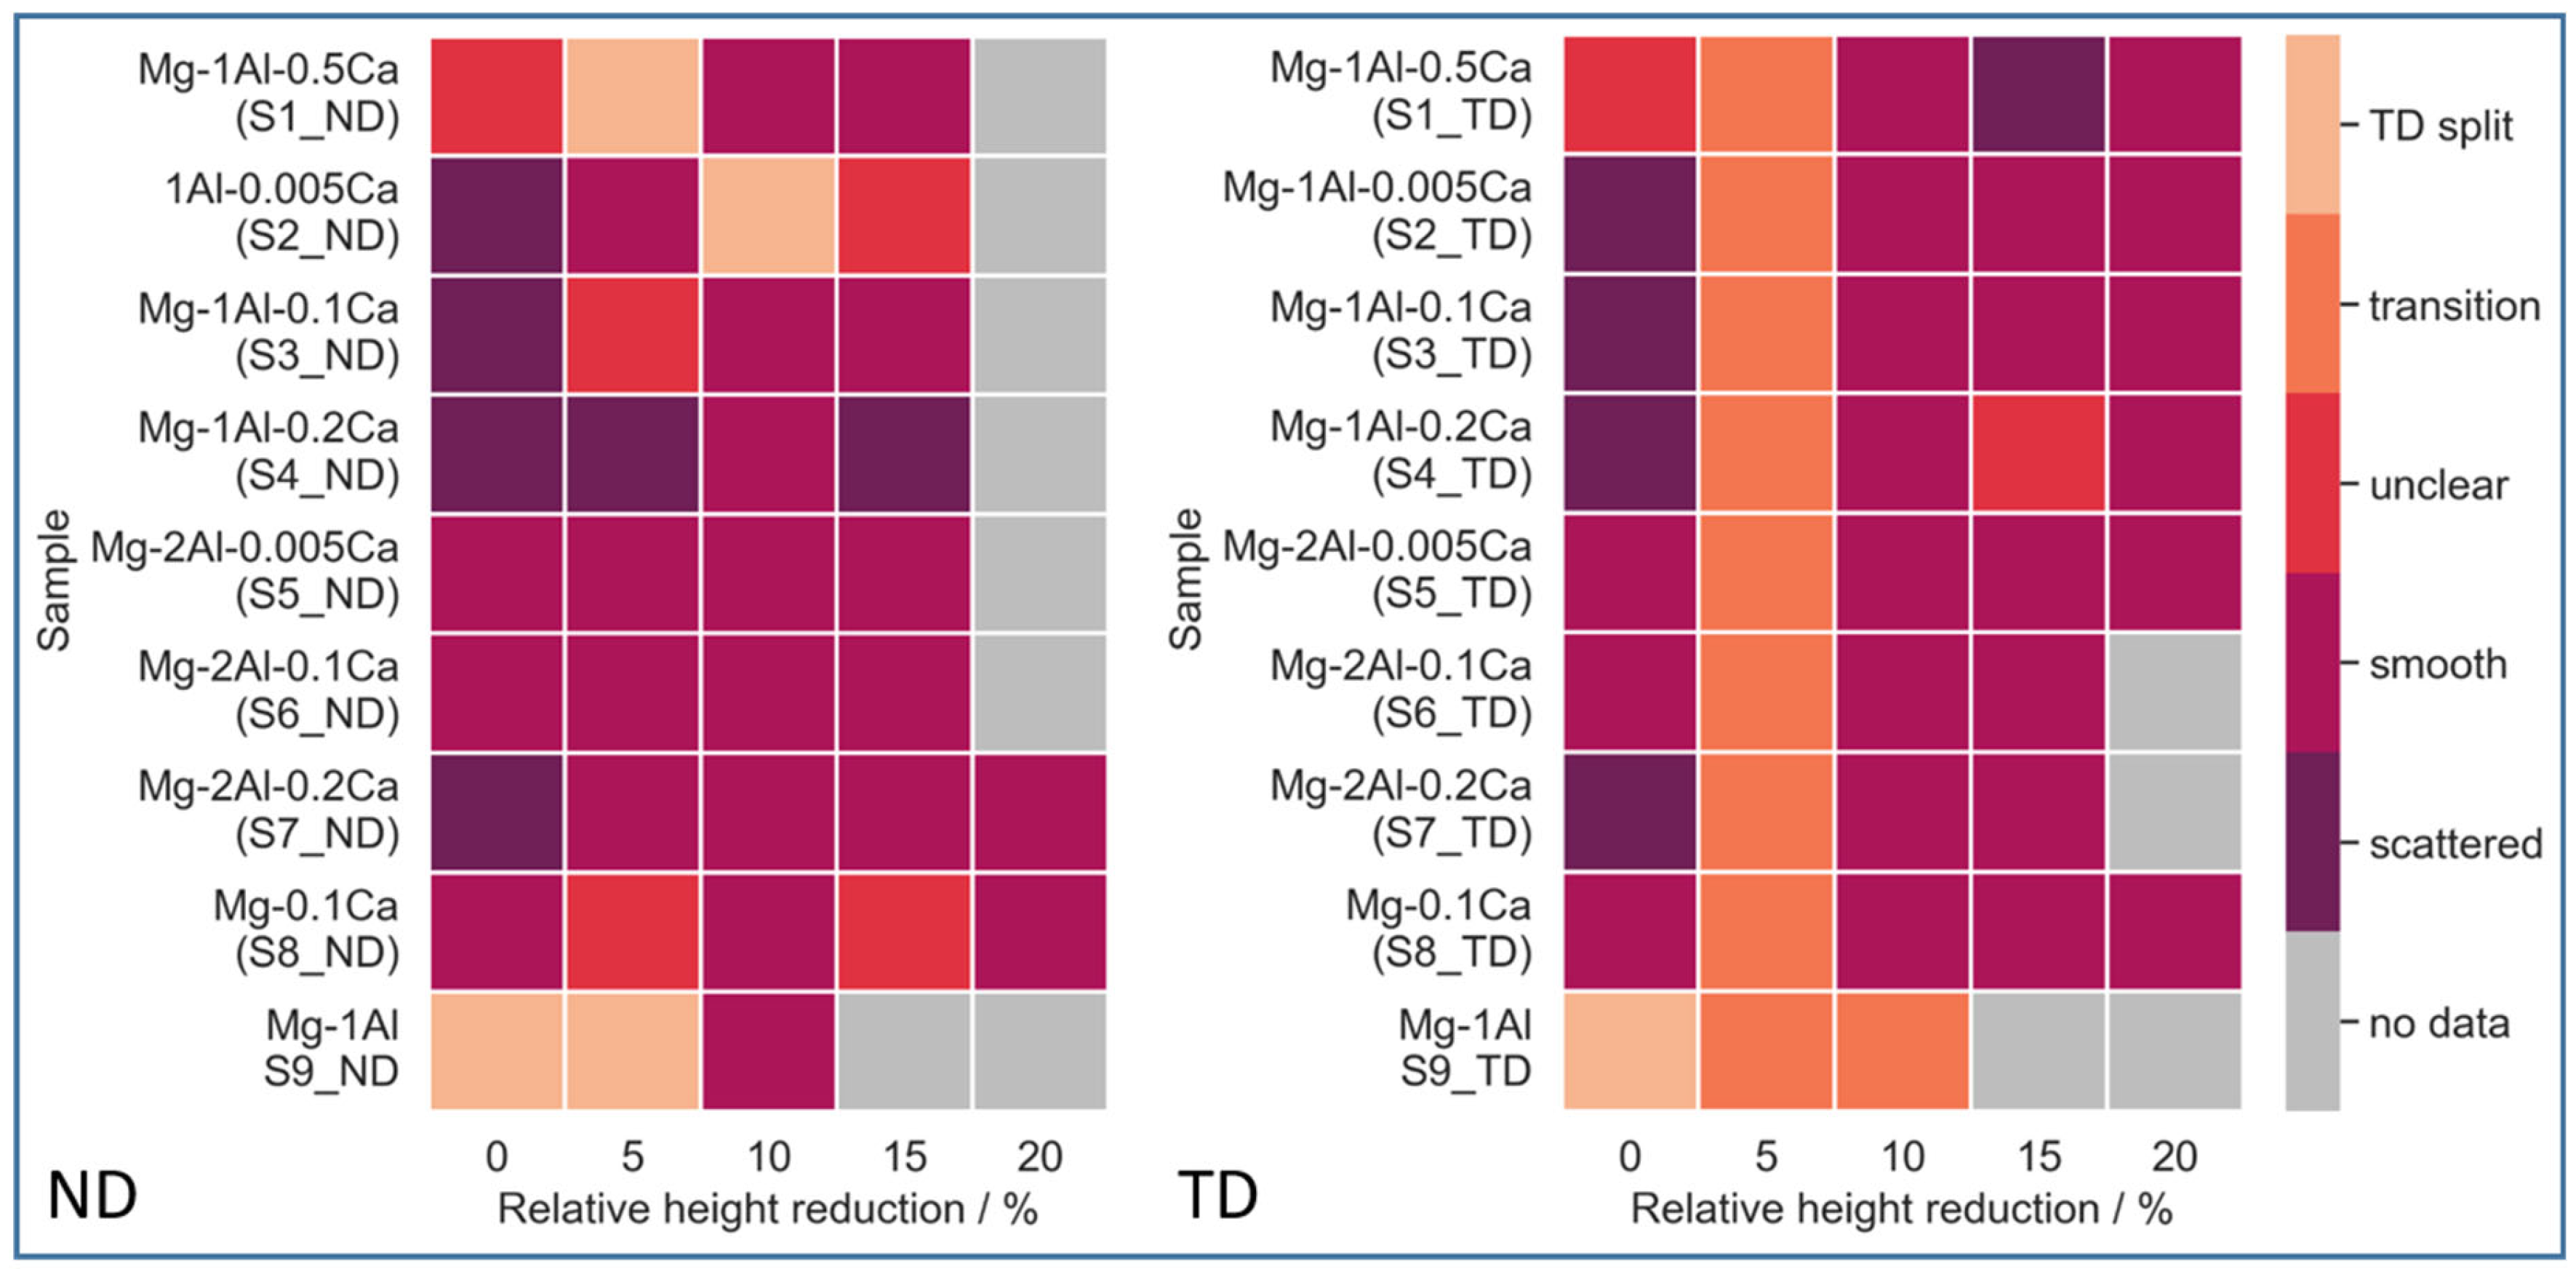
3.3.2. Development of the Peak Shape

In addition to the maximum basal pole-figure intensity, the peak shape was investigated to illustrate the spread of the peak towards TD or RD, as explained in the section on the experimental methods. As shown in Figure 5, most of the samples exhibit a spread ratio of over 1, which indicates a spread towards TD.
While the samples containing 0 wt.-% Al and 2 wt.-% Al show a decrease in TD spread towards higher rolling degrees, for the 1 wt.-% Al samples, a more stable spread ratio, of approximately 1.2, is measured. In case of the S6_ND (Mg-2Al-0.1Ca) sample, the initial pole figure has the highest spread ratio, at over 1.8. The sample S7_ND (Mg-2Al-0.2Ca) has the least overall spread.

3.3.3. Development of the Prevalent Components

The measured intensities of the {10 1 ¯ 0}-pole figures were analysed to identify prevalent components of the different alloys. Therefore, the rims of these pole figures were investigated. The calculated intensities can be seen in Figure 6.
Mainly, there is a slight prevalence of the {10 1 ¯ 0} poles lying parallel to the RD. For the as-RX conditions, only S1_ND (Mg-1Al-0.5Ca) shows this prevalence, while the other alloys have a more random variation in intensity. With increasing degrees of deformation, this prevalence tends to intensify. An exception to this rule is visible only for the S4_ND_5% (Mg-1Al-0.2Ca), S4_ND_15% (Mg-1Al-0.2Ca), S5_ND_15% (Mg-2Al-0.005Ca), and S7_ND_20% (Mg-2Al-0.2Ca).

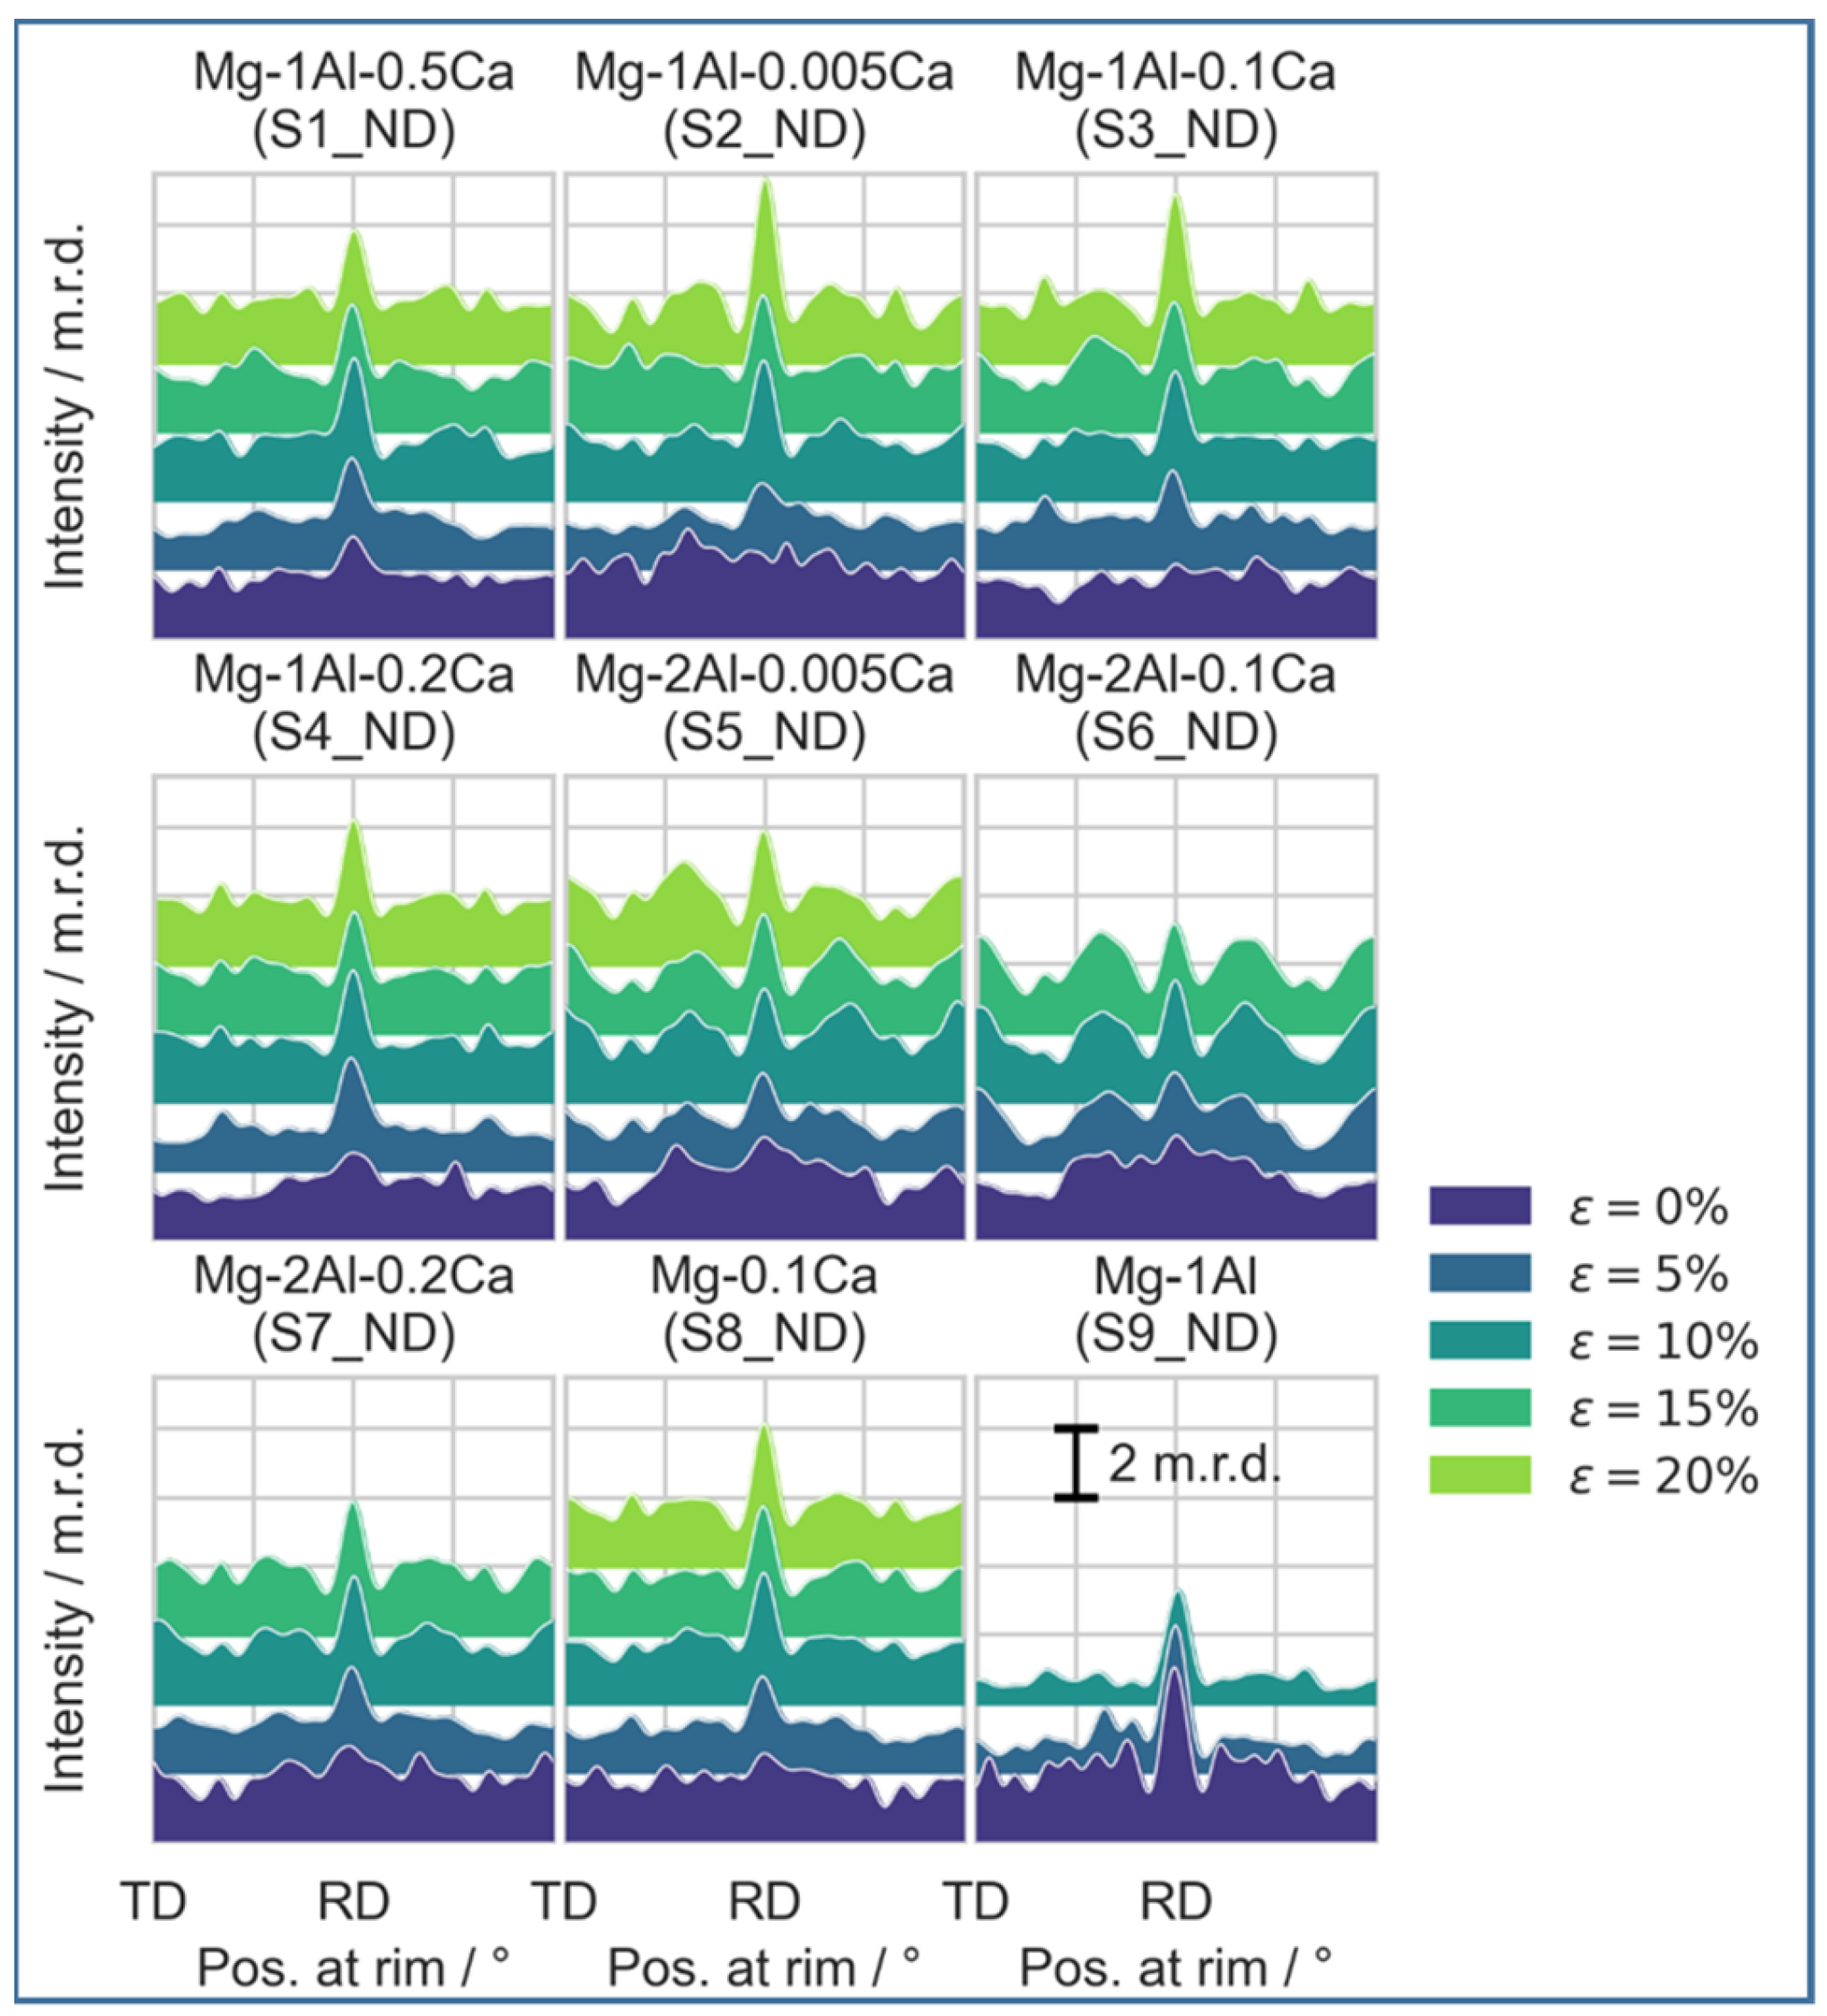
3.4. Texture Development—TD Samples

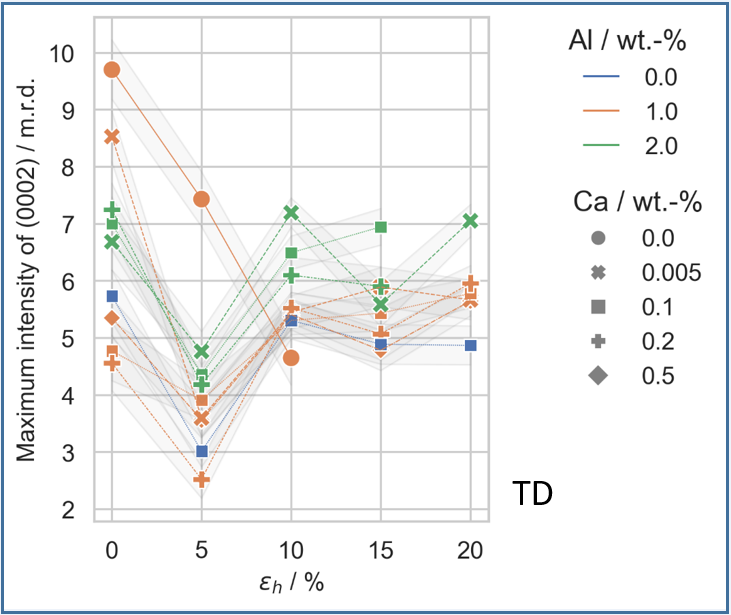
3.4.1. Development of the Basal Peak Intensity

As with the S_ND samples, the basal peak intensities of the S_TD samples were investigated. The resulting basal peak intensities are shown in Figure 7.
In the S_TD samples, the values for the initial textures are the same as those in Figure 4. From that point, a significant drop in basal intensity with initial straining is observed for all the alloys. However, at a height reduction of 10%, the basal peak intensities increase to almost the initial values (except S2_TD (Mg-1Al-0.005Ca)). Further deformation leads to almost constant basal peak intensities until failure. Contrary to this observation, the S9_TD (Mg-1Al) does not exhibit this texture reorientation during the investigated range of height reductions, and only a decreasing trend in the basal peak intensity is visible. Overall, the alloys containing 2 wt.-% Al show higher basal peak intensities after the peak rotation, in comparison to the alloys containing 1 wt.-% Al. The binary S8_TD (Mg-0.1Ca) has basal peak intensities in the same range as the alloys containing 1 wt.-% Al.

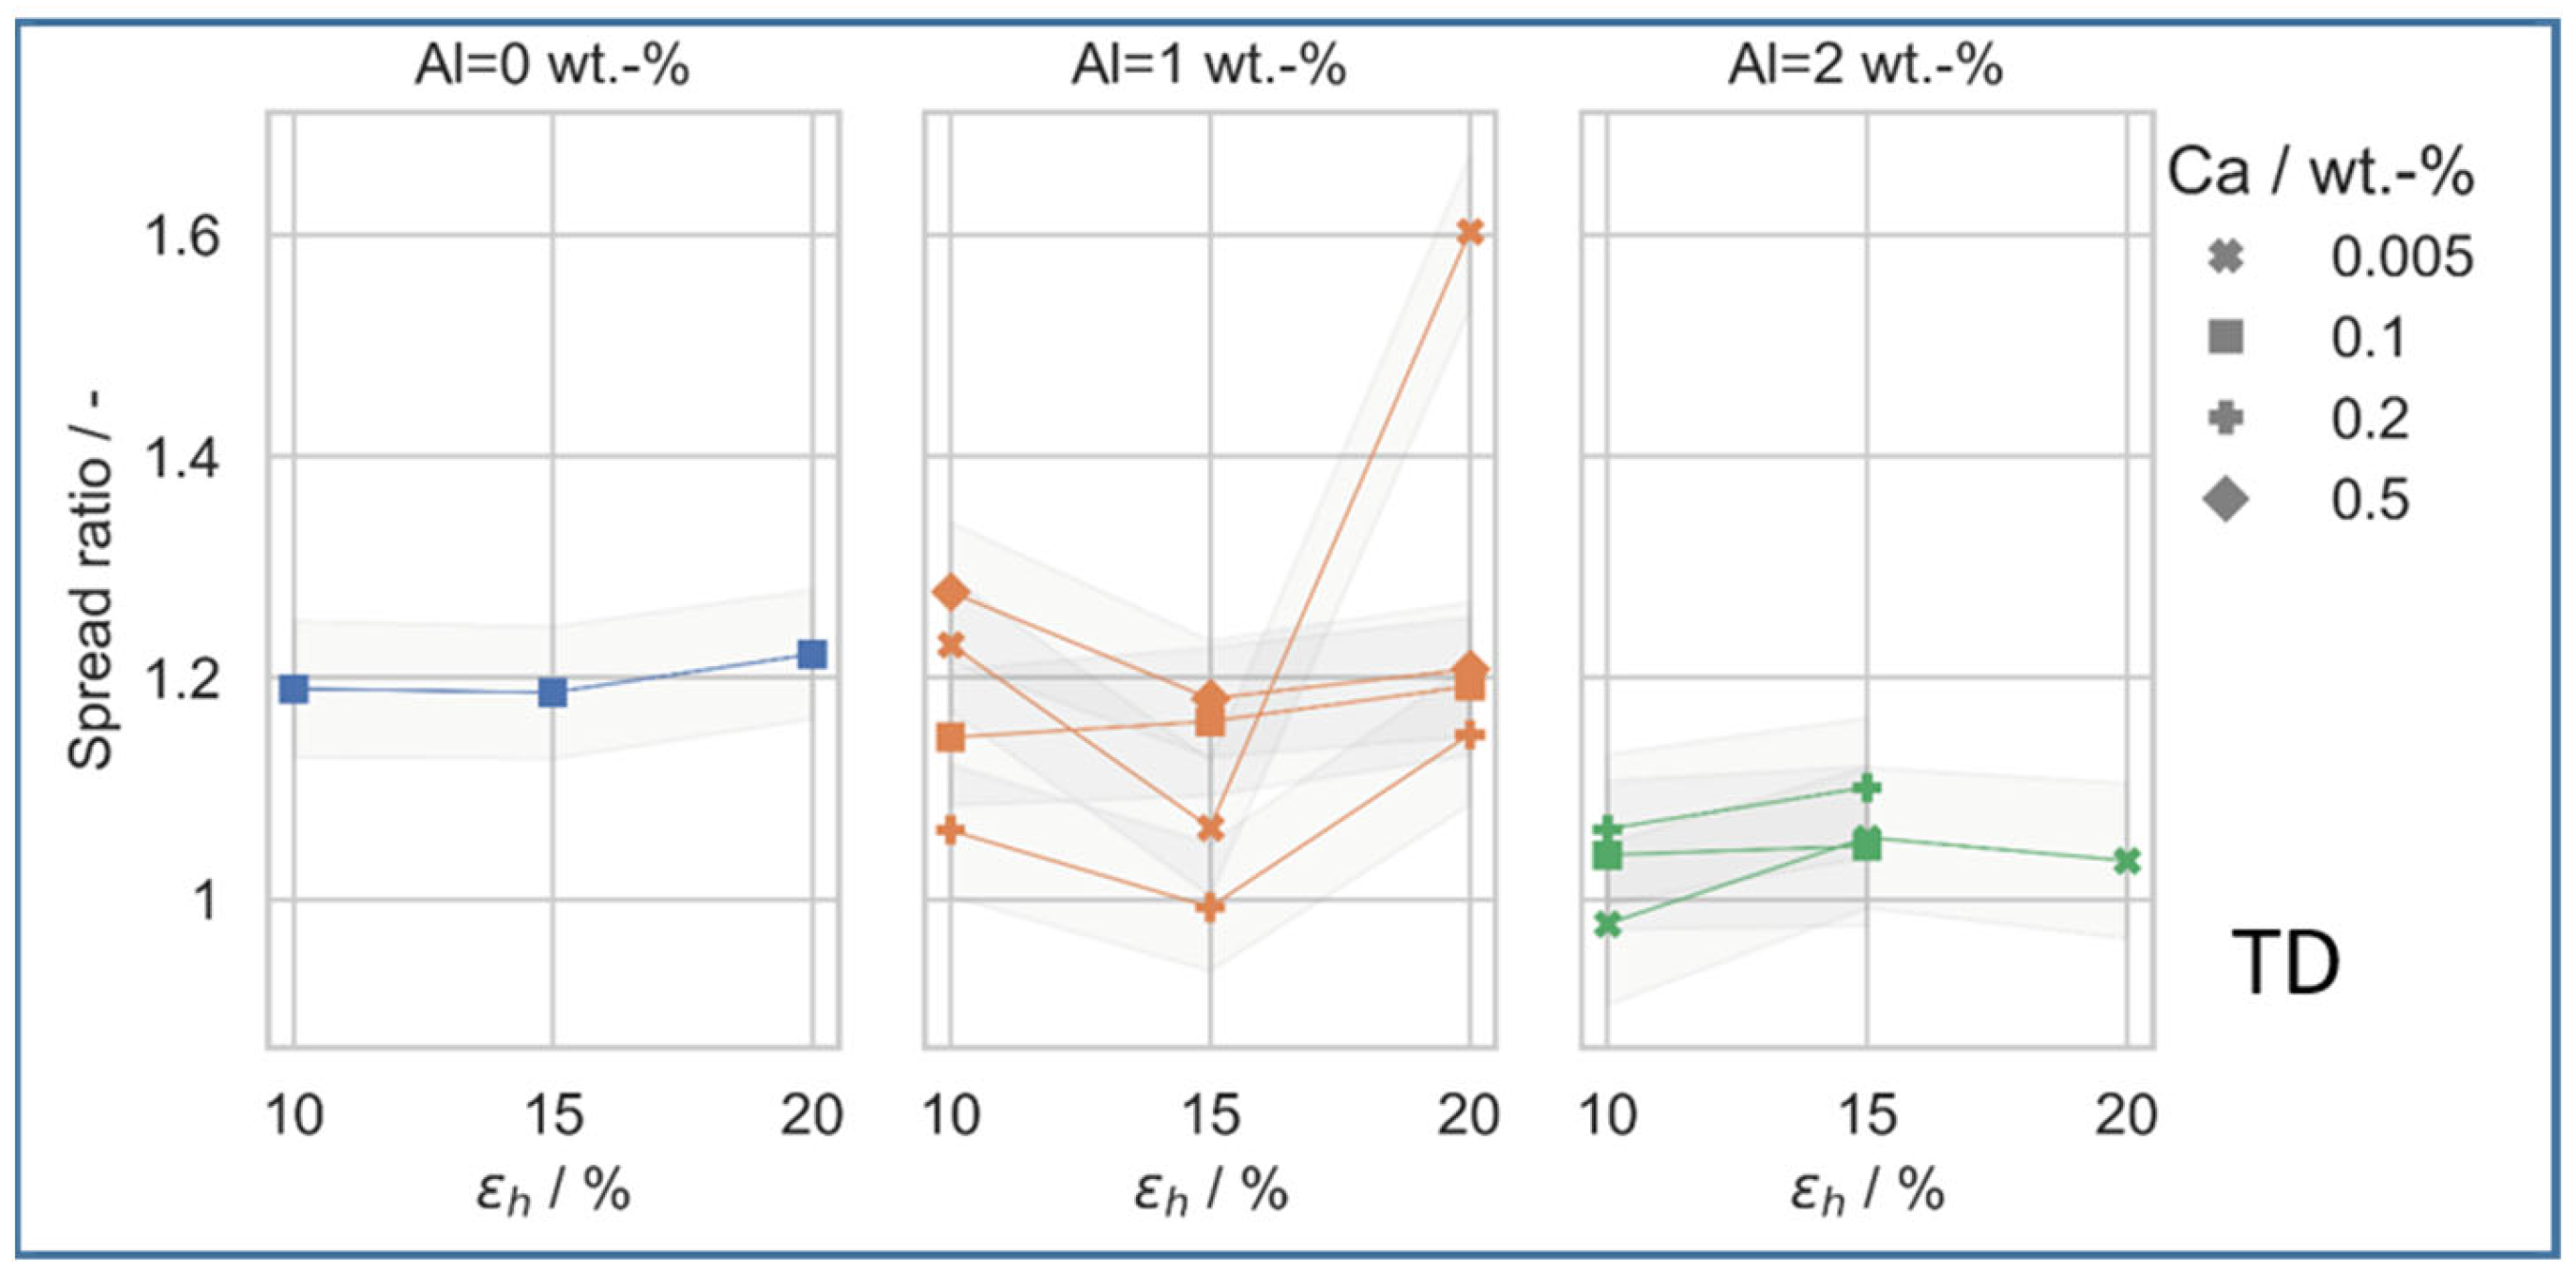
3.4.2. Development of the Peak Shape

As with the S_ND samples, the S_TD samples’ spread ratio was evaluated. The measured spread ratio can be seen in Figure 8.
Here, the spread ratio is shown after the peak reoriented at a height reduction of 10%. In contrast to the S_ND samples, the spread ratio remains more stable. Only sample S1_TD_20% (Mg-1Al-0.5Ca) exhibits a sharp increase in spread ratio. A visible trend is that with the increasing Al content, the spread ratio tends to decrease. For the alloy containing 0 wt.-% Al, the spread ratio is 1.2, and for the alloys containing 2 wt.-% Al, it is around 1. The alloys containing 1 wt.-% Al alloys lay in between those containing 0 and 2 wt.-% Al.

3.4.3. Development of the Prevalent Components

The prevalent components were also studied for the S_TD samples. The results can be seen in Figure 9.
As with the S_ND samples, for the S_TD samples, a prevalence of {10 1 ¯ 0} poles lying parallel to RD is visible. Among the S_TD samples, all the deformed samples show this prevalence, which tends to intensify with increasing degrees of deformation. A slight peak inclined by 30° towards the TD can be seen for most of the samples. The S2_TD (Mg-1Al-0.005Ca), S5_TD (Mg-2Al-0.005Ca), and S6_TD (Mg-2Al-0.1Ca) have the strongest magnitude of these peaks. It should be noted that the S_TD samples show prevalent components with a more pronounced and less scattered appearance.

4. Discussion

4.1. Mechanical Properties and Deformation under Cold Rolling Conditions

In our previous work [27], we investigated the mechanical properties of the same alloys using tensile and compression testing, revealing that, especially for ductile Mg alloys, casting defects and other impurities can lead to an underestimation of the formability. The maximum deformation of 15–25% during the compression testing is of the same order of magnitude as that achieved during cold rolling. For cold rolled pure Mg, maximum deformations of only 10% have been observed [23]. It should be noted that for the S_ND samples, more samples failed during the 20% rolling step, while among the S_TD samples, most failed during the 25% rolling step. This might indicate that the 90° tilt of the texture allows slightly higher deformation.

4.2. Sources of Error

Different error sources that affect the texture measurement have to be considered. A negligible influence is attributed to the sample preparation. Fan et al. [32] reported that only in materials with a high atomic number and, thus a low penetration depth for X-ray, sample preparation might induce errors in XRD measurements. This is not the case for Mg alloys. In addition, no differences were observed between unprepared samples and samples polished up to 1 µm by Jäger et at. [33]. Intensity variations in the X-ray source can occur; however, these are also negligible because intensities are normalised and the background of the measurement is known. Also, aberrations due to X-ray optics and absorption should not have a strong effect, as the measured data are automatically corrected for potential errors. The strongest influence on the resulting pole figures is considered to be caused by the determination of the ODFs. The chosen parameters for half width and the resolution of the grid during the calculation of the ODFs affect the basal peak intensities and pole figure shapes. In particular, when comparing texture-related parameters to values from the literature, the selection of the parameters for pole figure calculation has to be taken into account carefully. We therefore suggest the inclusion of these parameters into publications on texture.
Throughout this study, all the parameters were kept in line with the values given in the section on the experimental methods to ensure the comparability of the pole figures.

4.3. Texture Development—ND Samples

All the investigated samples showed rather weak basal textures in the as-RX condition, which were much lower than those observed for pure Mg [19,34]. This was also observed in our previous study [27]. It has to be considered that the grain size of the S1_ND is slightly lower than that of the other alloys [27]. Generally, with further deformation, an increase in the basal peak intensity is expected, and has been seen in pure Mg [35], AZ31 [30], and other Mg-alloys [35,36,37]. For most of the alloys in this study, this texture evolution was also observed. The predominant activation of the basal <a> slip in Mg alloys is the main cause of the formation of basal-type textures, as reported by Chapuis et al. [38]. Basal slip leads to a reorientation of the basal slip planes perpendicular to the rolling force. This leads to a near-zero Schmid factor for basal slip and sharp basal textures [39]. Both the increasing basal peak intensity and the decreasing peak spread ratio indicate this reorientation through basal <a> slip.
A significant impact on both the as-RX texture and the texture evolution is attributed to the alloying elements. Here, Ca has a rather activating effect because very low amounts of Ca lead to texture weakening [40,41]. In contrast, the addition of Al has a more significant influence on the basal peak intensity. Generally, an increased activation of <c + a> slip can lead to a weaker basal texture in Mg-Al-Ca alloys [23,27]. Wu et al. [42] investigated the influence of the combined addition of Al and Ca to Mg with DFT calculations in the solid solution composition range, indicating a lower cross slip energy for the <c + a>-dislocations in comparison to the sole Al alloying or conventional AZ31. In our previous work, we proposed a strong connection between the Al content and both the solubility limit of Ca and the amount of Ca in the alloy [27]. The results of the present study confirm that this correlation appears to occur not only for the as-RX textures, but also for deformation textures. Increasing Al amounts lead to decreases in Ca solubility [25].
Three different effects can be distinguished. First, for low amounts of Al and Ca solved in the matrix, non-basal slip systems were activated. In cases such as this, remarkably low amounts of Ca (0.005 wt.-%) were sufficient to enable non-basal slip. Second, when the Al amount increased, less Ca was solved in the matrix and under ongoing deformation, basal slip was predominant. This led to increasing basal textures, especially for the S5_ND (Mg-2Al-0.005Ca) and S6_ND (Mg-2Al-0.1Ca) samples (compare Figure 4). Third, further increases in Ca induced a new additional mechanism that suppressed the strengthening of the basal-type texture. For this mechanism, we propose that the increasing influence of Ca segregation at grain boundaries observed by Nandy et al. [26] hinders grain rotations and supports weaker textures.
The peak spread analysis revealed a slight tendency towards a TD spread of the basal texture peak for most of the alloys and deformation degrees. In the literature, RD splitting is attributed to the activity of the <c + a> slip, while a TD split is formed by the activation of prismatic and/or pyramidal <a> slip [43,44]. For pure Mg [35], AZ31 [43], and Mg-Y alloys [19], often, RD splitting is observed. A similar TD spread was observed for Mg–RE alloys [14,15,16,45,46] and Ca-containing alloys [47,48]. Since our previous study [27] indicated significant activity of the pyramidal <a> slip, which increases with increasing Al, we assume that the high Al content caused the observed higher TD spread. Kim et al. [48] also noted that <c + a> slip was still possible, although a slight TD split was visible. As more non-basal slip systems are active, an overlap between different slip systems is the most likely outcome [27].
Steiner et al. [49] found for an AZ31 alloy that the {0001} <10 1 ¯ 0> texture component, which was also found in the present study, evolves during cold rolling. The authors assumed that joint basal and prismatic slip is necessary to form this component. Interestingly, the S7_ND (Mg-2Al-0.2Ca) sample, which shows stable basal peak intensities, shows only a very weak presence of the {0001} <10 1 ¯ 0> texture component. According to Steiner et al. [49], the absence of prismatic slip could be concluded. A similar observation, with a more scattered texture, can be drawn for the S4_ND (Mg-1Al-0.2Ca) sample. To the authors’ best knowledge, prismatic slip was not detected in Mg-Al-Ca-alloys with Ca contents above 0.2 wt.-% Ca [27]. We suggest, at least for alloys containing Al and 0.2 wt.-% Ca, that the activation of prismatic slip is hindered by either an increased CRSS for prismatic slip or, more likely, the easier activation of other slip systems. Furthermore, the increased ductility due to texture weakening with Ca-segregation, as observed by Nandy et al. [26], could lead to an increased activity of basal slip accommodating deformation in the <a>-direction, making the further activation of prismatic slip difficult.
An overview of the intensities of the basal peak in the as-RX condition and their evolution during cold rolling is given in Figure 10. As indicated, some of the alloys corresponded to two-phase fields, which led to precipitates in the case of S1 (Mg-1Al-0.5Ca), as previously shown in [27], while the other alloys very close to the solubility limit did not show precipitation behaviour. The influence of the precipitates can be considered negligible in the context of texture formation [27].

4.4. Texture Development—TD-Samples

The main difference between the S_ND and S_TD samples is the observed rotation of the basal peak parallel to the loading force. This rotation can be related to the ‘intermediate’ texture type presented previously. To investigate how this rotation was achieved, we additionally performed EBSD on two selected samples, the ternary TD_S4_5% (Mg-1Al-0.2Ca), which experienced rotation, and the binary TD_S9_5% (Mg-1Al), which did not experience rotation. Figure 11 shows representative inverse pole figure (IPF) and kernel average misorientation (KAM) maps of both samples.
Deformation twinning is active in both conditions, indicating that the reorientation was induced by deformation twinning, as was also reported by [50,51]. The tensile twins led to a re-orientation of the c-axis by about 86°, resulting in the observed basal-type texture after further rolling. Interestingly, the binary alloy did not show this reorientation. We consider two possible reasons for this observation. First, for the reorientation of the intrinsically larger grain sizes by deformation twinning, higher deformation degrees could be needed, as the nucleation of deformation twins mostly occurs at grain boundaries [52], resulting in premature failure before the reorientation has finished. Second, in addition to the large grain size, a pronounced basal-type texture is present. Therefore, fewer grains were preferably oriented for twinning and basal slip when compared to the other alloys investigated in this study, hindering homogenous strain accommodation. In comparison, the KAM maps in Figure 10 show that the alloy S4 (Mg-1Al-0.2Ca) contains both higher and more homogeneously distributed strain in its microstructure than alloy S9 (Mg-1Al). In addition to the previously proposed higher activation of <c + a> slip in most of the ternary alloys, we also attribute the increased formability to the small grain sizes in the alloys containing Ca, combined with weaker basal textures. The increased number of grains contributing to the deformation with generally easily activated deformation twinning and basal <a> slip was not compensable with non-basal slip and, hence, not negligible.
We observed for the S_ND samples that the as-RX basal peak strength also influenced the peak strength after the deformation. Here, a stronger as-RX basal peak intensity also led to a higher basal peak intensity after the cold rolling. Although the basal peak intensities after the reorientation increased to approximately the as-RX values, no further increase was seen during the ND cold rolling. The refinement of the microstructure during twinning probably allows more uniform deformation with further rolling, and the basal-type texture intensity does not increase further [30].
For the S_TD rolling orientation, the TD spread is smaller than that of the S_ND samples. In addition, the spread ratio remains constant until failure. This could indicate a uniform deformation, in which the activated slip systems contribute with similar fractions to the deformation. Different Schmid factors are also likely to have affected the TD spread, especially for the as-RX conditions.

5. Conclusions

In this study, seven Mg-Ca-Al alloys, one Mg-Ca alloy, and one Mg-Al alloy with systematically varied alloying contents were investigated to unravel the alloying-related effects on the texture development during cold rolling. The following conclusions can be drawn:
-
All the investigated alloys showed a high degree of deformation compared to pure Mg during compression testing and cold rolling.
-
The initial as-RX textures were weak for all the alloys compared to pure Mg.
-
The cold rolling of the basal oriented samples (with the initial sheet in the normal direction) led to a gradual increase in the basal peak intensity, except for the Mg-1Al-0.005Ca, which showed a slight decrease until a height reduction of 10% was reached, followed by an increase.
-
For the off-basal oriented samples (with the initial sheet in the transverse direction) the cold rolling resulted in a reorientation of the basal peak accompanied by a drop in basal peak intensity at a height reduction of 5%. At a height reduction of 10%, the reorientation was complete, and the basal peak intensity had similar levels to the initial texture strength. No further increase in the basal peak intensity was observed. The Mg-1Al did not show this reorientation, probably due to premature failure. Overall, the TD samples exhibited weaker basal peaks than the ND samples.
-
The basal peak intensities of the initial and the cold rolling textures were dependent on both the Ca and the Al content. While increasing amounts of Al led to stronger basal peak intensities, the addition of Ca weakened the basal texture’s intensity. It is proposed that the solubility of Ca is closely related to the texture formation. An increasing amount of Al lowers the solubility of Ca, which leads to an increase in basal peak intensity. Higher Ca addition again leads to weaker basal peak intensity, and might be used to overcome of this effect.

Author Contributions

Conceptualization, L.B., S.S.-H. and W.J.D.; methodology, W.J.D. and S.S.-H.; formal analysis, W.J.D. and L.B.; investigation, W.J.D. and L.B.; writing—original draft preparation, W.J.D. and L.B.; writing—review and editing, L.B., S.S.-H. and S.K.-K.; supervision, S.S-H.; project administration, S.K.-K. and S.S.-H.; funding acquisition, S.K.-K. All authors have read and agreed to the published version of the manuscript.

Funding

We gratefully acknowledge funding by the Deutsche Forschungsgemeinschaft (DFG, German Research Foundation), SFB 1394(CRC 1394), Project-ID 409476157, subprojects A01, C02 and S.

Data Availability Statement

The data presented in this study are available on request from the corresponding author.

Acknowledgments

Many thanks to Hauke Springer for sample synthesis and to Luiz R. Guimarães for his support during sample preparation. Further, we would like to thank Risheng Pei for his support during texture measurements. In addition, David Beckers is acknowledged for his assistance during metallographic preparation and Gerd Schütz and Nico Poschmann for their support during sample rolling and processing. For his support during the interpretation and discussion of the results, we also want to thank Dierk Raabe.

Conflicts of Interest

The authors declare no conflict of interest.

References

  1. Nie, J.F.; Shin, K.S.; Zeng, Z.R. Microstructure, Deformation, and Property of Wrought Magnesium Alloys. Metall. Mater. Trans. A 2020, 51, 6045–6109. [Google Scholar] [CrossRef]
  2. Partridge, P.G. The crystallography and deformation modes of hexagonal close-packed metals. Metall. Rev. 1967, 12, 169–194. [Google Scholar] [CrossRef]
  3. Yoo, M.H.; Wei, C.T. Slip Modes of Hexagonal-Close-Packed Metals. J. Appl. Phys. 1967, 38, 4317–4322. [Google Scholar] [CrossRef]
  4. Agnew, S.R.; Duygulu, Ö. Plastic anisotropy and the role of non-basal slip in magnesium alloy AZ31B. Int. J. Plast. 2005, 21, 1161–1193. [Google Scholar] [CrossRef]
  5. Hirsch, J.; Al-Samman, T. Superior light metals by texture engineering: Optimized aluminum and magnesium alloys for automotive applications. Acta Mater. 2013, 61, 818–843. [Google Scholar] [CrossRef]
  6. Cheng, R.; Li, M.; Du, S.; Pan, H.; Liu, Y.; Gao, M.; Zhang, X.; Huang, Q.; Yang, C.; Ma, L.; et al. Effects of single-pass large-strain rolling on microstructure and mechanical properties of Mg-Al-Ca alloy sheet. Mater. Sci. Eng. A 2020, 786, 139332. [Google Scholar] [CrossRef]
  7. Pan, H.; Yang, C.; Yang, Y.; Dai, Y.; Zhou, D.; Chai, L.; Huang, Q.; Yang, Q.; Liu, S.; Ren, Y.; et al. Ultra-fine grain size and exceptionally high strength in dilute Mg–Ca alloys achieved by conventional one-step extrusion. Mater. Lett. 2019, 237, 65–68. [Google Scholar] [CrossRef]
  8. Biswas, S.; Kim, D.-I.; Suwas, S. Asymmetric and symmetric rolling of magnesium: Evolution of microstructure, texture and mechanical properties. Mater. Sci. Eng. A 2012, 550, 19–30. [Google Scholar] [CrossRef]
  9. Chen, T.; Chen, Z.; Yi, L.; Xiong, J.; Liu, C. Effects of texture on anisotropy of mechanical properties in annealed Mg–0.6%Zr–1.0%Cd sheets by unidirectional and cross rolling. Mater. Sci. Eng. A 2014, 615, 324–330. [Google Scholar] [CrossRef]
  10. Chino, Y.; Sassa, K.; Kamiya, A.; Mabuchi, M. Enhanced formability at elevated temperature of a cross-rolled magnesium alloy sheet. Mater. Sci. Eng. A 2006, 441, 349–356. [Google Scholar] [CrossRef]
  11. Agnew, S.R.; Horton, J.A.; Lillo, T.M.; Brown, D.W. Enhanced ductility in strongly textured magnesium produced by equal channel angular processing. Scr. Mater. 2004, 50, 377–381. [Google Scholar] [CrossRef]
  12. Jeong, Y.S.; Kim, W.J. Enhancement of mechanical properties and corrosion resistance of Mg–Ca alloys through microstructural refinement by indirect extrusion. Corros. Sci. 2014, 82, 392–403. [Google Scholar] [CrossRef]
  13. Motoyama, T.; Watanabe, H.; Ikeo, N.; Mukai, T. Mechanical and damping properties of equal channel angular extrusion-processed Mg–Ca alloys. Mater. Lett. 2017, 201, 144–147. [Google Scholar] [CrossRef]
  14. Imandoust, A.; Barrett, C.D.; Al-Samman, T.; Inal, K.A.; El Kadiri, H. A review on the effect of rare-earth elements on texture evolution during processing of magnesium alloys. J. Mater. Sci. 2016, 52, 1–29. [Google Scholar] [CrossRef]
  15. Al-Samman, T.; Li, X. Sheet texture modification in magnesium-based alloys by selective rare earth alloying. Mater. Sci. Eng. A 2011, 528, 3809–3822. [Google Scholar] [CrossRef]
  16. Bohlen, J.; Nürnberg, M.R.; Senn, J.W.; Letzig, D.; Agnew, S.R. The texture and anisotropy of magnesium–zinc–rare earth alloy sheets. Acta Mater. 2007, 55, 2101–2112. [Google Scholar] [CrossRef] [Green Version]
  17. Stanford, N.; Barnett, M. Effect of composition on the texture and deformation behaviour of wrought Mg alloys. Scr. Mater. 2008, 58, 179–182. [Google Scholar] [CrossRef]
  18. Stanford, N. Micro-alloying Mg with Y, Ce, Gd and La for texture modification—A comparative study. Mater. Sci. Eng. A 2010, 527, 2669–2677. [Google Scholar] [CrossRef]
  19. Sandlöbes, S.; Zaefferer, S.; Schestakow, I.; Yi, S.; Gonzalez-Martinez, R. On the role of non-basal deformation mechanisms for the ductility of Mg and Mg–Y alloys. Acta Mater. 2011, 59, 429–439. [Google Scholar] [CrossRef] [Green Version]
  20. Ha, C.W.; Bohlen, J.; Zhou, X.H.; Brokmeier, H.G.; Kainer, K.U.; Schell, N.; Letzig, D.; Yi, S.B. Texture development and dislocation activities in Mg-Nd and Mg-Ca alloy sheets. Mater. Charact. 2021, 175, 111044. [Google Scholar] [CrossRef]
  21. Hadorn, J.P.; Mulay, R.P.; Hantzsche, K.; Yi, S.; Bohlen, J.; Letzig, D.; Agnew, S.R. Texture Weakening Effects in Ce-Containing Mg Alloys. Metall. Mater. Trans. A 2013, 44, 1566–1576. [Google Scholar] [CrossRef]
  22. Pei, Z.; Friák, M.; Sandlöbes, S.; Nazarov, R.; Svendsen, B.; Raabe, D.; Neugebauer, J. Rapid theory-guided prototyping of ductile Mg alloys: From binary to multi-component materials. New J. Phys. 2015, 17, 093009. [Google Scholar] [CrossRef]
  23. Sandlöbes, S.; Friák, M.; Korte-Kerzel, S.; Pei, Z.; Neugebauer, J.; Raabe, D. A rare-earth free magnesium alloy with improved intrinsic ductility. Sci. Rep. 2017, 7, 10458. [Google Scholar] [CrossRef] [PubMed] [Green Version]
  24. Griffiths, D. Explaining texture weakening and improved formability in magnesium rare earth alloys. Mater. Sci. Technol. 2015, 31, 10–24. [Google Scholar] [CrossRef]
  25. Jo, S.; Letzig, D.; Yi, S. Effect of Al Content on Texture Evolution and Recrystallization Behavior of Non-Flammable Magnesium Sheet Alloys. Metals 2021, 11, 468. [Google Scholar] [CrossRef]
  26. Nandy, S.; Tsai, S.P.; Stephenson, L.; Raabe, D.; Zaefferer, S. The role of Ca, Al and Zn on room temperature ductility and grain boundary cohesion of magnesium. J. Magnes. Alloys 2021, 9, 1521–1536. [Google Scholar] [CrossRef]
  27. Delis, W.J.; Huckfeldt, P.C.; Hallstedt, B.; Sun, P.L.; Raabe, D.; Korte-Kerzel, S.; Sandlöbes-Haut, S. Understanding the Role of Al and Ca on the Ductility of Mg-Al-Ca Alloys. 2023. Available online: https://papers.ssrn.com/sol3/papers.cfm?abstract_id=4358733 (accessed on 9 March 2023).
  28. Atik, K.; Efe, M. Twinning-induced shear banding and its control in rolling of magnesium. Mater. Sci. Eng. A 2018, 725, 267–273. [Google Scholar] [CrossRef]
  29. Chun, Y.B.; Davies, C.H.J. Texture effects on development of shear bands in rolled AZ31 alloy. Mater. Sci. Eng. A 2012, 556, 253–259. [Google Scholar] [CrossRef]
  30. Lee, S.W.; Han, G.; Jun, T.S.; Park, S.H. Effects of initial texture on deformation behavior during cold rolling and static recrystallization during subsequent annealing of AZ31 alloy. J. Mater. Sci. Technol. 2021, 66, 139–149. [Google Scholar] [CrossRef]
  31. Hielscher, R.; Schaeben, H. A novel pole figure inversion method: Specification of the MTEX algorithm. J. Appl. Crystallogr. 2008, 41, 1024–1037. [Google Scholar] [CrossRef]
  32. Fan, H.Y.; Liu, S.F.; Guo, Y.; Deng, C.; Liu, Q. Quantifying the effects of surface quality on texture measurements of tantalum. Appl. Surf. Sci. 2015, 339, 15–21. [Google Scholar] [CrossRef]
  33. Jäger, A.; Lukáč, P.; Gärtnerová, V.; Haloda, J.; Dopita, M. Influence of annealing on the microstructure of commercial Mg alloy AZ31 after mechanical forming. Mater. Sci. Eng. A 2006, 432, 20–25. [Google Scholar] [CrossRef]
  34. Basu, I.; Al-Samman, T. Competitive twinning behavior in magnesium and its impact on recrystallization and texture formation. Mater. Sci. Eng. A 2017, 707, 232–244. [Google Scholar] [CrossRef]
  35. Barnett, M.R.; Nave, M.D.; Bettles, C.J. Deformation microstructures and textures of some cold rolled Mg alloys. Mater. Sci. Eng. A 2004, 386, 205–211. [Google Scholar] [CrossRef]
  36. Zeng, Z.R.; Bian, M.Z.; Xu, S.W.; Davies, C.H.J.; Birbilis, N.; Nie, J.F. Texture evolution during cold rolling of dilute Mg alloys. Scr. Mater. 2015, 108, 6–10. [Google Scholar] [CrossRef]
  37. Wu, D.; Tang, W.N.; Chen, R.S.; Han, E.H. Strength enhancement of Mg–3Gd–1Zn alloy by cold rolling. Trans. Nonferrous Met. Soc. China 2013, 23, 301–306. [Google Scholar] [CrossRef]
  38. Chapuis, A.; Liu, Q. Simulations of texture evolution for HCP metals: Influence of the main slip systems. Comput. Mater. Sci. 2015, 97, 121–126. [Google Scholar] [CrossRef]
  39. Al-Samman, T.; Gottstein, G. Room temperature formability of a magnesium AZ31 alloy: Examining the role of texture on the deformation mechanisms. Mater. Sci. Eng. A 2008, 488, 406–414. [Google Scholar] [CrossRef]
  40. Jiang, H.; Zhang, Y.; Kang, Q.; Xu, Z.; Dong, P.; Li, H. The influence of Ca and Gd microalloying on microstructure and mechanical property of hot-rolled Mg-3Al alloy. Procedia Eng. 2017, 207, 932–937. [Google Scholar] [CrossRef]
  41. Zeng, Z.R.; Bian, M.Z.; Xu, S.W.; Davies, C.H.J.; Birbilis, N.; Nie, J.F. Effects of dilute additions of Zn and Ca on ductility of magnesium alloy sheet. Mater. Sci. Eng. A 2016, 674, 459–471. [Google Scholar] [CrossRef]
  42. Wu, Z.; Ahmad, R.; Yin, B.; Sandlöbes, S.; Curtin, W.A. Mechanistic origin and prediction of enhanced ductility in magnesium alloys. Science 2018, 359, 447–452. [Google Scholar] [CrossRef] [PubMed] [Green Version]
  43. Styczynski, A.; Hartig, C.; Bohlen, J.; Letzig, D. Cold rolling textures in AZ31 wrought magnesium alloy. Scr. Mater. 2004, 50, 943–947. [Google Scholar] [CrossRef]
  44. Wang, Y.N.; Huang, J.C. Texture analysis in hexagonal materials. Mater. Chem. Phys. 2003, 81, 11–26. [Google Scholar] [CrossRef]
  45. Chino, Y.; Sassa, K.; Mabuchi, M. Texture and Stretch Formability of Mg-1.5 mass%Zn-0.2 mass%Ce Alloy Rolled at Different Rolling Temperatures. Mater. Trans. 2008, 49, 2916–2918. [Google Scholar] [CrossRef] [Green Version]
  46. Mackenzie, L.W.F.; Pekguleryuz, M.O. The recrystallization and texture of magnesium–zinc–cerium alloys. Scr. Mater. 2008, 59, 665–668. [Google Scholar] [CrossRef]
  47. Chino, Y.; Huang, X.; Suzuki, K.; Mabuchi, M. Enhancement of Stretch Formability at Room Temperature by Addition of Ca in Mg-Zn Alloy. Mater. Trans. 2010, 51, 818–821. [Google Scholar] [CrossRef] [Green Version]
  48. Kim, D.W.; Suh, B.C.; Shim, M.S.; Bae, J.H.; Kim, D.H.; Kim, N.J. Texture Evolution in Mg-Zn-Ca Alloy Sheets. Metall. Mater. Trans. A 2013, 44, 2950–2961. [Google Scholar] [CrossRef] [Green Version]
  49. Steiner, M.A.; Bhattacharyya, J.J.; Agnew, S.R. The origin and enhancement of {0001} 〈112¯0〉 texture during heat treatment of rolled AZ31B magnesium alloys. Acta Mater. 2015, 95, 443–455. [Google Scholar] [CrossRef]
  50. Al-Samman, T.; Gottstein, G. Influence of Starting Textures on the Development of Texture and Microstructure during Large Strain Hot Rolling of Pure Magnesium. Solid State Phenom. 2005, 105, 201–206. [Google Scholar] [CrossRef]
  51. Yang, P.; Yu, Y.; Chen, L.; Mao, W. Experimental determination and theoretical prediction of twin orientations in magnesium alloy AZ31. Scr. Mater. 2004, 50, 1163–1168. [Google Scholar] [CrossRef]
  52. Beyerlein, I.J.; Capolungo, L.; Marshall, P.E.; McCabe, R.J.; Tomé, C. Statistical analyses of deformation twinning in magnesium. Philos. Mag. 2010, 90, 2161–2190. [Google Scholar] [CrossRef]
Figure 1. Stress–strain behaviour of the investigated Mg-Al-Ca alloys under compression loading in TD direction.
Metals 13 00712 g001
Figure 2. Observed types of pole figure for samples with different compositions and rolling reductions (in %) deformed in normal direction (ND) and transverse direction (TD). Yellow and green background colours indicate whether the type was observed for ND (green), TD (yellow), or both directions.
Metals 13 00712 g002
Figure 3. Overview of the pole-figure types for the investigated alloys. Left, S_ND samples, and Right, S_TD samples.
Metals 13 00712 g003
Figure 4. Maximum intensities of the basal (0002) peak for S_ND samples related to the relative height reduction (εh) during cold rolling, including the absolute mean error resulting from the recalculation.
Metals 13 00712 g004
Figure 5. Spread ratio of the peak shape related to the relative height reduction (εh) towards rolling direction (RD)/TD of the pole figures for S_ND samples, including the error in the spread towards RD and TD estimated at 1.75° (half of the resolution).
Metals 13 00712 g005
Figure 6. Preferred components for S_ND samples as variation along the rim of the {10 1 ¯ 0}-pole figures. Distance between TD and RD is 90°.
Metals 13 00712 g006
Figure 7. Maximum intensities of the basal (0002) peak for S_TD samples related to the relative height reduction (εh) during cold rolling, including the absolute mean error resulting from the recalculation.
Metals 13 00712 g007
Figure 8. Spread ratio of the peak shape related to the relative height reduction (εh) towards RD/TD of the pole figures for S_TD samples, including the error in the spread towards RD and TD estimated at 1.75° (half of the resolution).
Metals 13 00712 g008
Figure 9. Preferred components for S_TD samples as variation along the rim of the {10 1 ¯ 0}-pole figures. Distance between TD and RD is 90°.
Metals 13 00712 g009
Figure 10. Overview of the as-RX basal peak intensities (BPI) and their evolution during cold rolling for the S_ND samples depicted in the Mg-rich corner of the Mg-Al-Ca phase diagram adapted from [27].
Metals 13 00712 g010
Figure 11. (a) S4_TD_5%: Top: IPF map. Bottom: KAM map. (b) S9_TD_5%: Top: IPF map. Bottom: KAM map.
Metals 13 00712 g011
Table 1. Investigated compositions in wt.-% with their nominal and measured chemical compositions (with ICP-OES), respectively.
SampleNominal CompositionMgAlCaCuNi
S11Al-0.5CaBal.1.0400.524<0.002<0.002
S21Al-0.005CaBal.1.0800.0060.004<0.002
S31Al-0.1CaBal.1.0400.103<0.002<0.002
S41Al-0.2CaBal.1.1000.2320.002<0.002
S52Al-0.005CaBal.2.1100.007<0.002<0.002
S62Al-0.1CaBal.2.1400.113<0.002<0.002
S72Al-0.2CaBal.2.1200.2140.002<0.002
S80.1CaBal.0.0440.108<0.002<0.002
S91AlBal.1.000<0.001<0.001<0.001
Disclaimer/Publisher’s Note: The statements, opinions and data contained in all publications are solely those of the individual author(s) and contributor(s) and not of MDPI and/or the editor(s). MDPI and/or the editor(s) disclaim responsibility for any injury to people or property resulting from any ideas, methods, instructions or products referred to in the content.

