Article

Computational Analysis of the Influence of Residual Stress on the Strength of Composites with Different Aluminum Matrices and Carbide Particles

by
Ruslan Balokhonov
1,*,
Aleksandr Zemlianov
1,
Diana Gatiyatullina
1,2 and
Varvara Romanova
1
1
Institute of Strength Physics and Material Science, Russian Academy of Sciences, 634055 Tomsk, Russia
2
Department of Solid Mechanics, Faculty of Physics and Engineering, National Research Tomsk State University, 634050 Tomsk, Russia
*
Author to whom correspondence should be addressed.
Metals 2023, 13(4), 724; https://doi.org/10.3390/met13040724
Submission received: 6 February 2023 / Revised: 30 March 2023 / Accepted: 4 April 2023 / Published: 7 April 2023
(This article belongs to the Special Issue Fatigue Behavior and Crack Mechanism of Metals and Alloys)

Abstract

:
A numerical study of the mechanical behavior of aluminum matrix–carbide particle composites subjected to combined thermomechanical loading is carried out. The composite structure, corresponding to that observed experimentally, is explicitly taken into account in the calculations. The mechanical response of the aluminum matrix and carbide particles is described using the isotropic elastic–plastic and elastic–brittle models. A fracture criterion of the maximum equivalent stress acting in the local regions of volumetric tension is used to study the crack initiation and propagation in the particles. The dynamic plane stress boundary value problems of cooling and tension of the composites are solved by the finite element method ABAQUS/Explicit. The influence of the cooling-induced residual stress and thermomechanical properties of the matrix and particle materials on the strength of the composites is investigated. A positive or negative effect of the residual stress is found to depend on the ratio between the particle strength and the matrix yield stress. Compressive residual stress formed in the particle after the cooling increases the strength of composites with hard matrices and low-strength particles. A decrease in the matrix–particle interfacial curvature results in a change in the fracture mechanism from in-particle cracking to debonding, which increases the composite strength. Composite elongation upon the fracture onset decreases with the volume fraction of the particles.

1. Introduction

Due to their high strength-to-weight ratio, metal matrix composites (MMCs) have been widely used for applications in the automotive and aerospace industries. Deposition of coatings on the material surface layers increases their strength, hardness and wear resistance. The latest reviews of advanced materials used in the production of MMCs and the microstructural studies of composites can be found, for instance, in [1,2]. The state-of-the-art technologies concerning metal matrix composites produced by laser additive manufacturing are discussed in [3]. Particular attention is paid to the complex microstructural characteristics and performance properties of the composites, in which the second phase can be formed in situ, i.e., through a chemical reaction during manufacturing, or by ex situ mixing with the matrix powder, which can be accompanied by the second phase dissolution and interfacial reactions with the matrix. Aluminum and its alloys [4,5,6], having an advantage of a lower cost and a higher specific strength over the other materials available for the production of MMCs, show a good promise for the automotive and aerospace industries, where the weight saving in machine parts is critical.
The manufacture of composites includes a stage of material heating to the melting temperature of the binding phase or close to it, e.g., during stir casting [7], laser deposition [8,9] or solid-phase sintering [10]. Residual stresses arise during subsequent cooling of the fabricated MMCs due to the difference in the thermal expansion coefficients of the metal and ceramics [9,10,11]. The issue of a positive or negative influence of the residual stresses on the fracture of composites under their further combined mechanical loading is currently debatable. Laser deposition induces high tensile residual stresses in the coating [10], which can compromise the quality of the specimen [10,11]. It has been shown [10] that an additional coating layer can relieve dangerous tensile residual stresses, and the distribution of residual stresses in the coating layers is significantly influenced by the material properties—thermal expansion coefficients and Young’s modulus. Laser shock peening (LSP) causes high compressive residual stresses in the SiC/2009Al composite [11]. A subsequent laser surface treatment of the MMC coating formed by cold gas dynamic spraying (CGDS) leads to a 3–4 times increase in the surface layer microhardness due to the formation of titanium carbide and diboride compounds as a result of an exothermic reaction of boron carbide with the substrate material [12].
The use of numerical simulations is necessitated by the complex microstructure of the materials under study. Firstly, the problem of deformation and fracture of composite materials is multiparametric. The changes in the MMC microstructure (volume fraction of particles and their shapes, the geometry of the substrate–coating interface, etc.), and the thermomechanical properties of the compounds (e.g., elastic moduli, thermal expansion coefficients, matrix plasticity and particle strength) affect the composite’s plasticity and strength. Solving this task by the experimental methods requires a large number of expensive full-scale tests taking considerable time and effort. At the same time, it is not always possible to vary each parameter in the experiments individually, with all other conditions being the same. In this regard, an important aid to the experiments is modeling, in which a parametric analysis can be performed relatively quickly and at a quite low cost. Secondly, a numerical calculation makes it possible to investigate the evolution of local stresses and strains in the bulk during the material loading, which is most important for the composites possessing pronounced structural heterogeneity. Dangerous stress concentrations occur near curvilinear interfaces; they can cause an early loss of the composite strength. Purely macroscopic approaches concerned with the homogenized characteristics of the loaded material do not take these nonlinear effects into account. Therefore, an important and urgent problem of solid mechanics and physics is the development of adequate models of the thermomechanical behavior of composite materials and coatings, taking into account their complex structure.
Most works on modeling the deformation behavior of composite materials disregard the cooling-induced residual stresses. Nevertheless, the differing particle shapes are somehow included in the finite element models of particle-reinforced composites [13,14,15,16,17,18]. For instance, the influence of rounded and elliptical SiCp particles and their volume fraction on the fracture and effective properties of a SiCp/Al composite is studied in a two-dimensional formulation [13]. The shape of silicon carbide particles is approximated by convex polygons of various sizes in [14]. The importance of including the curvilinear interfaces with convexities and concavities into consideration when predicting the properties of particle-reinforced composite materials is, for instance, underlined in [15,16,17,18]. Two-dimensional calculations of the plastic strain localization and fracture in composites with the Al, Al6061, Al6061T4 and Al6061T6 matrices containing the zirconium, titanium or boron carbide particles is performed in [15]; the influence of the material mechanical properties, interfacial strength, distance between the particles and coating thickness on the strength of composites is analyzed. Debonding and in-particle cracking under tension or compression of aluminum matrix–carbide particle composites are studied in the three-dimensional formulation of the boundary value problem [16]. The experimentally observed intricate shapes of boron carbide particles are taken into account in [17], where the authors construct finite difference models of the B4Cp/6061Al composites relying on the experimental three-dimensional microstructures revealed by the synchrotron radiation X-ray computed microtomography. Some authors [18] focus on the fracture mechanisms of composites with an AA7075 matrix and particles having different shapes and properties. They show that coarse particles of irregular and acicular shapes tend to in-particle fracture, while debonding is more frequent around fine elliptical particles.
There are considerably fewer works on modeling the deformation of composites taking into account residual stresses [19,20,21,22]. Numerical simulations demonstrate that the residual stresses do affect the subsequent behavior of composites. The elastic–plastic calculations performed for the Al6061T6-TiC composite show that the residual stresses induced by cooling are volumetrically tensile stresses in the particle, while the matrix material is under both tension and compression conditions [19]. Compression of the silicon nitride fibers and tension–compression of the nickel matrix in different directions are also revealed both experimentally and in numerical simulations of cooling the fiber-reinforced composites [21], with the dependence of cooling-induced residual strains and stresses in the matrix on the distance from the reinforcement being investigated in detail. In [19] we also show that the compressive residual stresses induced by cooling play a positive role under subsequent mechanical loading of composites. It was shown that the particle volume fraction and loading type influence the evolution of residual stresses in the Al2009-SiC and Al-B4C composites [20,22]. Furthermore, according to [22] the residual stresses increase the strength of the coated material with a double-layer composite coating.
The innovative nature of this work is a deeper understanding of the formation of cooling-induced residual stresses in the matrix and particle and their evolution under subsequent mechanical loading of composites. The novelty is to provide a detailed computational analysis of the physical reasons why the residual stresses affect the composite strength and to show how this effect varies depending on the thermomechanical properties of the matrices and particles, as well as on the particle shapes and volume fractions.

2. Formulation of the Problem

The dynamic boundary value problems simulating thermomechanical deformation and fracture of composites are solved in a plane stress formulation by ABAQUS/Explicit (2019, Dassault Systèmes, Velizi, France). The complex structure of the composite corresponds to the experimentally observed one and is taken into account in the calculations explicitly (Figure 1).

2.1. Elastic–Plastic Response of the Matrix Material

The Duhamel–Neumann relations [19] were written in the rate form to describe the thermoelastoplastic behavior of the matrix.
σ ˙ i j = P ˙ δ i j + S ˙ i j = K ( ε ˙ k k 3 α T ˙ ) δ i j + 2 μ ( ε ˙ i j ε ˙ k k δ i j / 3 ε ˙ i j p )
where σ i j and S i j are the stress and deviatoric stress tensors, P is the pressure, ε i j and ε i j p are the total and plastic strain tensors, δ i j is the Kronecker delta, K and μ are the bulk and shear elastic moduli, α is the thermal expansion coefficient, T is the temperature, the upper dot denotes a time derivative.
To describe the matrix plasticity, we used the plastic flow law ε ˙ i j p = λ ˙ S i j associated with the yield criterion given by σ e q Y 0 ( ε e q p ) = 0 , where λ is the scalar parameter equal to zero during elastic deformation. An isotropic strain hardening function is written as [15,16]:
Y 0 ( ε e q p ) = σ S ( σ S σ 0 ) e x p ( ε e q p / ε r p )
where σ s and σ 0 are the saturation and yield stresses, ε r p is the strain hardening parameter. In general, the equivalent stress and accumulated plastic strain take the form [16]:
σ e q = ( σ 11 σ 22 ) 2 + ( σ 22 σ 33 ) 2 + ( σ 33 σ 11 ) 2 + 6 ( σ 12 2 + σ 23 2 + σ 31 2 ) / 2
ε e q p = 2 0 t ( ε 11 p ε 22 p ) 2 + ( ε 22 p ε 33 p ) 2 + ( ε 33 p ε 11 p ) 2 + 6 ( ε 12 p 2 + ε 23 p 2 + ε 13 p 2 ) d t / 3

2.2. Elastic–Brittle Behavior of the Particle Material

The particle elasticity is described by Equation (1), where ε ˙ i j p = 0 . The maximum equivalent stress criterion was used to model cracking in the particle [22]
σ e q = { C t e n , i f ε k k > 0 }
Criterion (5) works in the following way. If the equivalent stress in a local region experiencing a volumetric tension exceeds the critical tensile strength of ceramics Cten, then the stress tensor is equal to zero in this local region σ i j = 0 . If the local region experiences a volumetric compression under further loading of the composite, then the region resists nothing but shear S i j = 0 . Once fractured, the computational cell is not deleted from the calculation. The cell mass is conserved. Depending on the current dynamic state at a certain time step, the cell can be either in volumetrically tensile or compressive conditions. In the latter case, the cell resists volumetric compression, i.e., P 0 in this local region.

2.3. Numerical Details, Initial and Boundary Conditions

The steps of the method of finite element simulation are as follows.
  • Equations (1)–(5) are integrated into ABAQUS/Explicit software by the user-defined subroutine VUMAT, an example of which as a FORTRAN file is available in ABAQUS Documentation. This code calculates stress tensor components in every element of the computational domain and at each time step of the dynamic boundary value problem. The subroutine is modified to satisfy the plane stress conditions, in the case of which the third stress tensor component is equal to zero and the third strain tensor component depends on the first and second ones.
  • An aluminum microvolume with a single particle (Figure 1a) is discretized by a regular rectilinear mesh containing 600 × 468 square finite elements of the CPS4R type available in ABAQUS/Explicit. To this end, the experimental image is reduced to a two-phase pixel map (Figure 1b). Using an in-house program, we transform the pixel map into an orphan voxel mesh (Figure 1c) which is written in an ABAQUS input file (*.inp) along with the matrix and particle material properties, calculation steps and boundary conditions (cooling and tension/compression).
  • The *.inp file is exported to ABAQUS CAE, where the model can further be modified if necessary and then submitted for analysis by the JOB module attaching the user subroutine file developed. An explicit central difference time integration rule is used for calculating accelerations at the current time step to advance the displacement solution to the next step of time.
Two types of dynamic boundary value problems were solved. The first type corresponds to purely mechanical loading: simulated as the uniaxial loading of the structure shown in Figure 1b from the initial non-deformed state (NRS—no residual stress):
u i ( x 1 , x 2 ) = 0 , σ i j ( x 1 , x 2 ) = 0 , ρ ( x 1 , x 2 ) = ρ 0 ( x 1 , x 2 )
The second type is a combined thermomechanical loading (RS—residual stress). During thermal loading from the non-deformed state (6) the structure is cooled down from the recrystallization temperature of 350 to 23 °C. The temperature is the same in all of the computational domain elements and decreases linearly, while all the boundaries (Bi in Figure 1b) are free of loads: σ i j ( x 1 , x 2 , t ) n j = 0 . Residual stresses arise in the composite due to the difference in the thermoelastic properties of the particle and matrix materials. After cooling, the composite is subjected to uniaxial loading. Both in the NRS and RS cases, the uniaxial tension or compression in the X1-direction is modeled by the conditions u x 1 ( x 1 , x 2 , t ) = V and u x 1 ( x 1 , x 2 , t ) = ± V applied to the left B1 and right B3 boundaries of the computational domain, respectively. Particle velocity V is equal to 5 × 10⁻⁵ cm/μs. The upper B2 and lower B4 boundaries are free of loads during tension.

2.4. Validation of the Model Parameters

The model constants were selected in a strict correspondence with the experimental data, without any arbitrariness. The values of the principal physical quantities, such as thermal expansion coefficients, elasticity moduli and density can be determined both from their theoretical estimates and experiments and are readily found in the available literature (see, e.g., [23,24,25]). The Al6061 alloys, used as the matrix materials, have been well studied experimentally [26]. For the sake of comparative analysis, we used Grade T4 alloy demonstrating strain hardening characteristics similar to those of Al6061 but possessing twice higher yield stress. In order to provide a better generality, we also added technically pure aluminum, whose yield stress is the lowest among the aluminum alloys and is twice lower than that of Al6061 [26]. In the calculations, the average experimental yield stress values of aluminum alloys at different strains were taken from the confidence interval, which was approximated by function (2). The model material constants are listed in Table 1.

2.5. Verification of Simulation Results

The validity and coherence of the results of numerical simulations of elastoplastic deformation of the composites are supported by the following considerations. The Newtonian mechanics provides an a priori correct description of motion on the scales starting from, at least, microns and ending up with the solar system sizes. In particular, a solution of the general system of equations of motion, involving the laws of conservation of mass, momentum and energy, allows finding the actual displacements of a point in a deformable solid, given that the constitutive equations and the model parameters correctly describe the material response to external loading. The elastic response of aluminum- and metal carbide-based materials and the plastic yielding of aluminum are described by the commonly accepted Hook’s laws formulated as the Duhamel–Neumann relations (1) and the associated flow rule with isotropic hardening (2). The material parameters entering these laws have a clear physical meaning and have been selected in accordance with the experimental data. A solution to this system of equations is found using licensed commercial ABAQUS software. Therefore, it can be taken that the calculated stress concentration and plastic strain localization patterns in the modeled composite represent the actual physical reality.
Let us verify the results related to fracture. For all of the structures and particle and matrix materials discussed in this study, the following conclusions have been validated [15,16]. Both in the case of tension and compression of the composites, there are local regions of volumetric tension appearing due to the differences in the metal and ceramic thermoelastic properties. In the case of tension, these are the TT-type regions, and in the case of compression—TC-type regions (Figure 1). Upon further loading, cracks nucleate in these regions (Figure 2a,d), which are thought to be “tensile cracks” in both tension and compression cases, since they nucleate and propagate under the action of tensile stresses. The tensile cracks propagate in the direction perpendicular to that of tension (Figure 2b,c) and along the direction of the composite compression (Figure 2e,f).
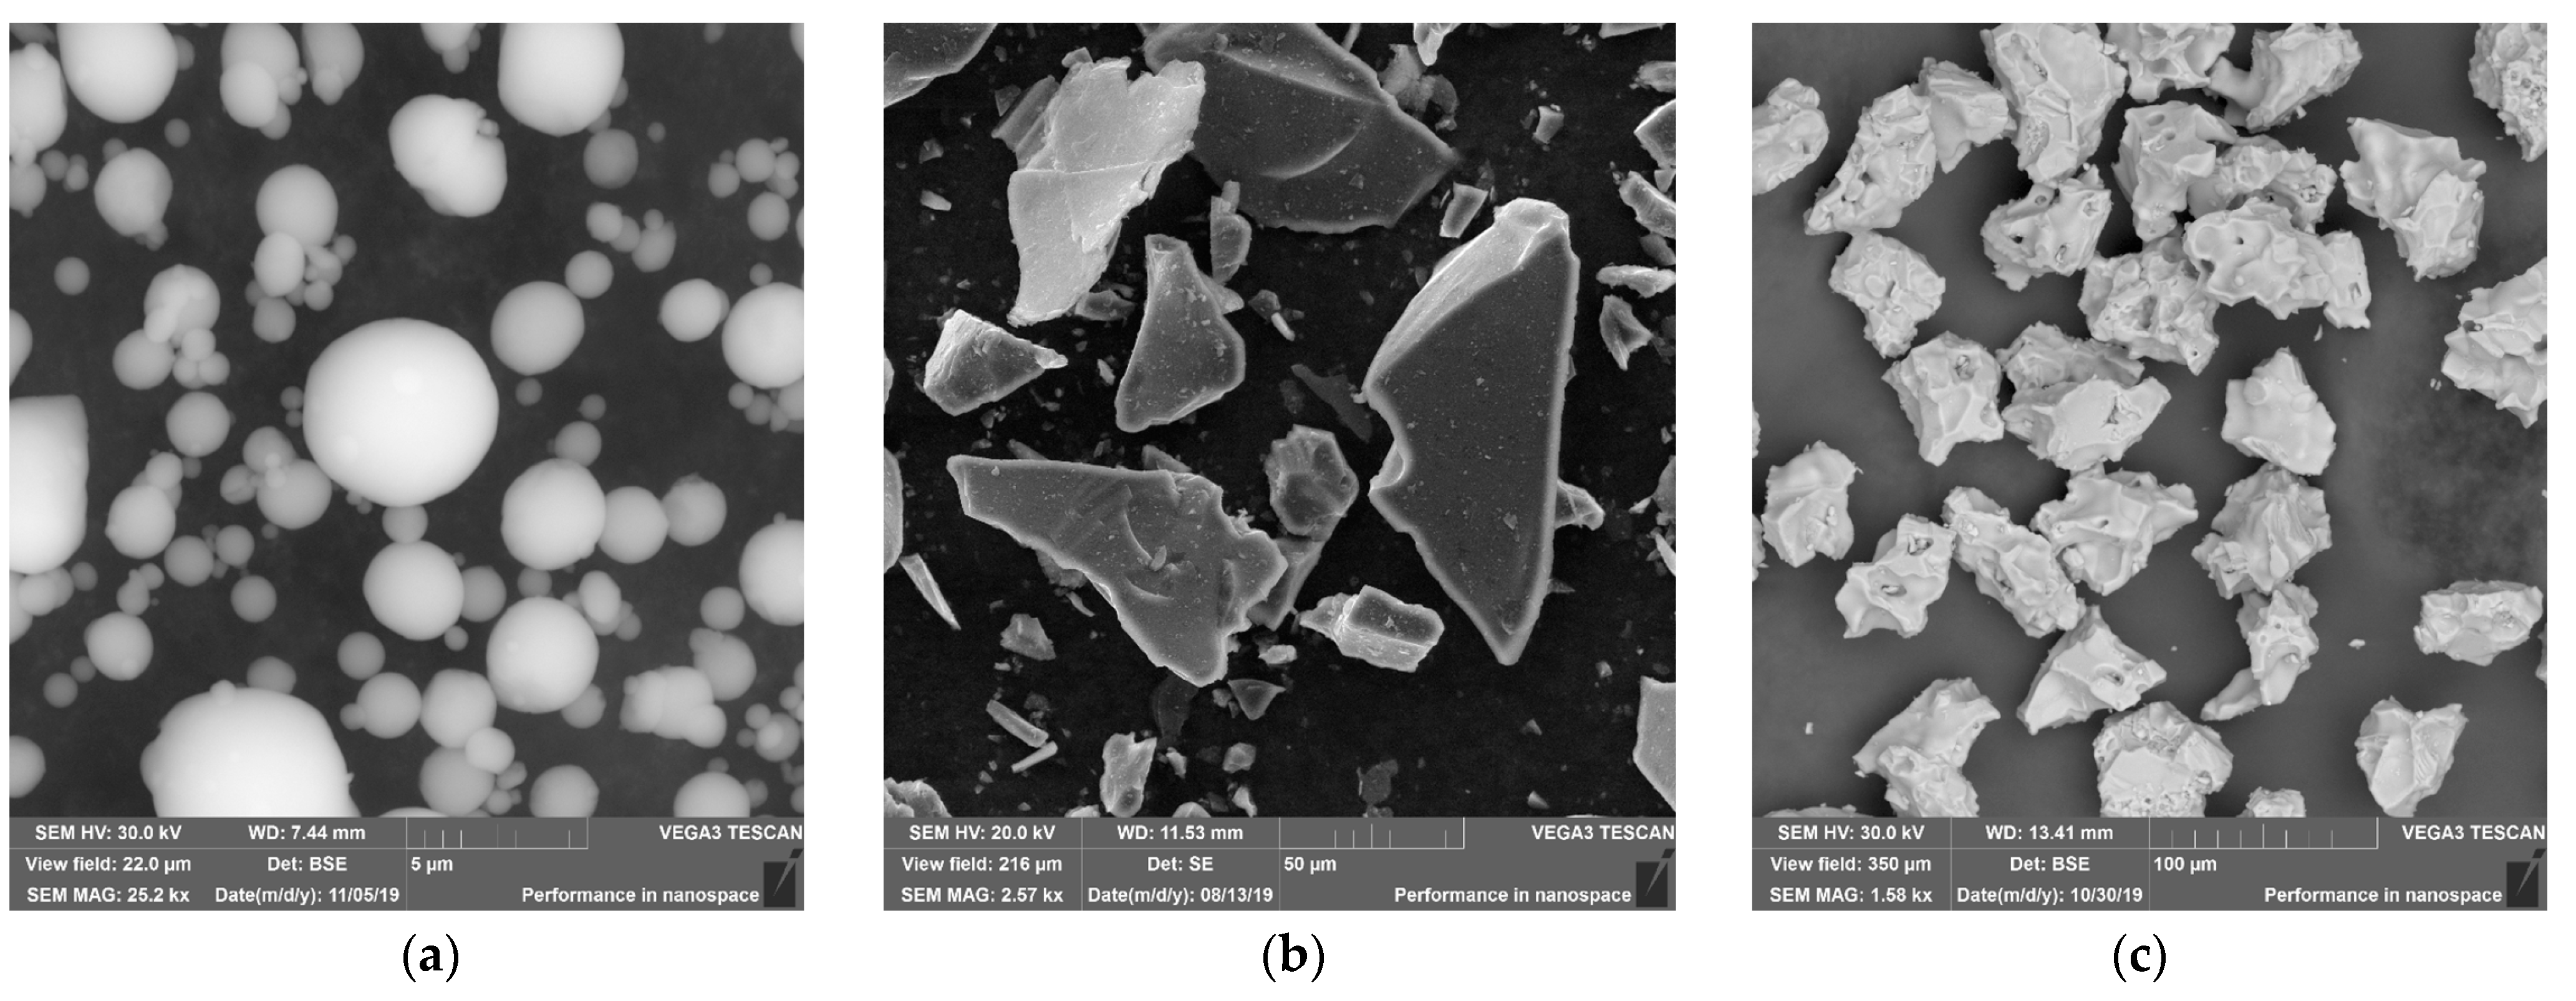
Similar cracking behavior was demonstrated in [27] and in our experiments performed in this study. The composites with an aluminum matrix and a varied volume fraction of the particles were fabricated by solid-state sintering. The aluminum and carbide powders (Figure 3) were mixed and sintered under inductive hot pressing at a temperature of 650 °C and a load of 3 kN with a holding time of 20 min.
The residual stresses in the fabricated composites were measured by an X-ray diffraction analysis. The X-ray patterns were obtained on a DRON-3 X-ray diffractometer (Russia) using filtered copper radiation. Exposure to the X-ray was carried out in the range of angles 110–120° at a step of 0.05°, with the exposure at each point providing a statistical accuracy of no worse than 3%. This interval contains the (331) and (420) aluminum lines. The strains were determined by the formula:
ε 2 = F W H M 4 t g θ
where FWHM is the full width at half maximum, θ is the angular position of the diffraction maximum of the X-ray profile of the analyzed peak. The residual stresses were calculated using the elastic moduli given in Table 1. A quantitative comparison of the experimental evidence with the calculated cooling-induced residual stresses in the aluminum matrix is provided in Section 3.2 for different volume fractions of boron carbide particles.
The fabricated composites were than subjected to tension or compression in an Instron 1185 universal testing machine. Before and after mechanical tests, the ground surface of the samples was examined on a TESCAN VEGA 3SBH scanning microscope. Typical fracture patterns are shown in Figure 4. Cracks are found to propagate in the compression direction or perpendicular to the tension axis, with the debonding or in-particle cracking observed depending on the shape of the particle.
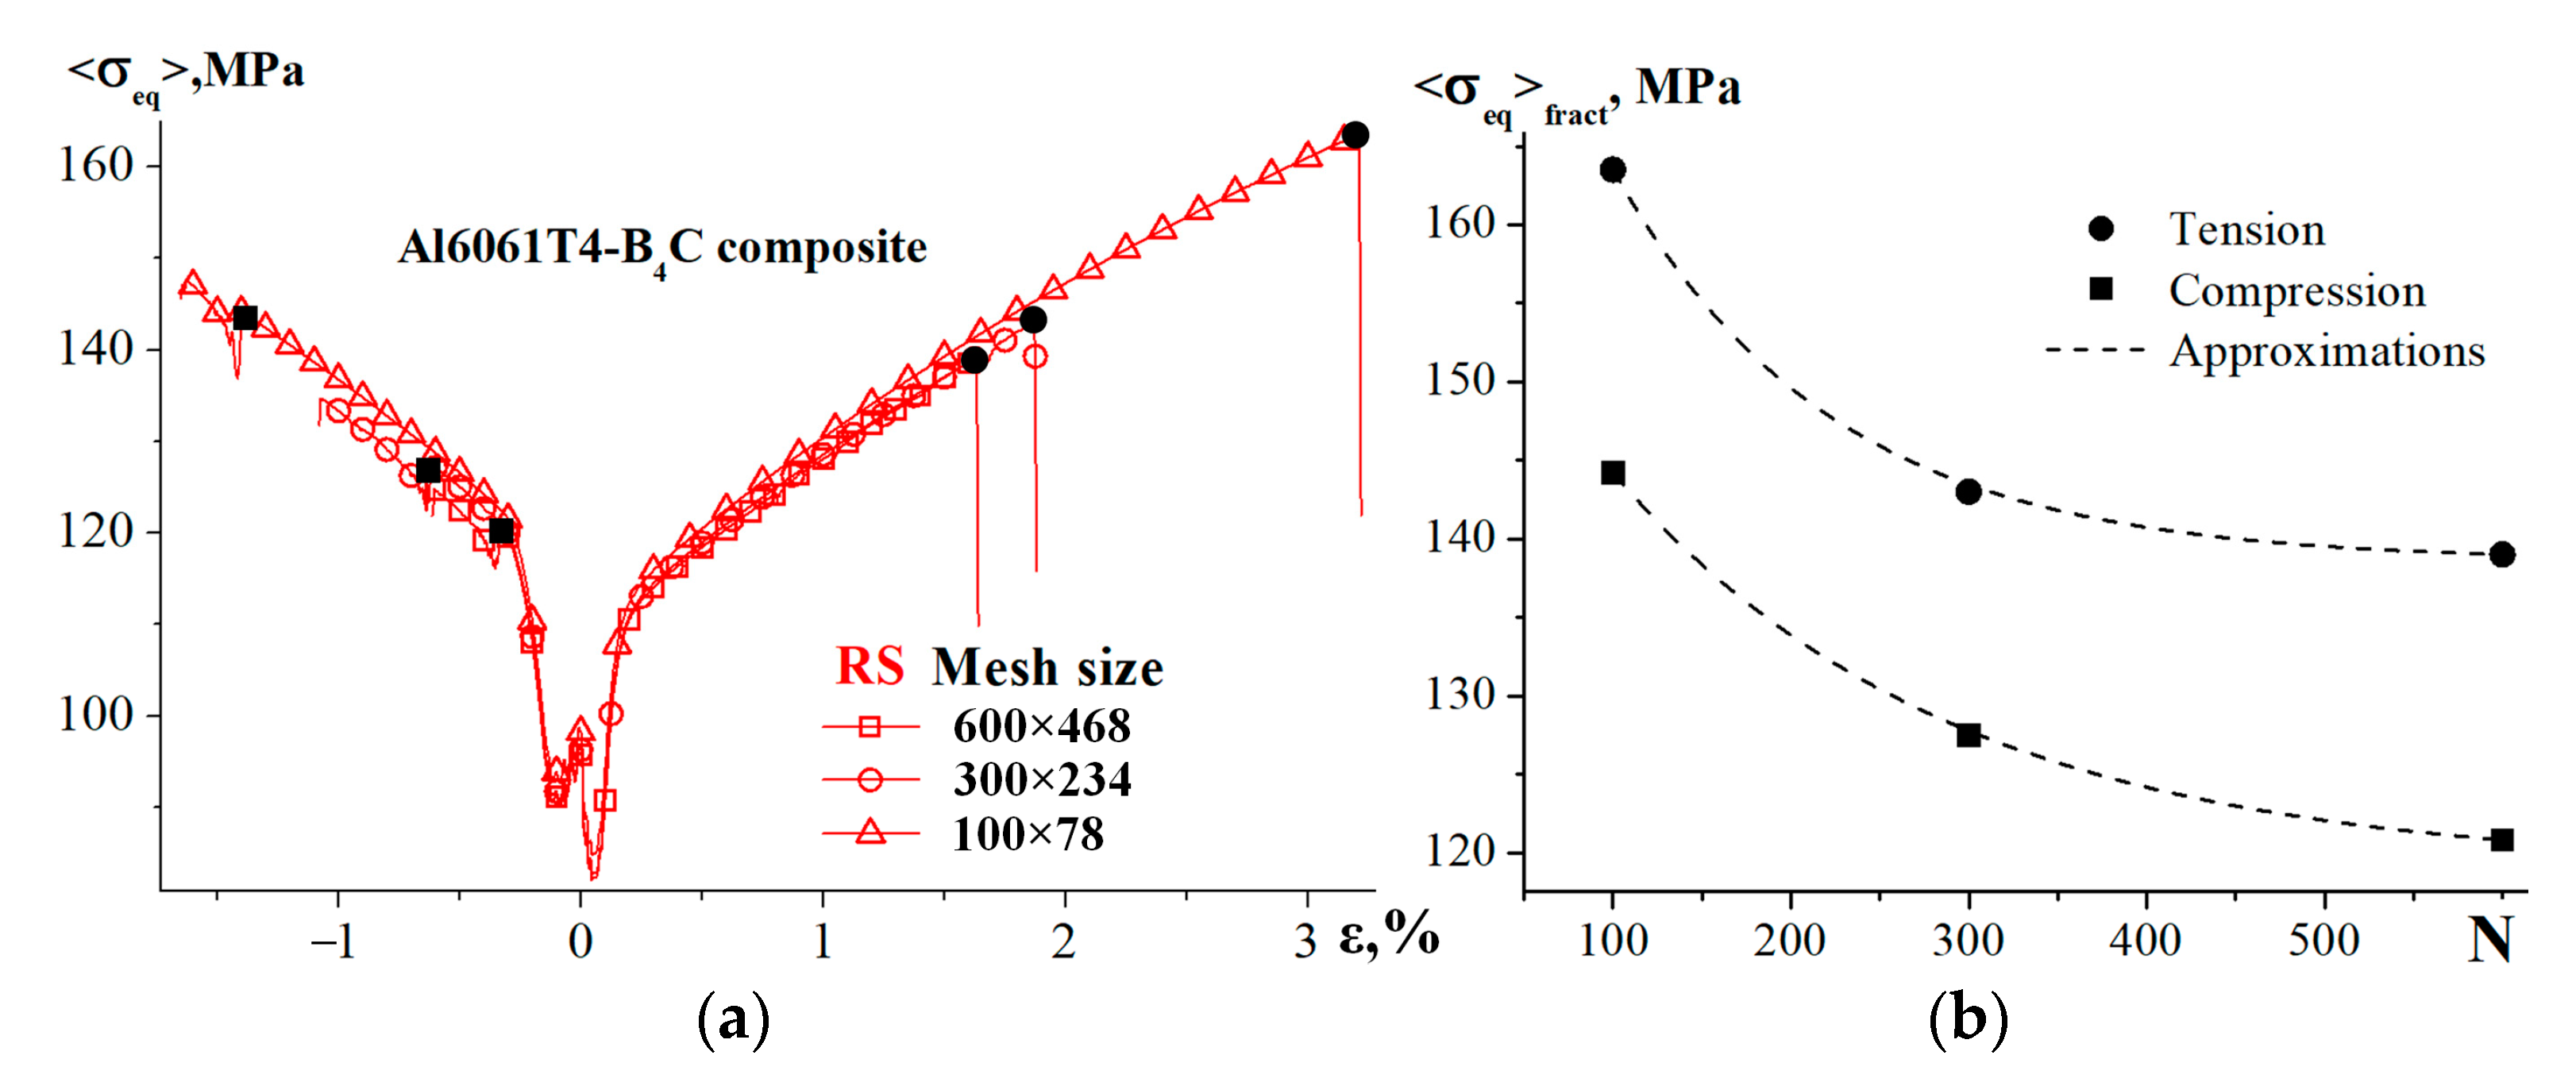
The mesh convergence of the numerical solution for the fracture was proven. In addition to the reference mesh size of 600 × 468, the coarse 300 × 234 and 100 × 78 meshes were applied to simulate the deformation and fracture of the composite. The fracture patterns were found to be very similar to each other for different meshes (Figure 5). The corresponding stress–strain curves are presented in Figure 6a. It is seen that the finer the mesh the higher the stress concentration in the TT- or TC-type regions of the particle, and, hence, the lower the strength of the composite (Figure 6a). At the same time, the homogenized stress on the stress–strain curves, at which the composite fractures, depends exponentially on the mesh size and tends to its asymptotic value, which is not related to the numerical approximation, but is determined by the physical geometry of the matrix–particle interface in the TT- or TC-type region (Figure 6b).

3. Numerical Simulation Results

3.1. Effects of Thermomechanical Properties of the Matrix and Particle Materials

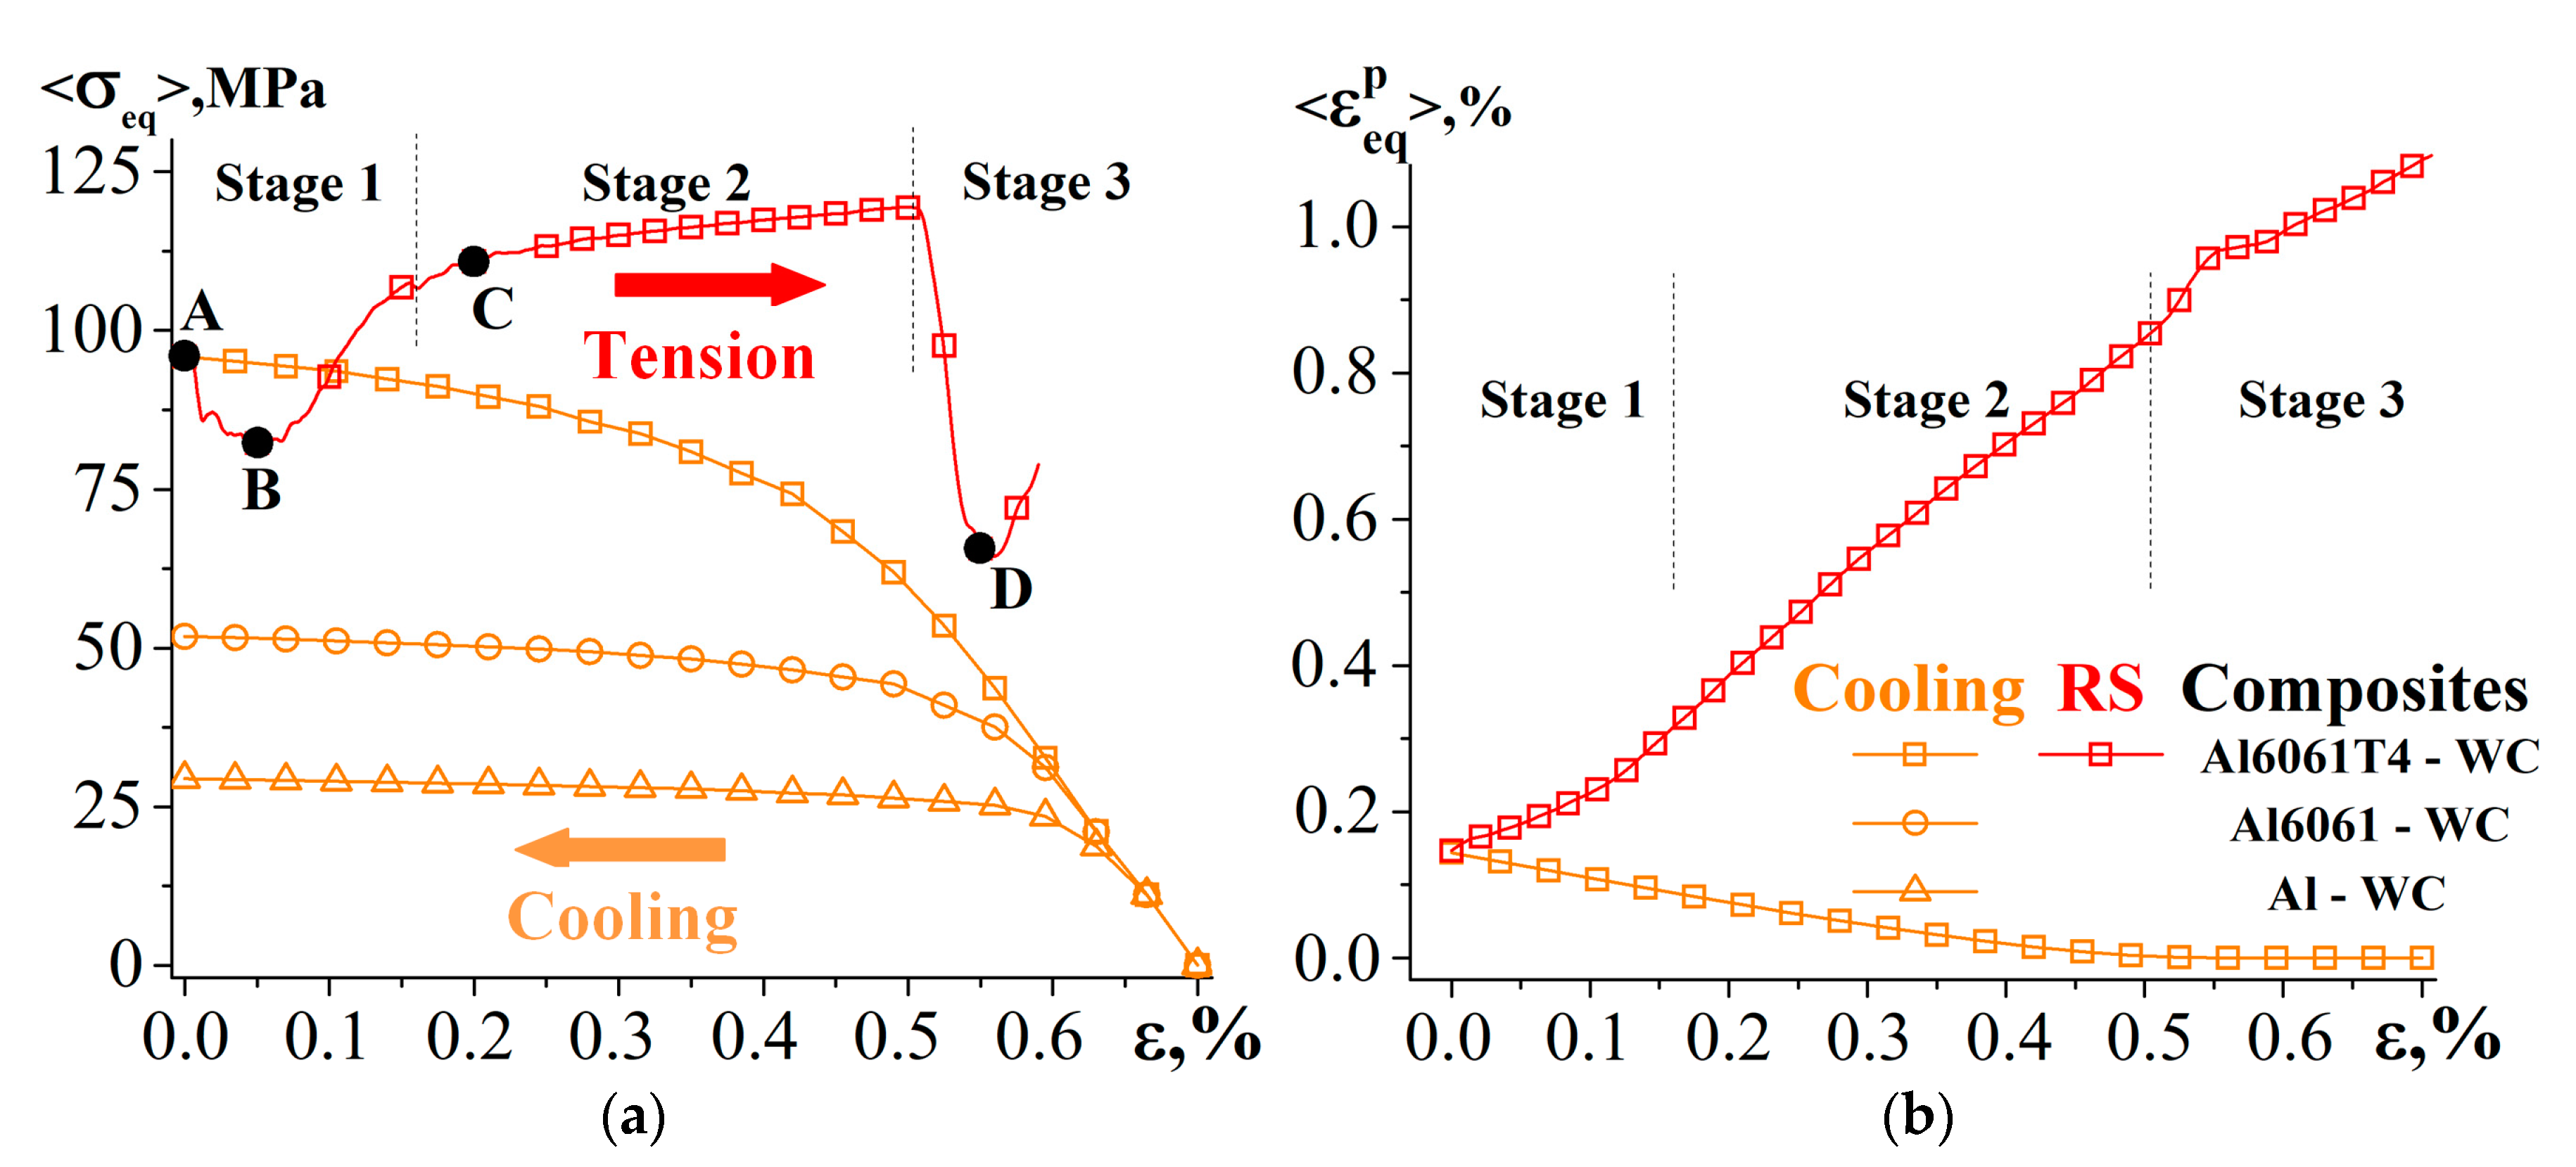
The macroscopic stress–strain curves for composites with a tungsten carbide particle as an example and different aluminum matrices are shown in Figure 7. Here and below in the figures the value of the equivalent stress (3) averaged over the computational domain < σ e q > = k = 1 , N σ e q k S k / k = 1 , N S k is plotted along the X 2 -axis, where N is the number of computational mesh cells, S k is the local volume of the cell. On the abscissa axis, the strain is the relative elongation of the domain in the X 1 direction (Figure 1b) ε = ( L L 0 ) / L 0 , where L 0 and L are the initial and current lengths of the specimen. The stress–strain curves in the RS case start at 0% strain (Figure 7) for the sake of their comparison with the curves in the NRS case. Actually, this cooling-induced strain along the X 1 -axis averaged over all lines X 2 = c o n s t is about −0.7% (Figure 8a). It has been found that the residual stresses have a positive effect on the strength of the composite with hard and low ductile Al6061T4 and Al6061 matrices (compare the blue NRS and red RS curves in Figure 7). For the less hard and more ductile pure aluminum Al, on the contrary, the strain of the composite ε f , at which the particle fracture begins, and the stress–strain curves start sharply descending, is smaller in the RS case than in the NRS situation (compare blue and red curves in Figure 7 for the Al matrix). At the same time, for all matrix materials, there is a decrease in the current stress in the initial deformation stages of composites in the RS case. Let us consider these issues in detail. Figure 8a shows an enlarged stress–strain curve given in Figure 7 for the Al6061T4-WC composite (red line with square symbols) and the cooling curves of the composites with different matrixes (orange curves with square, round and triangular symbols).
After cooling, the level of residual stresses increases with the yield stress (Figure 8a). In the cooling stage, there is a nonlinear increase in the flow stress (Figure 8a) and the accumulated equivalent plastic strain averaged over the computational domain < ε e q p > (Figure 8b). This is due to the fact that at the beginning of cooling the matrices undergo elastic compression. Further on, near the highest curvature regions of the matrix–particle interface plastic shears start nucleating, which gradually fills the matrix regions around the particle. This nonlinearity effect is most pronounced for Al6061T4 since this aluminum alloy possesses the highest yield stress among the alloys studied in this work and deforms elastically longer than other alloys do—there is a linear section (Figure 8a) due to the absence of plastic strains in the interval of ε = 0.7–0.45% (Figure 8b). After the yield stress is reached in Al6061T4, an inhomogeneous plastic flow starts in the matrix (Figure 8b) and nonlinear stress–strain dependence is observed on the flow curve (Figure 8a). The stress–strain state in the particle and matrix after cooling is presented in Figure 9, indicated as state A. Aluminum, whose thermal expansion coefficient is higher than that of tungsten carbide, tends to compress the particle on all sides. Therefore, after cooling the particle is entirely under the volumetric compression conditions (blue color on the pressure scale). Residual, both tensile and compressive, stresses develop in the matrix (red and blue colors on the pressure scale). The compressive stresses concentrate immediately around the particle near the interface concavities, and the tensile regions are formed near the convexities, also forming concentric circles at some distance from the particle (Figure 9, distributions P for state A). On the whole, during cooling of the composite, the multiaxial compression causes an equivalent stress concentration in the particle near the convexities of the matrix–particle interface, while a distinctly lineated round region is formed in the matrix with an elevated equivalent stress around the particle (Figure 9, distributions σ e q for state A). Interestingly, in this region with high values of σ e q there are areas with zero pressure (green color in distributions P for state A). This indicates that these areas undergo a pure shear. Plastic flow localizes around the particle in the matrix, with the maximum plastic strain values observed in the regions of volumetric compression (compare distributions P and ε e q p for state A in Figure 9).
The stress–strain state (SSS) described above, which forms in the composite after its cooling, completely determines the stage-like deformation behavior of the composite during its subsequent uniaxial tension (Figure 8). Plastic strain localization and stress concentration in every stage of the composite deformation develop in a complimentary and coordinated manner.
In stage 1, the SSS gradually transforms from the multiaxial to a uniaxial state. Immediately after cooling, where tensile loading is applied, the stresses on the stress–strain curve sharply decrease. Then, they reach their minimum and further on start increasing. The above stress decrease is attributed to the compressed state of the particle after cooling. Upon tensile loading of the composite, the particle starts stretching, the compressive stresses are relieved (compare pressures in the particle for states A and B in Figure 9) and turn to zero. After that, tensile stresses develop (state C) having their maximum values in the TT-type regions shown in Figure 1b. An analysis of the stress state, separately performed for the particle and the matrix, demonstrated that the averaged matrix stresses also decrease (Figure 10a). Primarily, this occurs because a decrease in the particle stresses also unloads the matrix. Secondly, a small number of compressed local areas of the matrix itself undergo unloading: blue regions in distribution P for state A in Figure 9 become smaller in the size (state B) and eventually disappear (state C). As a consequence, in stage 1 the plastic strain in these blue regions stops accumulating, to be resumed in stage 2 after these regions start stretching and the equivalent stress in them exceeds the yield stress. This is the reason why the plastic strain in stage 1 accumulates slower than it does in stage 2 (Figure 8b). Summing up, the cooling-induced residual compressive stresses, developing both in the particle and the matrix, play a positive role in preventing the earlier formation of local tensile regions under a subsequent tension of the composite.
The mechanical properties of the materials forming the composite affect the stress drop value (Figure 10b). The lower the yield stress of the matrix, the shorter stage 1 and the lower the stress drop value would be. It is noteworthy that the general character of the curve behavior is maintained for different matrices. This is attributed to the fact that the lower the yield stress of aluminum, the lower would be the level of the cooling-induced residual compressive stresses in the particle, and hence the faster the particle would transfer from the compressed state to a tensile state during a subsequent elongation of the composite. The pressure distribution patterns in the particle in Figure 11 correspond to states B, J and K shown in Figure 10b for the same composite elongation. The maximum positive (volumetric compression) and minimum negative (volumetric tension) pressure values are set on the scales in proportion to the yield stresses of the matrices. It is seen from Figure 11 that in this stage of elongation, the local TT-type region of the Al6061T4 matrix is still found in a compressed state. In the case of the Al6061 matrix, stage 1 is nearly completed (state J in Figure 11), and the pressure in the TT-type region becomes zero (state J in Figure 11). Therefore, at this moment the TT-type region undergoes a pure shear. In the case of the Al matrix, the transfer of the SSS from the multiaxial state into a uniaxial state in stage 1 is already completed, and the TT-type region begins stretching (state K in Figure 11).
In stage 2 of the composite tensile loading (Figure 8), the stress concentration in the particle and the plastic strain localization in the matrix formed earlier in stage 1 increase linearly.
Stage 3 is the fracture stage. The equivalent stress in the TT-type region, which is under the volumetric tension conditions, reaches a critical value ( C t e n = 370 MPa for tungsten carbide, Table 1). A crack nucleates in the particle and propagates perpendicular to the direction of tension (Figure 2), causing a sharp drop in the stresses on the stress–strain curve (Figure 7). A similar particle cracking behavior is observed experimentally (Figure 1a). This crack creates additional stress concentration and plastic strain localization in the adjacent near-interface areas of the aluminum matrix; a nonlinear increase in ε e q p is observed in Figure 8b (stage 3).
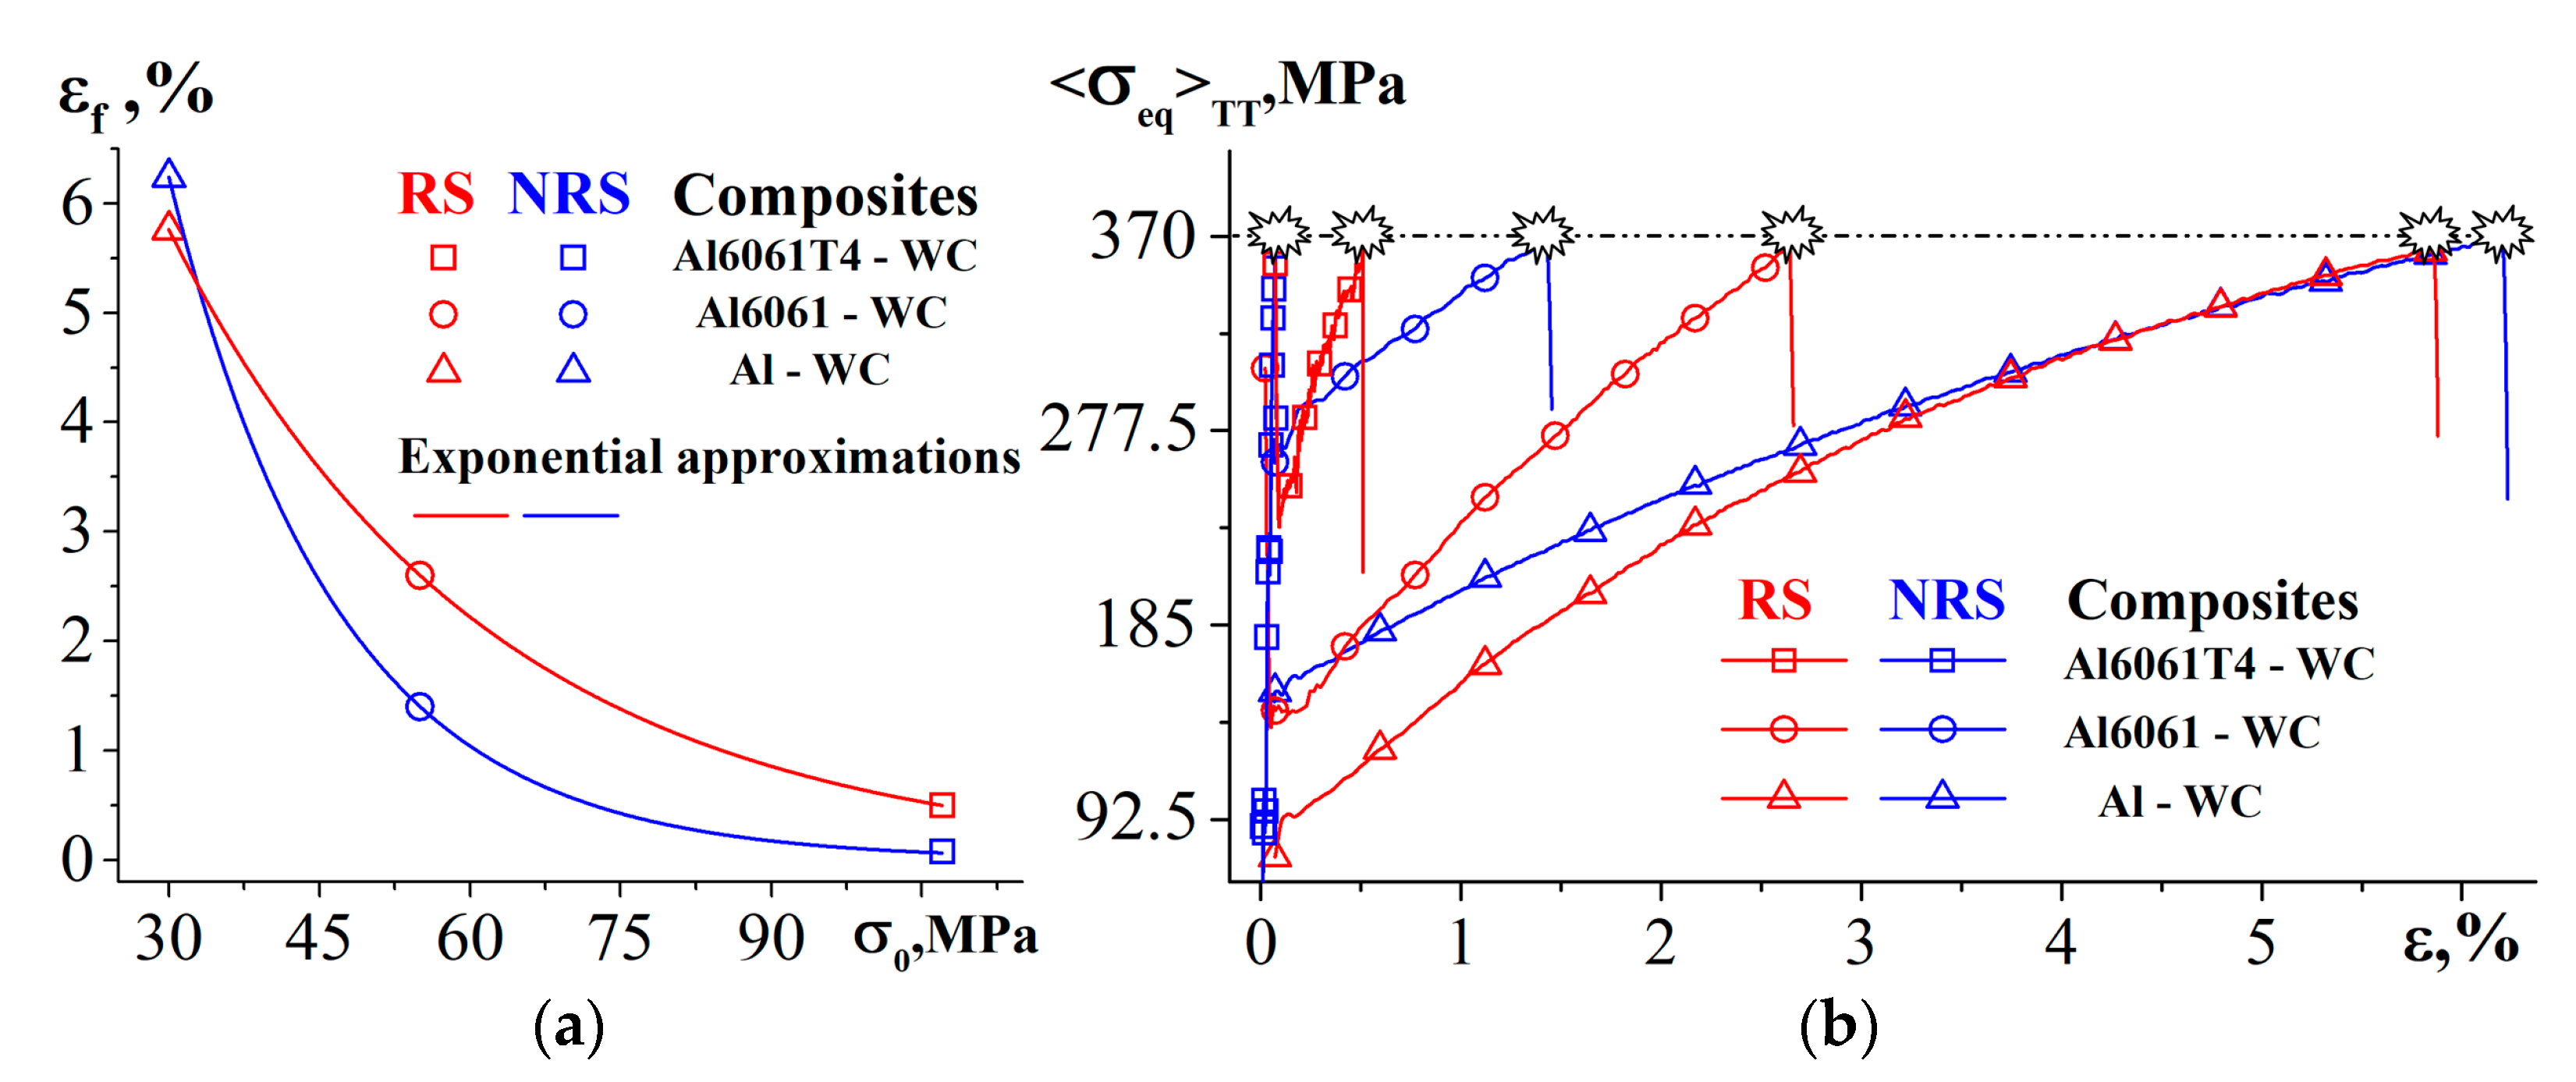
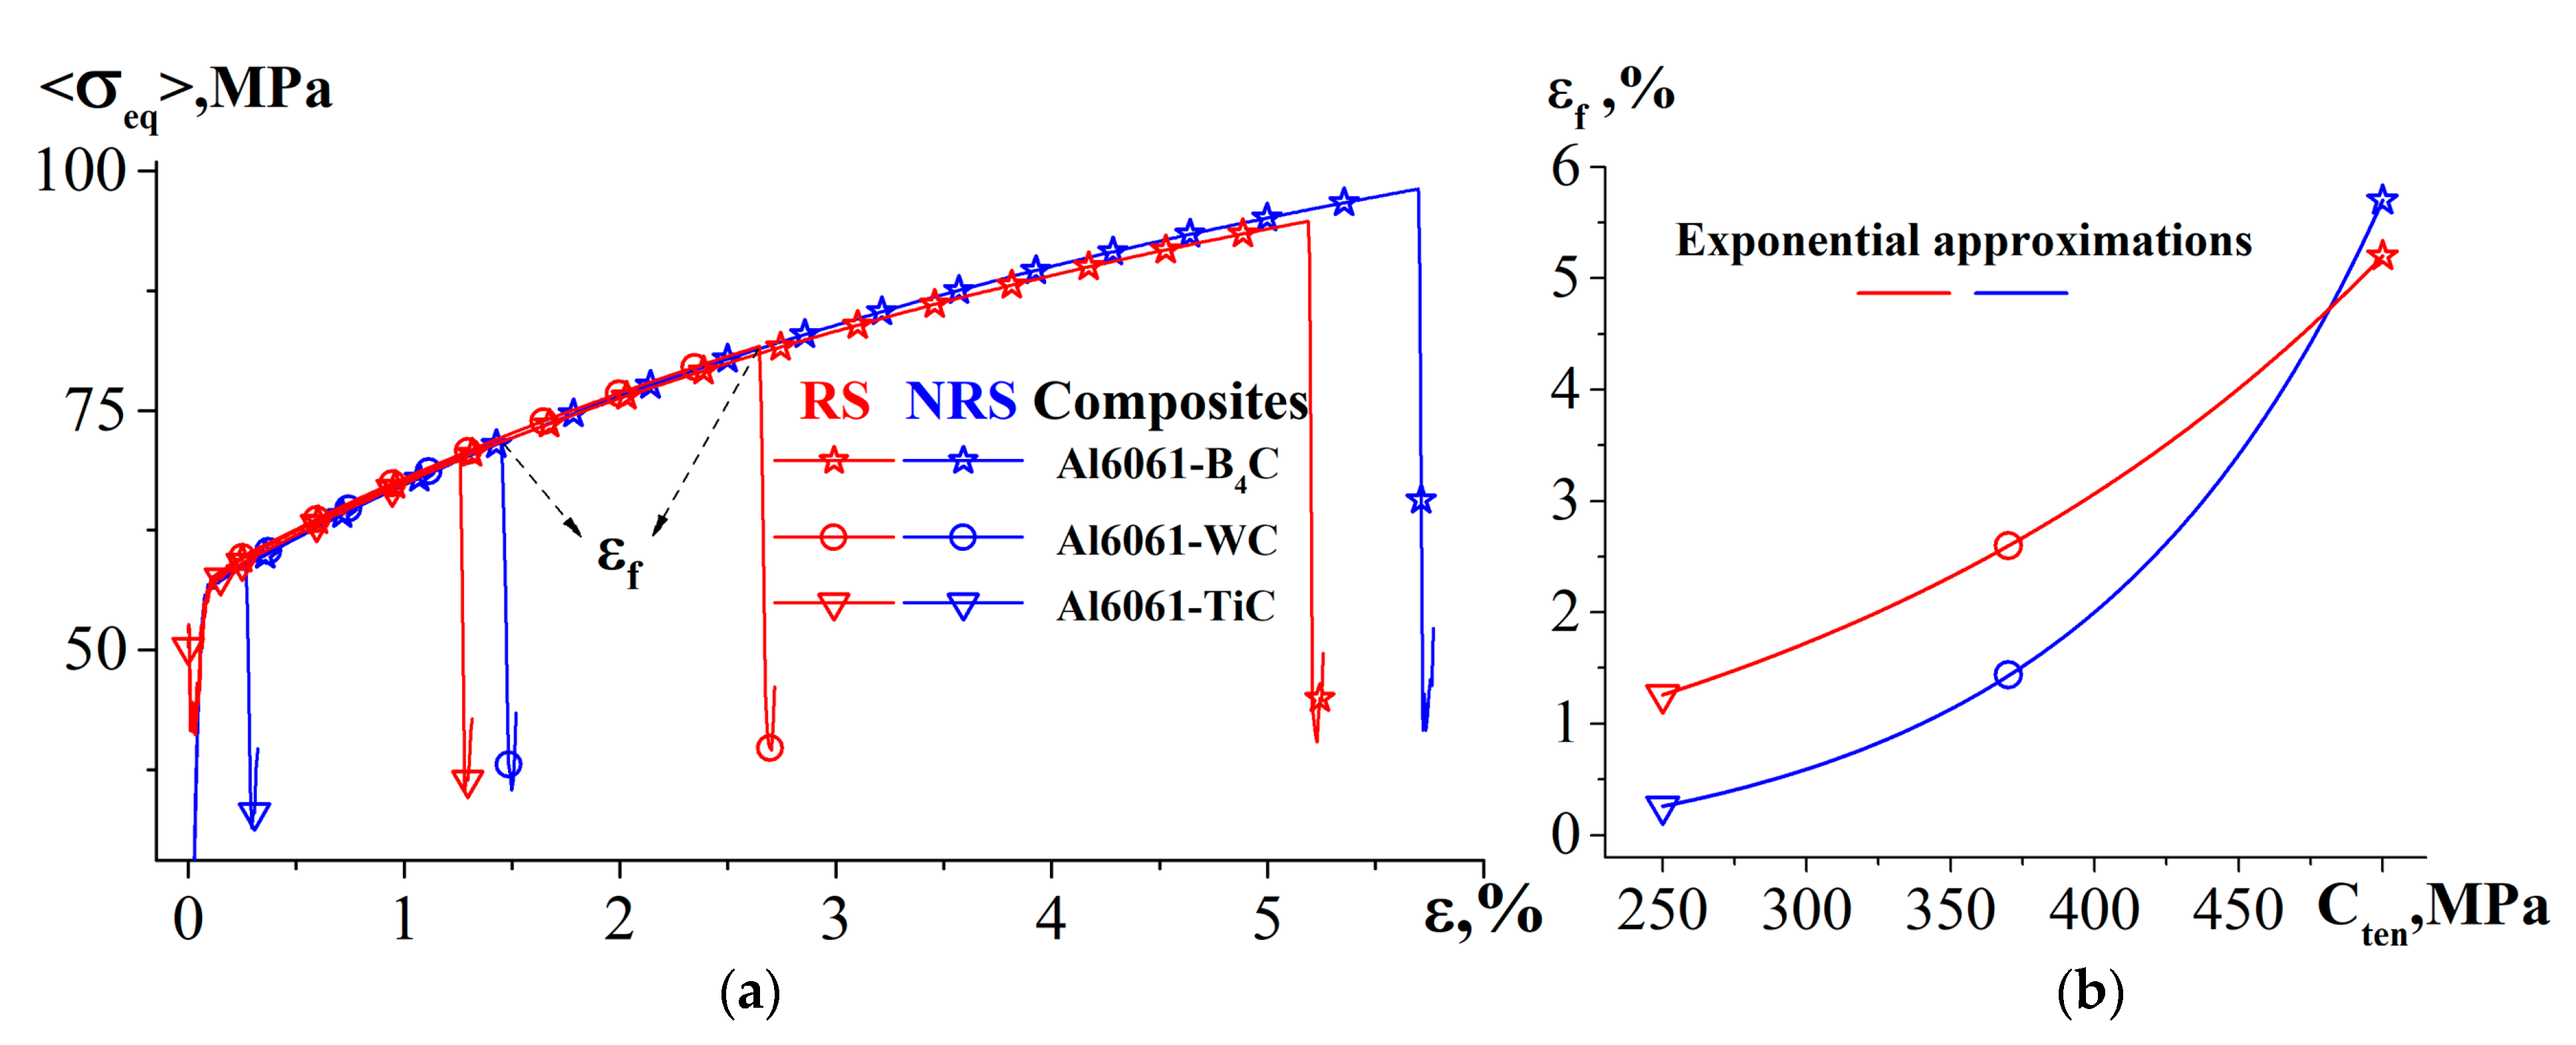
Figure 12a presents the plots of dependence of the composite strain ε f (Figure 7), at which a crack nucleates in the particle (Figure 2), on the yield stress of the matrix material. Two conclusions can be drawn. Firstly, ε f decreases exponentially with an increase in the yield stress of the matrix σ 0 for both cases: RS and NRS. This is due to the fact that the higher the yield stress σ 0 , the higher would be the stress concentration in the TT-type region in the particle in the elastic composite deformation stage (compare stress values, e.g., for NRS case for different matrices at small values of ε in Figure 12b), and, the smaller elongation would be needed for the composite to let this concentration reach a critical value of 370 MPa. Secondly, for the high-strength aluminum alloys, Al6061 and Al6061T4, ε f is larger in the RS case than it is in the NRS case, which was attributed to the above-described positive role of the cooling-induced compressive residual stresses in the particle, which reduces the level of the local stresses in the TT-type region in stage 1 (compare the stress values in the RS and NRS cases at small ε in Figure 12b). However, for the Al matrix, on the contrary, the value of ε f is smaller in the RS case than in the NRS case (Figure 7 and Figure 12a). This stems from the fact that the stress concentration in the TT-type region in the RS case increases faster than it does in the NRS case (compare blue and red curves in Figure 12b). In the case of a pure aluminum matrix with a low yield stress, the composite’s deformation to fracture takes a longer time than in the case of Al6061 and Al6061T4. Therefore, the red and blue curves shown in Figure 12b by triangles intersect at ε 4 , 5 % , and in the RS case, the stress concentration reaches 370 MPa faster than in the NRS case. For Al6061 and Al6061T4, the critical value of C t e n = 370 MPa is attained earlier than the curves intersect. The difference in the Al6061T4-WC strength between RS and NRS cases lower than that for Al6061-WC (Figure 12a) is due to the fact that the fracture of the WC particle in the NRS case begins in the nearly elastic deformation stage of the Al6061T4 matrix (Figure 13). Thus, the cooling-induced residual stresses improve the strength of the composites with a low value of C t e n / σ 0 , but play a negative role in the case where the yield stress of the matrix is much smaller that the particle strength. For instance, in the case of a B4C particle possessing higher strength than WC, the dashed line shown in Figure 12b is moved up and located at C t e n = 500 MPa , and the red and blue lines intersect in the case of Al6061. This means that contrary to the case of the Al6061-WC composite, the residual stresses play a negative role in the deformation of the Al6061-B4C composite. The corresponding calculation results are given at the end of this section.
The fracture behavior in all composites under study is the same—the crack propagates across the center splitting the particle into two fragments (Figure 13). In the NRS case, tungsten carbide in harder matrices fractures in the elastic stage of aluminum deformation, and in more plastic matrices, in the stage of a developed plastic flow. In the RS case, the strain localization pattern is overlapped with an additional plastic strain formed during cooling; its value averaged over the volume of different matrices is on the order of 0.2–0.3% (Figure 8). In the case of hard matrices, the values of ε f for RS and NRS considerably differ; therefore, the plastic strain localization is higher in the RS case (compare states D and G, E and H in Figure 13). For the composite with a pure aluminum matrix, which prior to fracture deforms by 6%, the value of 0.3% is insignificant, the values of ε f are similar in the RS and NRS cases (Figure 12a), therefore, the difference between the strain localization patterns is only slight (compare states F and I in Figure 13).
The influence of the residual stresses has been studied for different particle materials. The respective stress–strain curves for the Al6061 matrix and the curves of dependence of ε f on the strength of carbides are presented in Figure 14. For either of the RS and NRS cases, the fracture behavior of TiC and B4C particles is the same as that of the WC particle (Figure 13). We found out that ε f decreases exponentially with a decrease in the particle strength. The residual stresses exert a positive effect on the strength of the composites containing less strength TiC and WC particles and a negative effect—in the case of a higher strength B4C particle. Qualitatively this is accounted for by the above-described influence of C t e n / σ 0 on ε f , which is illustrated in Figure 12. The difference consists in the change in C t e n , rather than σ 0 . The smaller the strength C t e n , the shorter the composite elongation up to the particle fracture, and the more probable it would be for the stress concentration in the TT-type region to reach C t e n before the red and blue curves intersect in the RS and NRS cases. In the case of a high-strength B4C particle, these curves do intersect, therefore the equivalent stress attains a critical value of C t e n = 500 MPa (Table 1) faster in the RS case than it does in the NRS condition.

3.2. Particle Shape and Volume Fraction

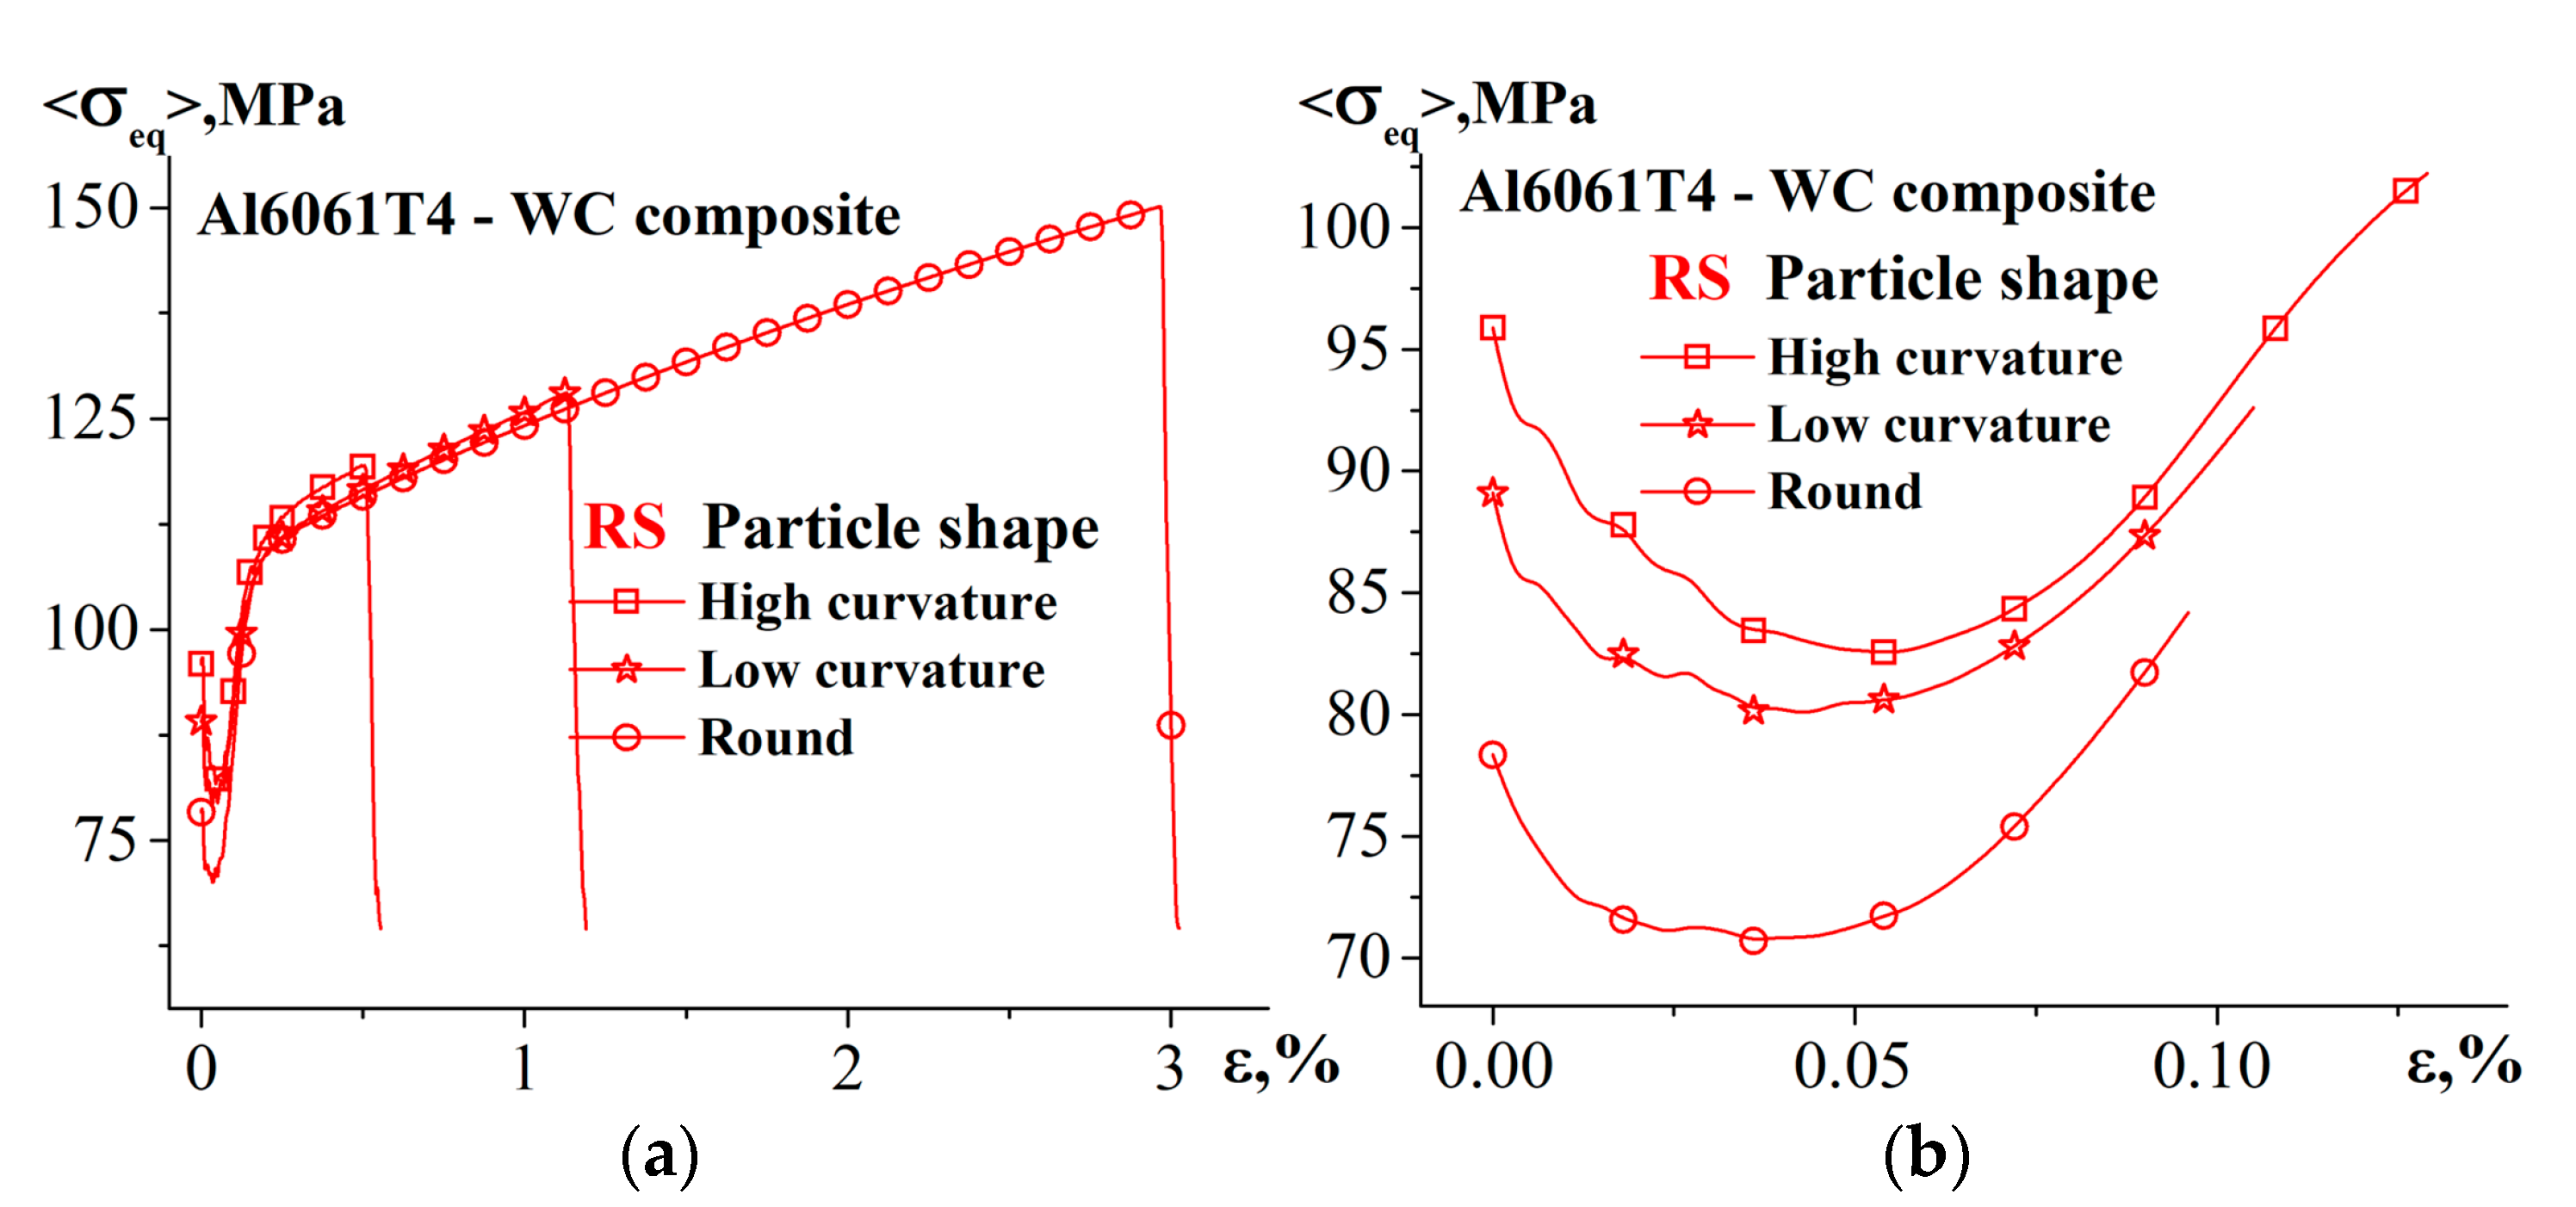
The results discussed in Section 3.1 are valid for a particle with a distinct interface curvature. However, in the manufacturing of composites by the in situ methods the particles commonly have circular shapes, which might improve the composite’s strength (see, e.g., [28]). Furthermore, in the case of solid-phase sintering, we also observe particles of differing shapes, including round and elliptical particles (Figure 4c). Let us look at the effect of the particle shape on the composite’s deformation behavior. We have performed the calculations for a composite reinforced by a perfectly round particle (Figure 15a) and a particle of an irregular experimentally observed shape but with a less distinct interfacial curvature (Figure 15b) than in the basic case discussed above (Figure 15c). It has been found that with a decrease in the interfacial curvature, the particle fracture mechanism changes from the in-particle cracking to debonding. The particle with distinct convexities of the TT- and TC-types disintegrates into a number of parts. In the case of a particle with a more rounded shape, we observe a combined fracture mechanism. Debonding prevails in the case of an ideally round particle. The respective stress–strain curves are given in Figure 16. It has been found that despite the fact the average level of the compressive cooling-induced residual stresses in the round and low-curvature particles is lower than that in the high-curvature particle (Figure 16b), the composite’s elongation to fracture essentially increases (Figure 16a) as the curvature of the particle–matrix interface decreases. This is attributed to the absence of the TT- and TC-type regions with high-stress concentrations in the composites with round particles.
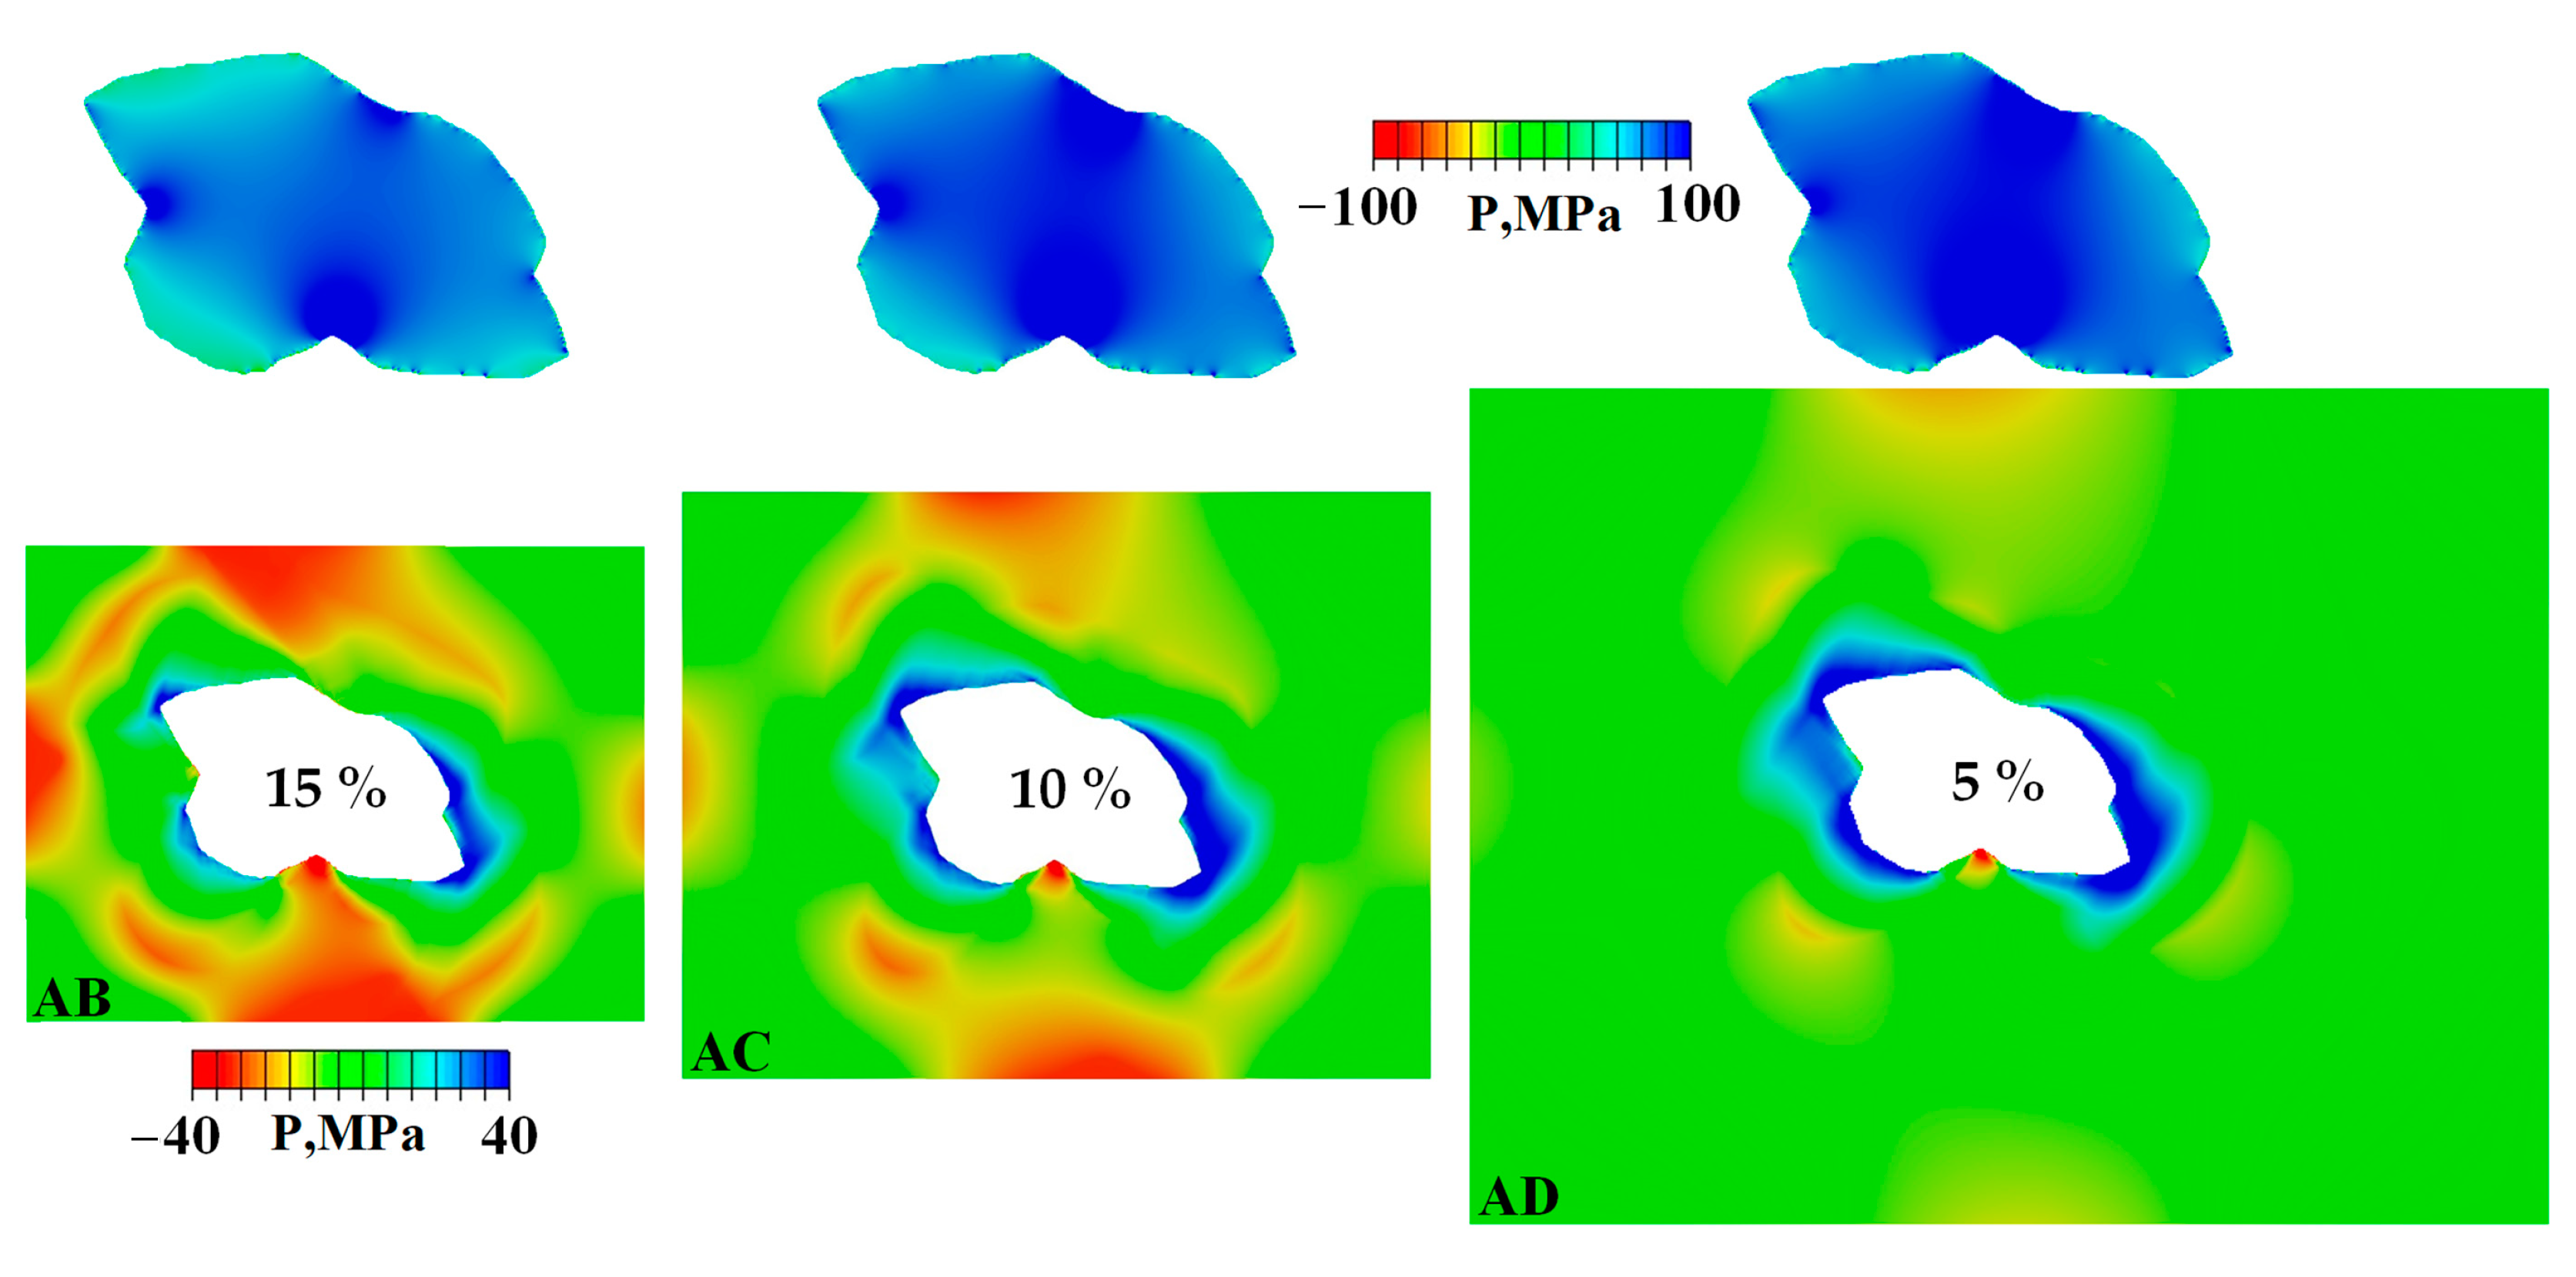
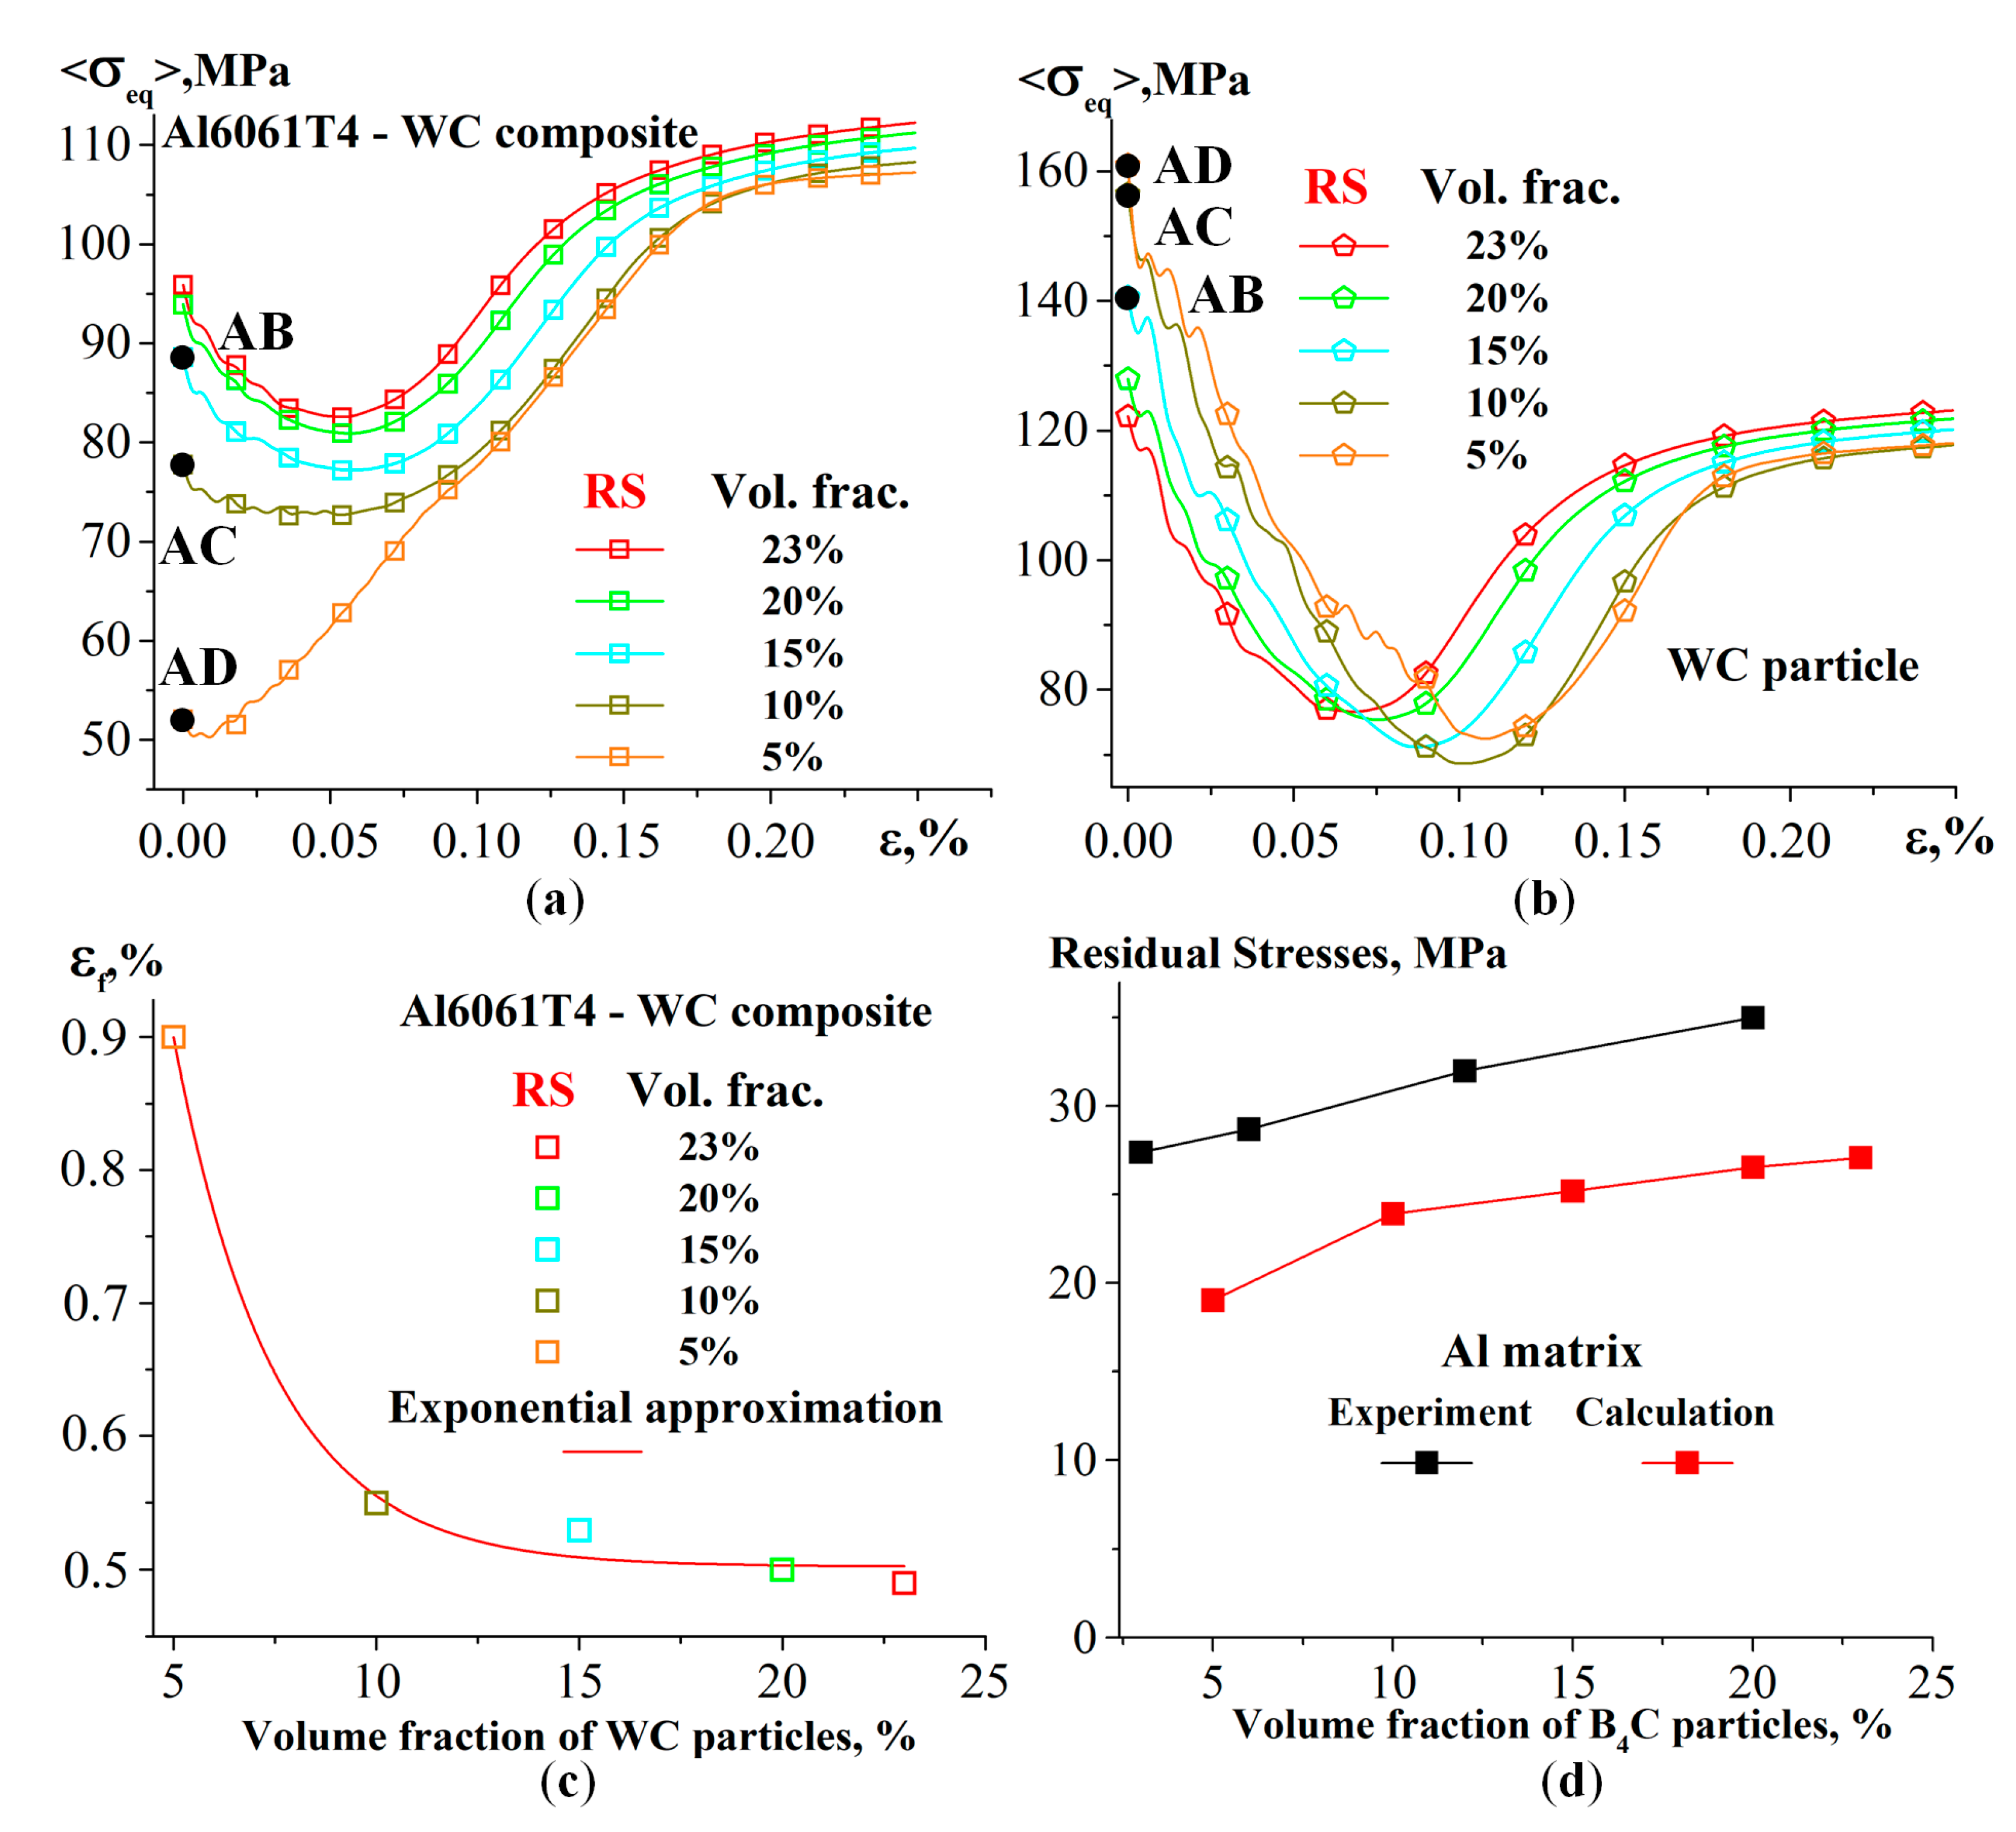
We have performed the calculations of deformation and fracture of the composites with different volume fractions of reinforcing particles (Figure 17 and Figure 18) and made two important conclusions related to the stress distribution in a composite after its cooling. The tensile stresses in the matrix decrease with the decreasing volume fraction of the particles, while the compressive stresses in the particle on the contrary increase (Figure 17). A decrease in the average stress level in the matrix results in its decrease in the entire composite, since the matrix occupies a larger volume than the particle and, hence, makes a larger contribution to the average stress level, and as the particle volume fraction decreases, this effect becomes even stronger (Figure 18a). An increased stress level in the particle in the case of a small volume fraction of the ceramic (Figure 17) is due to the fact that the particle is subjected to a compression of a large volume of the matrix, thereby increasing the stressed state in the particle after cooling. In other words, there is a redistribution of cooling-induced residual stresses with decreasing the particle volume fraction (Figure 17): as the computational domain boundaries no longer affect the stress concentration around the particle, the tensile stresses decrease in the matrix (red regions disappear) that leads to increasing compressive stresses in the particle (blue regions enhance). Therefore, in further tensile loading of the composite a large total deformation is required to alleviate the residual compressive stresses in the particle (Figure 18b). As a result, the composite’s deformation to fracture increases with a decrease in the particle volume fraction (Figure 18c). Thus, while the residual stresses in the entire composite decrease with decreasing the particle volume fraction, the compressive stresses in the particle increase the delays in the fracture onset.
A quantitative comparison of the calculated and experimental curves of the residual stress dependence on the particle volume fraction is given in Figure 18d for a pure aluminum–boron carbide composite. The residual stresses in the experiment and in the calculations increase with the particle volume fraction. The elevated residual stress values in the experiment are attributed to an additional contribution of the defect structure to the distortion of the aluminum crystal lattice: dislocational continuum, grain boundaries of the polycrystal, etc.

4. Conclusions

An experimental–numerical study of the thermomechanical behavior of particle-reinforced metal matrix composites has been carried out. The simulation results obtained using ABAQUS/Explicit well agree with the experimental evidence on the deformation and fracture of composites fabricated by solid-state sintering and allow drawing the following conclusions:
  • Residual stresses and plastic strains develop after cooling the composites from the recrystallization temperature of 350 to 23 °C. For a variety of aluminum matrix and carbide particle materials, it is verified that the particle is volumetrically compressed and different regions of the matrix experience either tension or compression.
  • Staging of the stress–strain curves of the composites subjected to cooling followed by tension was found. Stage 1 is characterized by a stress drop attributed to the evolution of a multiaxial stress state formed during the cooling of the composite into a uniaxial tension. A monotonic increase in the stress concentration and plastic strain localization in the particle and matrix is observed in stage 2. The composite fractures in stage 3.
  • The composite’s elongation to fracture is found to increase exponentially with the decreasing yield stress of the matrix and the increasing strength of the particles. The cooling-induced residual stresses have a positive effect on the strength of the composites with hard matrices and low-strength particles.
  • The lower the curvature of the matrix–particle interface the more the particle tends to debonding rather than in-particle cracking. This results in an increase in the composite’s elongation to fracture with decreasing interfacial curvature.
  • The higher the volume fraction of particles the lower the cooling-induced tensile residual stresses in the matrix and the higher the compressive stresses in the particle, causing a larger composite’s elongation to fracture.

Supplementary Materials

The following supporting information can be downloaded at: https://www.mdpi.com/article/10.3390/met13040724/s1, Video S1: Fig2Ten.avi; Video S2: Fig2Com.avi.

Author Contributions

Conceptualization, R.B. and V.R.; methodology, R.B. and V.R.; software, A.Z. and D.G.; validation, R.B. and A.Z.; investigation, R.B. and A.Z.; writing—original draft preparation, R.B. and A.Z.; writing—review and editing, R.B., A.Z. and V.R.; visualization, A.Z. and D.G.; supervision, R.B.; project administration, R.B.; funding acquisition, R.B. and V.R. All authors have read and agreed to the published version of the manuscript.

Funding

The work was performed according to the Government research assignment for ISPMS SB RAS, project FWRW-2021-0002.

Institutional Review Board Statement

Not applicable.

Informed Consent Statement

Not applicable.

Data Availability Statement

The data are available upon request.

Acknowledgments

Not applicable.

Conflicts of Interest

The authors declare no conflict of interest.

References

  1. Selvam, J.D.R.; Dinaharan, I.; Rai, R.S. Matrix and Reinforcement Materials for Metal Matrix Composites. In Encyclopedia of Materials: Composites, 1st ed.; Brabazon, D., Ed.; Elsevier Science Publishing Co Inc.: Amsterdam, The Netherlands, 2021; pp. 615–639. [Google Scholar]
  2. Panemangalore, D.B.; Shabadi, R. Microstructural Aspects of Metal-Matrix Composites. In Encyclopedia of Materials: Composites, 1st ed.; Brabazon, D., Ed.; Elsevier Science Publishing Co Inc.: Amsterdam, The Netherlands, 2021; pp. 274–297. [Google Scholar]
  3. Mertens, A.I. Metal Matrix Composites Processed by Laser Additive Manufacturing: Microstructure and Properties. Chapter 13. In Handbooks in Advanced Manufacturing, 1st ed.; Pou, J., Riveiro, A., Davim, J.P., Eds.; Elsevier: Amsterdam, The Netherlands, 2021; pp. 409–425. [Google Scholar]
  4. Kumar, J.; Singh, D.; Kalsi, N.S.; Sharma, S.; Pruncu, C.I.; Pimenov, D.Y.; Rao, K.V.; Kapłonek, W. Comparative study on the mechanical, tribological, morphological and structural properties of vortex casting processed, Al–SiC–Cr hybrid metal matrix composites for high strength wear-resistant applications: Fabrication and characterizations. J. Mater. Res. Technol. 2020, 9, 13607–13615. [Google Scholar] [CrossRef]
  5. Moktar, M.S.; Ghandvar, H.; Bakar, T.A.A. Development and Characterization of Aluminum Hybrid Metal Matrix Composites Used in Automotive Applications. In Encyclopedia of Renewable and Sustainable Materials, 1st ed.; Choudhury, I., Hashmi, S., Eds.; Elsevier: Amsterdam, The Netherlands, 2020; Volume 5, pp. 54–63. [Google Scholar]
  6. Samal, P.; Vundavilli, P.R.; Meher, A.; Mahapatra, M.M. Recent progress in aluminum metal matrix composites: A review on processing, mechanical and wear properties. J. Manuf. Process. 2020, 59, 131–152. [Google Scholar] [CrossRef]
  7. Ramanathan, A.; Krishnan, P.K.; Muraliraja, R. A review on the production of metal matrix composites through stir casting—Furnace design, properties, challenges, and research opportunities. J. Manuf. Process. 2019, 42, 213–245. [Google Scholar] [CrossRef]
  8. Al-Hamdani, K.S.; Murray, J.W.; Hussain, T.; Clare, A.T. Controlling ceramic-reinforcement distribution in laser cladding of MMCs. Surf. Coat. Technol. 2020, 381, 125128. [Google Scholar] [CrossRef]
  9. Wang, Q.; Shi, J.; Zhang, L.; Tsutsumi, S.; Feng, J.; Ma, N. Impacts of laser cladding residual stress and material properties of functionally graded layers on titanium alloy sheet. Addit. Manuf. 2020, 35, 101303. [Google Scholar] [CrossRef]
  10. Sankhla, A.M.; Patel, K.M.; Makhesana, M.A.; Giasin, K.; Pimenov, D.Y.; Wojciechowski, S.; Khanna, N. Effect of mixing method and particle size on hardness and compressive strength of aluminium based metal matrix composite prepared through powder metallurgy route. J. Mater. Res. Technol. 2022, 18, 282–292. [Google Scholar] [CrossRef]
  11. Sun, R.; Cao, Z.; Che, Z.; Zhang, H.; Zou, S.; Wu, J.; Guo, W. A combined experimental-numerical study of residual stress and its relaxation on laser shock peened SiC particle-reinforced 2009 aluminum metal matrix composites. Surf. Coat. Technol. 2022, 430, 127988. [Google Scholar] [CrossRef]
  12. Fomin, V.M.; Golyshev, A.A.; Kosarev, V.F.; Malikov, A.G.; Orishich, A.M.; Filippov, A.A. Deposition of Cermet Coatings on the Basis of Ti, Ni, WC, and B4C by Cold Gas Dynamic Spraying with Subsequent Laser Irradiation. Phys. Mesomech. 2020, 23, 291–300. [Google Scholar] [CrossRef]
  13. Suo, Y.; Wang, B.; Jia, P.; Gong, Y. Numerical analysis of mechanical properties and particle cracking probability of metal matrix composites. Mater. Today Commun. 2020, 24, 101082. [Google Scholar] [CrossRef]
  14. Wu, Q.; Xu, W.; Zhang, L. Microstructure-based modelling of fracture of particulate reinforced metal matrix composites. Compos. B Eng. 2019, 163, 384–392. [Google Scholar] [CrossRef]
  15. Balokhonov, R.R.; Romanova, V.A.; Schmauder, S.; Emelianova, E.S. A numerical study of plastic strain localization and fracture across multiple spatial scales in materials with metal-matrix composite coatings. Theor. Appl. Fract. Mech. 2019, 101, 342–355. [Google Scholar] [CrossRef]
  16. Balokhonov, R.; Romanova, V.; Kulkov, A. Microstructure-based analysis of deformation and fracture in metal-matrix composite materials. Eng. Fail Anal. 2020, 110, 104412. [Google Scholar] [CrossRef]
  17. Peng, P.; Gao, M.; Guo, E.; Kang, H.; Xie, H.; Chen, Z.; Wang, T. Deformation behavior and damage in B4Cp/6061Al composites: An actual 3D microstructure-based modeling. Mater. Sci. Eng. A 2020, 781, 139169. [Google Scholar] [CrossRef]
  18. Sun, Q.; Asqardoust, S.; Sarmah, A.; Jain, M.K. Elastoplastic analysis of AA7075-O aluminum sheet by hybrid micro-scale representative volume element modeling with really-distributed particles and in-situ SEM experimental testing. J. Mater. Sci. Technol. 2022, 123, 201–221. [Google Scholar] [CrossRef]
  19. Balokhonov, R.; Romanova, V.; Schwab, E.; Zemlianov, A.; Evtushenko, E. Computational Microstructure-Based Analysis of Residual Stress Evolution in Metal-Matrix Composite Materials during Thermomechanical Loading. Facta Univ. Mech. Eng. 2021, 19, 241–252. [Google Scholar] [CrossRef]
  20. Zhang, J.F.; Zhang, X.X.; Andrä, H.; Wang, Q.Z.; Xiao, B.L.; Ma, Z.Y. A fast numerical method of introducing the strengthening effect of residual stress and strain to tensile behavior of metal matrix composites. J. Mater. Sci. Technol. 2021, 87, 167–175. [Google Scholar] [CrossRef]
  21. González-Lezcano, R.A.; del Río-Campos, J.M.; Awad Parada, T. Influence of Thermal Residual Stresses on the Behaviour of Metal Matrix Composite Materials. Iran J. Sci. Technol. Trans. Mech. Eng. 2023. [Google Scholar] [CrossRef]
  22. Balokhonov, R.R.; Romanova, V.A.; Buyakova, S.P.; Kulkov, A.S.; Bakeev, R.A.; Evtushenko, E.P.; Zemlyanov, A.V. Deformation and Fracture Behavior of Particle-Reinforced Metal Matrix Composites and Coatings. Phys. Mesomech. 2022, 25, 492–504. [Google Scholar] [CrossRef]
  23. Shackelford, J.F.; Han, Y.-H.; Kim, S.; Kwon, S.-H. CRC Materials Science and Engineering Handbook, 4th ed.; CRC Press: Boca Raton, FL, USA, 2015; 634p. [Google Scholar]
  24. Domnich, V.; Reynaud, S.; Haber, R.A.; Chhowalla, M. Boron Carbide: Structure, Properties, and Stability under Stress. J. Am. Ceram. Soc. 2011, 94, 3605–3628. [Google Scholar] [CrossRef]
  25. Chang, R.; Graham, L.J. Low-Temperature Elastic Properties of ZrC and TiC. J. Appl. Phys. 1966, 37, 3778–3783. [Google Scholar] [CrossRef]
  26. ASM Handbook Committee. Properties of Wrought Aluminum and Aluminum Alloys. In ASM Handbook, Volume 2: Properties and Selection: Nonferrous Alloys and Special-Purpose Materials; ASM International: Almere, The Netherlands, 1990; pp. 62–122. [Google Scholar]
  27. Balasundaram, A.; Gokhale, A.M.; Graham, S.; Horstemeyer, M.F. Three-dimensional particle cracking damage development in an Al–Mg–base wrought alloy. Mater. Sci. Eng. A 2003, 355, 368–383. [Google Scholar] [CrossRef] [Green Version]
  28. Berasategi, J.; Gomez, A.; Bou-Ali, M.M.; Gutiérrez, J.; Barandiarán, J.M.; Beketov, I.V.; Safronov, A.P.; Kurlyandskaya, G.V. Fe nanoparticles produced by electric explosion of wire for new generation of magneto-rheological fluids. Smart Mater. Struct. 2018, 27, 045011. [Google Scholar] [CrossRef]
Figure 1. Experimental (a) and model structure of a metal-matrix composite (b) and corresponding 100 × 78 finite element voxel mesh (c).
Metals 13 00724 g001
Figure 2. Pressure patterns in the prefracture stage (a,d) and crack propagation under tension (b,c) and compression after cooling of the Al6061-WC composite (e,f). Video data files “Fig2Ten.avi” and “Fig2Com.avi” are available online in Supplementary Materials.
Metals 13 00724 g002
Figure 3. Aluminum (a), boron (b) and titanium carbide powders (c).
Metals 13 00724 g003
Figure 4. Fracture patterns under compression (a,b) or tension (c) or of the Al-TiC (a) and Al-B4C composites (b,c).
Metals 13 00724 g004
Figure 5. Mesh dependent final patterns of equivalent plastic strain in the Al6061T4 matrix and fractured regions in the B4C particle under tension or compression of the composite in the RS case.
Metals 13 00724 g005
Figure 6. Mesh dependent stress–strain curves of the Al6061T4-B4C composite (a) and homogenized stress at the fracture onset vs. the number of mesh cells in the X1-axis (b).
Metals 13 00724 g006
Figure 7. Stress–strain curves under tension (NRS) and tension after cooling of composites with different matrices and with a tungsten carbide particle (RS).
Metals 13 00724 g007
Figure 8. Stress–strain curves under cooling of composites with different matrices and under subsequent tension of the Al6061T4-WC composite (a). Homogenized accumulated equivalent plastic strain in the matrix of the Al6061T4-WC composite under cooling and subsequent tension (b).
Metals 13 00724 g008
Figure 9. Stress–strain patterns in the Al6061T4-WC composite for states A–C shown in Figure 7 and Figure 8.
Metals 13 00724 g009
Figure 10. Stage 1 of the stress–strain curves of composites. Initial sections of the stress–strain curves of Al6061T4-WC composite, Al6061T4 matrix and WC particle (a), and the composites with different matrix materials (b). States B, J and K are shown in Figure 7, Figure 8, Figure 9 and Figure 11.
Metals 13 00724 g010
Figure 11. Pressure patterns in the particle for states B, J and K shown in Figure 5.
Metals 13 00724 g011
Figure 12. Composite elongation at the fracture onset vs. matrix yield stress (a) and equivalent stress evolution in the TT-type region shown in Figure 1 and Figure 11 (b).
Metals 13 00724 g012
Figure 13. Patterns of fracture and plastic strain localization at composite strains (DI) shown in Figure 7.
Metals 13 00724 g013
Figure 14. Stress–strain curves under tension (NRS) and tension after cooling (RS) of the composites with different particle materials and an Al6061 matrix (a). Corresponding elongation of composites at the fracture onset vs. particle strength (b).
Metals 13 00724 g014
Figure 15. Patterns of equivalent plastic strain in the Al6061T4 matrix and fractured regions in the WC particle for the round (a), low-curvature (b) or high-curvature (c) particles.
Metals 13 00724 g015
Figure 16. Stress–strain curves of the composites shown in Figure 15 (a) and their initial sections (b).
Metals 13 00724 g016
Figure 17. Pressure patterns after cooling of the Al6061T4–WC composites with varying particle volume fractions corresponding to the states AB, AC and AD shown in Figure 18.
Metals 13 00724 g017
Figure 18. Initial sections of the stress–strain curves of the Al6061T4–WC composites with varying particle volume fractions (a), corresponding equivalent stresses averaged over the particle (b), elongation of the composites at the fracture onset vs. the particle volume fraction (c) and a comparison of the experimental and calculated cooling-induced equivalent stress averaged over the Al matrix depending on the B4C particle volume fraction (d).
Metals 13 00724 g018
Table 1. Thermomechanical properties of the matrix and particle materials.
Materialρ, g/cm3K, GPaµ, GPaσS, MPaσ0, MPaεpr, %Cten, MPaα, 10−6 °C−1
Matrices
Al2.76626823010-22
Al60612.76626125559.9-22
Al6061T42.766262311079.8-22
Particles
TiC4.9234185---2509.5
WC15.6370260---3705
B4C2.6235197---5004.5
Disclaimer/Publisher’s Note: The statements, opinions and data contained in all publications are solely those of the individual author(s) and contributor(s) and not of MDPI and/or the editor(s). MDPI and/or the editor(s) disclaim responsibility for any injury to people or property resulting from any ideas, methods, instructions or products referred to in the content.