Article

Effect of Preload on Tensile Fracture of Variable Cross-Section Bolts: Experiment and Simulation

1
Key Laboratory of Traffic Safety on Track, Ministry of Education, Central South University, Changsha 410075, China
2
Department of Transportation Engineering, Research Laboratory of Key Technology for Rail Traffic Safety, Changsha 410075, China
3
Department of Transportation Engineering, Engineering Research Center of Safety Technology for Rail Vehicle, Changsha 410075, China
*
Author to whom correspondence should be addressed.
Metals 2023, 13(4), 744; https://doi.org/10.3390/met13040744
Submission received: 3 March 2023 / Revised: 3 April 2023 / Accepted: 8 April 2023 / Published: 11 April 2023
(This article belongs to the Special Issue Fatigue Behavior in Metallic Materials)

Abstract

:
High-strength bolts are widely used in structural connections, and the preload affects the failure behavior of bolts. In this paper, a variable cross-section bolt (VCSB) with weakened strength to induce fracture is designed. Quasi-static tensile experiments with different preload torque values were performed on the VCSB. The preload torques of 0, 430, 610, and 820 N·m were applied to the VCSB connection structures before the test. The load–displacement curves obtained by the test could be divided into three stages: the initial elastic phase, the yield phase, and the rapidly necking phase. As the preload increased, the stiffness of the initial elastic phase increased from 101.21 kN/mm to 270.64 kN/mm and the fracture displacement DC decreased from 10.54 mm to 8.42 mm. Finite element models were developed to simulate the failure process of VCSB under tensile loads. The difference between the FB and DC values in the simulation results and the test is within 2%. The simulations were carried out by adjusting the prestress from 0 to 650 MPa. The results show that the value of preload force has no effect on the FB of VCSB, but greatly influences the DC and FC of the connection.

1. Introduction

Bolts are extensively used in transportation, construction fields, etc., especially in critical load transfer and connection structures. Coupler is an important connection device connected by bolts to the railway vehicle [1,2,3]. The Shibata-type coupler [4,5] is a common coupler type for high-speed trains and subways in China; which, is divided into four parts: connecting system, crushing device, buffer system, and overload protection as shown in Figure 1. The overload protection consists of four symmetrically distributed M20 × 185 bolts of grade 10.9. These bolts are used to connect the coupler mounting plate(vehicle) to the coupler that surrounds the plate(coupler) [5,6,7].
When a train collision occurs, the coupler with high strength and large stiffness would become a lever to jack up the vehicle, causing a climbing vehicle (Figure 2a) or zigzag derailment (Figure 2b) [8,9]. Therefore, it is necessary to set up an overload protection device based on the failure of the bolts to realize the timely detachment of the coupler from the vehicle; which, leads to the normal action of the energy-absorbing structure [10,11].
The failure mode of the tensile bolts is influenced by the material, basic geometry, and the connection parameters, as shown in Figure 3 [12]. Fransplass et al. [13] found that the percentage of the L t in L g is reduced which would cause the bolt failure transition from fracture to thread failure. Alexander [14] found that when the L t was shortened, thread stripping and necking, occurring close to the nut engagement area, were induced. The research [15] showed that bolt tensile failures could include thread slippage and necking fracture. The extensibility of thread slippage is poor and unstable, and the location where necking fracture is induced is uncertain. From the above study, it can be concluded that although the bolt can be fractured properly as much as possible by adjusting the length of L g and L t , the fracture is distributed in the threaded section. However, the fracture that occurred in the threaded section is unreliable for an organized and controlled trigger for the coupler overload protection device.
The geometric profile of the bolt needs to be adjusted to achieve the desired failure mode. In the design idea of train energy-absorbing structure, designers often impose induced deformation factors on the structure to control the expected deformation of the structure in order to achieve the ideal energy absorption effect [16], such as geometric gradient deformation or setting the strength weakening position [17,18]. Based on the idea of induced deformation, the tensile strength of the bolt in the unthreaded section of Lg is weakened appropriately. It is only necessary to make sure that the strength of the weakened section is less than the strength of the threaded section, allowing pure tensile fracture to occur before the failure of the threaded section. A bolt with weakened tensile strength is defined as a variable cross-section bolt (VCSB) in this paper.
There are various methods to study the mechanical properties of bolted joints; among which, experimental testing has always been the most intuitive and realistic. Researchers [19,20,21,22] have used special tools to test the tensile, shear, and fatigue strength of bolts on the testing machine. Finite element simulation is also an efficient research tool for studying the failure of bolts.
Finite element modeling (FEM) methods for bolted connections fall into several main categories: The simplest method is the boltless simulation (Table 1) which is called the spider web simplified model [23] because of its similarity to a spider web; it is commonly used to analyze the degrees of freedom and motion relationships in the bolt connection. Besides the simplified method, there are three types of solid methods. The first cylindrical model avoids fast computation due to mesh distortion caused by threads. Sun [24] and Xie [25] utilize this model where the nut is integral to the bolt. The results indicate that this model is very suitable for analyzing the axial force and deformation of the bolt. On the other hand, the threaded symmetric type and the fine model with thread angle are suitable for analyzing the mechanical properties of the threaded threads and the prestress decay of the bolt. For example, Andrew [26], Verma [27], Hu [28], and Yang [29] used two similar models to study the reduction of preload, contact creep, and thread failure; however, they have a huge number of meshes, complicated calculations, and are prone to mesh distortion. However, for preload torque simulation, Kim et al. [30] confirmed that all four models can simulate preload force with well-established element surface contact; among which, the threaded model has higher accuracy, and the coupled bolt–nut model has the best validity and utility.
The preload force is also an essential factor affecting the strength of the bolted joint structure and the fatigue or tensile failure of the bolts. Chang [31] found that a larger preload force during the elastic phase of bolt connection tension can increase the working resistance. Wulan [32] found that increasing the preload strengthens thread engagement and thus reduces the possibility of thread failure. Other than that, the study by Alexander [14] noted that initial bolt failure occurs when the bolt assembly is over-tightened, resulting in a weakened connection. These studies give the idea that adjusting the preload force value will increase the possibility of induced failure occurring in variable sections; which, is valuable for triggering overload protection stability studies.
In this paper, a variable cross-section bolt (VCSB) was designed for connection between the coupler and body of high-speed trains To integrate the VCSB connection function and the induced failure function of the VCSB, the performance of its overload protection application is investigated. In this paper, quasistatic uniaxial tensile tests of VCSB connections with and without preload were carried out to analyze their connection strength and failure behavior. A quasi-static uniaxial tensile finite element model of the VCSB connection was developed with respect to the test. The modeling process simplified the bolt geometry model, Incorporated the modified material necking failure curve and its material parameters, and calibrated the preload force application method for the prestressed section. The finite element model was used to investigate in depth the effect of preload force values on the connection function and induced failure function of VCSBs. The preload force value for VCSB connection adaptation was discussed.

2. Material and Experiments

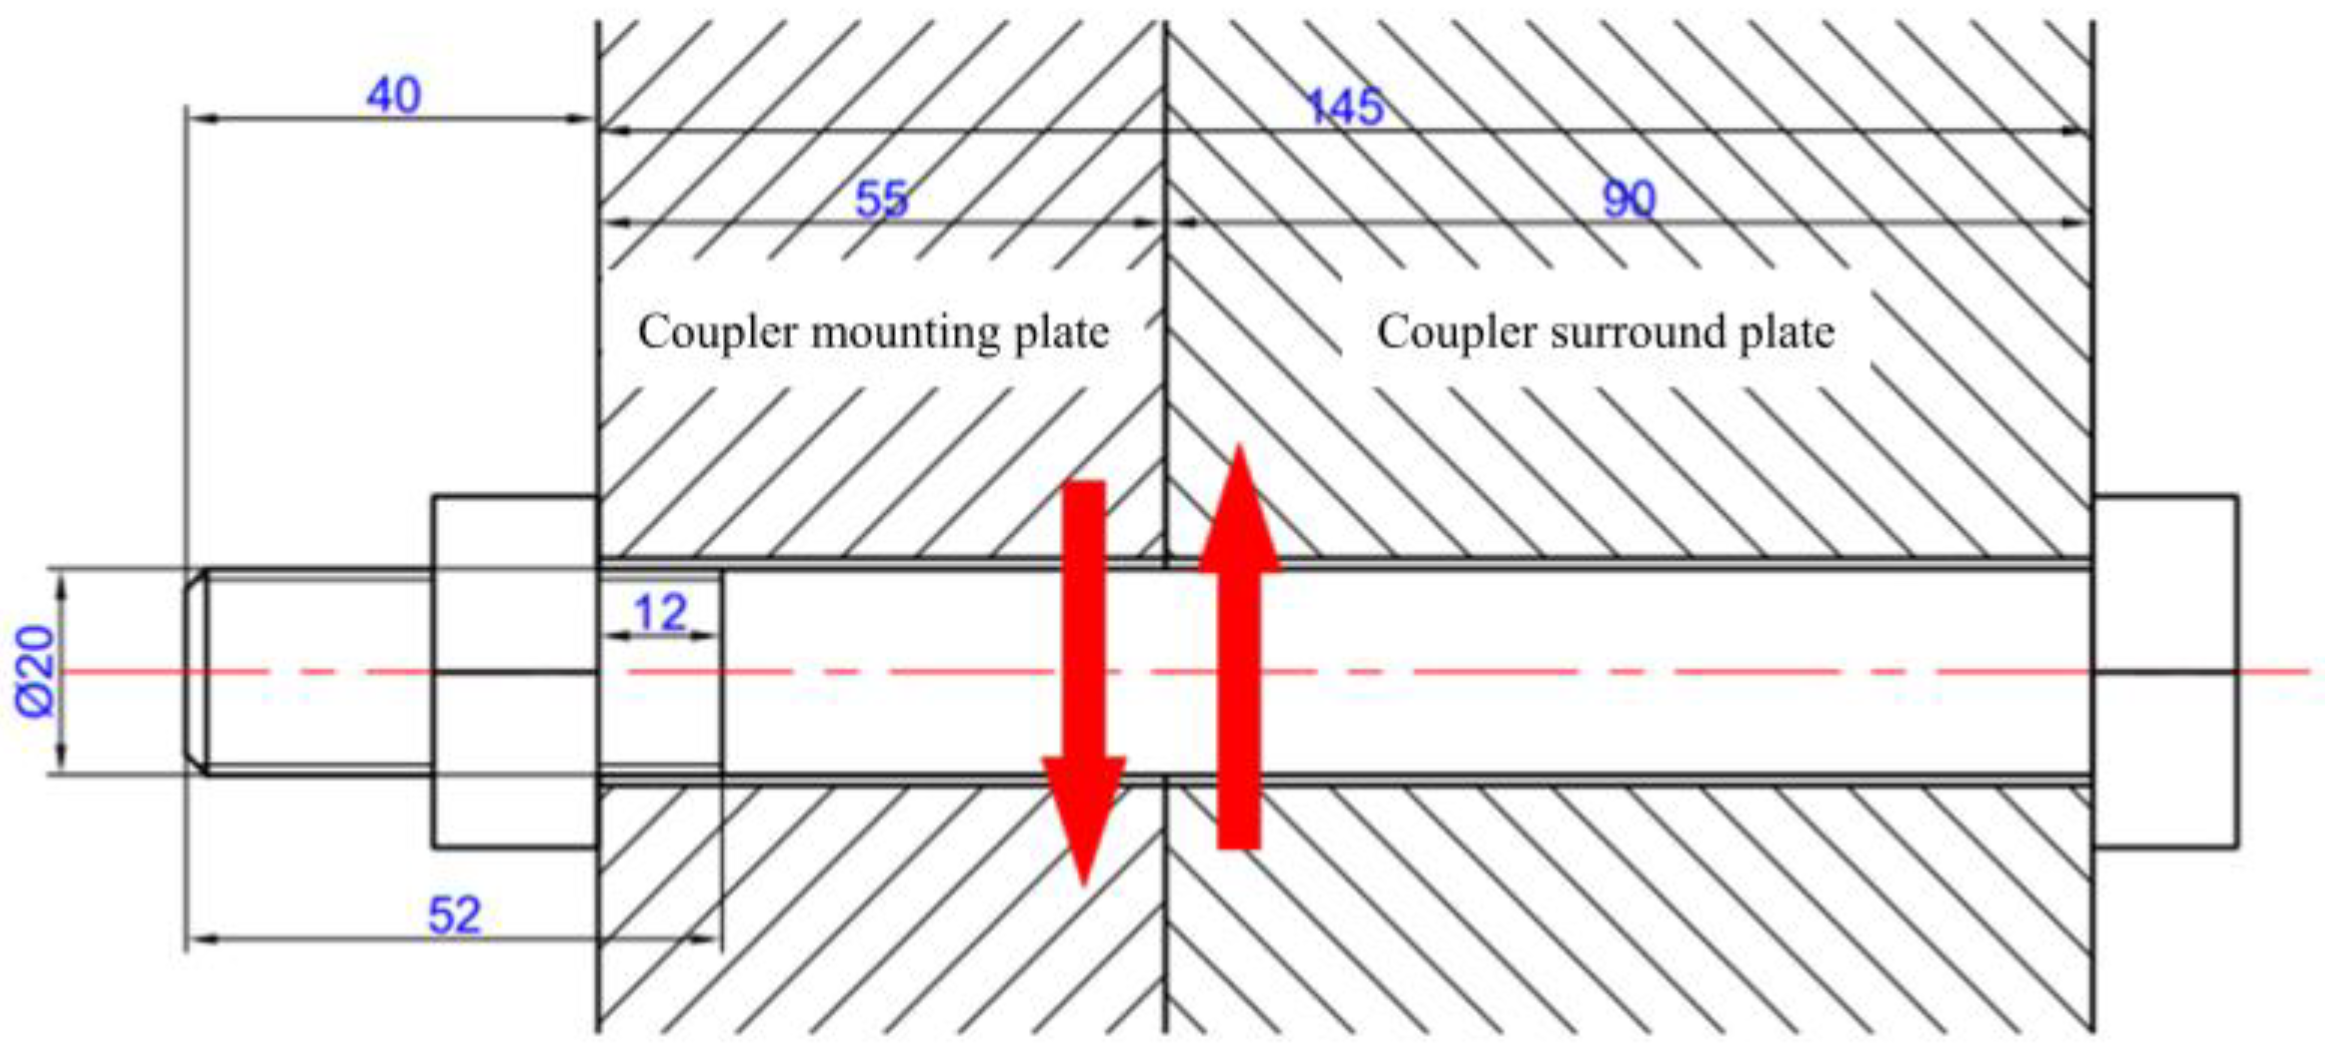
2.1. Design of VCSB Structure

Firstly, the location of the variable cross-section is determined. The ideal fracture failure location is the connected section between the coupler mounting plate (vehicle) and the coupler that surrounds the plate (coupler) as shown in Figure 4. As shown in Figure 5, the diameter of the unthreaded segment L c of the VCSB structure is reduced. The axial dimensions of the VCSB were designed as follows: L 1 = 80   mm , L 2 = 90   mm , L 3 = 50   mm , and L c = 15   mm . The nominal diameter of the original M20 connecting bolt was increased to 24 mm, and the diameter d c was reduced to 19 mm.
To prevent stress concentration, the transition section of the cross-section was designed as a rounded corner with a radius of 3 mm. The specification of the VCSB is the accuracy of class A. The specification of VCSB is a high-strength bolt of grade 10.9 with triangular thread, coarse tooth thread, and a pitch of 3 mm. The material of the VCSB is 40 Cr; the chemical composition is shown in Table 2. The length of the original M20 bolt handle section is 145 mm, and the length of the threaded section is 12 mm. Since the equivalent cross-sectional area of the threaded section is smaller than that of the unthreaded section, the length of the threaded section is reduced to 5 mm in order to minimize its effect on the axial tensile strength.

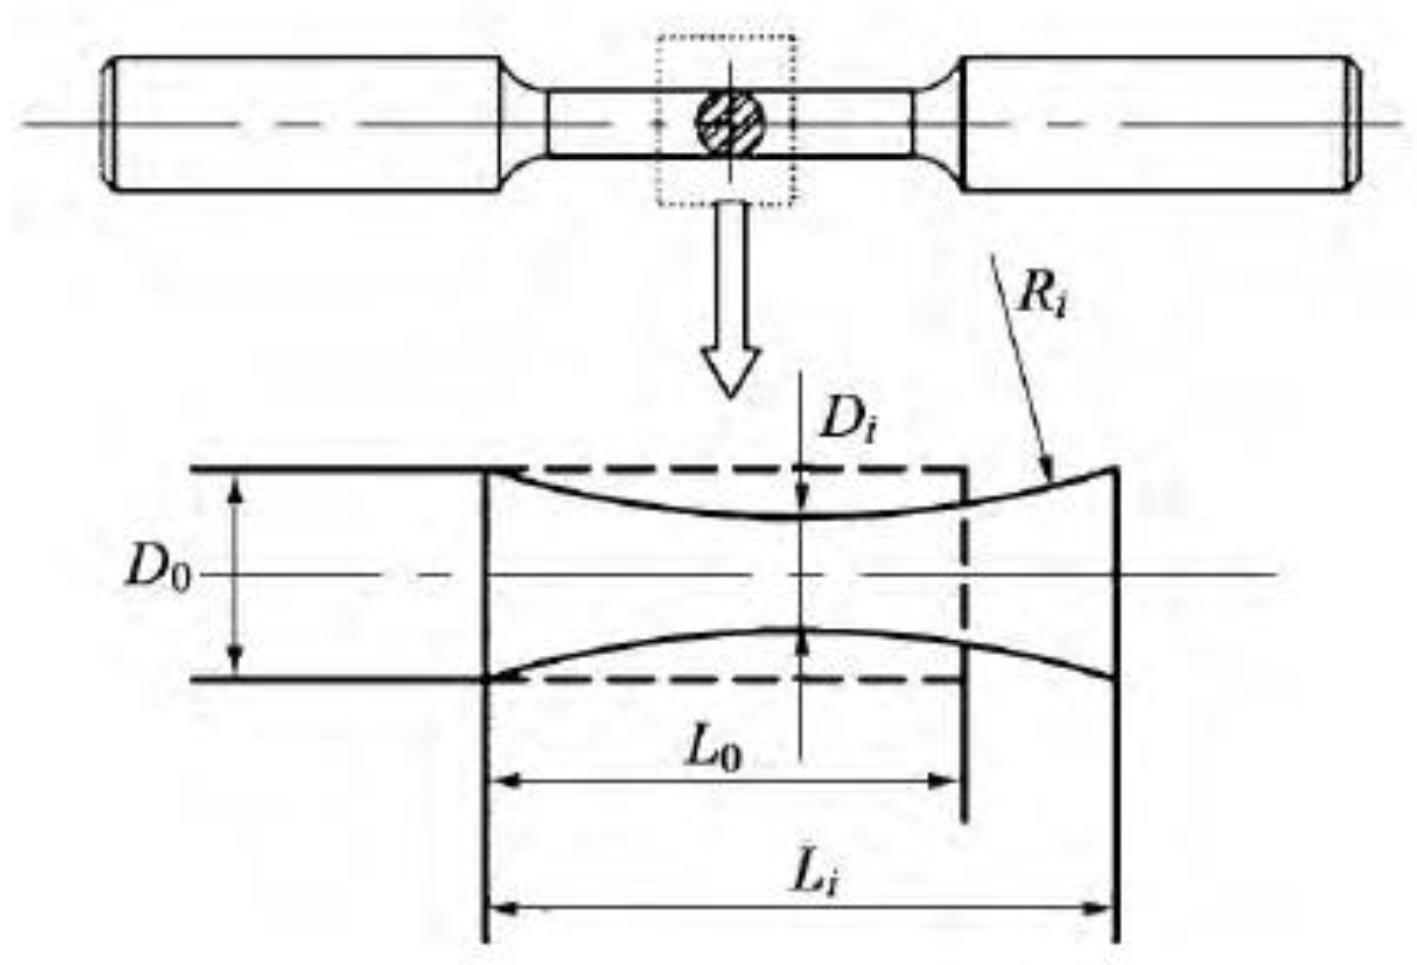
2.2. Uniaxial Tensile Test

The uniaxial tensile test is a basic method to test the mechanical properties of metal materials. Considering the influence of the manufacturing process, the VCSBs are processed into material tensile specimens. According to the requirements of the standard [33], the material test was carried out on the universal fatigue testing machine MTS (MTS Systems Inc, Eden Prairie, MN, USA). The test speed was 2 mm/min. In order to improve the reliability of the test, three groups of bar specimens were processed with the same batch of VCSBs to carry out tensile tests. The size of the specimens and tensile process are shown in Figure 6.

2.3. VCSB Connection Tensile Tests

The overload protection bolts are mainly subjected to tensile force under impact load. In order to achieve an orderly, controlled failure mode when the impact force exceeds the threshold value, it is essential to study the failure mechanism of VCBS under tensile load. In this work, quasi-static tensioning experiments on the VCSB connections were carried out.
The clamping tools connected by the VCSBs are divided into two parts, as displayed in Figure 7. One is designed as a sealed U-shape and the other one is a hollow T-shape. The connected length of 145 mm is consistent with the real bolted connection. In order to ensure that no plastic deformation occurs in the tooling during the experiment, the thickness is adjusted to 25 mm and 30 mm. The material of the tooling is steel grade 45.
As shown in Figure 8, the quasi-static tensile experiments were performed on the MTS-Landmark (High-Frequency Fatigue Machine); in which, the upper limit of tensile force was 500 kN. The loading speed was set to 5 mm/min. Before the test, the four VCSB connection structures were respectively applied to preload torques (TP) of 0, 430, 610, and 820 N·m using a torque wrench.

3. Computational Model

Mechanical studies of bolted joints tend to combine experimental results with efficient, accurate, and reproducible numerical simulations. With the application of finite element software, numerical simulation of bolted structures has been used in a full range of applications.

3.1. VCSB Connection FEM Development

The experimental results show that there is no significant plastic deformation of the threads, and the main deformation of the whole component is concentrated in the weakened variable section; hence, it is most suitable to reproduce the experimental results by using the cylindrical bolt modeling method. The nut and bolt head are hexahedral in the axial direction (Figure 9).
The simplified bolt model was combined with the clamping tooling to create a uniaxial quasi-static tensile finite element model of the VCSB connection, as shown in Figure 10. The solid elements were used for the remaining components except for the rigid wall fixed at the bottom where shell elements are used. The lower tooling was fixed to the rigid wall. Upward uniform displacement was applied at the nodes of the part of the upper tooling. The tooling and bolt were allowed to move only in the axial direction. The MAT24 material, an elastoplastic material with an arbitrary stress versus strain curve, was used to define the VCSB. The material models of the tooling and rigid wall were respectively defined by MAT3 and MAT20. The MAT3 is suited to model isotropic and kinematic hardening plasticity, and the MAT20 material is considered to belong to a rigid body. The automatic single-surface contact algorithm and the automatic surface-to-surface contact algorithm were applied for the self-contact of the VCSB connecting structures and the contact between the VCSB and the tooling, respectively.

3.2. Bolt Preload Simulation

The bolt preload was applied experimentally using a preload moment; which, depends on the friction between the inner and outer threads. In this work, a common stress section method was used to simulate preload torques; which, applies a pair of opposing stresses using two normal directions of a cross-section inside the bolt, as shown in Figure 11.
Converting the torque applied to the VCSB connection using a torque wrench, in the experiment, to the stress on the section inside the bolt requires conversion, as shown in Equation (1).
T 0 = K × F 0 × d
where, the F 0 is bolt preload force and T 0 is the preload torque, K is the tightening torque coefficient, which is a dimensionless number, and d is the nominal diameter of the thread.
Among them, the value of tightening coefficient K is determined by many factors, and the value of K is set to as 0.24. The corresponding prestress value in Table 3 could be calculated by bringing the preload torque into Equation (1).

3.3. Correction of Fracture Criterion

The element or integral point are removed from the structure without affecting the force of the whole structure given the element failure in LS-DYNA. The effective plastic strain criterion (EPS) is a commonly used criterion in finite element simulations of ductile metal fracture [34]. According to this criterion, the material fails when the effective plastic strain reaches a critical value ε ¯ c r ; which, can be measured by uniaxial tensile testing of the material. In the axial tensile fracture test finite element model, the EPS failure criterion is set.

4. Results and Discussion

4.1. Results

4.1.1. Result of the Uniaxial Tensile Test

The curve measured by the test was the engineering stress and strain of the material; which, does not take into account the changes in specimen size and necking. In order to obtain the real stress–strain curve, it is necessary to deal with the engineering stress–strain curve [35,36]. Assuming that the volume of the test process is constant, the calculation formula of the real stress–strain curve is as follows:
{ σ = F A ε = l l 0 l 0
σ t = σ ( 1 + ε )
ε t = ln ( 1 + ε )
where, σ is the engineering stress, ε is the engineering strain, F is the tensile load, A is the original cross-sectional area of the standard distance section of the sample, l 0 is the original length of the standard distance section of the sample, l is the length after the extension of the standard distance section of the sample, σ t is the true stress, and ε t is the true strain.
The average value of the three tests’ data was taken to draw the stress–strain curves (Figure 12). Combined with the known material parameters and tensile test results of variable cross-section bolts, the material properties of bolts were shown in Table 4.
This method is only applicable to the deformation of the specimen before necking. It is impossible to detect the radius of the necking section at each moment on the tensile testing machine; hence, it is difficult to obtain the true stress–strain curve of the material after the necking section [37,38]. To correct the curve after necking, Wang S.H. [39] assumes that the deformation profile of the necking is a circular arc (Figure 13), and the volume of plastic deformation is constant. In Figure 13, D I is the minimum diameter of the necking segment, I is the radius of the arc, and L i is the necking length at each moment after the necking occurs. According to the principle of constant volume, the corrected stress–strain curve can be obtained from Equations (5) and (6).
σ t = F A = 4 F π D i 2
ε t = ln A A i = 2 ln D D i
where, D is the original diameter of the necking section. At the initial moment when necking occurs, the diameter of the necked segment is D 0 , then the initial length L 0 of the necking segment is calculated by Equation (7).
L 0 = Δ L i ( 2 D 0 2 + D i 2 ) D 0 2 D i 2
where, Δ L i is the displacement of stretching at each moment after the necking occurs and is the amount of displacement change observed in the test. Transforming Equation (7) obtains an expression for the minimum diameter of the necking segment at each moment (Equation (8)).
D i = 3 D 0 2 L 0 L 0 + Δ L i 2 D 0 2
By substituting the expression of D i into Equations (5) and (6), the corrected stress–strain curve is obtained after the point M (necking occurs). The complete, true stress–strain curve is obtained by filling the curve after the point M′ with the corrected data (Figure 12).
The corrected stress–strain curves were then then taken into the simulation of the VCSB fracture under tensile load. The corrected stress–strain curves were verified by VCSB connection tensile tests.

4.1.2. Result of the VCSB Connection Tensile Tests

The obtained load–displacement curves had the same variation trend as shown in Figure 14. Each curve was roughly divided into three stages: the elastic deformation segment with the initial elastic phase (OA), the yield phase (AB), and the rapidly necking phase (BC). There were three distinct transition points on these curves: A, point of plastic deformation starting; B, maximum strength point; C, bolt fracture point. It is worth noting that the Test 1 curve was preceded by a slow rise in an OA phase due to a gap between the VCSB and tooling before the uniaxial quasi-static tensile test.
The displacement generated at each stage and the tensile force value at the turning point were compared with the different preload torques, respectively, as shown in Figure 15. The applied preload torque caused the overall displacement of the VCSB to reduce, indicating that the VCSB fractured more quickly. The maximum tensile force did not change; however, the force at the fracture point increased. With the increase of the preload torque, the overall displacement of the VCSB slowly decreased and the maximum tension remained at a similar level. The increase of preload torque mainly changed the displacement and tensile force of the OA phase. It is obvious that the value of the preload has a significant effect on the initial elastic stiffness, as shown in Figure 16. The bolt structure applied with the preload will have been subjected to a certain torque before the test; therefore, creating an initial stress change within the structure. As the preload increases, this change becomes more pronounced. During the initial stage of bolt tension, the increase in preload causes a reduction in the elastic stage; thus, leading to the rise of stiffness.
Figure 17 described the state of the VCSB deformation and the induced failure fracture opening for Tests 1–4. As can be seen from Figure 16, in the group with preload, the fracture opening is partially tilted but overall flat; however, the fracture of the group without preload had more burrs and showed tearing strips. The relationship between the minimum diameter of the fractured section, the shrinkage of the section, and the preload was shown in Figure 18. The diameter of the bolt-induced fracture got smaller as the experimental preload torque increased.

4.2. Discussion

4.2.1. The Effect of Mesh Size on the Fracture-Effective Plastic Strain

The six FEMs with different mesh sizes were created for tensile simulation (Table 5). The results show that the fracture-effective plastic strain (F-EPS) value increases with the decrease of the mesh size. As shown in Figure 19, when the mesh size was less than 3 mm, the decrease of F-EPS tended to be stable. Too small mesh would increase the calculation time and complexity; however, it was not effective in improving the accuracy of the calculation, so the mesh with 3 mm was selected to discretize the simplified model of VCSB.

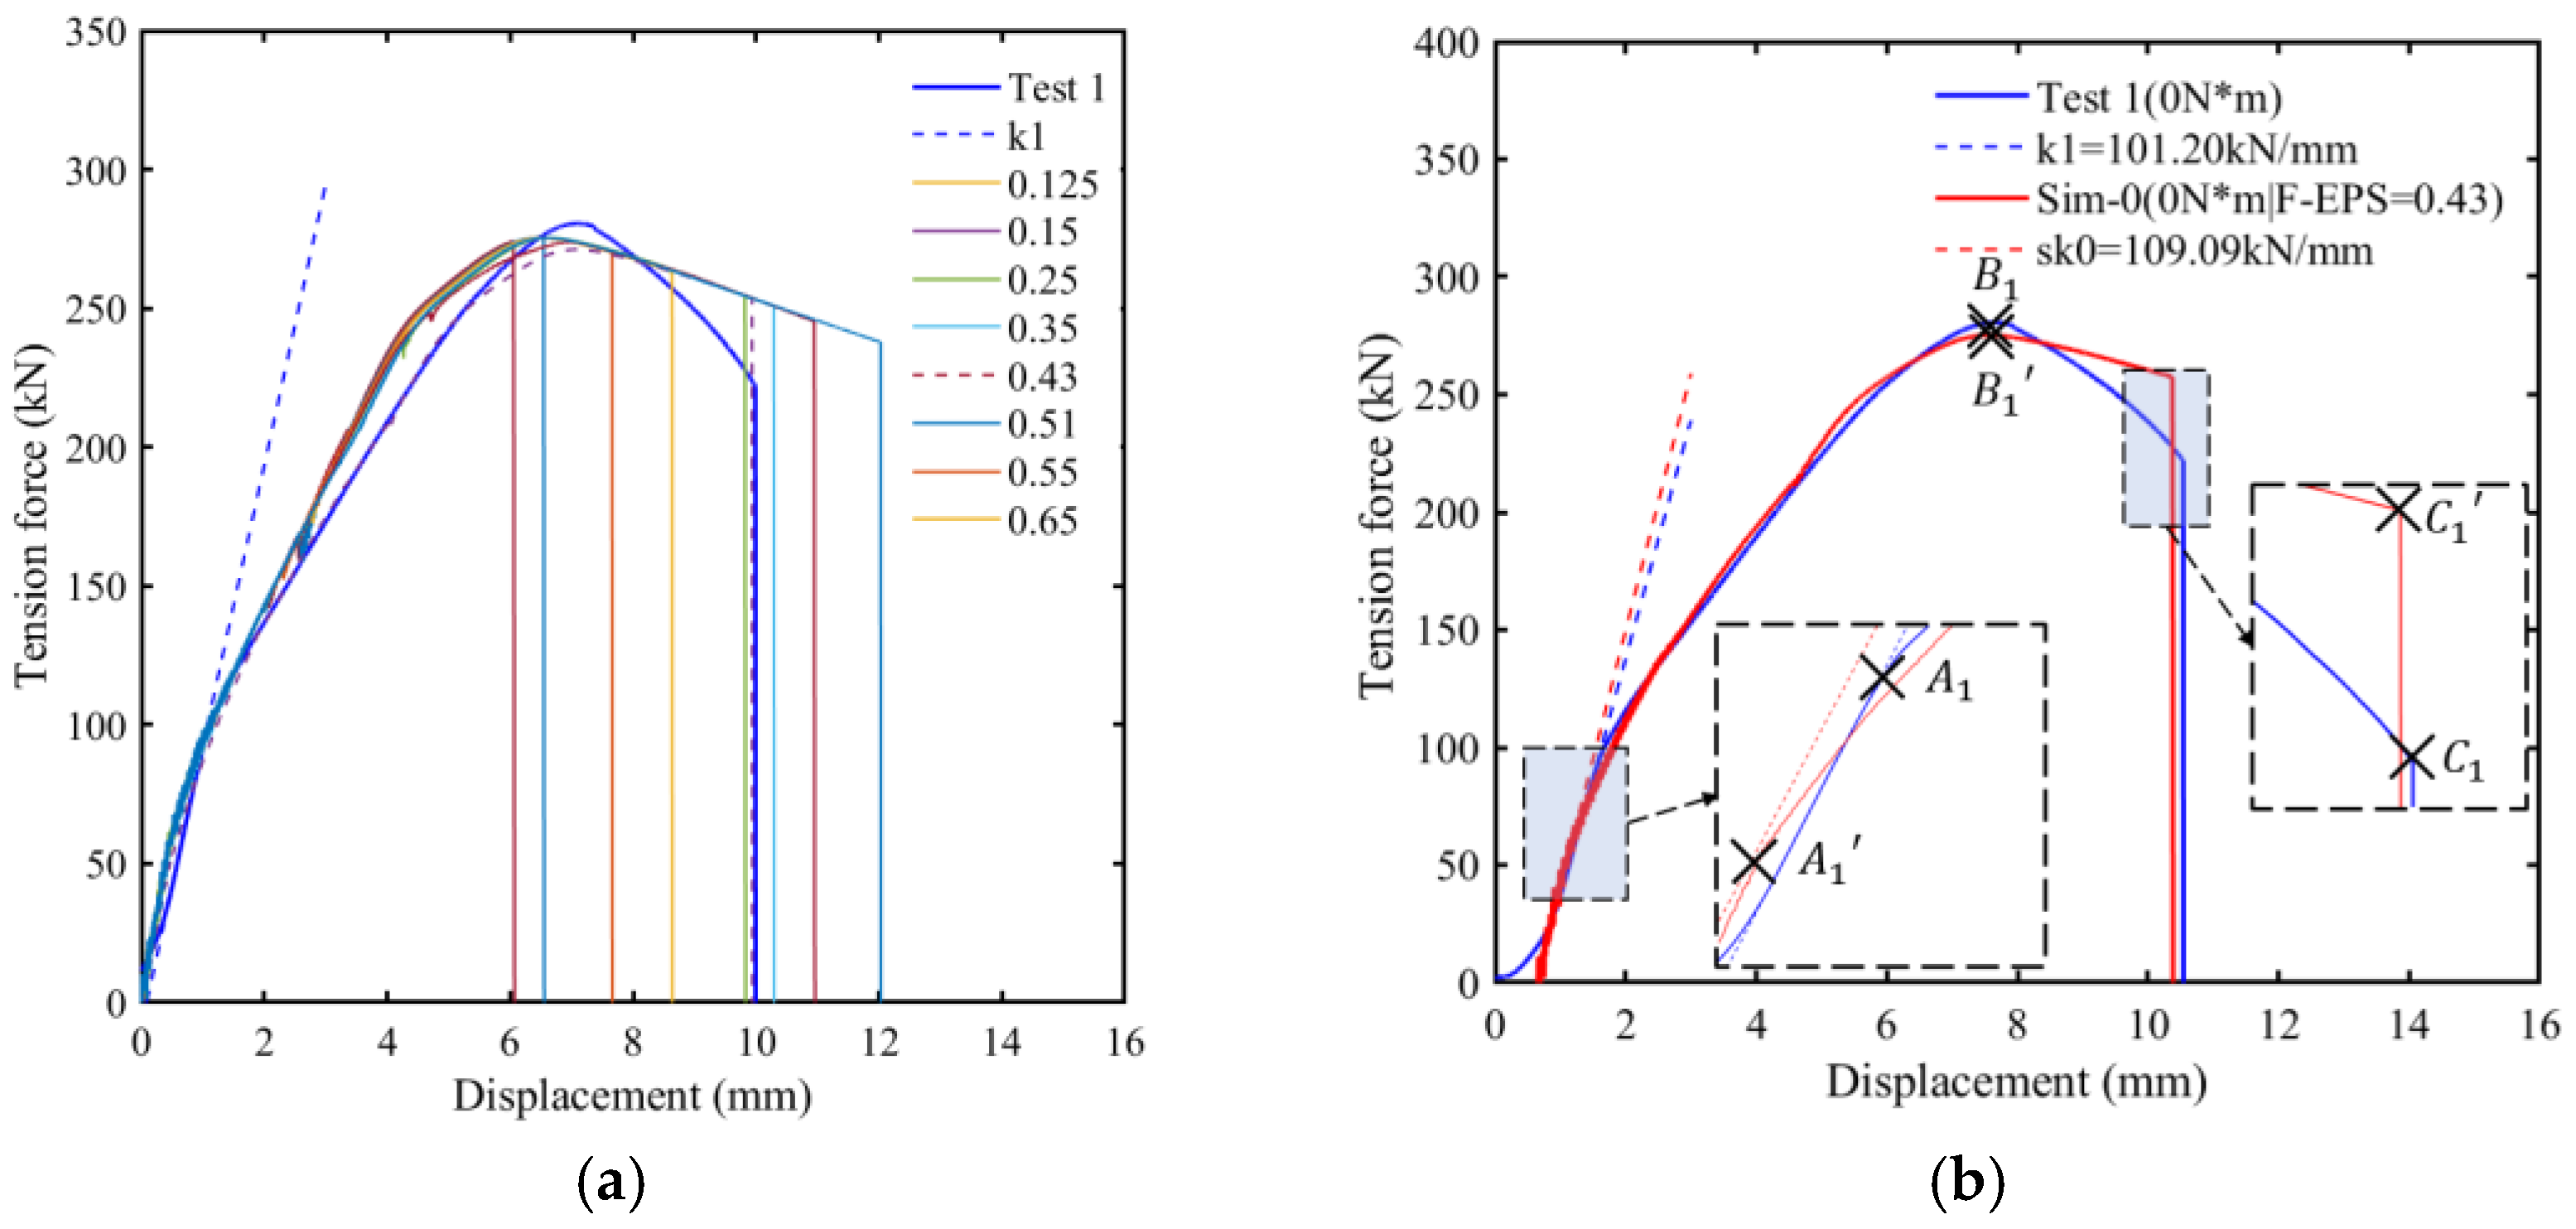
4.2.2. The Fracture Analysis of the VCSB without Preload

The proposed finite element model was used to predict the loading curve and characteristics of the VCSB connection under a quasi-static tensile state without preload. The values of F-EPS in the necking-corrected, true stress–strain curves ranged from 0.125 to 0.65; similarly, this series’ values of F-EPS were substituted into the FEM, of which the resulting curves are shown in Figure 20.
It can be seen that the predicted values of the proposed FEM when the value of F-EPS was 0.43 were in good agreement with the test results. Therefore, the critical effective plastic strain ε ¯ c r = 0 . 43 was used to construct the FEM of the VCSB with preload torque 0 N·m under tensile load (FEM-0). The loading curve of FEM-0 is also divided into three stages with the transition points as shown in Figure 20b. The yield of the FEM-0 appears slightly earlier than that of Test 1, and the maximum tensile force FB is also slightly smaller in Table 6.
The maximum error between the simulation and the test at the fracture point C’s force value is shown in Figure 21. The presence of larger errors in the tensile force of point C does not affect the reasonableness of the FEM results. The special value is to be expected because the FEM material failure criterion cannot model the crack generation process between elements and can only use element disappearance to mimic possible crack paths. Necking in the experiments occurs sharply because microcrack extension has already occurred within the material. However, the cracking is unlikely to occur in FEM, so after point B, the tension is slowly downloaded, and cracking occurs instantaneously when the element fails.
The effective stress contour plots of transition points are displayed in Figure 22. It can be speculated that the induced failure section dominates the whole tensile fractured process, and the stress in this part was always leading. When point C was reached, there was an obvious shrinkage of the variable section. When a critical fault occurs in the element, it disappears immediately to indicate the moment of fracture in Figure 22d. Except for the simplified thread part, the pieced-together VSCB model after fracture is obtained to show a high degree of agreement with the contour plots at point C (Figure 23).
The minimum diameter d c variation of the induced failure variable section was shown in Figure 24. Three transition points were found on the variation curve, and it was presumed that the necking shrinkage appeared in the yielding stage and was most intense in the BC section. The d c after the fracture occurs was 15.34 mm in the FEM-0, and the relative error with Test 1 is 9.96%; where, the relative error was due to the presence of the necking in the experiment (Table 7).

4.2.3. The Fracture Analysis of the VCSBs with Preload

The predicted results from the proposed FEM are compared with the experimental results in the VCSB connection tensile with preload, as shown in Figure 25a–c, when the value of F-EPS was 0.43. It can be seen that the predicted values of the proposed FEM are in good agreement with the test results. The loading curve of the prediction FEM also shows a three-stage trend consistent with the test, is very accurate in predicting the stiffness in the initial stage, and also simulates the phenomenon that the stiffness rises slowly with the increase of the preload value (Figure 25d). The same defect is that the tensile force at the fracture point C predicted by the FEM model is generally too large; which, is consistent with the simulation results without preload in Table 8.
The variation trend of effective stress contour plots obtained by three numerical simulations were roughly repeated, and the FEM-180 group is analyzed separately in Figure 26. At the point A 2 , stress concentration and necking occur in the variable cross-section section. When the point B 2 is reached, the stress concentration occurs in the variable cross-section section and where both ends are connected to the nut and head. The necking phenomenon has already appeared in the variable cross-section section before the arrival of the fracture point C 2 . The effective stress contour plots at the moment of bolt fracture in FEM-180, FEM-255, FEM-343, and the reassembled bolt after fracture are shown in Figure 27. The curve of the minimum section diameter d c at the variable cross-section of the VCSB with tensile displacement is shown in Figure 28.
Another reference to prove that the proposed model can truly predict tensile experiments is the variation and comparison of the minimum diameter d c in the induced tensile section. In the three simulations, the trend of the d c curve shows a high degree of consistency in Figure 28. The three transition points can clearly distinguish the elastic, plastic, and rapid necking stages; which, proves the reliability of the material characteristic curve from the side. Because the compressed element cannot be simulated in the finite element software, the shrinkage rate of the FEM is smaller than that of the test in Figure 29.

4.2.4. The Effect of Preload on the Fracture of the VCSB

According to the above comparison and verification analysis, it can be concluded that the proposed FEM has a high degree of overlap with the loading curve under the quasi-static tension of the VCSB connection. In particular, the numerical simulation of stiffness in the initial elastic stage, maximum tensile force, and fracture displacement is very consistent, and the relative error between the numerical simulation and the corresponding test is controlled within 7%. Combined with the requirements for the characteristics of the overload protection broken in the introduction, FEM can predict the numerical characteristics of the overload protection, including the fracture displacement. Therefore, this accurate prediction model can be used to study the appropriate preload value of such VCSB connections.
The material tensile test results showed that the yield strength of the material of the VCSB is 835.27 Mpa. In order to control the initial prestress within the elastic range, therefore, the simulations were carried out by adjusting the prestress from 0 to 650 MPa, and the loading curves are shown in Figure 30. Table 9 records the failure parameters of the VCSB connection structure under the tensile load. The influence of preload on the maximum tension FB and failure tension FC can be ignored, as shown in Figure 31a. Meanwhile, the fracture displacement is inversely proportional to the prestress value, and the initial stage stiffness is directly proportional to the prestress value, as shown in Figure 31b.
When multiple bolts are used in a connection, the preload force of each bolt will be influenced by the order in which the preload force is applied, and the preload force value of each bolted connection will show some degree of decay. If the stable disconnection of multiple VCSB connections is to be maintained, i.e., while ensuring the strength of the connection, it is necessary to minimize the effect of the preload on the FB and DC values. The range of oscillations of FB and DC values is minimized so that the loading conditions for their fracture failure are as uniform as possible. By observing the relevant parameters obtained, the oscillation range of the values of DC and FC is at a minimum when the zone prestress is in the range of 350–450 MPa. The values of preload torque corresponding to this interval are 912 N·m–1172 N·m.

5. Conclusions

In this paper, the axial connection strength and failure behavior of the M20 variable cross-section bolt are investigated by experiments and numerical simulations. The response curves and fracture failure behavior of the VCSB connections are discussed. With reference to the experimental performance variability of VCSB connection with and without preload, the effect of preload on the tension is analyzed using finite element numerical simulation; which, focused on the variation of the values of FB and DC, the key evaluation indicators of the coupler overload protection characteristics. The following conclusions were obtained from the discussion.
(1) The test result showed that the connection strength and fracture failure behavior of the VCSB connection’s axial tension designed in this paper are determined by the geometry at the variable cross-section, and the plastic deformation in the tension of the connection is also dominated by the necking phenomenon of the variable cross-section. Therefore, the induced failure design of bolts can be applied in the design of the coupler overload protection connections with triggering.
(2) In the test, four preload torques were applied to the VCSB connection, and the stiffness of the initial elastic phase of the loading curve was obtained to increase from 101.21 kN/mm to 270.64 kN/mm, the maximum tensile force remained near 280 kN, and the fracture displacement DC decreased from 10.54 mm to 8.42 mm. This indicates that the preload increases the stiffness of the bolted connection; which, has an effect on the coupler overload protection characteristics.
(3) Detailed comparison and analysis of the experimental and simulative results show that the FEM of the VCSB joint established in this paper can be used to realistically describe the mechanical response curve of the quasi-static axial tension of the VCSB connection. It can also be demonstrated that the EPS failure criterion can be used to simplify the tensile failure simulation of the VCSB model. In this simulation, the mesh size is 3 mm and the critical F-EPS is obtained from the analysis as 0.43. The difference between the FB and DC values in the simulation results and the test is within 2%; hence, the simulation model is used to investigate the effect of preload force on the overload protection performance.
(4) It is concluded that the value of preload force has no effect on the FB of VCSB; however, has a great influence on the DC and FC of the connection. With comprehensive reference to the requirements of overload protection characteristics, the pretension torque of 912 N·m–1172 N·m for this kind of coupler overload protection connection bolt (VCSB) is finally selected.
VCSBs failure could perfectly achieve overload protection; however, the threshold of failure requires further investigation. The threshold of overload protection determines the safety of this solution. In this paper, only a single bolt has been studied; when multiple bolts interact together, these effects are the focus of further research.

Author Contributions

Conceptualization, S.Y.; methodology, S.Y.; software, M.Z.; validation, M.Z.; formal analysis, M.Z.; investigation, M.Z.; resources, S.Y.; data curation, M.Z.; writing—original draft preparation, M.Z.; writing—review and editing, M.Z.; visualization, M.Z.; supervision, S.Y.; project administration, S.Y.; funding acquisition, S.Y. All authors have read and agreed to the published version of the manuscript.

Funding

This research was funded by the National Key Research and Development Program of China, grant number [2021YFB3703801] and the Natural Science Foundation of Hunan Province, grant number [No. 2021JJ30853].

Data Availability Statement

The data presented in this study are available upon request.

Conflicts of Interest

The authors declare no conflict of interest.

References

  1. Spiryagin, M.; Cole, C.; Sun, Y.Q.; McClanachan, M.; Spiryagin, V.; McSweeney, T. Design and Simulation of Rail Vehicles; CRC Press: Boca Raton, FL, USA, 2014. [Google Scholar]
  2. Zhang, W. Dynamic modeling of coupled systems in the high-speed train. In Dynamics of Coupled Systems in High-Speed Railways; Elsevier: Amsterdam, The Netherlands, 2020; pp. 55–181. [Google Scholar] [CrossRef]
  3. Zhu, T.; Yang, B.-Z.; Yang, C.; Xiao, S.-N.; Yang, G.-W.; Yang, B. The mechanism for the coupler and draft gear and its influence on safety during a train collision. Veh. Syst. Dyn. 2018, 56, 1375–1393. [Google Scholar] [CrossRef]
  4. Li, C.; Zhang, Y.; Yuan, X. Comparative study on automatic coupler overload protection device of metro vehicle. Urban Mass Transit 2016, 19, 123–126. [Google Scholar] [CrossRef]
  5. Xu, B.S.; Ren, G.S. Analysis and simulation for hydraulic system of test bench of coupler draft gear. J. Syst. Simul. 2012, 24, 2545–2549. [Google Scholar] [CrossRef]
  6. Xie, S.; Du, X.; Zhou, H.; Wang, D.; Feng, Z. Analysis of the crashworthiness design and collision dynamics of a subway train. Proc. Inst. Mech. Eng. Part F J. Rail Rapid Transit 2020, 234, 1117–1128. [Google Scholar] [CrossRef]
  7. Yao, S.; Zhu, H.; Yan, K.; Liu, M.; Xu, P. The derailment behaviour and mechanism of a subway train under frontal oblique collisions. Int. J. Crashworthiness 2021, 26, 133–146. [Google Scholar] [CrossRef]
  8. Wang, S.; Peng, Y.; Wang, T.; Chen, X.; Hou, L.; Zhang, H. The origami inspired optimization design to improve the crashworthiness of a multi-cell thin-walled structure for high speed train. Int. J. Mech. Sci. 2019, 159, 345–358. [Google Scholar] [CrossRef]
  9. Xu, Z.; Ma, W.; Wu, Q.; Luo, S. Coupler rotation behaviour and its effect on heavy haul trains. Veh. Syst. Dyn. 2013, 51, 1818–1838. [Google Scholar] [CrossRef]
  10. Yao, S.; Zhang, P.; Kong, L.; Jiang, S.; Xu, P. Optimization design of the coupler overload protection component: Numerical simulation and experimental validation. Int. J. Crashworthiness 2022, 20, 1–15. [Google Scholar] [CrossRef]
  11. Guan, W.; Gao, G.; Yu, Y. Experimental and numerical investigations of the plastic response and fracturing of an aluminum-plated structure with transition circular arcs subjected to impact loading. Thin-Walled Struct. 2018, 132, 642–657. [Google Scholar] [CrossRef]
  12. Grimsmo, E.L.; Aalberg, A.; Langseth, M.; Clausen, A.H. Failure modes of bolt and nut assemblies under tensile loading. J. Constr. Steel Res. 2016, 126, 15–25. [Google Scholar] [CrossRef]
  13. Fransplass, H.; Langseth, M.; Hopperstad, O. Numerical study of the tensile behaviour of threaded steel fasteners at elevated rates of strain. Int. J. Impact Eng. 2013, 54, 19–30. [Google Scholar] [CrossRef]
  14. Alexander, E.M. Analysis and design of threaded assemblies. SAE Trans. 1977, 86, 1838–1852. [Google Scholar]
  15. Ge, J.L.; Wang, Y.Z.; Hao, J.W.; Yang, G.L. Finite element modeling and modal analysis of bolted joints. In Applied Mechanics and Materials; Trans Tech Publications Ltd.: Bäch, Switzerland, 2012; Volume 105, pp. 92–95. [Google Scholar]
  16. Grujicic, M.; Pandurangan, B.; He, T.; Cheeseman, B.; Yen, C.-F.; Randow, C. Computational investigation of impact energy absorption capability of polyurea coatings via deformationinduced glass transition. Mater. Sci. Eng. A 2010, 527, 7741–7751. [Google Scholar] [CrossRef]
  17. Li, Z.; Rakheja, S.; Shangguan, W.-B. Crushing behavior and crashworthiness optimization of multi-cell square tubes under multiple loading angles. Proc. Inst. Mech. Eng. Part D J. Automob. Eng. 2020, 234, 1497–1511. [Google Scholar] [CrossRef]
  18. Li, Z.; Rakheja, S.; Shangguan, W.-B. Study on crushing behaviors of foam-filled thinwalled square tubes with different types and number of initiators under multiple angle loads. Thin-Walled Struct. 2019, 145, 106376. [Google Scholar] [CrossRef]
  19. Wagner, T.; Heimbs, S.; Burger, U. A simplified and semi-analytical bolted joint model for crash and impact simulations of composite structures. Compos. Struct. 2020, 233, 111628. [Google Scholar] [CrossRef]
  20. Grimsmo, E.L.; Clausen, A.H.; Langseth, M.; Aalberg, A. An experimental study of static and dynamic behaviour of bolted end-plate joints of steel. Int. J. Impact Eng. 2015, 85, 132–145. [Google Scholar] [CrossRef] [Green Version]
  21. Luyun, C.; Leixin, L.; Wei, X.; Xiaokun, Q.; Huaming, W.; Lin, C. Bolted connected optimization of composite-to-aluminium structure based on vibro-acoustic control: Numerical simulation and experimental. Appl. Acoust. 2021, 175, 107770. [Google Scholar] [CrossRef]
  22. Guo, Z.; Li, Z.; Zhu, H.; Cui, J.; Li, D.; Li, Y.; Luan, Y. Numerical simulation of bolted joint composite laminates under low-velocity impact. Mater. Today Commun. 2020, 23, 100891. [Google Scholar] [CrossRef]
  23. Verwaerde, R.; Guidault, P.-A.; Boucard, P.-A. A nonlinear finite element connector for the simulation of bolted assemblies. Comput. Mech. 2020, 65, 1531–1548. [Google Scholar] [CrossRef]
  24. Sun, Q.; Yuan, B.; Mu, X.; Sun, W. Bolt preload measurement based on the acoustoelastic effect using smart piezoelectric bolt. Smart Mater. Struct. 2019, 28, 055005. [Google Scholar] [CrossRef]
  25. Xie, Y.; Xiao, Y.; Lv, J.; Zhang, Z.; Zhou, Y.; Xue, Y. Influence of creep on preload relaxation of bolted composite joints: Modeling and numerical simulation. Compos. Struct. 2020, 245, 112332. [Google Scholar] [CrossRef]
  26. Klok, A.J.V. Mechanical Behavior of Bolted Joints under Impact Rates of Loading. Master’s Thesis, Michigan State University, East Lansing, MI, USA, 2012. [Google Scholar]
  27. Verma, S.; Jiang, Z.; Vedvik, N.P.; Gao, Z.; Ren, Z. Impact assessment of a wind turbine blade root during an offshore mating process. Eng. Struct. 2019, 180, 205–222. [Google Scholar] [CrossRef]
  28. Hu, J.; Zhang, K.; Cheng, H.; Qi, Z. An experimental investigation on interfacial behavior and preload response of composite bolted interference-fit joints under assembly and thermal conditions. Aerosp. Sci. Technol. 2020, 103, 105917. [Google Scholar] [CrossRef]
  29. Yang, F.; Veljkovic, M.; Liu, Y. Fracture simulation of partially threaded bolts under tensile loading. Eng. Struct. 2021, 226, 111373. [Google Scholar] [CrossRef]
  30. Kim, J.; Yoon, J.-C.; Kang, B.-S. Finite element analysis and modeling of structure with bolted joints. Appl. Math. Model. 2007, 31, 895–911. [Google Scholar] [CrossRef]
  31. Chang, J.; He, K.; Pang, D.; Li, D.; Li, C.; Sun, B. Influence of anchorage length and pretension on the working resistance of rock bolt based on its tensile characteristics. Int. J. Coal Sci. Technol. 2021, 8, 1384–1399. [Google Scholar] [CrossRef]
  32. Wulan, T.; Wang, P.; Li, Y.; You, Y.; Tang, F. Numerical investigation on strength and failure modes of thread-fixed one-side bolted t-stubs under tension. Eng. Struct. 2018, 169, 15–36. [Google Scholar] [CrossRef]
  33. Goswami, D.Y. The CRC Handbook of Mechanical Engineering; CRC Press: Boca Raton, FL, USA, 2004. [Google Scholar]
  34. Liu, K.; Wang, Z.; Tang, W.; Zhang, Y.; Wang, G. Experimental and numerical analysis of laterally impacted stiffened plates considering the effect of strain rate. Ocean. Eng. 2015, 99, 44–54. [Google Scholar] [CrossRef]
  35. Paul, S.K.; Roy, S.; Sivaprasad, S.; Bar, H.; Tarafder, S. Identification of post-necking tensile stress-strain behavior of steel sheet: An experimental investigation using digital image correlation technique. J. Mater. Eng. Perform. 2018, 27, 5736–5743. [Google Scholar] [CrossRef]
  36. Joun, M.; Choi, I.; Eom, J.; Lee, M. Finite element analysis of tensile testing with emphasis on necking. Comput. Mater. Sci. 2007, 41, 63–69. [Google Scholar] [CrossRef]
  37. Kamaya, M.; Kitsunai, Y.; Koshiishi, M. True stress-strain curve acquisition for irradiated stainless steel including the range exceeding necking strain. J. Nucl. Mater. 2015, 465, 316–325. [Google Scholar] [CrossRef]
  38. Zhu, F.; Bai, P.; Zhang, J.; Lei, D.; He, X. Measurement of true stress-strain curves and evolution of plastic zone of low carbon steel under uniaxial tension using digital image correlation. Opt. Lasers Eng. 2015, 65, 81–88. [Google Scholar] [CrossRef]
  39. Wang, S.H.; Li, Y.; Weng, Y.L.; Sun, K. Determination of true stress-strain relationship of metallic materials based on bar tension tests. Suxing Gongcheng Xuebao/J. Plast. Eng. 2017, 24, 138–143. [Google Scholar]
Figure 1. Overload protection bolts of the high-speed train couplings.
Metals 13 00744 g001
Figure 2. Climbing vehicles or zigzag derailment phenomenon. (a) A rear-end collision in the Washington, D.C. Metro in 2009. (b) A derailment of a city passenger train in Los Angeles in 2008 (The Railroad Accident Report of the United States National Transportation Safety Board).
Metals 13 00744 g002
Figure 3. Definitions of grip length L g , threaded length L t , and thread engagement length. Reprinted with permission from [12], 2023, Elsevier.
Metals 13 00744 g003
Figure 4. M20 overload protection bolt connection diagram (unit: mm).
Metals 13 00744 g004
Figure 5. Key geometry used to determine the shape of the VCSB (unit: mm).
Metals 13 00744 g005
Figure 6. Schematic diagram of bolt material test (unit: mm).
Metals 13 00744 g006
Figure 7. Clamping tooling design diagram (unit: mm).
Metals 13 00744 g007
Figure 8. VCSB connections uniaxial quasi-static tensile test.
Metals 13 00744 g008
Figure 9. Simplified model of the bolted connection combination.
Metals 13 00744 g009
Figure 10. Finite element model of tooling structure for the VCSB tensile test.
Metals 13 00744 g010
Figure 11. Preload force application process.
Metals 13 00744 g011
Figure 12. Stress and strain curve of the VCSB material.
Metals 13 00744 g012
Figure 13. Deformation schematic of the necking section for the tension specimen.
Metals 13 00744 g013
Figure 14. The tensile force and the tensile displacement response curve: (a) Test 1 (TP = 0 N·m), (b) Test 2 (TP = 430 N·m), (c) Test 3 (TP = 610 N·m), (d) Test 4 (TP = 820 N·m).
Metals 13 00744 g014
Figure 15. Characterization of the response curve of the bolt tension test in relation to the preload force: (a) Tensile displacement in three stages, (b) Tensile force values at three transition points.
Metals 13 00744 g015
Figure 16. Analysis of the initial stiffness pairs in the elastic phase of the response curves of Tests 1–4.
Metals 13 00744 g016
Figure 17. VCSB-induced failure deformation and fracture cross-section: (a) Test 1 (TP = 0 N·m), (b) Test 2 (TP = 430 N·m), (c) Test 3 (TP = 610 N·m), (d) Test 4 (TP = 820 N·m).
Metals 13 00744 g017
Figure 18. Cross-sectional minimum diameter d c and sectional shrinkage.
Metals 13 00744 g018
Figure 19. Failure attribute strain of finite element models of specimens with different mesh sizes.
Metals 13 00744 g019
Figure 20. Comparison of test and FEM loading curves in the tension without preload: (a) The FEM loading curve with F-EPS value of 0.125–0.65 and Test 1, (b) Loading curves of the Test 1 and Sim-0 (FEPS = 0.43).
Metals 13 00744 g020
Figure 21. Comparison of loading curve characteristics between Test 1 and FEM-0 (a) Tensile force at the three transition nodes, (b) Deformation of the three tensile phases.
Metals 13 00744 g021
Figure 22. Effective stress contour plots of VCSB in the FEM-0: (a) A 1 , (b) B 1 , (c) C 1 , (d) bolt fracture.
Metals 13 00744 g022aMetals 13 00744 g022b
Figure 23. Comparison of the VCSB fractures between effective stress contour plots of FEM-0 and Test 1.
Metals 13 00744 g023
Figure 24. Curve of d c (minimum section diameter) with tensile displacement of VCSB in the FEM-0.
Metals 13 00744 g024
Figure 25. Comparison of loading curves between Tests 2 to 4 and the numerical simulation: (a) Loading curves of Test 2 and Sim-180, (b) Loading curves of Test 3 and Sim-255, (c) Loading curves of Test 2 and Sim-343, (d) Stiffness of the initial elastic phase of the experimental and simulated curves.
Metals 13 00744 g025
Figure 26. Effective stress contours plots of the VCSB in FEM-180: (a) A 2 , (b) B 2 , (c) C 2 , (d) bolt fracture.
Metals 13 00744 g026
Figure 27. Comparison the VCSB fracture between simulation and experiments with preload: (a) Test 2 and FEM-180, (b) Test 3 and FEM-255, (c) Test 4 and FEM-343.
Metals 13 00744 g027aMetals 13 00744 g027b
Figure 28. Curve of d c with tensile displacement in the simulation with preload.
Metals 13 00744 g028
Figure 29. Shrinkage rate of the fracture section in the simulation and test.
Metals 13 00744 g029
Figure 30. Response curves obtained from numerical simulation under different prestress.
Metals 13 00744 g030
Figure 31. Characteristic parameter variation curve of coupler overload protection.
Metals 13 00744 g031
Table 1. The types of finite element modeling of full-size bolts.
TypeSpider Web ModelCylinder ModelAxisymmetric ModelThread Rising Angle Model
ModelMetals 13 00744 i001Metals 13 00744 i002Metals 13 00744 i003Metals 13 00744 i004
Table 2. The chemical composition of the 40 Cr.
CSiMnCrNiPSCuMo
0.37~0.440.17~0.370.50~0.800.80~1.10≤0.30≤0.035≤0.035≤0.25≤0.10
Table 3. Preload torque, preload force, and prestress values obtained from standard calculations.
Preload Torque (N·m) Preload Force (kN)Pre-Stress (Mpa)
43081.43180.02
610115.53255.37
820155.30343.30
Table 4. Material parameters of variable cross-section bolts.
Density (g/cm3)Young Modulus (Gpa)Poisson RatioYield Strength (Mpa)
7.85206.080.3835.27
Table 5. Comparison of failure-effective plastic strain (F-EPS) of finite element models with different mesh sizes.
Mesh Size (mm)Finite Element ModelF-EPS
5Metals 13 00744 i0050.24
Metals 13 00744 i006
4Metals 13 00744 i0070.30
Metals 13 00744 i008
3Metals 13 00744 i0090.40
Metals 13 00744 i010
2Metals 13 00744 i0110.42
Metals 13 00744 i012
1Metals 13 00744 i0130.45
Metals 13 00744 i014
0.5Metals 13 00744 i0150.47
Metals 13 00744 i016
Table 6. Relative errors (%) of data characteristics in Test 1 and FEM-0.
TypeTensile ForceDisplacementInitial Elastic Phase
Data characteristicsABCOAABBC-
Relative errors (%)−2.42−3.3214.323.647.19−4.317.8
Table 7. Comparison of shrinkage (%) of the variable cross-section in FEM-0 and Test 1.
Type d c Shrinkage (%)
Test114.8838.67
FEM-015.3434.82
Relative error (%) 9.96
Table 8. Relative errors (%) of loading curve characteristics between Test 2 to 4 and the simulation.
TypeCaseTensile ForceDisplacementInitial Elastic Phase
Relative errors (%)-ABCOAABBCStiffness
FEM-180−8.10−1.45.3−27.67−8.442.566.23
FEM-255−3.74−2.748.87−10.002.612.171.40
FEM-3435.61−1.709.511.54−1.02−1.750.88
Table 9. The failure parameters of VCSB connection structure under tensile load with the prestress from 0 to 650 MPa.
CaseInitial Elastic StiffnessFracture Displacement DCMaximum Tensile Force FB
FEM-0109.099.73275.17
FEM-50120.219.41275.17
FEM-100148.619.31275.18
FEM-150215.079.26275.19
FEM-180222.029.12275.17
FEM-200233.249.04275.34
FEM-250253.958.80275.19
FEM-300256.338.55275.18
FEM-350272.608.23275.82
FEM-400279.968.06276.12
FEM-450290.007.74275.81
FEM-500294.037.14275.42
FEM-550294.006.91275.62
FEM-600301.516.01276.41
FEM-650305.574.69279.41
Disclaimer/Publisher’s Note: The statements, opinions and data contained in all publications are solely those of the individual author(s) and contributor(s) and not of MDPI and/or the editor(s). MDPI and/or the editor(s) disclaim responsibility for any injury to people or property resulting from any ideas, methods, instructions or products referred to in the content.

