Article

Mechanism of Extracting Germanium from Ge-Containing Solution with Tannins

1
Faculty of Metallurgical and Energy Engineering, Kunming University of Science and Technology, Kunming 650093, China
2
State Key Laboratory of Complex Nonferrous Metal Resources Clean Utilization, Kunming University of Science and Technology, Kunming 650093, China
3
Key Laboratory of Unconventional Metallurgy, Ministry of Education, Kunming 650093, China
*
Authors to whom correspondence should be addressed.
Metals 2023, 13(4), 774; https://doi.org/10.3390/met13040774
Submission received: 17 February 2023 / Revised: 8 April 2023 / Accepted: 12 April 2023 / Published: 15 April 2023

Abstract

:
The process of germanium–tannin complex is the oldest form of technology for extracting germanium from Ge-containing solutions. This reaction mechanism is relatively controversial as it imposes restrictions on ideas and methods for reducing the amount of tannin. In this paper, using SEM, TEM, FT-IR, XPS, NMR, TOF-SIMS and UV diffuse reflectance spectroscopy for a deep analysis of germanium–tannin complex, the mechanism of extracting germanium from Ge-containing solutions with tannins is investigated. The results show that the theoretical tannin complex mass is 30 times that of tannin mass, and the complex rate reaches 98.84%. The changes of -OH stretching band in FT-IR spectra, the emergence of C3H3GeO7, C2H3GeO6, and C8H7GeO7 in TOF-SIMS images, and the shift of Ge and O banding energy in XPS detail spectra provided definitive evidence for the germanium–tannin complex process, highlighting that the formed complexes of tannins with germanium involve six coordinate Ge-O bonds, which are obtained through orthophenol hydroxyl groups in tannins reacting with Ge4+. Furthermore, the complex mode of germanium–tannins is layer polymerization, which finally forms an agglomeration of complex flocs. The findings of this research is innovative, and can have a profound impact on the future introduction of various methods to reduce the mass of tannins.

Graphical Abstract

1. Introduction

Germanium is a typically rare and dispersed element. It is a trace component in the Earth’s crust and natural waters, and is the most important semiconductor material besides silicon [1]. Due to its unique properties and metal performance, germanium is a critical component in optical fiber technology, playing an irreplaceable role in promoting faster communication [2] as the shift to optical fiber communication becomes inevitable with the advent of the 5G communication era. At the same time, germanium is widely used in the fields of solar cell, medicine, catalysts, etc. It is also an indispensable and important metal in the fields of defense aviation and space development [3]. Therefore, extracting germanium has become an urgent problem that needs to be solved.
Tannin is a polyphenolic secondary metabolite found in higher plants that are widely distributed within the environment. It is an especially important element in the food industry and environmental sciences [4,5]. Furthermore, it plays an important role in mineral flotation, the recovery of metal ions from waste water, and in anticorrosive primers for non-ferrous metals [6]. Tannin is also known as gallotannin, galloylglucose, glycerite, Penta NM digalloyl glucose, or quebracho [7]. Tannins are not composed of a single compound, but a complex organic substance with a more complex chemical composition. Depending on their structure, they can be classified into two main categories [8]: hydrolysable and non-hydrolysable (or condensed) tannins. The most widely used in the industry are hydrolyzed tannins, a class of natural, non-toxic, and biodegradable polyphenolic compounds. It has a molecular formula of C76H52O46 and molecular weight of 1701.20. The center of the hydrolysable tannins molecule contains functional groups such as hydroxyl, ester, and carbonyl [9], resulting in a wide range of chemical properties, which is why tannins are widely used in the industry [10]. The most important chemical property of tannins are the stable chelates formed by complexing with metal ions (such as iron, copper, germanium and other metal ions) [11,12,13]. Metal ions complex with tannins, forming chelates with six and eight regular octahedron ligands.
Since germanium is extremely dispersed in the Earth’s crust and is associated with bauxite, lead-zinc, and coal mines [14], the production of germanium is mainly in the form of a by-product of the zinc industry. Specifically, germanium is often recovered from the leaching liquor obtained in zinc hydrometallurgy. Currently, there are three main methods for extracting germanium from zinc-germanium leaching solution [15]. First, the zinc powder replacement method, which produces toxic arsine gas and pollutes the environment, with a very low recovery rate at only 45~55% [16]. Second, germanium recovery by extraction, which has the advantages of good selectivity and high recovery in the field of germanium wet recovery. There are several extractants such as MIBK [17], HGS98 and D2HPA [17], KELEX100 [18], LIX63,YW100 [19], di-(2-ethylhexyl) phosphoric acid (P204) [20], and trioctylamine (TOA). However, many problems still need to be solved in order to realize its industrialization. For example, the extractant has high water solubility, easy emulsification, high equipment requirements, large loss, high cost, and cannot be recycled [21]. Third, the tannins complex of germanium, which is the most widely used method, has the advantages of environmental protection and high germanium recovery rate [15,22]. However, the germanium–tannin complex method is controversial, which limits the idea and method of reducing tannin consumption. Therefore, we need to explore the mechanism of extracting germanium from germanium-containing solutions by tannins.
With regard to the above problems, this paper investigates the complex process of tannin and germanium and the deposition pattern and complex mechanism of germanium–tannins through chemical coordination experiments. Understanding the action mechanism of tannins complexes in germanium is helpful to improve the formation rate of germanium complexes and the utilization rate of tannins, so as to provide ideas for reducing tannins consumption.

2. Material and Experiment

2.1. Materials

All chemical reagents used were of reagent grade and the stock solutions used in the experiments were prepared with deionized (DI) water. The glassware used in the experiments were rinsed with deionized water before use and then dried in a drying oven at 60 °C for 3 h. Germanium standard solution was obtained from the National Nonferrous Metals and Electronic Materials Analysis and Testing Center (Beijing, China). Tannic was purchased from Fengchuan Chemical Reagent Technology Co. Ltd. (Tianjin, China). Tannic is gallnut tannin. The molecular formula and structure of tannics are shown in Figure 1. Gallnut tannins are hydrolyzed tannins, which are usually composed of one glucose and 5~12 gallic groups by ester or glycoside bonds.

2.2. Experimental Methods

The germanium complex experiments were performed in 200 mL glass reactors in thermostat water bath (DF-101S, Shanghai, China) with temperature control. A mechanical stirrer was placed in the center of the 200 mL glass reactors to ensure that the solution was uniformly mixed and reacted. The temperature controller probe were inserted into the reactors to observe the reaction temperature. Approximately 50 mL of germanium solution (0.2 mg/mL) was added to a 200 mL glass reactor and its pH value was adjusted to 1.50. The adjusted germanium solution was placed in a constant temperature water bath for continuous stirring and heating. Once the required temperature (318 K) was reached, the tannins (20 g/L, pH 1.50) were added to the solution at the required temperature. The pH of the solution is measured every 2 min and maintained at 1.50. The germanium complex reaction was stopped after designed reaction time and the solution was left to stand still for 5 min before being filtered. Retention of filtrate and sludge were kept for later testing.

2.3. Analysis and Equipment

The S-3C model pH meter was applied to accurately determine the pH value of the solution. The germanium concentration was determined by inductively coupled plasma-optical emission spectrometry (ICP-OES) using a PE-8000 spectrometer (Pekin-Elmer, Wellesley, MA, USA). Fourier transform infrared (FT-IR) spectra were recorded on a Nicolet iS50 (USA) spectrometer using KBr pellets. UV diffuse reflectance spectroscopy in the 200–700 nm range was used with the UV-2700 instrument. PHI nano TOF II Time-of-Flight SIMS (TOF-SIMS) was used to obtain mass spectra at 30kev and 2nA. X-ray photoelectron spectroscopy (XPS) spectra were obtained through a K-Alpha+ (USA) at a vacuum of about 2 × 10⁻⁷ mbar. The field emission-scanning electron microscopy (FE-SEM, Nova-NanoSEM450, The Netherlands) was used to characterize the microscopic morphology of tannins and germanium–tannins before and after germanium complex; the samples were sprayed with platinum before the characterization. Bruker Avance 400 instrument produced by an American company was adopted. Due to the special properties of tannins, deuterium dimethyl sulfoxide was used as dissolving agent. The data obtained after 16 scanning times were processed and analyzed by MestReNova.

3. Results with Discussion

3.1. Effect of Tannins Content on the Complex Rate of Germanium

After the experiment, the germanium content of the filtrate was measured by ICP detection and the measured value, which is m, C0 = 200 mg/L; V0 = 50 mL, was substituted into the following equation [23]:
E = ( 1 m C 0 × V 0 ) × 100 %
where m is the amount of germanium in the filtrate after the complexation reaction, mg; C 0 is the mass concentration of germanium in the solution before the reaction, mg/L; V 0 is the volume of the solution before the reaction; and L.E is the germanium sinking efficiency, %.
The study of the correspondence between tannin consumption and germanium precipitation under conventional conditions was carried out by mechanical stirring. A certain amount of tannins was slowly added to the germanium standard solution at a constant rate; the precipitation temperature was 60 °C, the pH was 1.50, the reaction time was 30 min and the resting time was 5 min. The filtrate and precipitate were obtained by filtration. The germanium precipitation rates and germanium concentrations at different tannin multiplicities were obtained as shown in Figure 2.
From Figure 2, with the increase of the tannin multiples, the germanium concentration in the solution after germanium complex is continuously decreasing and steadied at 0.58 mg/L, while the corresponding germanium complex rate is gradually increasing from the initial rapid increase by up to 98.84%. When the amount of tannins used is 20 multiples, the germanium concentration at this multiple is 8.46 mg/L, and the germanium complex rate reaches 83.08%, which proves that the reaction ability of germanium and tannins is strong. After the continuous increase in the amount of tannins used, the growth trend slows down. When the amount of tannins is 30 multiples, the concentration of germanium after germanium complex is 0.58 mg/L, and the germanium complex rate reaches 98.84%, which further shows that germanium and tannins has a strong reaction ability. Then, it has a tendency to be flat, indicating that the germanium deposition rate has reached an inflection point at this point. When the tannic acid dosage reaches 35 times, the germanium concentration in the germanium precipitation solution is reduced to 0.54 mg/L. The germanium precipitation rate is then 98.92%, which is only an increase of 0.08%. Therefore, based on the growth trend of germanium–tannins in Figure 2 and the actual production cost, it can be concluded that the tannins content of 30 times and germanium complex rate are the best.
The analysis of the results of this part of the experiment shows that tannins are highly reactive with germanium bases. However, this process also consumes a large amount of tannin content, which is a big problem for the amount of tannin consumed. Therefore, further research is needed in the future to reduce the tannin consumption.
The process of germanium re-extraction from germanium-containing solutions by coordination with tannins is well established, but the reaction mechanism is highly controversial. We have carried out a number of mechanistic experiments to study the complexation process of tannins with germanium and to investigate the deposition pattern and complexation mechanism of germanium–tannins. Understanding the mechanism of tannin complexation in germanium is beneficial for improving the formation rate of germanium complexes and the utilization of tannins, thus providing ideas for reducing tannin consumption.

3.2. FT-IR Analysis of Germanium–Tannins Complexes

In order to further elucidate the reaction mechanism between tannin and germanium, the functional groups of tannin and germanium tannin were characterized by FT-IR. Figure 3 shows the comparison of functional groups of tannin and tannin germanium. The infrared absorption peaks of tannin are mainly 3435 cm−1, 1713 cm−1, 1536 cm−1, 1202 cm−1, and 1089 cm−1. The infrared absorption peaks of tannin–germanium are mainly located at 3360 cm−1, 1709 cm−1, 1617 cm−1, 1342 cm−1, and 1050 cm−1.
From the FT-IR diagram, the diffraction band between 3700 cm−1 and 3000 cm−1 belongs to the hydroxyl group (-OH) [24], and the diffraction peak of tannins is 3435 cm−1, while that of tannin germanium is 3360 cm−1, both of which can be classified as hydroxyl radical. There is a peak at 1713 cm−1, which is mainly caused by the vibration of the C=O bond in the ester group [25]. There is a wide and strong peak between 1200–1300 cm−1, which is attributed to the C-O bond vibration of the ester group. Both the C=O bond and the C-O bond are attributed to aromatic esters of tannins [26,27]. The plane vibration peak of catechol benzene ring in tannin is between 1700–1600 cm−1. The C-C bond in the phenolic group of tannin has a deformation vibration absorption peak between 1500 cm−1 and 1400 cm−1. The diffraction peak at 1536 cm−1 is mainly caused by the deformation and vibration of C=C in the benzene ring [28,29]. The diffraction peak around 1450 cm−1 was attributed to the stretching vibration of C-C aromatic groups [30]. The tensile vibration peak of carbon and oxygen is between 1400–1000 cm−1. An amount of 1342 cm−1 is the C-O stretching peak on the benzene ring, 1089 and 1035 cm−1 are the C-O-C symmetric stretching peaks [31,32]. The vibration absorption peak of hydrocarbon is within 900–700 cm−1. At 868 cm−1, it is the C-H absorption peak of tannin center, and at 759 cm−1, it is the out-of-plane bending peak of C-H on the benzene ring [33,34].
Based on the FT-IR spectra of tannins and germanium–tannins (Figure 3), the diffraction peak near 3400 cm−1 becomes wider and the peak strength weakens, which is mainly due to the reduction of the chemical bond force constant K when the hydroxyl group forms a new intramolecular hydrogen bond, and the stretching vibration absorption peak of phenolic hydroxyl group moves in the direction of decrease. It has previously been reported that two different forms of reaction shift occur in the FT-IR band of -OH stretching when new molecules are formed. The first and most important is the interaction of the -OH group with different reaction substrates, that is, the binding with metals. The second is the H interaction between ortho hydroxyl groups [35]. As the standard solution of pure germanium was used in the reaction process, only germanium metal element was present in the solution, so it was inferred that the hydroxyl group reacted with germanium.
In addition, the diffraction peak intensity of tannin germanium at 1536 cm−1 and 1089 cm−1 decreased, while that at 868 cm−1 and 759 cm−1 increased, indicating that tannin may have undergone side reactions or hydrolysis reactions during the reaction with germanium. It makes the C-H bond and the C-O-C bond vibrate stronger. Compared with the FT-IR curve of tannin, the C=O stretching vibration peak (1730 cm−1–1700 cm−1) and C-O diffraction peak (1100 cm−1–1300 cm−1) in tannin germanium have changed, indicating that the ester group hydrolysis may have occurred [36,37]. In conclusion, according to the FT-IR comparison of tannin and tannin–germanium, the reaction between tannin and germanium should be a reaction of germanium and phenolic hydroxyl group in tannin, and there may be ester hydrolysis in the reaction.

3.3. UV Diffuse Reflectance Spectroscopy Analysis of Germanium–Tannins Complexes

Figure 4 shows the UV diffuse reflectance spectra of tannin and germanium–tannins. The UV diffuse reflectance curve of tannin has two sharp peaks, 254 nm and 337 nm, with a maximum absorption wavelength of 254 nm. After the tannin–germanium precipitation reaction, the UV diffuse reflectance peak of tannin–germanium is relatively flat and the peak intensity is significantly weaker, but it is still two peaks, 264 nm and 348 nm, with a maximum absorption wavelength of 264 nm. The maximum absorption wavelength occurs when the red shift contributes to the ionization equilibrium of the tannins, generating more H+ and phenoxy negative ions and facilitating the replacement of H in the phenolic hydroxyl group of the tannin molecule by germanium. The FT-IR spectroscopic analysis of tannins and germanium–tannins was validated by UV diffuse reflectance spectroscopy.

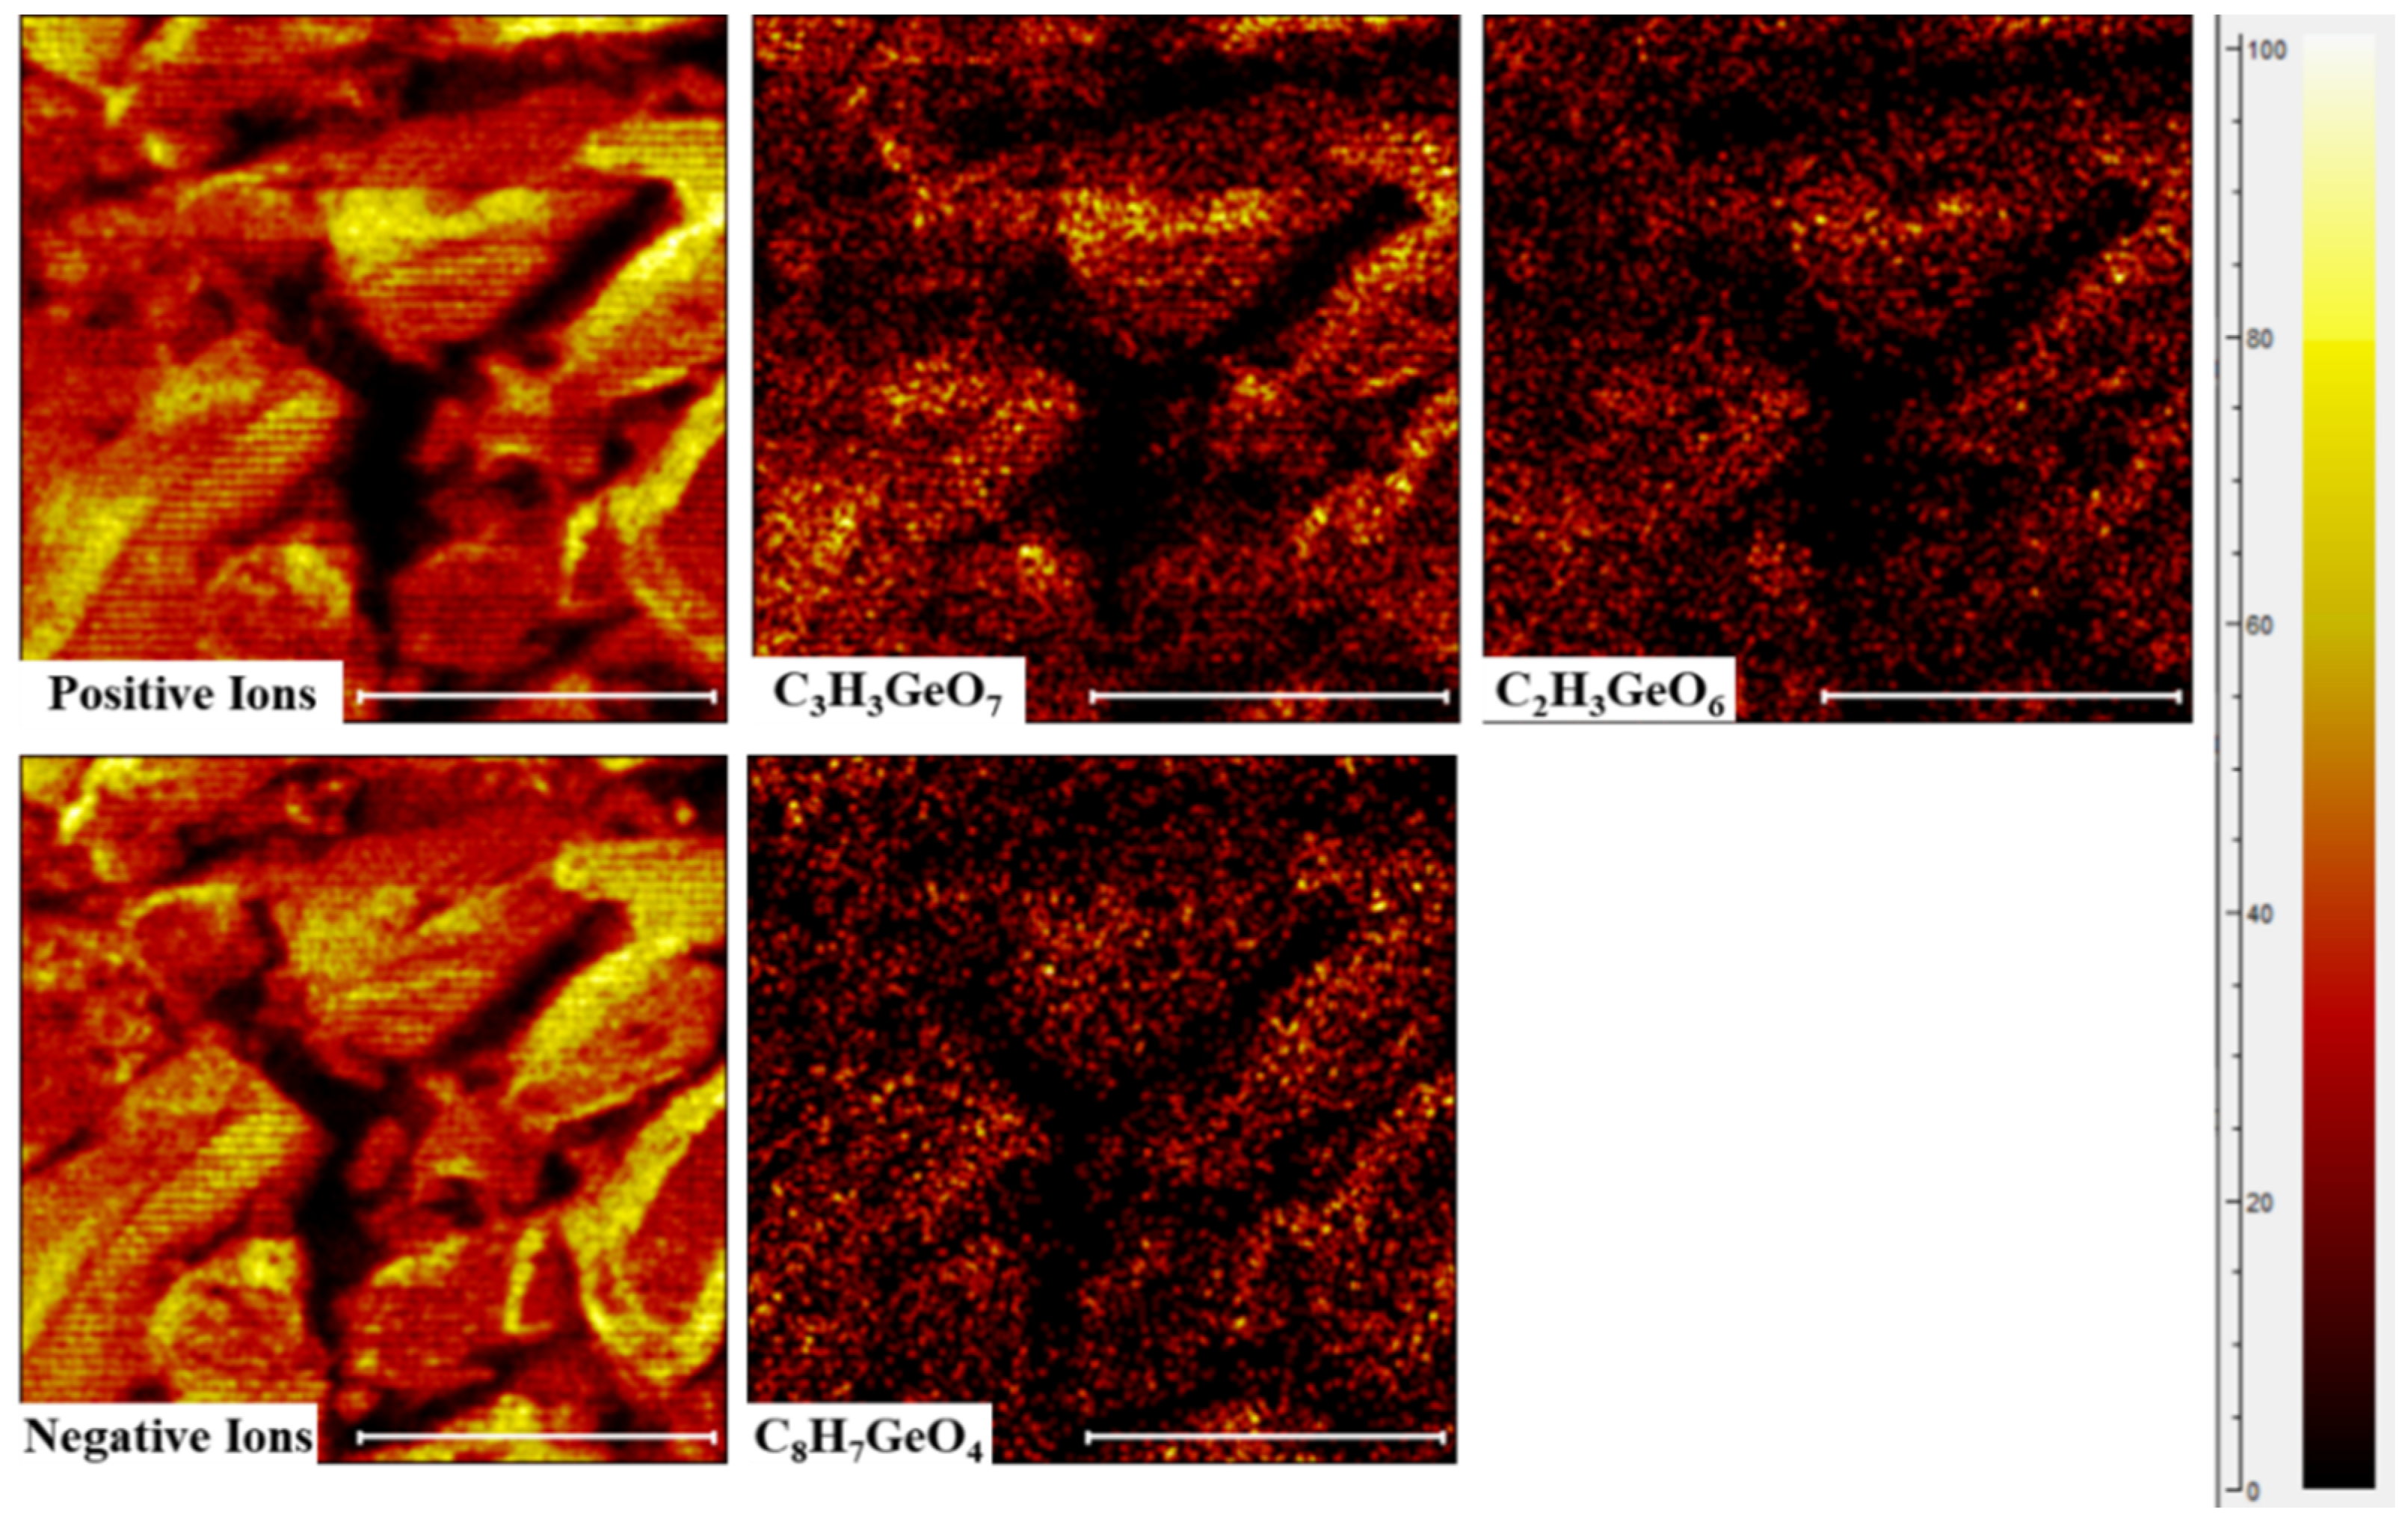
3.4. TOF-SIMS Analysis of Germanium–Tannins Complexes

TOF-SIMS scan map can detect the element distribution of surface and internal particles, which is an effective means to detect elemental distribution [38]. The positive and negative secondary ion mass spectra of tannin–germanium ligand can be seen in Figure 4. It can be seen from Figure 5 that C3H3GeO7 and C2H3GeO6 fragments appear in the positive ion of tannin–germanium ligand, and C8H7GeO7 fragments appear in the anion. The C3H3O7-, C2H3O6-, and C8H7O7- fragments in the fragments are derived from tannins, which again proves that tannin and germanium have coordination reactions. Furthermore, CxHyGez fragments were not found in TOF-SIMS atlas of tannin–germanium complex, suggesting that the coordination reaction between the o-phenol hydroxyl group in tannins and germanium ion occurred.

3.5. XPS Analysis of Germanium–Tannins Complexes

In this paper, the wide spectrum and Ge 2p and O1S fine sweep spectrum detection of germanium–tannins and tannins were carried out to determine the functional groups of germanium and tannins. The results are shown in Figure 6. In the full-scan spectrum Figure 6a, the binding band of tannins has two new binding energy peaks compared with germanium–tannins (Ge 3d and Ge 2p). This further proves that germanium has successfully complexed with tannins. From Figure 6b, it is observed that the Ge 3d binding energy has three peaks at 26.93 eV–32.76 eV. They are assigned to GeO, Gen+ (n = 1, 2, 3), and Ge4+. The Ge 2p binding energy is observed in the four peaks at 1219.84 eV–1251 eV in Figure 5c, which are assigned to GeO, Ge4+, Gen+ (n = 1, 2, 3), and GeOn+ (n = 1, 2, 3) [39,40,41,42]. The reaction solution is nitric acid. In the germanium standard solution of the system, the ion form of germanium is complex, but most of them exist in the form of Ge4+, which further proves that Ge is complexed with tannins.
In O 1s (Figure 5d), the peaks at 530.03 and 531.31 eV correspond to C=O and -OH bonds. However, after Germanium coordination, the O 1s binding energy in germanium–tannins showed two peaks at 531.75 eV–533.24 eV, and were assigned to C=O and -OH [43,44,45]. When comparing the O 1s of the two, it is found that the binding energy of C=O has changed from 530.0 3 eV to 531.75 eV, with an increase of 1.72 eV and a stronger peak intensity; the peak area is slightly unchanged, while the binding energy of -OH changes from 531.31 eV to 533.24 eV, with an increase of 1.93 eV and an increase in the peak intensity and peak area, indicating that both C=O and -OH have reacted and combined with FT-IR analysis, and that germanium is mainly coordinated and complexed with -OH in tannins, while C=O-assisted -OH for complexation or a hydrolysis reaction occurred. This is consistent with the test results of TOF-SIMS.
The exact position of the hydroxyl group cannot be determined by means of XPS detection. It is assumed that the three ortho-position phenolic hydroxyl groups undergo a six-coordinate complexation.

3.6. TEM and SEM Analysis of Germanium–Tannins Complexes

The tannins was detected by SEM and TEM, and the results are shown in Figure 7 and Figure 8. The SEM and TEM tests of tannin–germanium complexes are shown in Figure 9 and Figure 10.
From Figure 7a,b, in the red square the tannins is a three-dimensional spherical object with a smooth surface. In Figure 8a,b, in the red square no obvious lattice structure is observed for tannins, indicating that they are non-crystalline. The homogeneous form of the tannin material indicates that the tannin is a pure substance. When combining Figure 7 and Figure 8, it can be concluded that tannins are a kind of irregular globular substance with a clean interior.
From Figure 9a,b, a flocculent shell is formed at the surface of germanium–tannins, and it agglomerates into irregular black lumps. When magnified to 20,000 multiples (Figure 9b), in the red square a flocculent substance was clearly observed, and the flocculent substance was agglomerated. From Figure 9a,b, a layered structure was observed in the germanium–tannins complex, and when it is enlarged to 60,000 multiples (Figure 10b), in the red square a clear layered structure can be further observed, with layers stacked from the inside to outside. Combining Figure 9 and Figure 10, it can be concluded that germanium–tannins is a kind of irregular block complex composed of flocculent substances stacked in layers from inside to outside.
In conclusion, it can be found that tannins and germanium–tannins are two completely different substances based on FE-SEM and HR-TEM analyses. From tannins to germanium–tannins, there is a qualitative change, that is, tannins–germanium complex is a process of chemical-property change. At the same time, it is found that the deposition mode of germanium–tannins is a kind of irregular block complex composed of flocculent matter which is agglomerated in layers from inside to outside.

3.7. Complex Mechanism of Germanium and Tannins

In order to further study the reaction between hydroxyl and germanium, tannins and tannin–germanium were characterized by liquid NMR, and the transition changes of germanium orbitals were studied. The results are shown in Figure 11a,b.
It can be seen from the comparison that germanium–tannin has a strong peak at 3~4 ppm. During the process of tannin leaching germanium, the side reaction of partial ester group hydrolysis may occur. The chemical shift of the peak at 6.90~6.95 ppm did not change, but the peak strength of the phenolic hydroxyl group became weaker. This indicates that the types of phenolic hydroxyl groups in tannins did not change, but the number was reduced. It was later proven that the phenolic hydroxyl group in tannins underwent a coordination reaction with germanium, which was consistent with the results of infrared spectroscopy and XPS.
On the basis of confirming the coordination form of tannins and germanium, the coordination mechanism of tannins and germanium was further studied. According to orbital hybridization theory [46], the coordination process of tannin and germanium should be divided into two steps. The first step is that the phenol hydroxyl group in tannin is ionized to form phenoxy anion. The second step is the coordination of germanium with the anion of phenoxy. It is inferred that the reaction process of tannin and germanium consists of the two phenol hydroxyl groups in tannin reacting with Ge4+, which means that the reaction mechanism of tannin reacting with germanium to produce tannin–germanium involves a reaction between the o-phenol hydroxyl groups in tannin and Ge4+, and sp3d2 hybridization is performed to form a Ge-O covalent bond. The specific molecular orbital diagram and simple mechanism diagram of tannin precipitation are shown in Figure 12 and Figure 13. In the red square the complexes of the formed tannins–germanium involved six-coordinate Ge-O bonds, which are obtained through a reaction between the orthophenol hydroxyl groups in tannins and Ge4+.

4. Conclusions

In this study, a tannin coordination method was used to recover the experimental matrix of germanium. When the tannin content was 30 times, the germanium concentration after germanium complex was 0.58 mg/L, and the germanium coordination rate reached 98.84%. A morphological and mechanistic investigation of tannin–germanium complexes by SEM, TEM, FT-IR, XPS, NMR, TOF-SIMS, and UV diffuse reflectance spectroscopy were conducted. The complexes of the formed tannins–germanium involved six-coordinate Ge-O bonds, which are obtained through a reaction between the orthophenol hydroxyl groups in tannins and Ge4+. In addition, the complex mode of germanium–tannins is layer polymerization, which finally forms an agglomeration of complex flocs. This article studies the complex mechanism and deposition mode of germanium–tannins, which can provide a clear theoretical guidance for the current tannin precipitation process, provide feasible technical solutions for reducing the dosage of tannic acid, and have important significance for the efficient utilization of germanium.

Author Contributions

Conceptualization, Y.H. and K.Y.; methodology, Y.H. and L.Z.; software, H.D.; validation, S.L.; formal analysis, S.L. and K.Y.; resources, Y.H. and H.D.; writing—original draft preparation, Y.H.; writing—review and editing, K.Y. All authors have read and agreed to the published version of the manuscript.

Funding

This work was supported by the National Natural Science Foundation of China [grant number 51974141]; Major Science and Technology Project of Yunnan Province [grant number 202202AB080005]; Yunnan Fundamental Research Projects [202301AT070480]; Yunnan Fundamental Research Projects [202101AT070280].

Institutional Review Board Statement

Not applicable.

Informed Consent Statement

Not applicable.

Data Availability Statement

Not applicable.

Conflicts of Interest

The authors declare no conflict of interest.

References

  1. Adams, J.H. Germanium and Germanium Compounds. Metals Hand Book, 10th ed.; ASM International: Novelty, OH, USA, 1990. [Google Scholar]
  2. Lam, S.E.; Alawiah, A.; Bradley, D.A.; Mohd Noor, N. Effects of time-temperature profiles on glow curves of germanium-doped optical fiber. Radiat. Phys. Chem. 2017, 137, 56–61. [Google Scholar] [CrossRef]
  3. Depuydt, B.; Theuws, A.; Romandic, I. Germanium: From the first application of Czochralski crystal growth to large diameter dislocation-free wafers. Mater. Sci. Semicond. Process. 2006, 9, 437–443. [Google Scholar] [CrossRef]
  4. Khanbabaee, K.; Van, R.T. Tannins: Classification and definition. Nat. Prod. Rep. 2001, 18, 641–649. [Google Scholar] [PubMed]
  5. Ho, C.-T. Phenolic Compounds in Food: An Overview; Comstock, M.J., Ed.; Phenolic Compounds in Food and Their Effects on Health II; ACS Symposium Series; ACS Publications; American Chemical Society: Washington, DC, USA, 1992. [Google Scholar]
  6. McDonald, M.; Mila, I.; Scalbert, A. Precipitation of metal ions by plant polyphenols: Optimal conditions and origin of precipitation. J. Agric. Food Chem. 1996, 44, 599–606. [Google Scholar] [CrossRef]
  7. Bernays, E.A.; Cooper Driver, G.; Bilgener, M. Herbivores and plant tannins. Adv. Ecol. Res. 1989, 19, 263–302. [Google Scholar]
  8. Cruz, B.H.; Díaz-Cruz, J.M.; Ariño, C. Multivariate curve resolution of polarographic data applied to the study of the copper-binding ability of tannins. Anal. Chim. Acta 2000, 424, 203–209. [Google Scholar] [CrossRef]
  9. Zhang, H.; Peng, Q.; Li, M. Modern Organic Spectral Analysis; Chemical Industry Press: Beijing, China, 2006; pp. 275–293. [Google Scholar]
  10. Cheynier, V.; Dueñas-Paton, M.; Salas, E. Structure and properties of wine pigments and tannins. Am. J. Enol. Vitic. 2006, 57, 298–305. [Google Scholar] [CrossRef]
  11. Iglesias, J.; De Saldaña, E.G.; Jaén, J.A. On the tannins interaction with metallic iron. Hyperfine Interact. 2001, 134, 109–114. [Google Scholar] [CrossRef]
  12. Kraal, P.; Jansen, B.; Nierop, K.G.J. Copper complexation by tannins in aqueous solution. Chemosphere 2006, 65, 2193–2198. [Google Scholar] [CrossRef]
  13. Bayat, S.; Aghazadeh, S.; Noaparast, M. Germanium separation and purification by leaching and precipitation. J. Cent. South Univ. 2016, 23, 2214–2222. [Google Scholar] [CrossRef]
  14. Frenzel, M.; Ketris, M.P.; Gutzmer, J. On the geological availability ofgermanium. Miner. Depos. 2014, 49, 471–486. [Google Scholar] [CrossRef]
  15. Zhou, Z.; Chu, G.; Gan, H.; Yang, T.; Chen, L. Ge and Cu recovery from precipitating vitriol supernatant in zinc plant. Trans. Nonferrous Met. Soc. China 2013, 23, 1506–1511. [Google Scholar] [CrossRef]
  16. Chang, L. Study on Extraction of Rare Metal Ge and Ga by Complexation of Tannic; Chinese Academy of Forestry: Beijing, China, 2010; pp. 5–6. [Google Scholar]
  17. Nozoe, A.; Ohto, K.; Kawakita, H. Germanium Recovery using Catechol Complexation and Permeation through an Anion-Exchange Membrane. Sep. Sci. Technol. 2012, 47, 62–65. [Google Scholar] [CrossRef]
  18. Park, H.J.; Tavlarides, L.L. Germanium(IV) adsorption from aqueous solution using a kelex-100 functional adsorbent. Ind. Eng. Chem. Res. 2009, 48, 4014–4021. [Google Scholar] [CrossRef]
  19. Harbuck, D.D.; Judd, J.C.; Behunin, D.V. Germanium Solvent Extraction From Sulfuric Acid Solutions (and Co-Extraction of Germanium and Gallium). Solvent Extr. Ion Exch. 1991, 9, 383–401. [Google Scholar] [CrossRef]
  20. Ma, X.H.; Qin, W.Q.; Wu, X.L. Extraction of germanium(IV) from acid leaching solution with mixtures of P204 and TBP. J. Cent. South Univ. 2013, 20, 1978–1984. [Google Scholar] [CrossRef]
  21. Liang, J.; Fan, L.; Xu, K.; Huang, Y. Study on Extracting of Germanium with Trioctylamine. Energy Procedia 2012, 17, 1965–1973. [Google Scholar] [CrossRef] [Green Version]
  22. Moskalyk, R.R. Review of germanium processing worldwide. Miner. Eng. 2004, 17, 393–402. [Google Scholar] [CrossRef]
  23. Qin, Q.; Xu, H.; Zhong, C.; Du, Y.; Ju, L. Effects of extraction and refining technology of Tara tannin on complexing precipitation of geranium. Chem. Ind. For. Prod. 2012, 32, 79–82. [Google Scholar]
  24. Pantoja-Castro, M.A.; González-Rodríguez, H. Study by infrared spectroscopy and thermogravimetric analysis of tannins and tannins. Rev. Química 2011, 39, 107–112. [Google Scholar]
  25. Dos, S.G.; Fábio, M.F.F.; Carlos, R.W. Development of methodology for identification the nature of the polyphenolic extracts by FTIR associated with multivariate analysis. Spectrochim. Acta Part A Mol. Biomol. Spectrosc. 2016, 153, 94–101. [Google Scholar]
  26. Silverstein, R.M.; Bassler, G.C.; Morrill, T.C. Spectrometric Identification of Organic Compounds; John Wiley & Sons Inc.: Hoboken, NJ, USA, 1981; pp. 95–98. [Google Scholar]
  27. Stuart, B.H. Experimental Methods in Infrared Spectroscopy: Fundamentals and Applications; John Wiley & Sons, Ltd.: Chichester, UK, 2005; pp. 76–77. [Google Scholar]
  28. Socrates, G. Infrared and Raman Characteristics Group Frequencies: Tables and Chart; John Wiley & Sons, Inc.: Hoboken, NJ, USA, 2001; pp. 125–142. [Google Scholar]
  29. Carballo-Meilan, A.M.; Goodman, M.G.; Baron, J.G. A specific case in the classification of woods by FTIR and chemometric: Discrimination of Fagales from Malpighiales. Cellulose 2014, 21, 261–273. [Google Scholar] [CrossRef] [Green Version]
  30. Laghi, L.; Parpinello, G.P.; Del Rio, D.; Calani, L.; Mattioli, A.U.; Versari, A. Fingerprint of enological tannins by multiple techniques approach. Food Chem. 2010, 121, 783–788. [Google Scholar] [CrossRef]
  31. Picque, D.; Cattenoz, T.; Corrieu, G. Classification of red wines analysed by middle infrared spectroscopy of dry extract according to their geographical origin. OENO One 2001, 35, 165–170. [Google Scholar] [CrossRef]
  32. Weiler, F.H. Simultaneous determination of sulfur, nitrogen and ash for vegetable tannins using ATR-FTIR spectroscopy and multivariate regression. Microchem. J. 2019, 149, 103994. [Google Scholar] [CrossRef]
  33. Coates, J. Interpretation of infrared spectra, a practical approach. In Encyclopedia of Analytical Chemistry; Meyers, R.A., Ed.; John Wiley & Sons Ltd.: Chichester, UK, 2000; pp. 10815–10837. [Google Scholar]
  34. Ping, L.; Pizzi, A.; Guo, Z.D.; Brosse, N. Condensed tannins from grape pomace: Characterization by FTIR and MALDI TOF and production of environment friendly wood adhesive. Ind. Crops Prod. 2012, 40, 13–20. [Google Scholar] [CrossRef]
  35. Ricci, A.; Olejar, K.J.; Parpinello, G.P.; Kilmartin, P.A.; Versari, A. Application of Fourier transform infrared (FTIR) spectroscopy in the characterization of tannins. Appl. Spectrosc. Rev. 2015, 50, 407–442. [Google Scholar] [CrossRef]
  36. Falcão, L.; Araújo, M.E.M. Tannins characterization in historic leathers by complementary analytical techniques ATR-FTIR, UV–vis and chemical tests. J. Cult. Herit. 2013, 14, 499–508. [Google Scholar] [CrossRef]
  37. Malacarne, M.; Antoniolli, G.; Bertoldi, D.; Nardin, T.; Larcher, R. Botanical origin characterisation of tannins using infrared spectroscopy. Food Chem. 2018, 267, 204–209. [Google Scholar] [CrossRef]
  38. Ribeiro, J.; DaBoit, K.; Flores, D.; Kronbauer, M.A.; Silva, L.F. Extensive FE-SEM/EDS, HR-TEM/EDS and TOF-SIMS studies of micron-to nano-particles in anthracite fly ash. Sci. Total Environ. 2013, 452, 98–107. [Google Scholar] [CrossRef]
  39. Watling, K.M.; Chandler-Temple, A.; Nogita, K. XPS analysis of oxide films on lead-free solders with trace additions of germanium and gallium. Mater. Sci. Forum 2016, 857, 63–67. [Google Scholar] [CrossRef]
  40. Deegan, T.; Hughes, G. An X-ray photoelectron spectroscopy study of the HF etching of native oxides on Ge (111) and Ge (100) surfaces. Appl. Surf. Sci. 1998, 123, 66–70. [Google Scholar] [CrossRef]
  41. Osten, H.J.; Klatt, J.; Lippert, G.; Dietrich, B.; Bugiel, E. Surfactant-controlled solid phase epitaxy of germanium on silicon. Phys. Rev. Lett. 1992, 69, 450. [Google Scholar] [CrossRef]
  42. Golovchak, R.; Nazabal, V.; Bureau, B.; Oelgoetz, J.; Kovalskiy, A.; Jain, H. Chemical order in Ga or Sb modified germanium sulfide glasses around stoichiometry: High-resolution XPS and Raman studies. J. Non-Cryst. Solids 2018, 499, 237–244. [Google Scholar] [CrossRef]
  43. Huang, Q.; Liu, M.; Zhao, J.; Chen, J.; Zeng, G.; Huang, H.; Wei, Y. Facile preparation of polyethylenimine-tannins coated SiO2 hybrid materials for Cu2+ removal. Appl. Surf. Sci. 2018, 427, 535–544. [Google Scholar] [CrossRef]
  44. Wang, Z.; Gao, M.; Li, X.; Ning, J.; Zhou, Z.; Li, G. Efficient adsorption of methylene blue from aqueous solution by graphene oxide modified persimmon tannins. Mater. Sci. Eng. 2020, 108, 110196. [Google Scholar] [CrossRef] [PubMed]
  45. Choudhary, B.C.; Paul, D.; Borse, A.U.; Garole, D.J. Recovery of palladium from secondary waste using soluble tannins cross-linked Lagerstroemia speciosa leaves powder. J. Chem. Technol. Biotechnol. 2017, 92, 1667–1677. [Google Scholar] [CrossRef]
  46. Cruz, C.A.; Marie, S.; Arrachart, G.; Pellet-Rostaing, S. Selective extraction and separation of germanium by catechol based resins. Sep. Purif. Technol. 2018, 19, 214–219. [Google Scholar] [CrossRef]
Figure 1. Chemical molecular structure diagram of tannins.
Metals 13 00774 g001
Figure 2. Germanium complex rate and germanium concentration at different tannin multiples.
Metals 13 00774 g002
Figure 3. FT-IR spectra of tannins and germanium–tannins.
Metals 13 00774 g003
Figure 4. Tannins and germanium–tannins ultraviolet diffuse reflectance spectroscopy.
Metals 13 00774 g004
Figure 5. TOF-SIMS images of germanium–tannins complexes.
Metals 13 00774 g005
Figure 6. Full-scan spectrum (a) and Ge 3d spectrum (b); Ge 2p spectrum (c), O 1s spectrum (d,e) of tannins and germanium–tannins.
Metals 13 00774 g006
Figure 7. FE-SEM micrograph of tannins (a,b).
Metals 13 00774 g007
Figure 8. HR-TEM images of tannins (a,b).
Metals 13 00774 g008
Figure 9. FE-SEM micrograph of germanium–tannins (a,b).
Metals 13 00774 g009
Figure 10. HR-TEM images of germanium–tannins (a,b).
Metals 13 00774 g010
Figure 11. 1H liquid NMR spectra of tannins and germanium–tannins (a,b).
Metals 13 00774 g011
Figure 12. Schematic diagram of molecular orbital.
Metals 13 00774 g012
Figure 13. Simple mechanism diagram of tannin–germanium complex.
Metals 13 00774 g013
Disclaimer/Publisher’s Note: The statements, opinions and data contained in all publications are solely those of the individual author(s) and contributor(s) and not of MDPI and/or the editor(s). MDPI and/or the editor(s) disclaim responsibility for any injury to people or property resulting from any ideas, methods, instructions or products referred to in the content.

