Article

Effect of Warm Crossing Rolling on the Microstructure, Texture and Annealing Behavior of High-Purity Tantalum

1
College of Materials Science and Engineering, Chongqing University, Chongqing 400044, China
2
Electron Microscopy Center of Chongqing University, Chongqing University, Chongqing 400044, China
3
Shenyang National Laboratory for Materials Science, Chongqing University, Chongqing 400044, China
4
School of Metallurgy and Material Engineering, Chongqing University of Science and Technology, Chongqing 401331, China
*
Author to whom correspondence should be addressed.
Metals 2023, 13(5), 838; https://doi.org/10.3390/met13050838
Submission received: 10 March 2023 / Revised: 14 April 2023 / Accepted: 17 April 2023 / Published: 24 April 2023

Abstract

:
With advanced integrated circuit semiconductor chips, the uniformity of microstructure and texture is increasingly required for tantalum (Ta) targets. A combination of warm rolling and 135° cross rolling (CR) at the temperature of 500 °C and 800 °C, i.e., warm cross rolling (WCR), was carried out in tantalum (Ta) plates to investigate the evolution of deformed microstructure and texture. Subsequently, these rolled samples were annealed to analyze the recrystallized microstructure. Results exhibited that WCR samples formed a relatively uniform and weak texture distribution along the thickness direction. The reduction in the proportion of low-angle grain boundaries (LAGBs) was associated with the lower Peierls stresses to be overcome for dislocation motion due to thermal activation in the WCR sample. High grain boundary energy was observed in WCR samples, and WCR can promote dynamic recovery of samples to produce sub-crystals (thermodynamically unstable and serving as nuclei for subsequent recrystallization). Fine average grain size and high content of recrystallized grains with random orientation were obtained after annealing in the WCR sample. This study will provide a theoretical reference for the precise optimization of tantalum process parameters and the improvement in the target material’s performance.

1. Introduction

Sputtering targets have become an indispensable key material in the semiconductor industry with the rapid development of integrated circuits [1]. The refractory metal tantalum (Ta) is considered the most promising target for the fabrication of a diffusion barrier between Cu and Si due to its good thermal stability and electrical properties [2]. Grain orientation and size uniformity of targets are critical to the sputtering speed rate during the magnetron sputtering process [3,4]. Thus, the Ta target with excellent performance depends on the uniformity of microstructure and texture [1,2,3,4]. Previous studies have exhibited that 135° cross rolling could more effectively improve the microstructure and texture homogeneity of Ta plates along the thickness direction than the conventional unidirectional rolling (UR) [5,6,7,8,9,10]. Conventional unidirectional rolled Ta sheets suffered from uneven grain size distribution and texture clusters retained after annealing [7,8,9]. Texture gradients and residual deformation bands caused damage to the properties of the target material in UR-annealed samples [9]. {100} <uvw> and {111} <uvw> were two main fiber textures obtained by UR, which displayed different subdivision behaviors and stored energy, causing different recrystallization driving forces [1]. As revealed by Fan et al. [1], rapidly recrystallized {111} grains and the {100} grains that exhibited essentially no microstructural changes at high temperatures were shown in the subsequent annealing process. Liu et al. [8] found that small orientation dependence and uniform storage energy distribution are shown in 135° CR samples.
However, the relevant results described above were based on rolling at room temperature, without considering the influence of rolling temperature on the evolution of microstructure, texture, and annealing behavior in Ta plates. Warm rolling (WR) refers to the mechanical processing of metals above the cold rolling state but below the recrystallization temperature or hot rolling state [11,12]. At present, there is a vast body of experimental data showing that WR could be effectively employed to control the uniformity of microstructure and texture in titanium (Ti) [13], aluminum (Al) [14], textured low-alloy ferritic steel [15], tungsten (W) [16] and aluminum alloys [17]. It was discussed by Murty et al. [18] that fine microstructure and high strength were obtained by WR in the Ti–6Al–4V bars. In addition, the fiber texture was weakened with increasing temperature, and texture randomization occurred during high-temperature deformation [18]. As WR temperature increased to 450 °C in pure Ti, Chun et al. [19] pointed out that recrystallization was produced more rapidly, and the grain structure was refined in the recrystallized state. As revealed by Gatti et al. [20], stronger cube textures after different annealing treatments were present in warmed rolled Al–2.5 wt.%Mg alloy in contrast to the cold rolled sample. As the amount of warm rolling deformation increased, dynamic recrystallization was promoted, and more sub-grains were found in the large 2219 Al–Cu alloy rings, as proposed by Guo et al. [21]. Moreover, after solution heat treatment, many finer and more equiaxed recrystallized grains appeared; however, the uniformity of the grain structure was reduced [21]. According to the results reported by Li et al. [16], enhanced texture strength, along with the increased amount of deformation, was shown in the fine-grained tungsten.
However, there is a lack of knowledge about the effect of the WR process on microstructure uniformity carried out in Ta plates. Ta releases most of its stored energy during the recovery, even up to 70%, which is attributed to its high SFE, leading to easy dislocation climbing and cross-slip migration [22]. Moreover, the recovery has a pronounced impact on the recrystallization behavior of Ta. The recovery temperature of tantalum, 800 °C, was determined to be the WR temperature based on the differential scanning calorimetry (DSC) experimental curve [22]. The research aim of processing Ta plates under warm rolling conditions is to further improve the sputtering performance of Ta targets and contribute to the development of the integrated semiconductor industry. In this paper, a new rolling technology, WR (800 °C), combined with 135° cross rolling (CR) and unidirectional rolling (UR), respectively, was applied to investigate the microstructure and texture evolution of Ta plates after deformation and annealing. In addition, WR at 500 °C was set as the control group. The problem of nonuniformity of target sputtering coating caused by orientation dependence in traditional rolling processes has been effectively solved through 135° warm cross rolling (WCR). This study will provide ideas for the development of optimized rolling processes for future industrial production.

2. Experimental Section

2.1. Experimental Materials and Rolling Methods

Specific treatment (multidirectional forging, annealing and heating) before rolling of initial high-purity Ta and the main composition of original material was given in Refs. [7,23]. The Ta plates with 12 mm thickness were rolled via UR at 800 °C and CR at three different temperatures of 20 °C, 500 °C and 800 °C (70% thickness reduction), which were described as UR-800 °C, CR-20 °C, CR-500 °C and CR-800 °C samples. Three samples were prepared for characterization testing under each rolling condition. The sketch map of two rolling methods is displayed in Figure 1, attached with detailed parameters for rolling in Refs. [7,23]. The specific parameters for rolling are described in Table 1. It should be noted that the Ta plates were put back into the furnace to keep warm for 10 min after eight passes of rolling.
The rolled specimens were annealed at 1050 °C and 1100 °C, respectively, for different times to obtain the fully recrystallized microstructure, and they were recorded as annealed-UR-800 °C, annealed-CR-20 °C, annealed-CR-500 °C and annealed-CR-800 °C samples. High-purity argon gas was introduced as a protective gas during the annealing process, and the annealing samples were cooled in water.

2.2. Characterization Methods

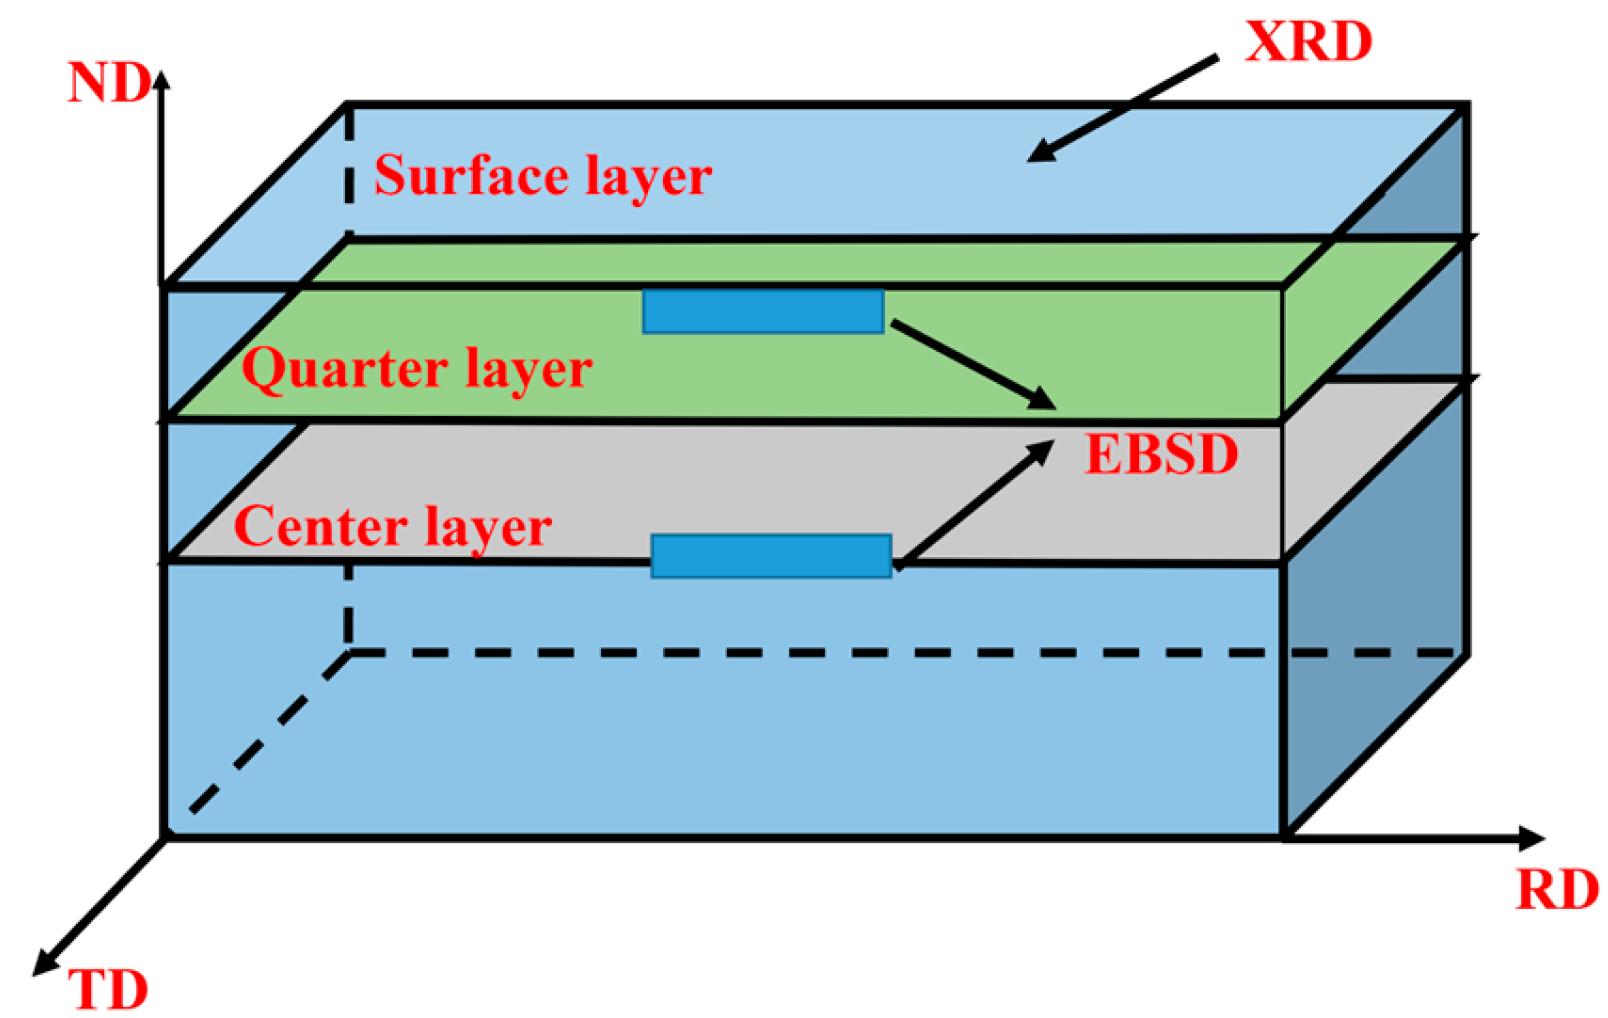
The electro-polishing in a mixed solution of sulfuric acid and hydrofluoric acid with volume ratio of 9:1 was conducted for electron backscatter diffraction (EBSD) test. The polishing current was controlled at 0.1 A/cm2, and the polishing time was about 9 min. The microstructure measurements were characterized at surface and center regions of the transverse direction (TD) plane (Figure 2), with the EBSD system mounted on a TESCAN MIRA 3 field-emission scanning electron microscope (accelerating voltage of 20 kV and working distance of about 15 mm, TESCAN, Oxford, UK). During the test, the incident electron beam interacts with a 70° tilted surface area of the sample to obtain information on the daisy pool pattern of the test area, which is processed into orientation information. Steps for recrystallized samples are 1–3 μm, and the step size of the deformed sample is 0.05–1 μm. The orientation maps of samples under different conditions were tested in five areas to ensure the accuracy of the data. After characterization, the data analysis was carried out using the Channel 5 software (5.0.9.0, Oxford Instrument, Oxford, UK).
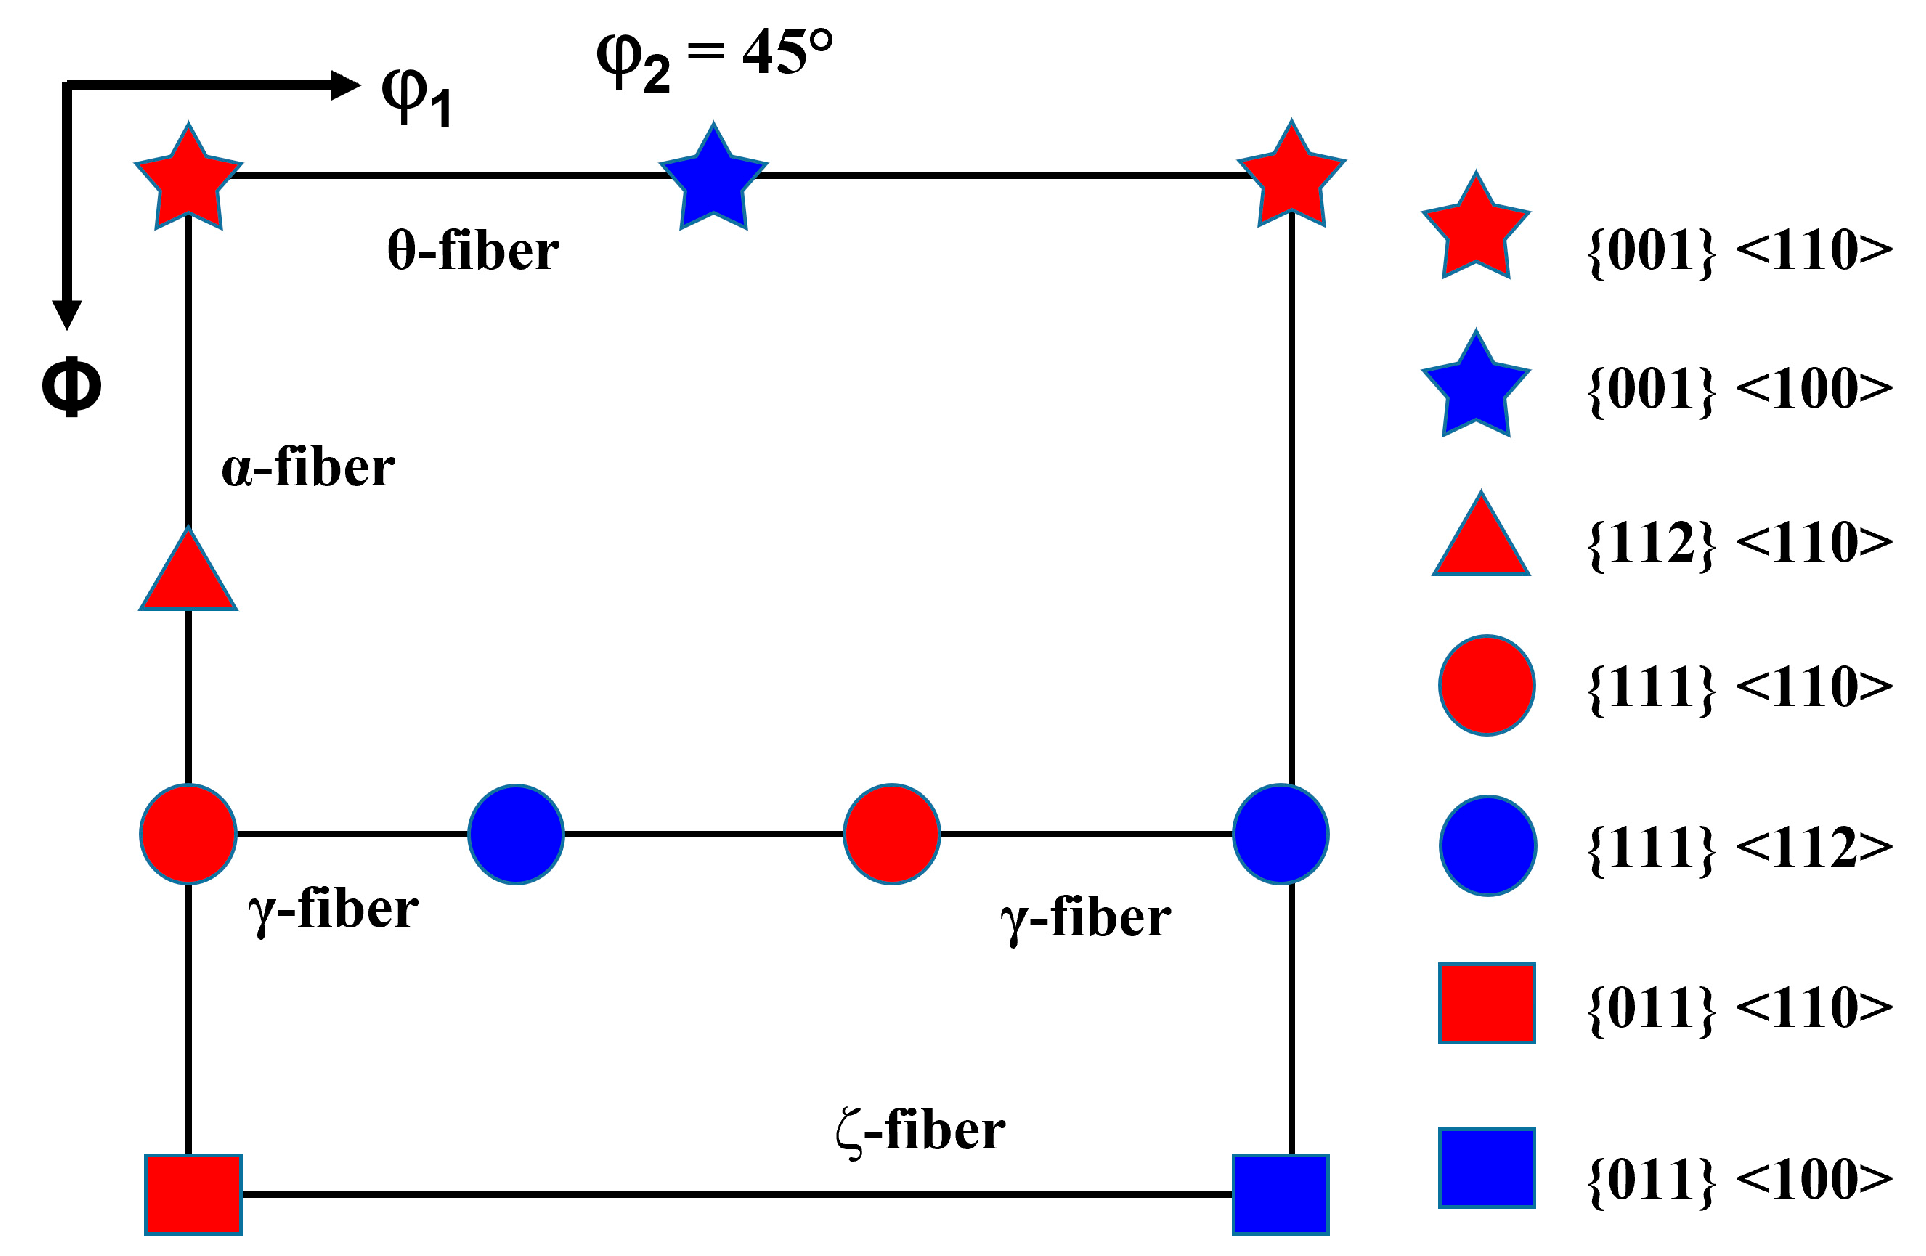
The texture of corresponding rolling and annealing samples was measured by the X-ray diffractometer (XRD, Rigaku D/max 2500PC, Rigaku, Tokyo, Japan) with Cu Kα (40 kV/150 mA). The XRD inspection surface was at the surface, quarter and center layer of normal direction (ND) surface with an area of 10 × 10 mm2, as shown in Figure 2. The parameters of vibration swing (Gamma width with 10 mm) were added during the XRD test to increase the test area. During the measurement, the detection area was 20–90° for α and 0–360° for β. Four incomplete pole figures of {222}, {211}, {200} and {110} were measured using the Schulz reflection method. The arbitrarily defined cells (ADC) method was adopted to calculate orientation distribution functions (ODFs). The typical textures in Ta are α, γ, θ and ζ fiber textures. The Euler angles of these fiber textures are (0°, 90° and 45°), (90°, 55° and 45°), (0°, 45° and 45°) and (90°, 45° and 0°), respectively. Moreover, the data were analyzed by the LaboTax3.0 software to obtain the pole figures and the orientation distribution function maps.

3. Results

3.1. Initial Texture and Grain Size Distribution

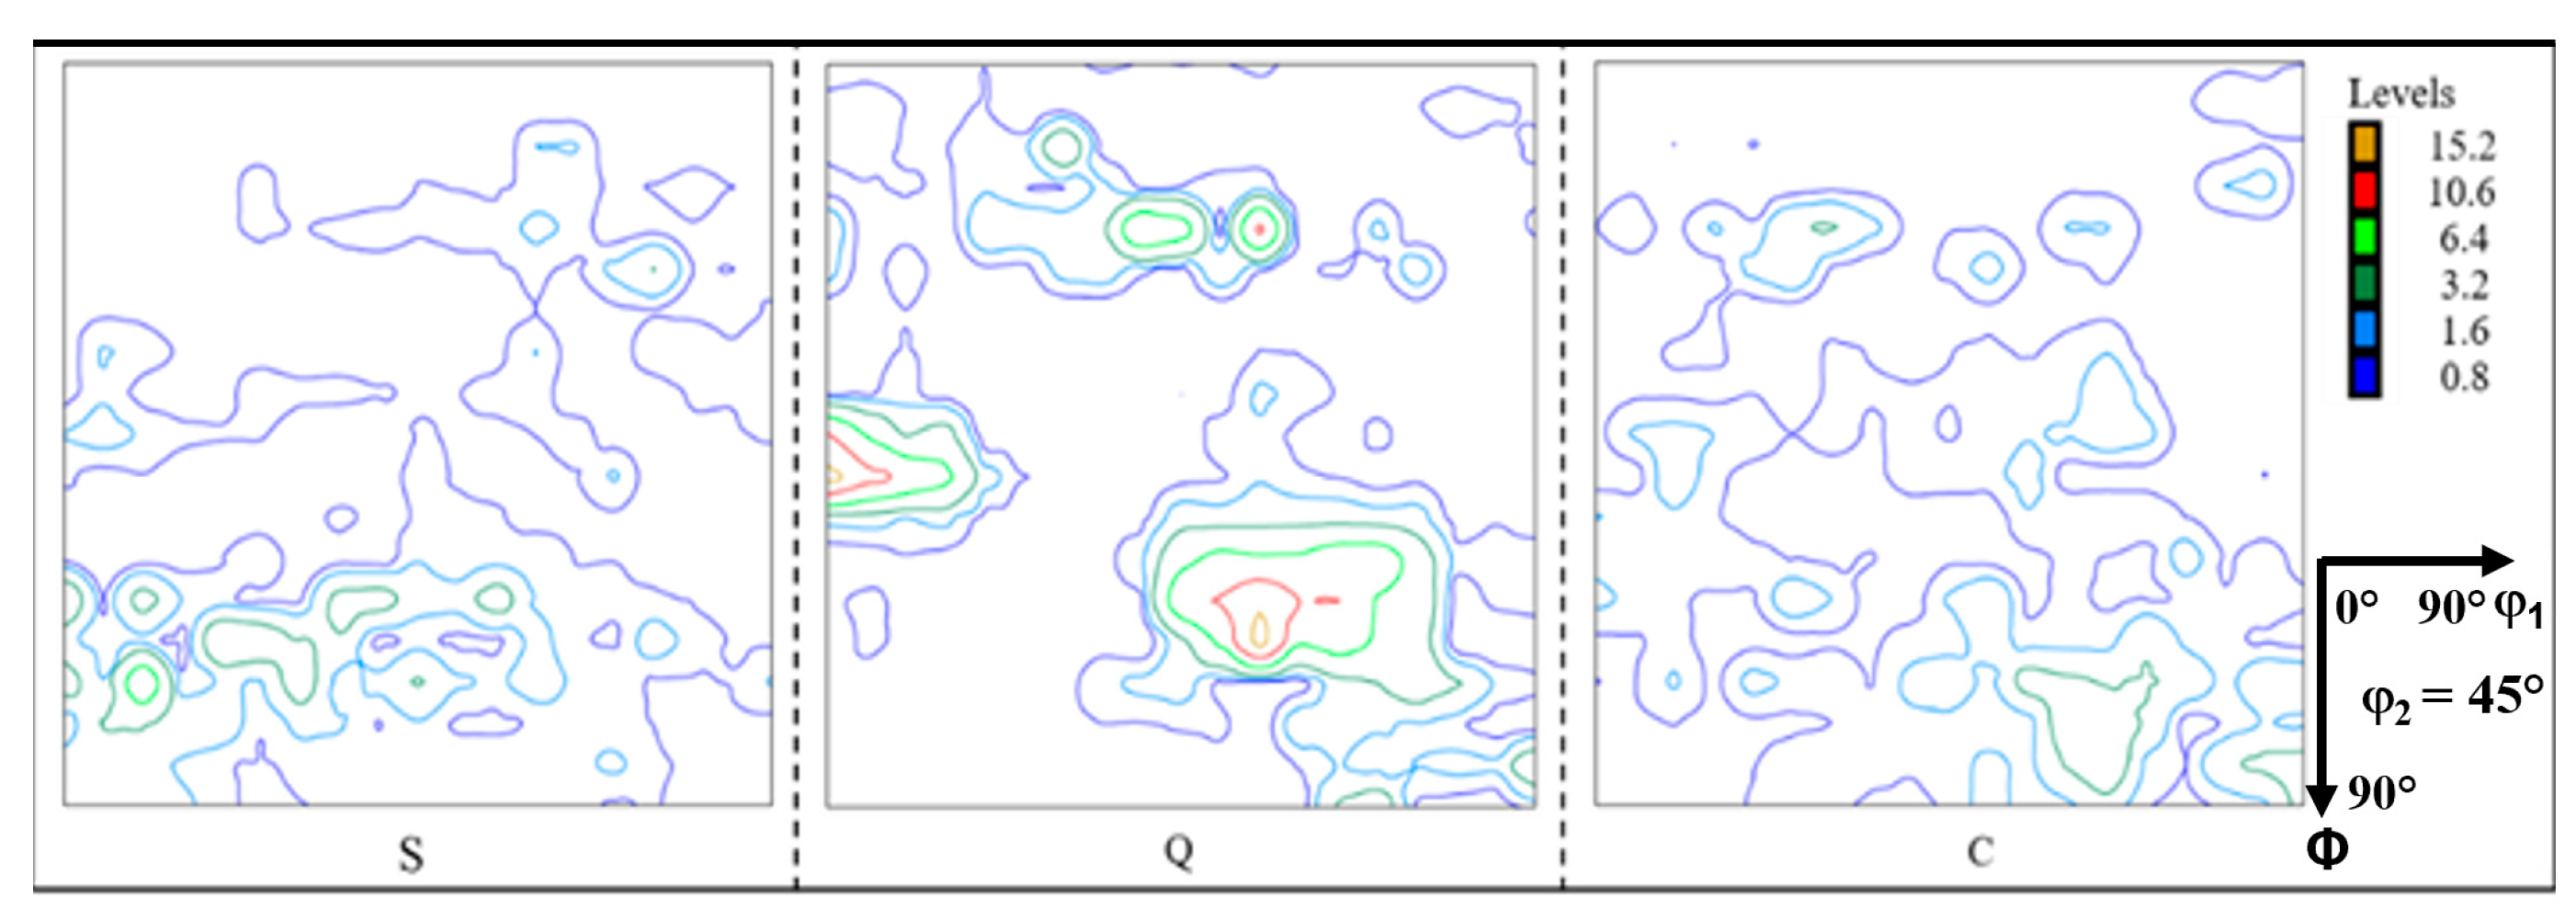
All relevant rolling fibers of Ta (α, γ, θ and ζ fibers) are shown in the ODF sections of φ2 = 45°, as displayed in Figure 3. The pole figure distribution of the initial samples along thickness and corresponding ODF sections of φ2 = 45° are provided in Figure 4, where S, Q and C represent the surface, quarter and center layer of the sample, respectively. The uneven texture distribution along the thickness direction is observed in Figure 4. The crystal orientation is preferred in the quarter-thickness layer, compared with the center and surface layers. Combined with the ODF sections of Figure 3 and Figure 4, the main texture components are α, γ and ζ fibers. However, the distribution of these fibers is not complete, and the segregation near some orientations occurs in the initial samples.
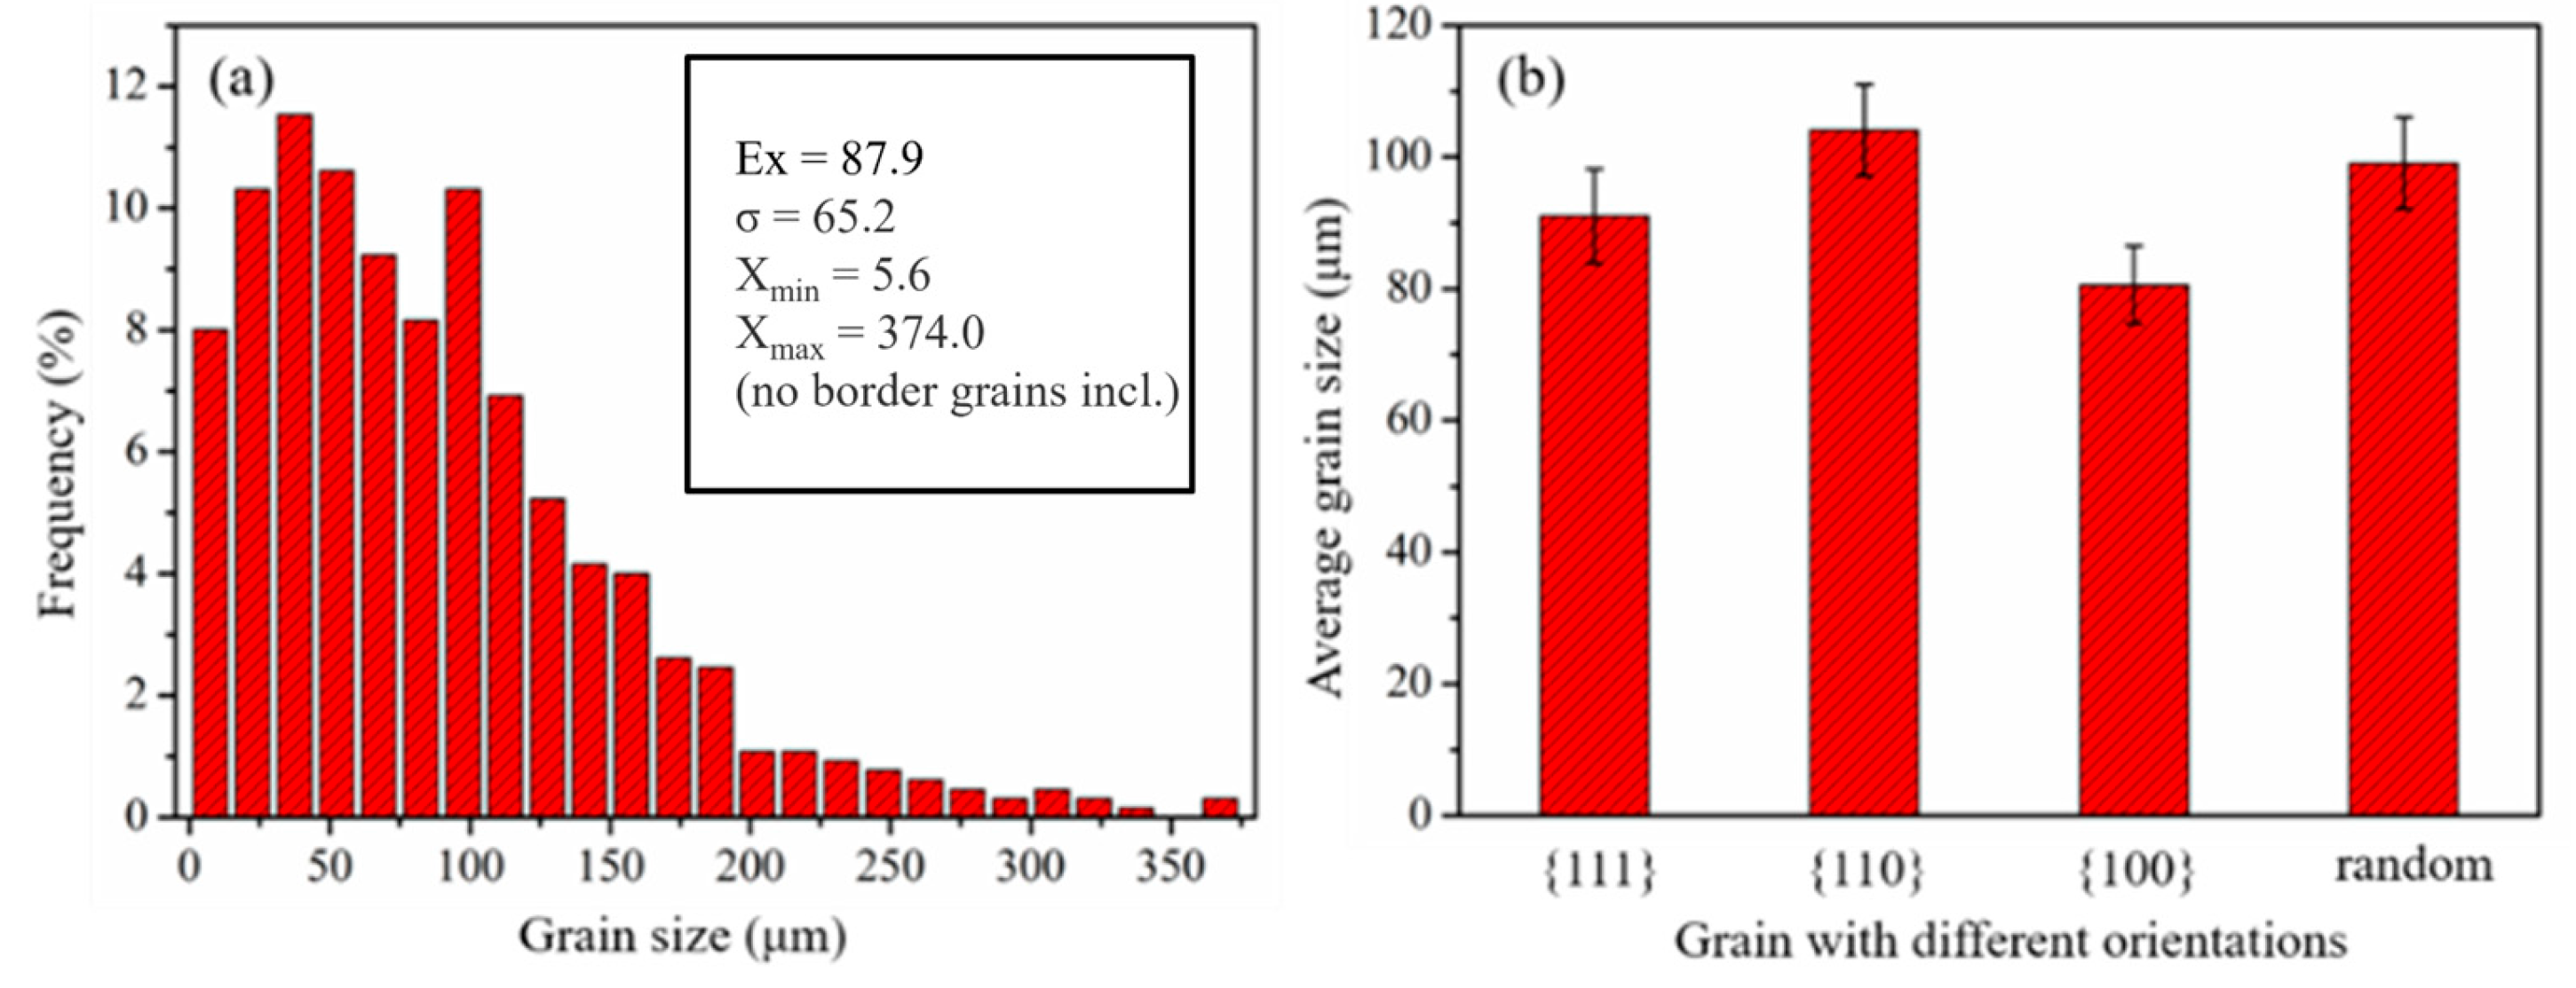
Figure 5a,b are the grain size distribution of initial Ta plates and the average grain size corresponding to different crystal orientations, respectively. In addition, the data are extracted from orientation maps of initial Ta plates. The angular resolution used to define an orientation is 10°. The heterogeneous grain size distribution is shown in initial Ta plates, with an average grain size of 87.9 μm and a maximum grain size of 374.0 μm. Grain size larger than 100 μm accounts for 31.8%, which is found in statistics. In addition, a large difference in average grain size is displayed between different orientations, especially for {110} and {100} crystal orientations.

3.2. Deformation Texture

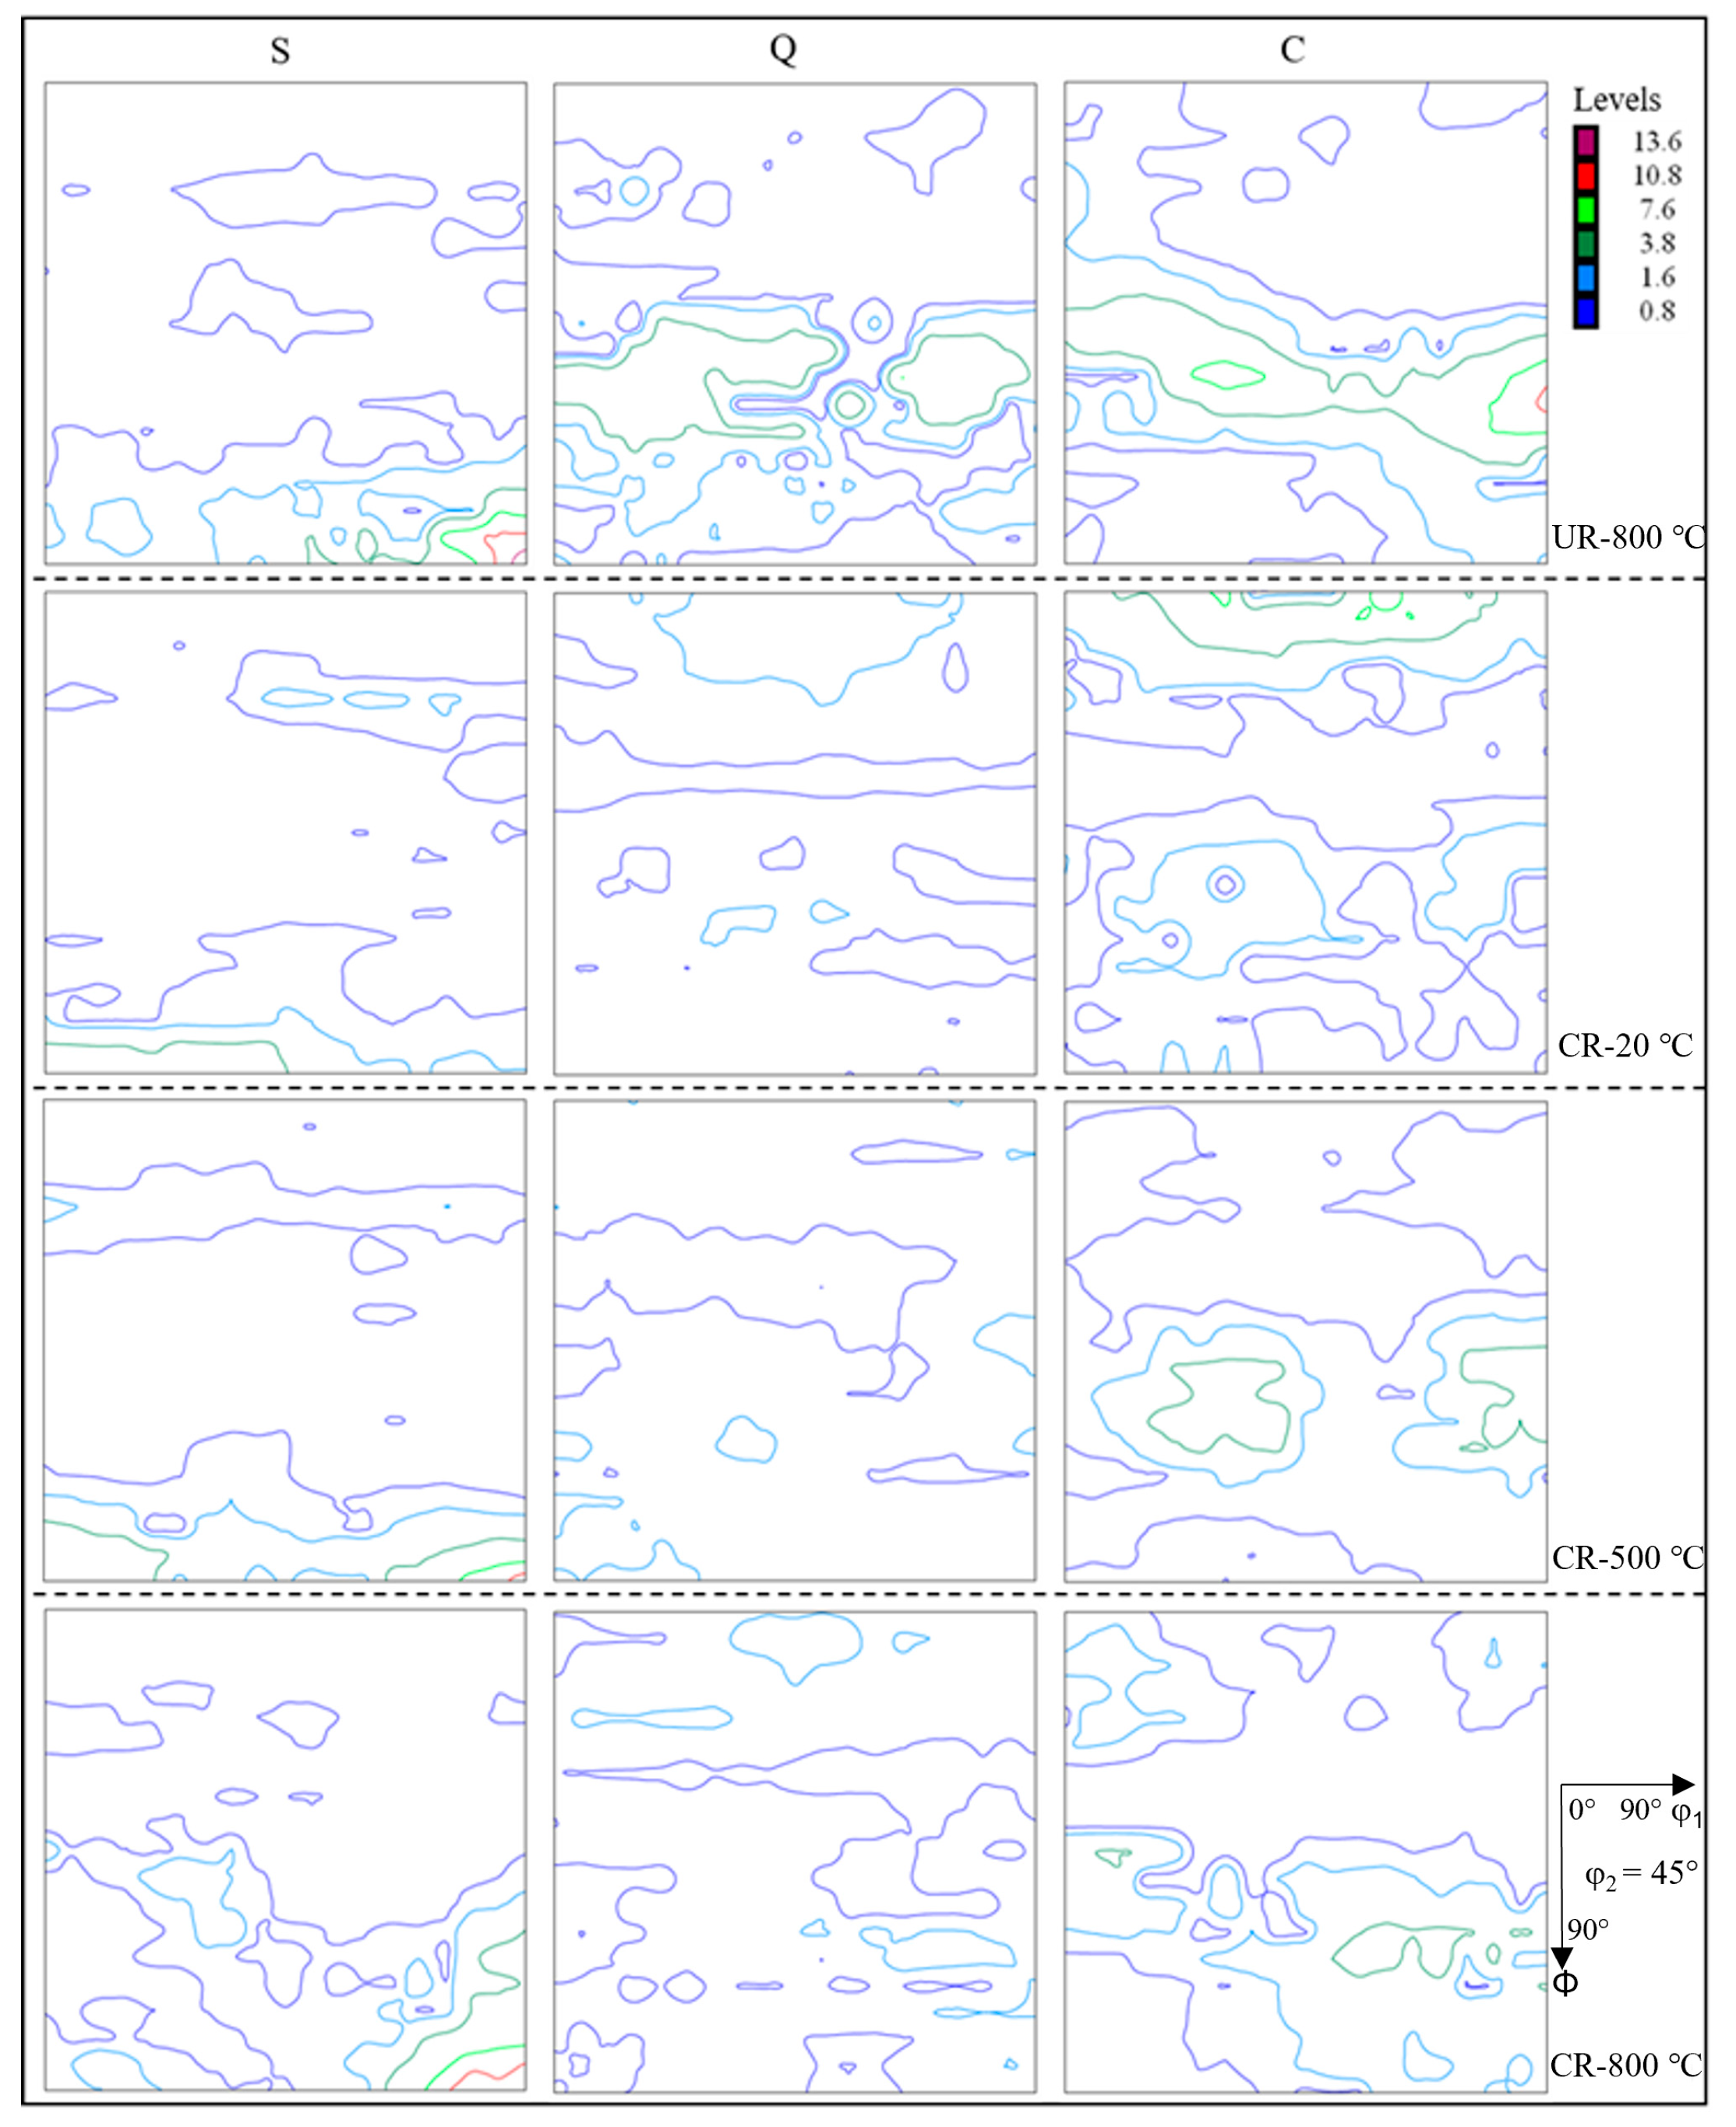
Figure 6 indicates the texture distribution of the sample along the thickness. The higher maximum texture intensity of ζ fiber is exhibited in the surface layer of UR-800 °C, CR-500 °C and CR-800 °C samples than in the CR-20 °C samples. Obviously, the surface layer of samples is found to have strong {110} shear grains, i.e., ζ fiber textures, which can be attributed to the higher shear strain between the sample surface and roll introduced by warm rolling. In addition, the shearing effect can also be further enhanced by the dense oxide layer (easily formed by Ta and air during warm rolling), and the ζ fiber textures are increased due to the enhancement of shear strain.
Both the quarter and center layers of the UR-800 °C samples are found to have strong α and γ fiber textures, and the texture intensity of the center layer is higher than that of the quarter layer. Compared to the surface layer, the center layer is more likely to be in the plane strain state, with a weaker shearing effect. In contrast to the CR-500 °C and CR-800 °C samples, the UR-800 °C samples have fewer activated slip coefficients and are easy to form typical γ and α fiber textures similar to the texture type produced under plane strain compression. Relatively strong γ fiber textures are produced in the center layer of CR-500 °C and CR-800 °C samples, while strong θ fiber textures are formed in the center layer of CR-20 °C samples. A previous study [3] showed that transverse cold rolling (cold 135° cross rolling) of Ta plates can promote the formation of rotating cubic ({001} <110>) textures. The rolling direction (RD) direction is continuously changed during cross rolling, and the {100} <uvw> texture is continuously enhanced. More potential slip systems can be activated due to the continuous change of strain paths in 135° warm cross rolling [24]. In the 135° CR, the rotation of samples around the ND leads to a constant change in the orientation of all grains with respect to the RD, resulting in the appearance of more stable γ and θ fiber textures [25].
The quarter layers of the CR-20 °C, CR-500 °C and CR-800 °C samples are detected with relatively random texture distribution, and the texture intensity of the quarter layer is lower than that of the surface and center layer of corresponding samples. For the quarter layer of the rolled part, the shear strength is lower than that in the surface layer of samples, and grains in the quarter layer are not completely in plane strain compression. In general, the relatively uniform texture distribution along the thickness direction is observed in the CR-20 °C, CR-500 °C and CR-800 °C samples.

3.3. Deformation Microstructure

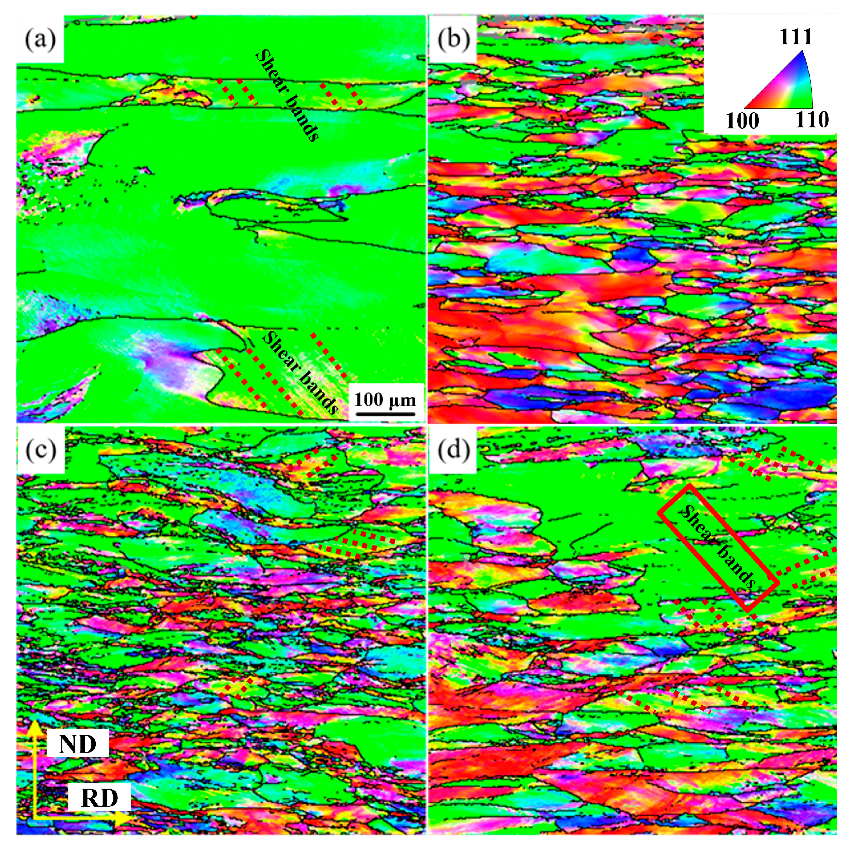
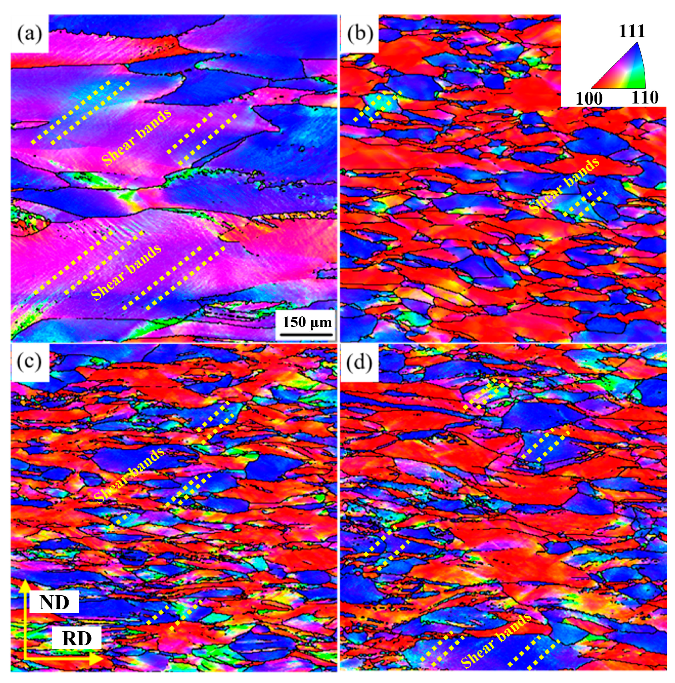
The inverse pole figure (IPF) maps of rolled Ta plates near the surface and center region are provided in Figure 7 and Figure 8, respectively. The near-surface region of samples is mainly composed of {110} <uvw> and {100} <uvw> grains (Figure 7), which is in good agreement with the results shown in Figure 6. Additionally, stronger {110} shear bands are formed in the near-surface layer of the UR-800 °C, CR-500 °C and CR-800 °C samples compared with the CR-20 °C samples, as shown in Figure 7a,c,d. Figure 8a displays that the center region of the UR-800 °C sample produces {111} <uvw>, {113} <uvw> and {hkl} <110> (<110>//RD) deformation grains. The CR-20 °C, CR-500 °C and CR-800 °C samples are not conducive to stable {hkl} grains due to the continuous change of strain path, and finally evolve into more uniform {111} and {100} grains, as can be seen in Figure 8b–d. It should be noted that the deformed grains are evenly distributed along the ND and elongated along the RD on the surface (Figure 7b–d) and center layer (Figure 8b–d) of the CR-20 °C, CR-500 °C and CR-800 °C samples. However, {110} shear bands forming on the surface layer (Figure 7a) and {111} deformed grains forming on the center layer (Figure 8a) in the UR-800 °C samples are coarse and distributed along the ND.

3.4. Microstructure after Annealing

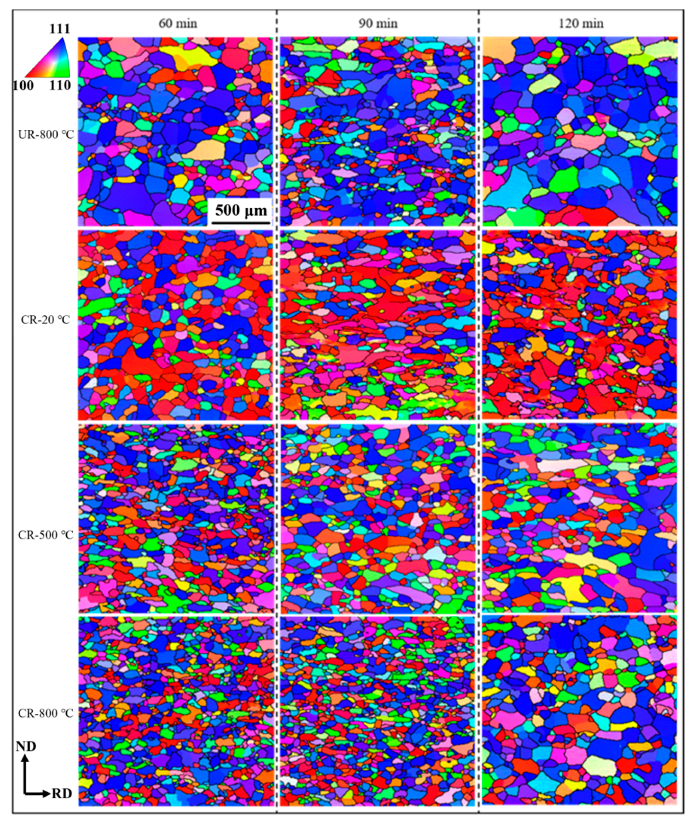
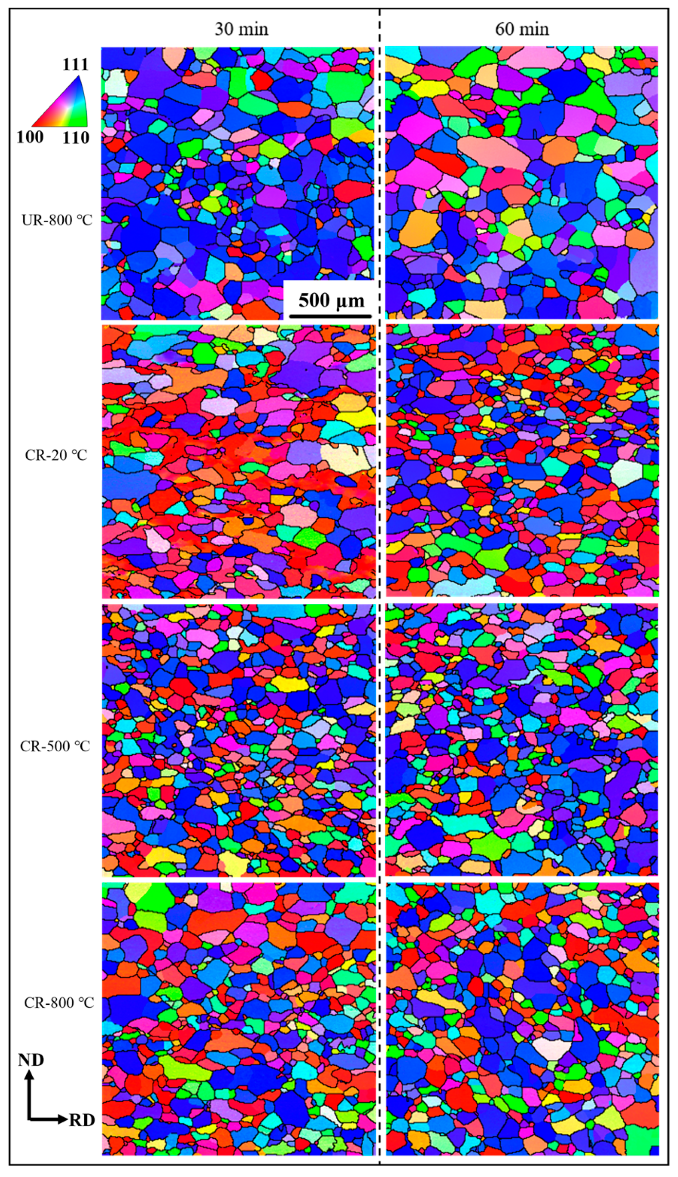
The recrystallization microstructure evolution of samples annealed at 1050 °C and 1100 °C for different times, respectively, are shown in Figure 9 and Figure 10. The central area of each annealed sample is the study area for microstructure. By comparison, it is found that complete recrystallization occurred in samples annealed at 1050 °C for 60 min and 1100 °C for 30 min. Five regions of each annealed sample are selected for statistical recrystallization grain size. The changes in the recrystallized microstructure of the corresponding samples are not significant when the annealing time is extended to 90 min (annealing temperature of 1050 °C) and 60 min (annealing temperature of 1100 °C). Meanwhile, when the annealing time is 120 min (annealing temperature of 1050 °C), grains of corresponding samples grow obviously, especially for grains with the {111} orientation.
Figure 11 displays the average grain size distribution and the volume fraction of {111}, {110}, {100} and randomly oriented grains for corresponding samples after complete annealing at 1050 °C for 60 min and 1100 °C for 30 min. Through comparison with annealed-UR-800 °C, the microstructure uniformity of the annealed-CR-20 °C, annealed-CR-500 °C and annealed-CR-800 °C samples is improved, i.e., a more uniform and fine grain size and a relatively random texture distribution are obtained. Meanwhile, comparing the annealed-CR-20 °C, annealed-CR-500 °C and annealed-CR-800 °C samples, a strong {100} texture band is shown in annealed-CR-20 °C samples after annealing at 1050 °C (Figure 9), and this {100} texture band does not disappear with increasing annealing time. Moreover, a relatively high annealing temperature and a long annealing time, i.e., annealing at 1100 °C for 60 min, can weaken the {100} texture band, but the average size difference of grains with different orientations is relatively large in the annealed-CR-20 °C samples. However, the difference in average grain size of {111}, {100} and {110} orientation becomes smaller in the annealed-CR-500 °C and annealed-CR-800 °C samples, and the content of random orientation grain is also higher. It should be noted that the increase in annealing temperature significantly raises the average size of the grains with different orientations (the annealed-CR-500 °C and annealed-CR-800 °C samples), especially for the recrystallized grains with {111} orientation. Generally, the average recrystallized grain size is relatively small in the annealed-CR-500 °C and annealed-CR-800 °C samples, with small differences in grains size of different orientations. Moreover, the average grain size of the CR-800 °C sample is the smallest, at 40.9 μm after annealing at 1050 °C for 60 min.

4. Discussion

4.1. Effect of Deformation Temperature on Microstructure

The deformed grains near the surface of the samples are subjected to a strong shearing effect. This leads to a large plastic strain and a high degree of internal grain splitting. However, the grains near the center layer of the samples are in a plane strain state, and the shear strain has relatively little effect on the degree of grain splitting. The misorientation distribution in the center region of the deformed sample is revealed in Table 2. Three types of grain boundaries are defined as low-angle grain boundaries (LAGBs) with angles of 1.5°–5.5° and sub-grain boundaries (SGBs) with angles of 5.5°–15°. By comparing Table 2, the percentage of LAGBs is higher for UR-800 °C samples, while the LAGBs of CR-20 °C, CR-500 °C and CR-800 °C samples account for a low proportion. During the CR, the potential slip system is activated (RD rotating 135° around the ND) due to the partial introduction of reverse strain, which increases the probability of interaction between dislocations and other dislocations during the slip process, such as dislocation rearrangement and annihilation [26]. It should be noted that a relatively strong {111} orientation with a large size is found in the center layer of samples after UR (Figure 8a). The microstructure with {111} orientation splits greatly, resulting in uneven grain deformation, as reported by Zhu [9].
Table 2 displays that the percentage of LAGBs in CR-500 °C and CR-800 °C samples are lower than that of CR-20 °C samples. At present, researchers generally believe that the temperature sensitivity of rheological stress in BCC metal stems from the high Peierls stress to be overcome by screw dislocations. Due to the difference in the Peierls stress to be overcome during the motion of the screw and edge dislocations, the motion of the edge dislocations was much faster than that of the screw dislocations [27,28]. The screw dislocation in BCC metal was easy to decompose on the {110} plane, which caused its lattice resistance to be two orders of magnitude higher than that of the edge dislocation, as found by Woodward and Mendis et al. [29,30] through experiments and calculation. Furthermore, the increase in temperature leads to enhanced thermal activation, reduced Peierls stress to be overcome and faster dislocation motion [31]. Thus, the increase in rolling temperature raises the rate of dislocation movement, and at the same time, it can increase the chance of rearrangement and annihilation of dislocations with other dissimilar dislocations in the process of slipping or even climbing. This significantly reduces the percentage of LAGBs in the CR-500 °C and CR-800 °C samples. Further comparison (Table 2) reveals that the percentage of LAGBs in the CR-500 °C samples is slightly lower than that in the CR-800 °C samples. This may be due to the fact that the critical resolved shear stress (CRSS) of the material is reduced with the increase in rolling temperature, resulting in more potential slip systems being enabled. In addition, as displayed in Figure 7, a strong shear texture appeared on the near surface of CR-800 °C samples. It is suggested that the increase in shear strain (with the increase in rolling temperature) is beneficial to enhance the splitting ability of grains in the center region of CR-800 °C samples. The proportion of SGBs in CR-500 °C and CR-800 °C samples is similar, and both have higher SGBs than UR-800 °C and CR-20 °C samples. As mentioned earlier, more dislocations are rearranged and annihilated with the increase of rolling temperature in CR-500 °C and CR-800 °C samples. Thus, the LAGBs (formed in CR-500 °C and CR-800 °C) evolve into SGBs, and more SGBs are observed.

4.2. Distribution of Grain Boundary Energy

Similar texture distribution is shown in the center region of CR-20 °C, CR-500 °C and CR-800 °C samples, i.e., {111} and {100} deformation grains are alternately distributed along the ND. The CR-20 °C, CR-500 °C and CR-800 °C samples are still composed of elongated fiber textures, implying no recrystallization and only recovery, as displayed in Figure 7 and Figure 8. Ta is a high SFE metal [22,32,33,34], which is prone to recovery. After dynamic recovery, the entangled LAGBs in the deformed grains become sub-crystalline structures with different misorientations. In order to better evaluate the energy distribution in deformed grains of CR-20 °C, CR-500 °C and CR-800 °C samples, the total energy contained in the LAGBs (1.5°–5.5°), SGBs (5.5°–15°) and HAGBs (15°–60°) within the deformed matrix is defined as the grain boundary energy.
The grain boundary energy within different CR samples can be evaluated by the Read–Shockley equation [35], i.e., the energy per unit area of different dislocation interfaces ( γ θ ) can be calculated by using information about the orientation difference of the dislocation interfaces, as follows:
γ θ   γ m θ θ m 1 l n θ θ m :   θ θ m
  γ θ   γ m   : θ > θ m
where γ m is the energy per unit area of the large angle interface, and θ is the misorientation of the interface. θ m is the critical angle, i.e., the energy per unit area of the interface no longer varies with the misorientation when the misorientation is higher than θ m . For Ta, γ m is equal to 0.032 J·m−2 [36] and θ m is defined as 15°. The total grain boundary can be expressed by the following formula:
  E = S V · γ θ E + ρ 0
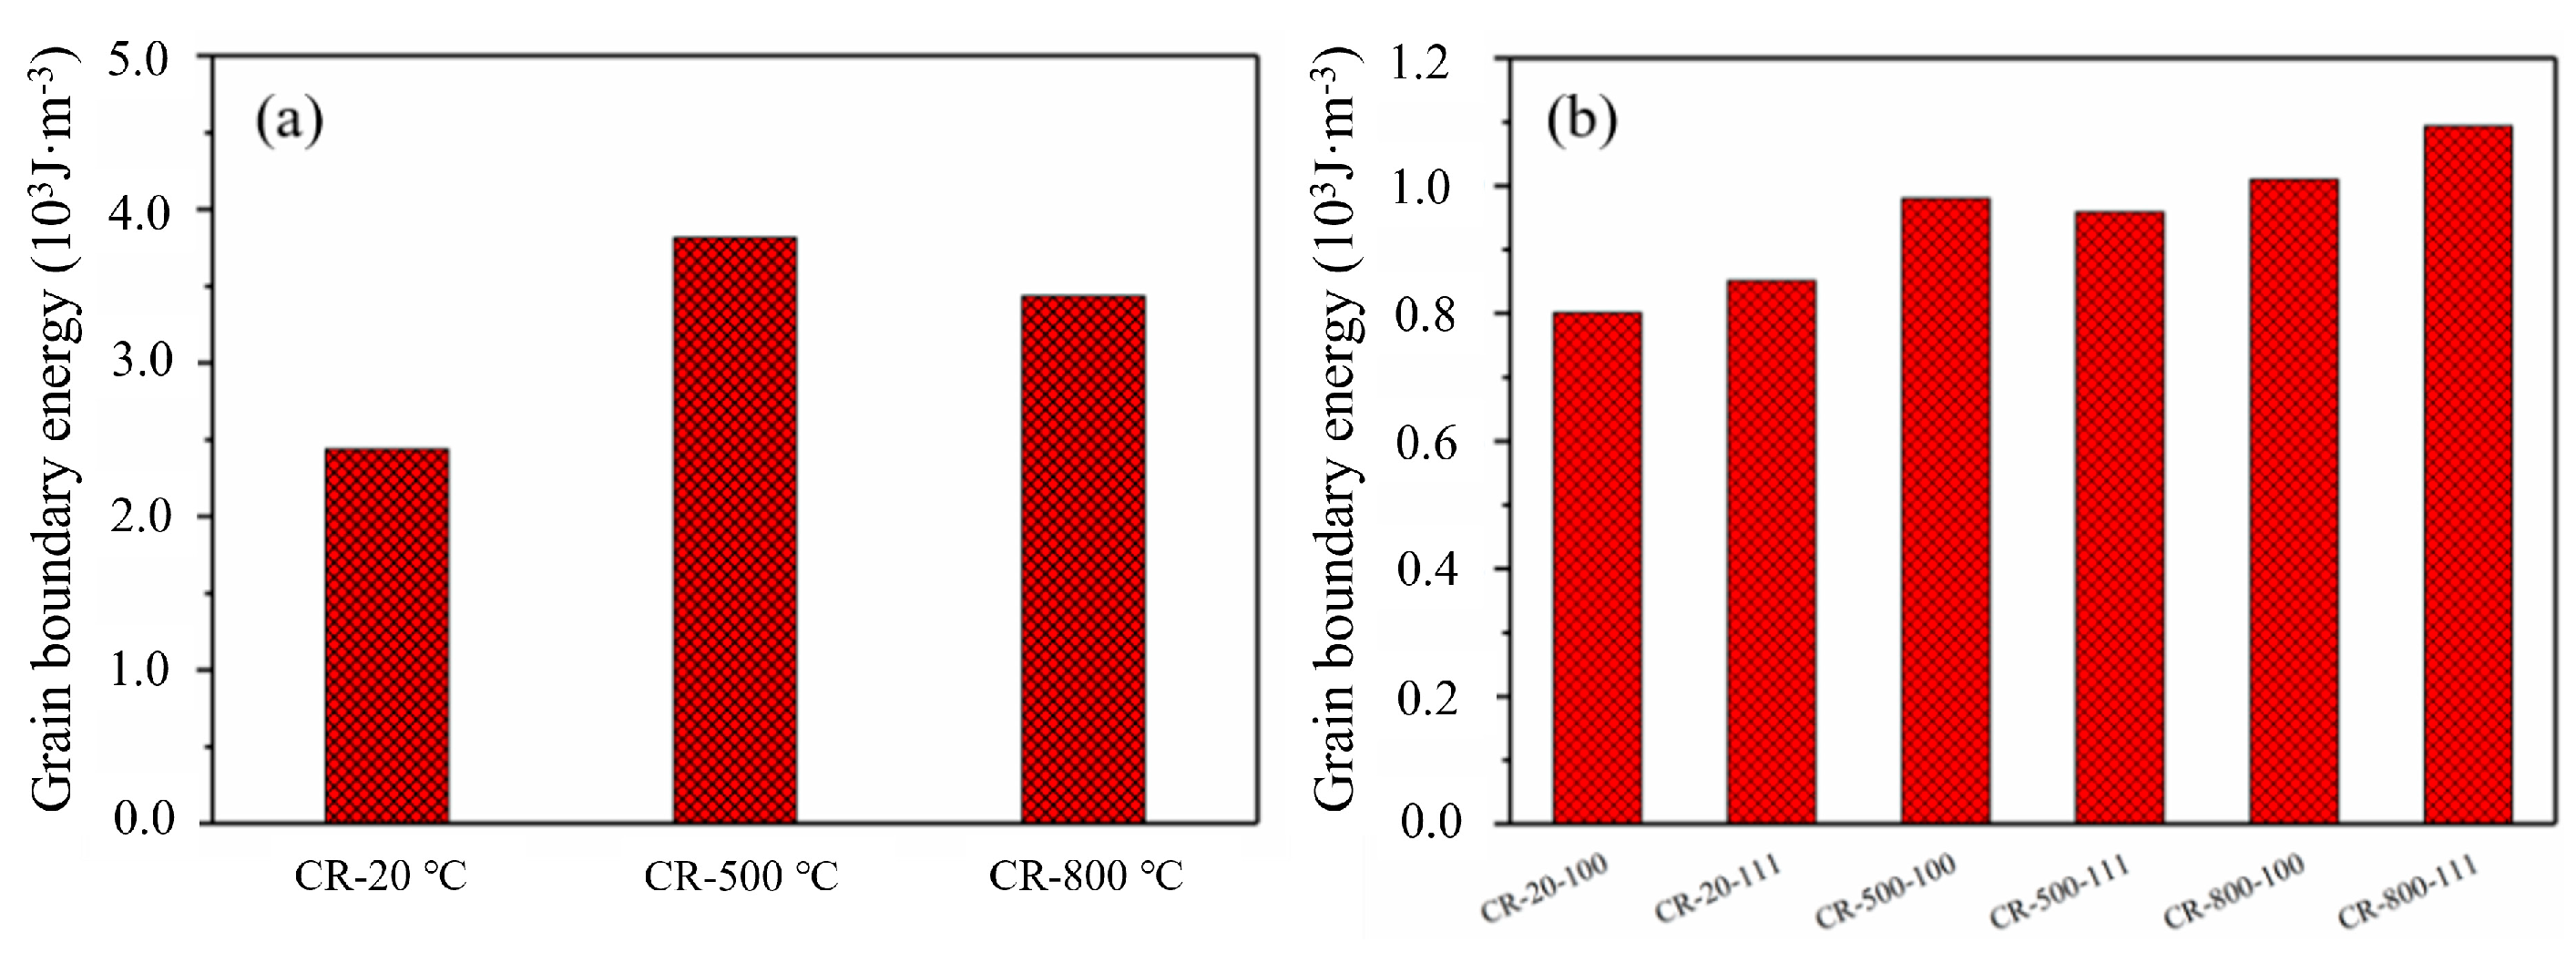
S V represents the area of the interface in the unit volume and E ρ 0 is the contribution of some scattered dislocations in the region between the dislocation boundaries. In the calculation, E ρ 0 is usually ignored because the energy of E ρ 0 is small for the middle and high SFE metals [37]. The statistical results of grain boundary energy in the deformed grain in the center region of CR-20 °C, CR-500 °C and CR-800 °C samples are provided in Figure 12a. The grain boundary energy of CR-500 °C and CR-800 °C samples is significantly higher than that of CR-20 °C samples. Compared with CR-500 °C and CR-800 °C samples, the CR-20 °C samples have a lower recovery effect on the deformed grain, which is composed of LAGBs and a high-density dislocation wall. However, the dynamic recovery appeared in the CR-500 °C and CR-800 °C samples, and the dislocation was rearranged, with the dislocation density decreasing gradually. Note that the sub-crystal produced by dynamic recovery is not thermodynamically stable and can be used as the crystal nucleus for subsequent recrystallization, which results in high grain boundary energy in deformed grains of the CR-500 °C and CR-800 °C samples. Further comparison displays that the grain boundary energy of CR-800 °C samples is slightly lower than that of CR-500 °C samples. Firstly, the CRSS of the material is lowered as the rolling temperature increases and more potential slip systems are activated. Secondly, the high shear strain in the CR-800 °C sample can further strengthen the splitting ability of deformed grains in the center region of the sample. The “weakening” of the dynamic recovery leads to the formation of relatively few sub-crystals, i.e., a larger proportion of LAGBs, within the deformed grains of the CR-800 °C samples. Thus, the relatively low grain boundary energy of CR-800 °C samples may be caused by the relatively high LAGBs within the deformed grains.
Statistical results of grain boundary energy in {111} and {100} deformed grains of CR-20 °C, CR-500 °C and CR-800 °C samples are shown in Figure 12b. It should be noted that {111} and {100} textures are the main texture components in the center region of corresponding samples. The grain boundary energy in {111} and {100} deformed grains of the CR-500 °C and CR-800 °C samples is higher than that of the CR-20 °C samples. Moreover, the grain boundary energy in {111} grains of CR-500 °C samples is slightly lower than that in {100} grains. The higher grain boundary energy in {100} grains may be attributed to the high degree of dynamic recovery within the grains, resulting in more thermodynamically unstable sub-grains. In addition, the grain boundary energy within the {111} grains of CR-20 °C and CR-800 °C samples is higher than that of the {100} grains. A higher proportion of LAGBs may be seen within the {111} deformed grains. The result is that the deformed grains contain relatively few thermodynamically unstable sub-grains, which in turn produce lower grain boundary energies.

4.3. Recrystallized Microstructure Homogeneity

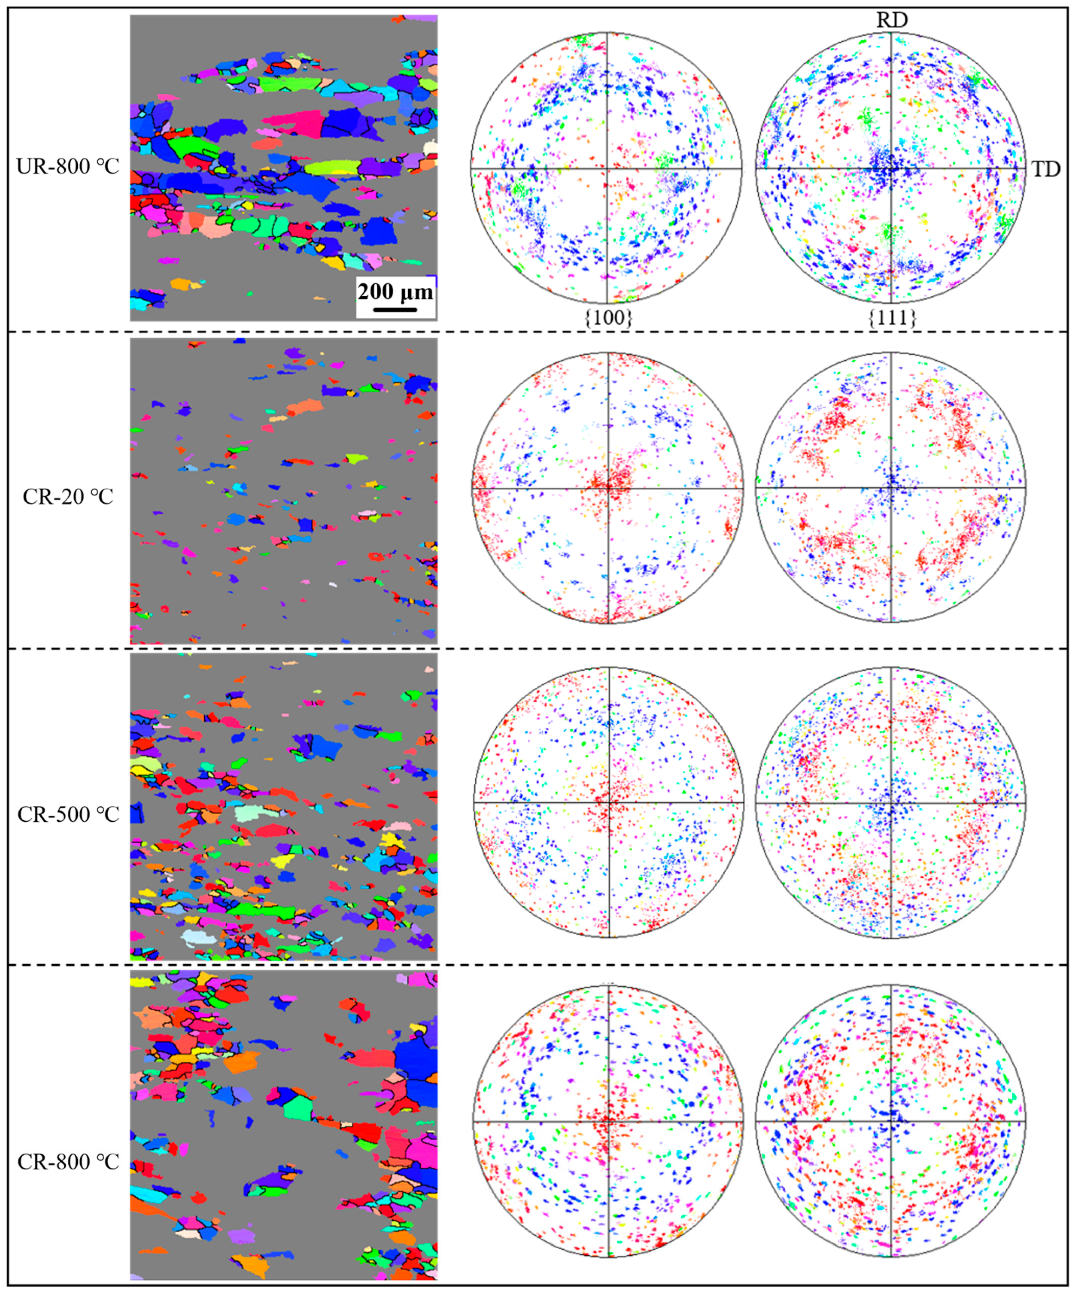
In order to further investigate the grain orientation distribution at the early stage of recrystallization of different samples, the recrystallized grains at the early stage of annealing are extracted with reference [38] for the preset conditions. New undistorted grains with an internal orientation difference of 0°–2° and grain size greater than 2 µm are classified as recrystallized new grains during the annealing. In order to observe the microstructure of initial recrystallization, the UR-800 °C, CR-20 °C, CR-500 °C and CR-800 °C samples are annealed at 1100 °C for 5 min, as shown in Figure 13. The UR-800 °C sample exhibits a high degree of recrystallization and large grain size. Randomly oriented and uniformly distributed grains at the beginning of recrystallization are observed in CR-20 °C, CR-500 °C and CR-800 °C samples. Furthermore, CR-500 °C and CR-800 °C samples are mainly composed of {111} and {100} new grains with a larger size than the CR-20 °C sample of pronounced {100} new grains. Comparatively, the UR-800 °C sample is characterized by the predominance of {111} recrystallized grains with obvious clustering.
The degree of splitting of {111} oriented grains, i.e., the dislocation density, is much higher than the {100} oriented grains in rolling deformation in Ta, especially in UR [9]. Furthermore, 135° cross rolling can effectively weaken this orientation-related deformation mechanism. Previous studies on metallic niobium single crystals found a strong orientation dependence on the deformation and recovery [39]. In contrast to the {100} orientation, the large number of dislocation substructures inside the {111} deformed grains are more likely to form effective nuclei with {111} orientation and coarse size during the dynamic recovery process in UR-800 °C samples. During subsequent annealing, these nuclei promote recrystallization of the {111} deformed matrix. However, not enough effective nuclei are formed in the {100} deformed grains, resulting in a weak recrystallization ability during annealing. As combined with Figure 12a and Figure 13, it can be found that the grain boundary energy of the deformed grains in CR-500 °C and CR-800 °C samples is higher than in the CR-20 °C sample. Moreover, the grain boundary energy of the {100} deformed grains in the CR-500 °C samples is even higher than that of the {111} deformed grains. These phenomena indicate that both the {111} and {100} deformed grains undergo dynamic recovery and many thermodynamic unstable sub-grains in the WCR samples. In other words, WCR is conducive to weakening the orientation-related recovery behavior of Ta plates. Deformed grains of WCR samples exhibit a large number of sub-grains (Table 2), which are formed by the merging of small sub-grains or the coarsening of individual large sub-grains. The effective nuclei formed are small in size and thermodynamically unstable at relatively low rolling temperatures (500 °C). Furthermore, a certain degree of tilting is found in these nuclei during the subsequent recrystallization annealing to accommodate the co-growth of surrounding grains. In particular, the frequency and extent of such tilting are increased in the case of inhomogeneous energy distribution, resulting in a large number of randomly oriented recrystallized grains in WCR samples [17,40], as displayed in Figure 13. However, the sub-grain coarsening may appear at a relatively high rolling temperature (800 °C), especially for the nuclei with {111} orientation. After complete annealing, the recrystallized grains of this orientation are coarse. In general, fine average grain size, a small difference in average grain size of different orientations and high content of randomly oriented grains are presented in the CR-500 °C and CR-800 °C samples after complete annealing.

5. Conclusions

In this paper, a new processing method combining warm rolling and 135° cross rolling was adopted to improve the deformation and recrystallization microstructure uniformity of Ta plates. The main results are summarized as follows:
(1)
A strong shear texture (ζ fiber texture) is exhibited on the surface layer of the WCR sample due to the strong friction between the sample surface and the roll. The center layer of the WCR sample is subjected to plane strain, resulting in the formation of γ and θ fiber textures with an alternating distribution. The randomly distributed texture occurs in the WCR sample with a quarter thickness, which is associated with the shear strength lower than the surface layer and grains not completely in the plane strain state;
(2)
The percentage of LAGBs within the deformed grains is significantly reduced in the CR-500 °C and CR-800 °C samples compared with the CR-20 °C and UR-800 °C samples. WCR can improve the rate of dislocation motion, causing small Peierls stress to be overcome;
(3)
The dynamic recovery is promoted in WCR samples, resulting in further rearrangement of dislocations and reduction in the dislocation density. The sub-grains produced by dynamic recovery are thermodynamically unstable and can act as nuclei for subsequent recrystallization, inducing high grain boundary energy within WCR samples;
(4)
Small differences in the average size of grains with different orientations are observed during recrystallization in the WCR samples. The CR-800 °C sample enjoys the smallest average grain size of 40.9 μm after annealing at 1050 °C for 60 min. Future experiments can optimize the rolling temperature during warm cross rolling and use lubricants to achieve a uniform microstructure of the sample along the thickness direction.

Author Contributions

Data curation, Y.D.; supervision, S.W., M.Z., S.Z., S.L. and X.Y.; writing—original draft preparation, Y.D.; writing—review and editing, S.W., M.Z., S.Z., S.L. and X.Y. All authors have read and agreed to the published version of the manuscript.

Funding

This research was funded by the National Natural Science Foundation of China (Grant No. 51421001), the Major “Scientific and Technological Innovation 2025” Project of Ningbo (No. 2018B10066), the Fundamental Research Funds for the Center Universities (No. 2022CDJCGJ001) and the Venture & Innovation Support Program for Chongqing Overseas Returnees (NO. cx2020088).

Data Availability Statement

The raw processed data required to reproduce these findings cannot be shared at this time as the data also form part of an ongoing study.

Conflicts of Interest

The authors declare no conflict of interest.

References

  1. Fan, H.; Liu, S.; Deng, C.; Wu, X.; Cao, L.; Liu, Q. Quantitative analysis: How annealing temperature influences recrystallization texture and grain shape in tantalum. Int. J. Refract. Met. Hard Mat. 2018, 72, 244–252. [Google Scholar] [CrossRef]
  2. Cardonne, S.M.; Kumar, P.; Michaluk, C.A.; Schwartz, H.D. Tantalum and its alloys. Int. J. Refract. Met. Hard Mat. 1995, 13, 187–194. [Google Scholar] [CrossRef]
  3. Lin, N.; Liu, S.; Liu, Y.; Fan, H.; Zhu, J.; Deng, C.; Liu, Q. Effects of asymmetrical rolling on through-thickness microstructure and texture of body-centered cubic (BCC) tantalum. Int. J. Refract. Met. Hard Mat. 2019, 78, 51–60. [Google Scholar] [CrossRef]
  4. Michaluk, C.A. Correlating discrete orientation and grain size to the sputter deposition properties of tantalum. J. Electron. Mater. 2002, 31, 2–9. [Google Scholar] [CrossRef]
  5. Sandim, H.R.Z.; Martins, J.P.; Pinto, A.L.; Padilha, A.F. Recrystallization of oligocrystalline tantalum deformed by cold rolling. Mater. Sci. Eng. A 2005, 392, 209–221. [Google Scholar] [CrossRef]
  6. Wright, S.I.; Gray, G.T.; Rollett, A.D. Textural and microstructural gradient effects on the mechanical behavior of a tantalum plate. Metall. Mater. Trans. A 1994, 25, 1025–1031. [Google Scholar] [CrossRef]
  7. Zhu, J.; Liu, S.; Yuan, X.; Liu, Q. Comparing the Through-Thickness Gradient of the Deformed and Recrystallized Microstructure in Tantalum with Unidirectional and Clock Rolling. Materials 2019, 12, 169. [Google Scholar] [CrossRef]
  8. Zhu, J.; Liu, S.; Long, D.; Orlov, D.; Liu, Q. Pass number dependence of through-thickness microstructure homogeneity in tantalum sheets under the change of strain path. Mater. Charact. 2020, 160, 110076. [Google Scholar] [CrossRef]
  9. Zhu, J.; Liu, S.; Yang, S.; Long, D.; Liu, Y.; Yuan, X.; Orlov, D. Strain dependence of deformation and recrystallization microstructure homogeneity in clock-rolled tantalum sheets. Mater. Charact. 2020, 161, 110165. [Google Scholar] [CrossRef]
  10. Zhu, J.; Liu, S.; Yang, S.; Liu, Y.; Chapuis, A. Beneficial clock-rolling cycles on the microstructure uniformity of {111} grains in tantalum sheets. Prog. Nat. Sci. Mater. 2020, 30, 124–127. [Google Scholar] [CrossRef]
  11. Xiang, K.Y.; Lei, X.C.; Ding, L.P.; Jia, Z.; Yang, X.; Liu, Q. Optimizing mechanical property of spray formed Al-Zn-Mg-Cu alloy by combination of homogenization and warm-rolling. Mater. Sci. Eng. A 2022, 75, 1509–1524. [Google Scholar] [CrossRef]
  12. Saha, J.; Ummethala, G.; Malladi, S.R.K.; Bhattacharjee, P.P. Severe warm-rolling mediated microstructure and texture of equiatomic CoCrFeMnNi high entropy alloy: A comparison with cold-rolling. Intermetallics 2021, 129, 107029. [Google Scholar] [CrossRef]
  13. Hao, Y.L.; Zhang, Z.B.; Li, S.J.; Yang, R. Microstructure and mechanical behavior of a Ti-24Nb-4Zr-8Sn alloy processed by warm swaging and warm rolling. Acta Mater. 2012, 60, 2169–2177. [Google Scholar] [CrossRef]
  14. Kang, U.G.; Lee, H.J.; Nam, W.J. The achievement of high strength in an Al 6061 alloy by the application of cryogenic and warm rolling. J. Mater. Sci. 2012, 22, 7883–7887. [Google Scholar] [CrossRef]
  15. Cheng, L.; Cai, Q.; Lv, J.; Yu, W.; Miura, H. Superdense microbands strengthening of textured low alloy ferritic steel. J. Alloys Compd. 2018, 746, 482–4889. [Google Scholar] [CrossRef]
  16. Li, Y.; Du, Z.; Fan, J.; Lv, Y.; Lv, Y.; Ye, L.; Li, P. Microstructure and texture evolution in warm-rolled fine-grained tungsten. Int. J. Refract. Met. Hard Mat. 2021, 101, 105690. [Google Scholar] [CrossRef]
  17. Tanaka, H.; Minoda, T.; Esaki, H.; Shibue, K.; Yoshida, H. Grain Refinement of AA7475 Based Aluminum Alloy Sheets by a Warm Rolling with Heated Rolls and its Effect on Texture and Mechanical Properties. Mater. Sci. Forum 2002, 396–402, 499–504. [Google Scholar] [CrossRef]
  18. Murty, S.V.S.N.; Nayan, N.; Kumar, P.; Narayanan, P.R.; Sharma, S.C.; George, K.M. Microstructure–texture–mechanical properties relationship in multi-pass warm rolled Ti–6Al–4V Alloy. Mater. Sci. Eng. A 2014, 589, 174–181. [Google Scholar] [CrossRef]
  19. Chun, Y.B.; Hwang, S.K. Static recrystallization of warm-rolled pure Ti influenced by microstructural inhomogeneity. Acta Mater. 2008, 56, 369–379. [Google Scholar] [CrossRef]
  20. Gatti, J.R.; Bhattacharjee, P.P. Annealing textures of severely cold and warm-rolled Al–2.5 wt.%Mg alloy. J. Alloys Compd. 2014, 615, 950–961. [Google Scholar] [CrossRef]
  21. Guo, W.; Yi, Y.; Huang, S.; He, H.; Fang, J. Effects of Warm Rolling Deformation on the Microstructure and Ductility of Large 2219 Al–Cu Alloy Rings. Met. Mater. Int. 2020, 21, 56–68. [Google Scholar] [CrossRef]
  22. Deng, C.; Liu, S.F.; Hao, X.B.; Ji, J.L.; Zhang, Z.Q.; Liu, Q. Orientation dependence of stored energy release and microstructure evolution in cold rolled tantalum. Int. J. Refract. Met. Hard Mat. 2014, 46, 24–29. [Google Scholar] [CrossRef]
  23. Long, D.; Liu, S.; Zhu, J.; Liu, Y.; Zhou, S.; Yuan, X.; Orlov, D. Improving Texture and Microstructure Homogeneity in High-Purity Ta Sheets by Warm Cross Rolling and Annealing. Metals 2021, 11, 1665. [Google Scholar] [CrossRef]
  24. Mishra, S.; Kulkarni, K.; Gurao, N.P. Effect of crystallographic texture on precipitation induced anisotropy in an aluminium magnesium silicon alloy. Mater. Des. 2015, 84, 507–519. [Google Scholar] [CrossRef]
  25. Huh, M.Y.; Engler, O.; Raabe, D. On the Influence of Cross-Rolling on Shear Band Formation and Texture Evolution in Low Carbon Steel Sheets. Textures Microstruct. 1995, 24, 225–237. [Google Scholar] [CrossRef]
  26. Fan, H.Y.; Liu, S.F.; Li, L.J.; Deng, C.; Liu, Q. Largely alleviating the orientation dependence by sequentially changing strain paths. Mater. Des. 2016, 97, 464–472. [Google Scholar] [CrossRef]
  27. Seeger, A.; Hollang, L. The flow-stress asymmetry of ultra-pure molybdenum single crystals. Mater. Trans. JIM 2000, 41, 141–151. [Google Scholar] [CrossRef]
  28. Liu, X.; Golubov, S.I.; Woo, C.H.; Huang, H. Glide of edge dislocations in tungsten and molybdenum. Mater. Sci. Eng. A 2004, 365, 96–100. [Google Scholar] [CrossRef]
  29. Woodward, C.; Rao, S.I. Ab-initio simulation of isolated screw dislocations in bcc Mo and Ta. Philos. Mag. 2001, 81, 1305–1316. [Google Scholar] [CrossRef]
  30. Mendis, B.G.; Mishin, Y.; Hartley, C.S. Use of the Nye tensor in analyzing HREM images of bcc screw dislocations. Philos. Mag. 2006, 86, 4607–4640. [Google Scholar] [CrossRef]
  31. Po, G.; Cui, Y.; Rivera, D.; Cereceda, D.; Swinburne, T.D.; Marian, J.; Ghoniem, N. A phenomenological dislocation mobility law for bcc metals. Acta Mater. 2016, 119, 123–135. [Google Scholar] [CrossRef]
  32. Heidarzadeh, A.; Saeid, T.; Klemm, V.; Chabok, A.; Pei, Y. Effect of stacking fault energy on the restoration mechanisms and mechanical properties of friction stir welded copper alloys. Mater. Des. 2019, 162, 185–197. [Google Scholar] [CrossRef]
  33. Gröger, R.; Vitek, V. Impact of non-Schmid stress components present in the yield criterion for bcc metals on the activity of {110}<111> slip systems. Comput. Mater. Sci. 2019, 159, 297–305. [Google Scholar] [CrossRef]
  34. Pegel, B. Stacking Faults on {110} Planes in the B.C.C. Lattice. Phys. Status Solidi B 1968, 28, 603–609. [Google Scholar] [CrossRef]
  35. Read, W.T.; Shockley, W. Dislocation Models of Crystal Grain Boundarm. Phys. Rev. 1950, 78, 275–289. [Google Scholar] [CrossRef]
  36. Lu, C.H.; Remington, B.A.; Maddox, B.R.; Kad, B.; Park, H.S.; Kawasaki, M.; Langdon, T.G.; Meyers, M.A. Laser compression of nanocrystalline tantalum. Acta Mater. 2013, 61, 7767–7780. [Google Scholar] [CrossRef]
  37. Godfrey, A.; Hansen, N.; Jensen, D.J. Microstructural-Based Measurement of Local Stored Energy Variations in Deformed Metals. Metall. Mater. Trans. A 2007, 38, 2329–2339. [Google Scholar] [CrossRef]
  38. Kim, D.I.; Kim, J.S.; Kim, J.H.; Choi, S.-H. A study on the annealing behavior of Cu-added bake-hardenable steel using an in situ EBSD technique. Acta Mater. 2014, 68, 9–18. [Google Scholar] [CrossRef]
  39. Srinivasan, R.; Viswanathan, G.B.; Levit, V.I.; Fraser, H.L. Orientation effect on recovery and recrystallization of cold rolled niobium single crystals. Mater. Sci. Eng. A 2009, 507, 179–189. [Google Scholar] [CrossRef]
  40. Kuhlmann-Wilsdorf, D. Modelling of plastic deformation via segmented voce curves, linked to characteristic LEDS’s which are generated by LEDS transformations between workhardening stages. Phys. Status Solidi B 1995, 149, 131–153. [Google Scholar] [CrossRef]
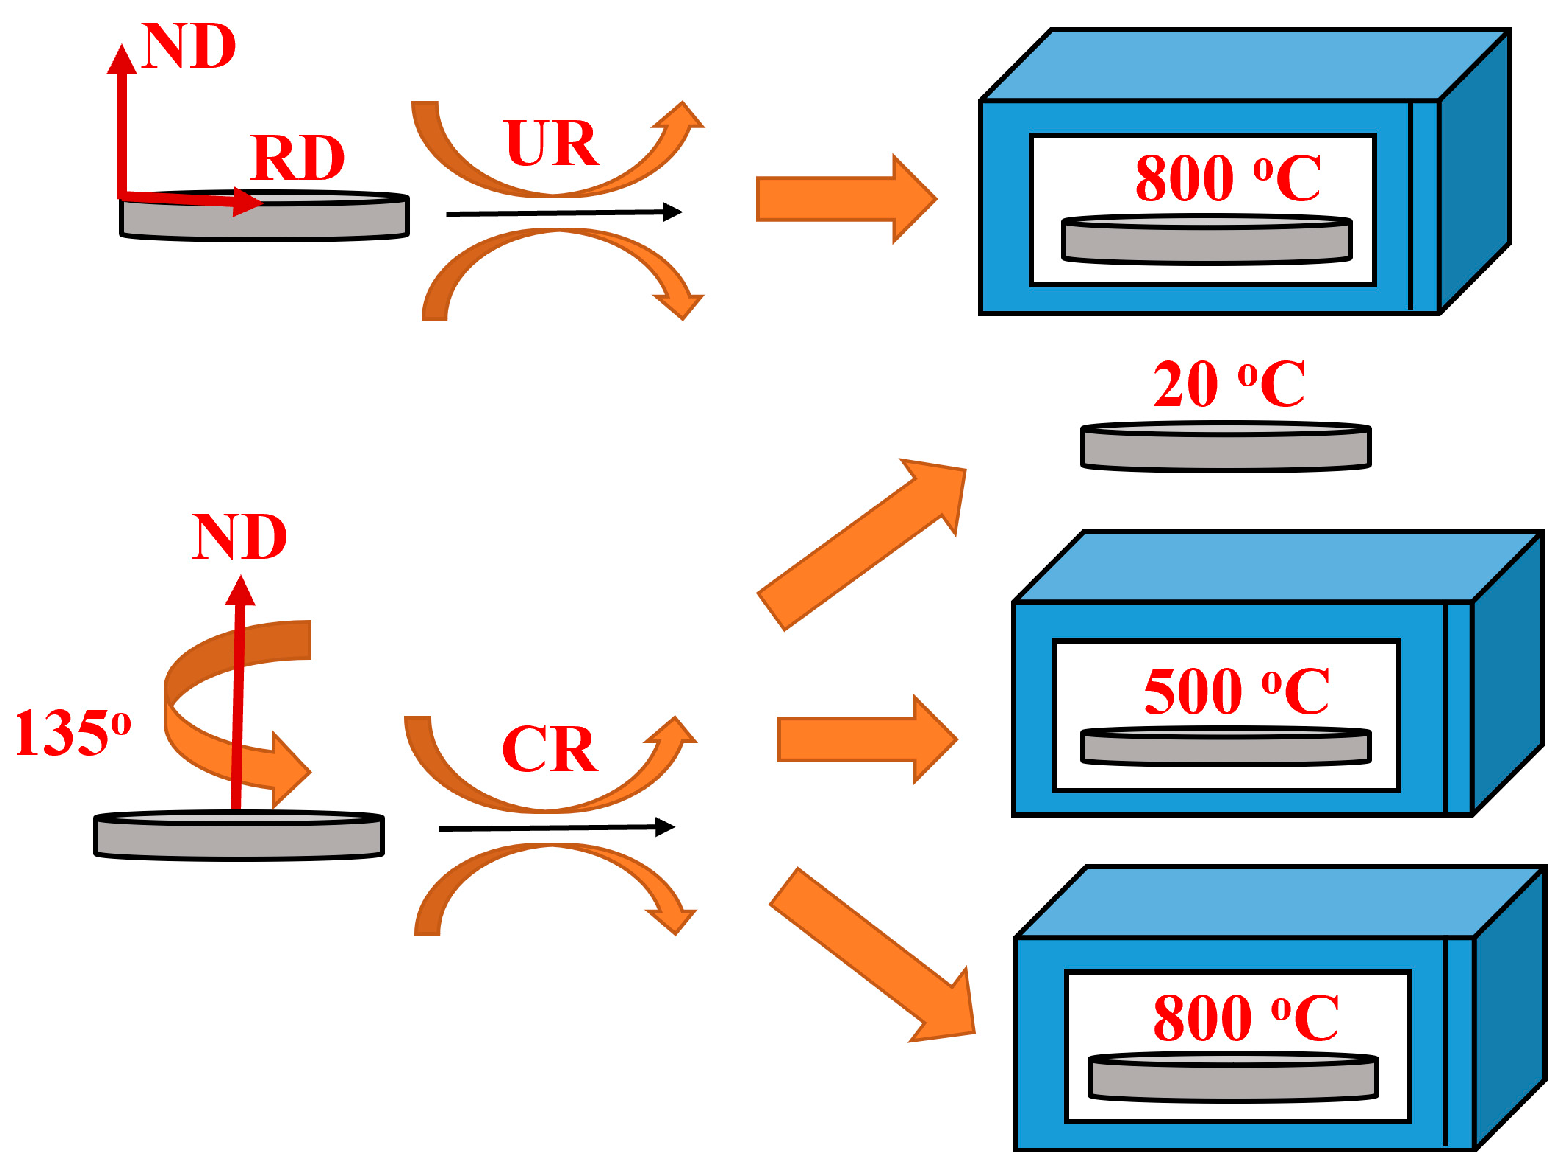
Figure 1. Schematic diagrams of the unidirectional rolling (UR) and cross rolling (CR) in Ta.
Metals 13 00838 g001
Figure 2. Detection surface of XRD and EBSD in this study.
Metals 13 00838 g002
Figure 3. Orientation position in sections of φ2 = 45°.
Metals 13 00838 g003
Figure 4. The corresponding ODF section of φ2 = 45° in the initial sample along thickness. Note S, Q and C represent the surface, quarter thickness and center layer, respectively.
Metals 13 00838 g004
Figure 5. (a) The grain size distribution of the initial Ta plate; (b) the average grain size distribution for different grain orientations.
Metals 13 00838 g005
Figure 6. The texture distribution of sample along the thickness processed by 800 °C warm unidirectional rolling (UR-800 °C), cold 135° cross rolling (CR-20 °C), 500 °C warm 135° cross rolling (CR-500 °C) and 135° cross 800 °C warm rolling (CR-800 °C).
Metals 13 00838 g006
Figure 7. The normal direction (ND) orientation maps of rolled Ta sheets near the surface region processed by (a) UR-800 °C, (b) CR-20 °C, (c) CR-500 °C and (d) CR-800 °C.
Metals 13 00838 g007
Figure 8. The normal direction (ND) orientation maps of rolled Ta sheets in the center region processed by (a) UR-800 °C, (b) CR-20 °C, (c) CR-500 °C and (d) CR-800 °C.
Metals 13 00838 g008
Figure 9. The recrystallized microstructure evolution of UR-800 °C, CR-20 °C, CR-500 °C and CR-800 °C samples annealed at 1050 °C for 60 min, 90 min and 120 min.
Metals 13 00838 g009
Figure 10. The recrystallized microstructure evolution of UR-800 °C, CR-20 °C, CR-500 °C and CR-800 °C samples annealed at 1100 °C for 30 min and 60 min.
Metals 13 00838 g010
Figure 11. (a) The average grain size distribution and (b) the volume fraction of {111}, {110}, {100} and randomly oriented grains for UR-800 °C, CR-20 °C, CR-500 °C and CR-800 °C samples annealed at 1050 °C for 60 min. (c) The average grain size distribution and (d) the volume fraction of {111}, {110}, {100} and randomly oriented grains for respective samples annealed at 1100 °C for 30 min.
Metals 13 00838 g011
Figure 12. (a) The grain boundary energy distribution of sample processed by CR-20 °C, CR-500 °C and CR-800 °C; (b) the corresponding grain boundary energy for {100} and {111} textures of respective samples.
Metals 13 00838 g012
Figure 13. The recrystallized microstructure distribution of UR-800 °C, CR-20 °C, CR-500 °C and CR-800 °C samples annealed at 1100 °C for 5 min.
Metals 13 00838 g013
Table 1. Rolling scheme of unidirectional rolling (UR) and cross rolling (CR).
Rolling PassThickness After
Rolling/mm
Single Pass
Reduction/%
Total Rolling
Reduction/%
110.512.512.5
29.212.423.3
38.210.931.6
47.49.738.3
56.79.444.1
6610.450
75.41055
84.811.160
94.310.464.2
104.07.066.6
113.85.068.3
123.65.370
Table 2. The misorientation distribution of samples processed by UR-800 °C, CR-20 °C, CR-500 °C and CR-500 °C.
SamplesLow-Angle Grain Boundaries
(1.5° < θ < 5.5°)
Sub-Grain Boundaries
(5.5° < θ < 15°)
UR-800 °C84.9%13.8%
CR-20 °C73.9%16.6%
CR-500 °C61.6%27.7%
CR-500 °C64.5%26.7%
Disclaimer/Publisher’s Note: The statements, opinions and data contained in all publications are solely those of the individual author(s) and contributor(s) and not of MDPI and/or the editor(s). MDPI and/or the editor(s) disclaim responsibility for any injury to people or property resulting from any ideas, methods, instructions or products referred to in the content.