3.1. Morphological Analysis of the Worn Surfaces
The wear mechanisms of the Al nanocomposites reinforced with graphene nanoplatelets and annealed with nanosized Al4C3 can be complex and depend on various factors, such as the composition of the nanocomposites, the testing conditions and the nature of the contact between the material and the counterbody. The SEM images can provide insight into the mechanisms responsible for the observed wear. For example, the images may reveal the presence of wear debris, cracks, scratches, or other features on the worn surface, which can indicate the type of wear mechanism that occurred. The EDS analysis can also provide complementary information by identifying the elemental composition of the worn surface, which can help determine the mechanisms responsible for the wear.
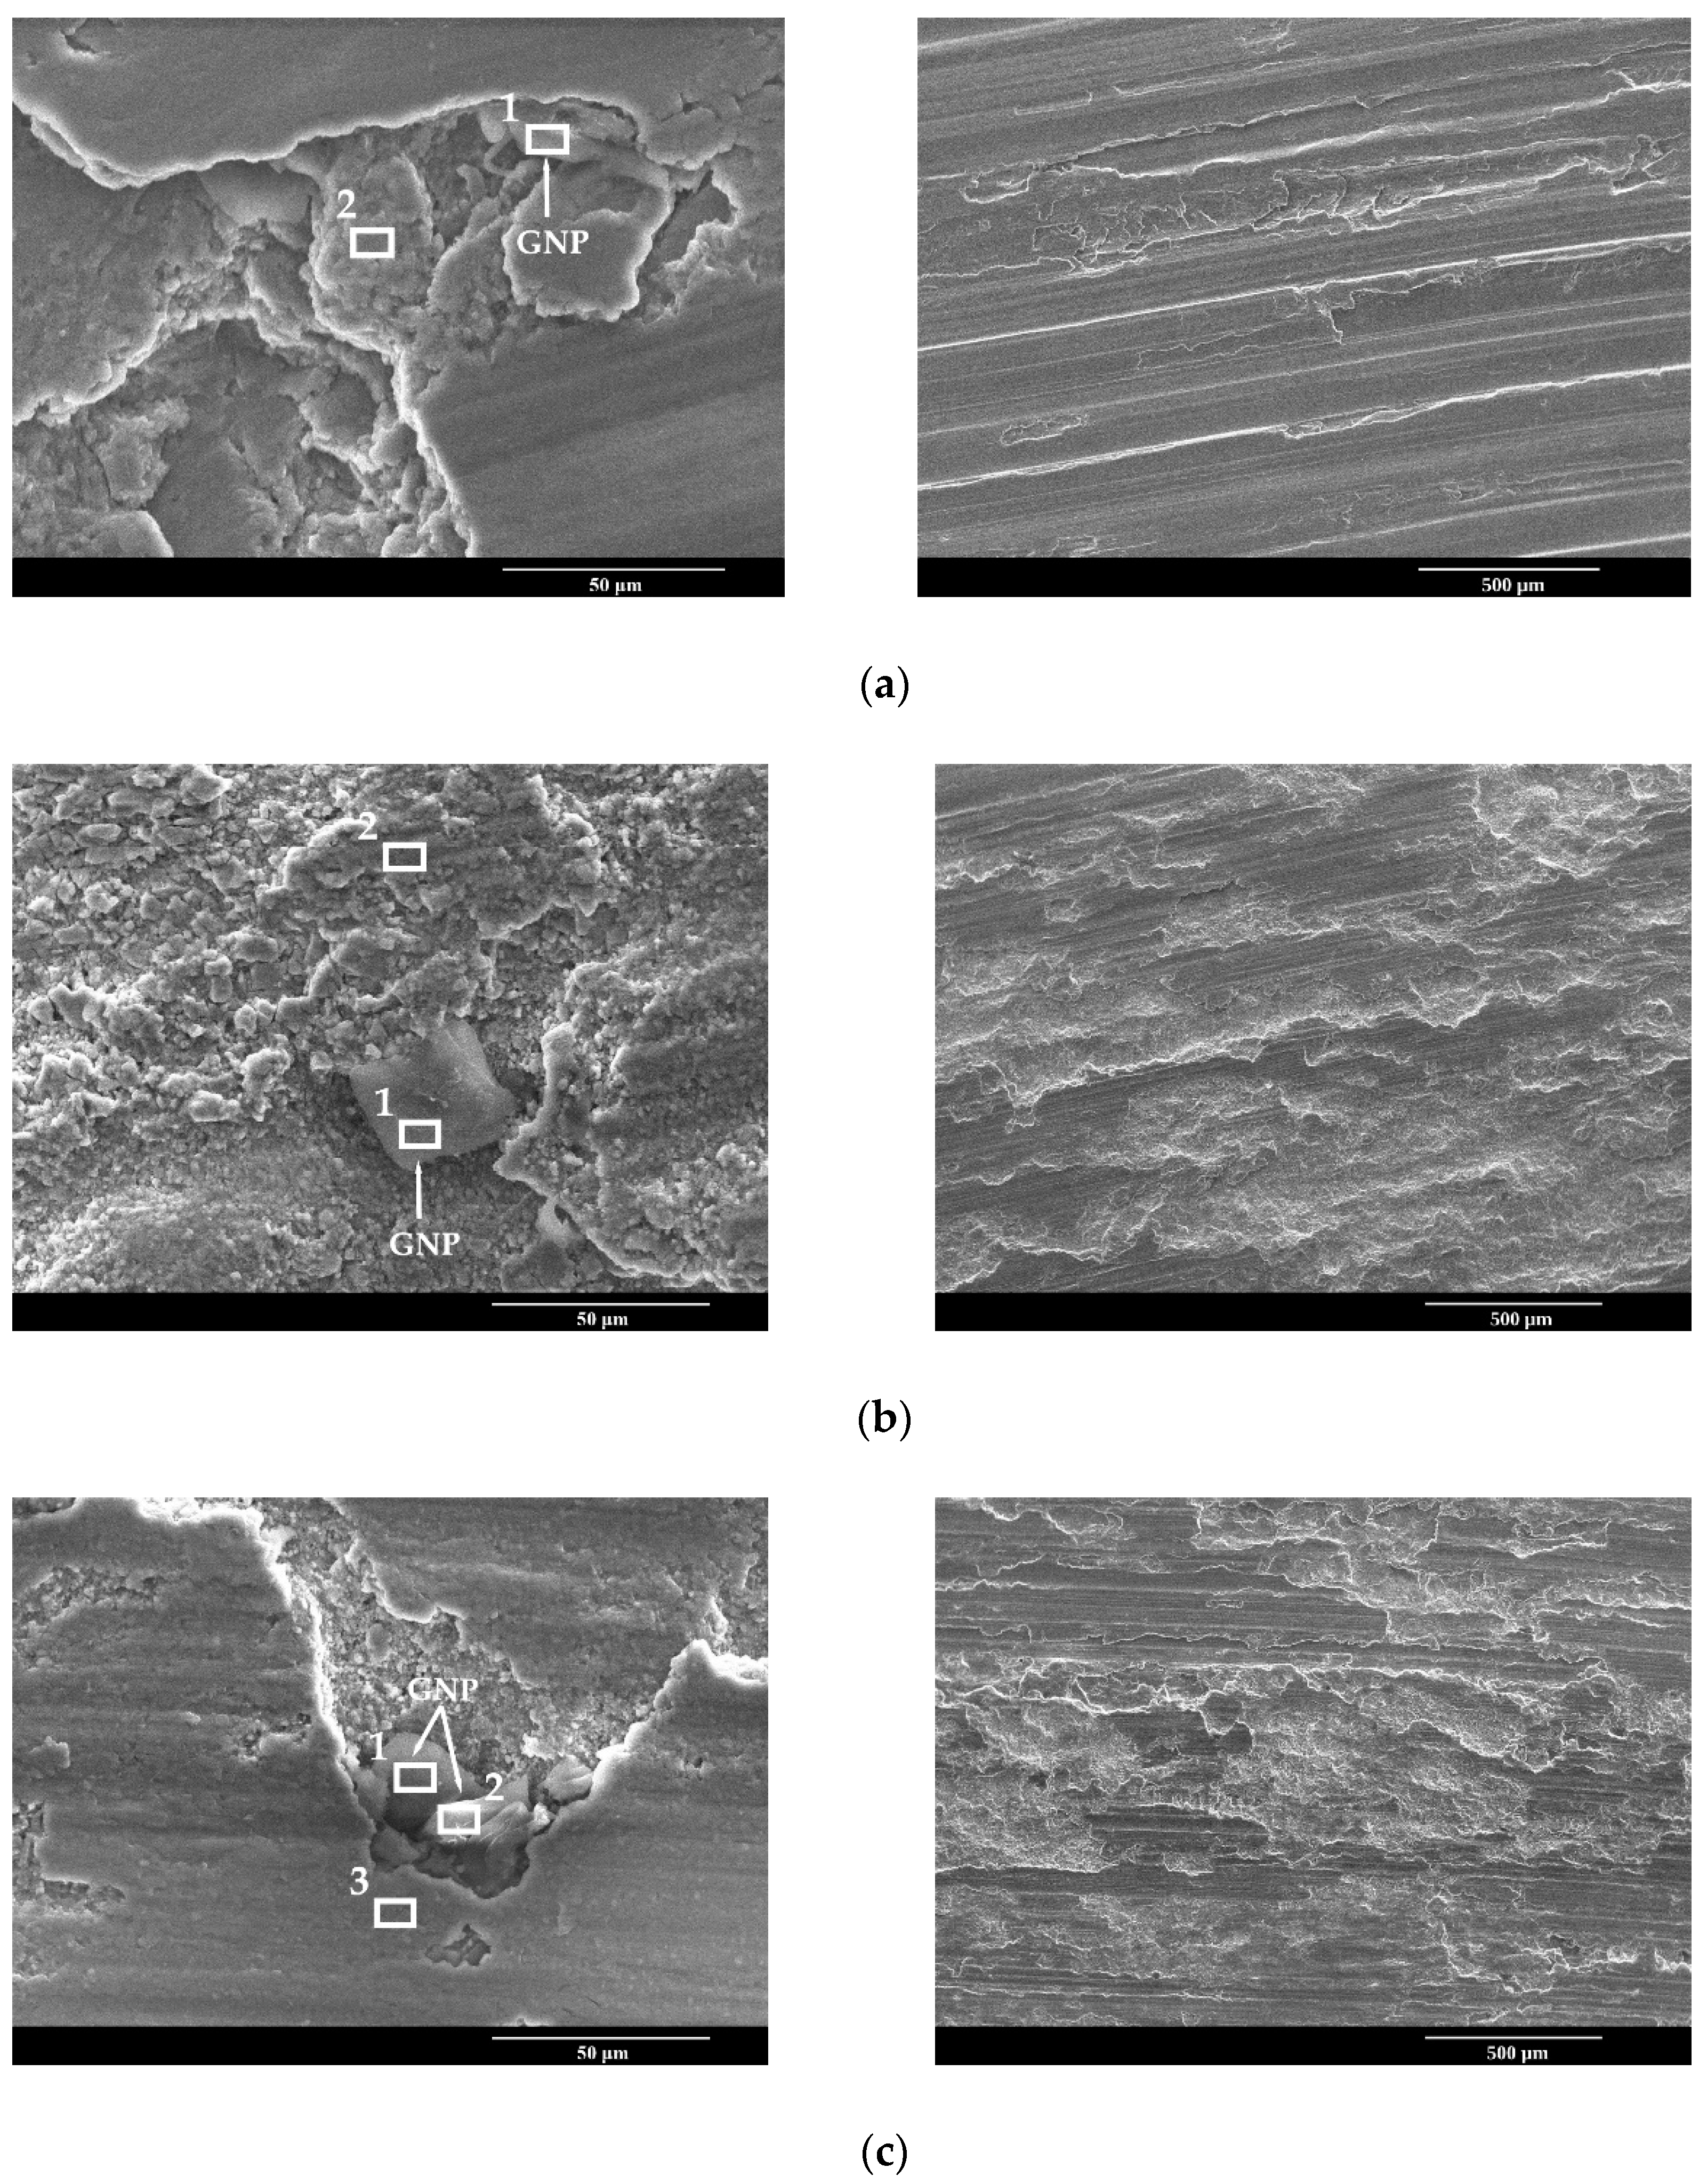
Figure 4a–f presents the SEM images of the test specimen after the pin-on-disk tests, with the distinct zones indicated by the markers. These images were captured following the wear experiments conducted under the following conditions: a linear speed of 0.9 m/s, a sliding distance of 540 m and a load of 30 N. The results of the EDS analysis are shown in
Table 1,
Table 2,
Table 3,
Table 4,
Table 5 and
Table 6 and
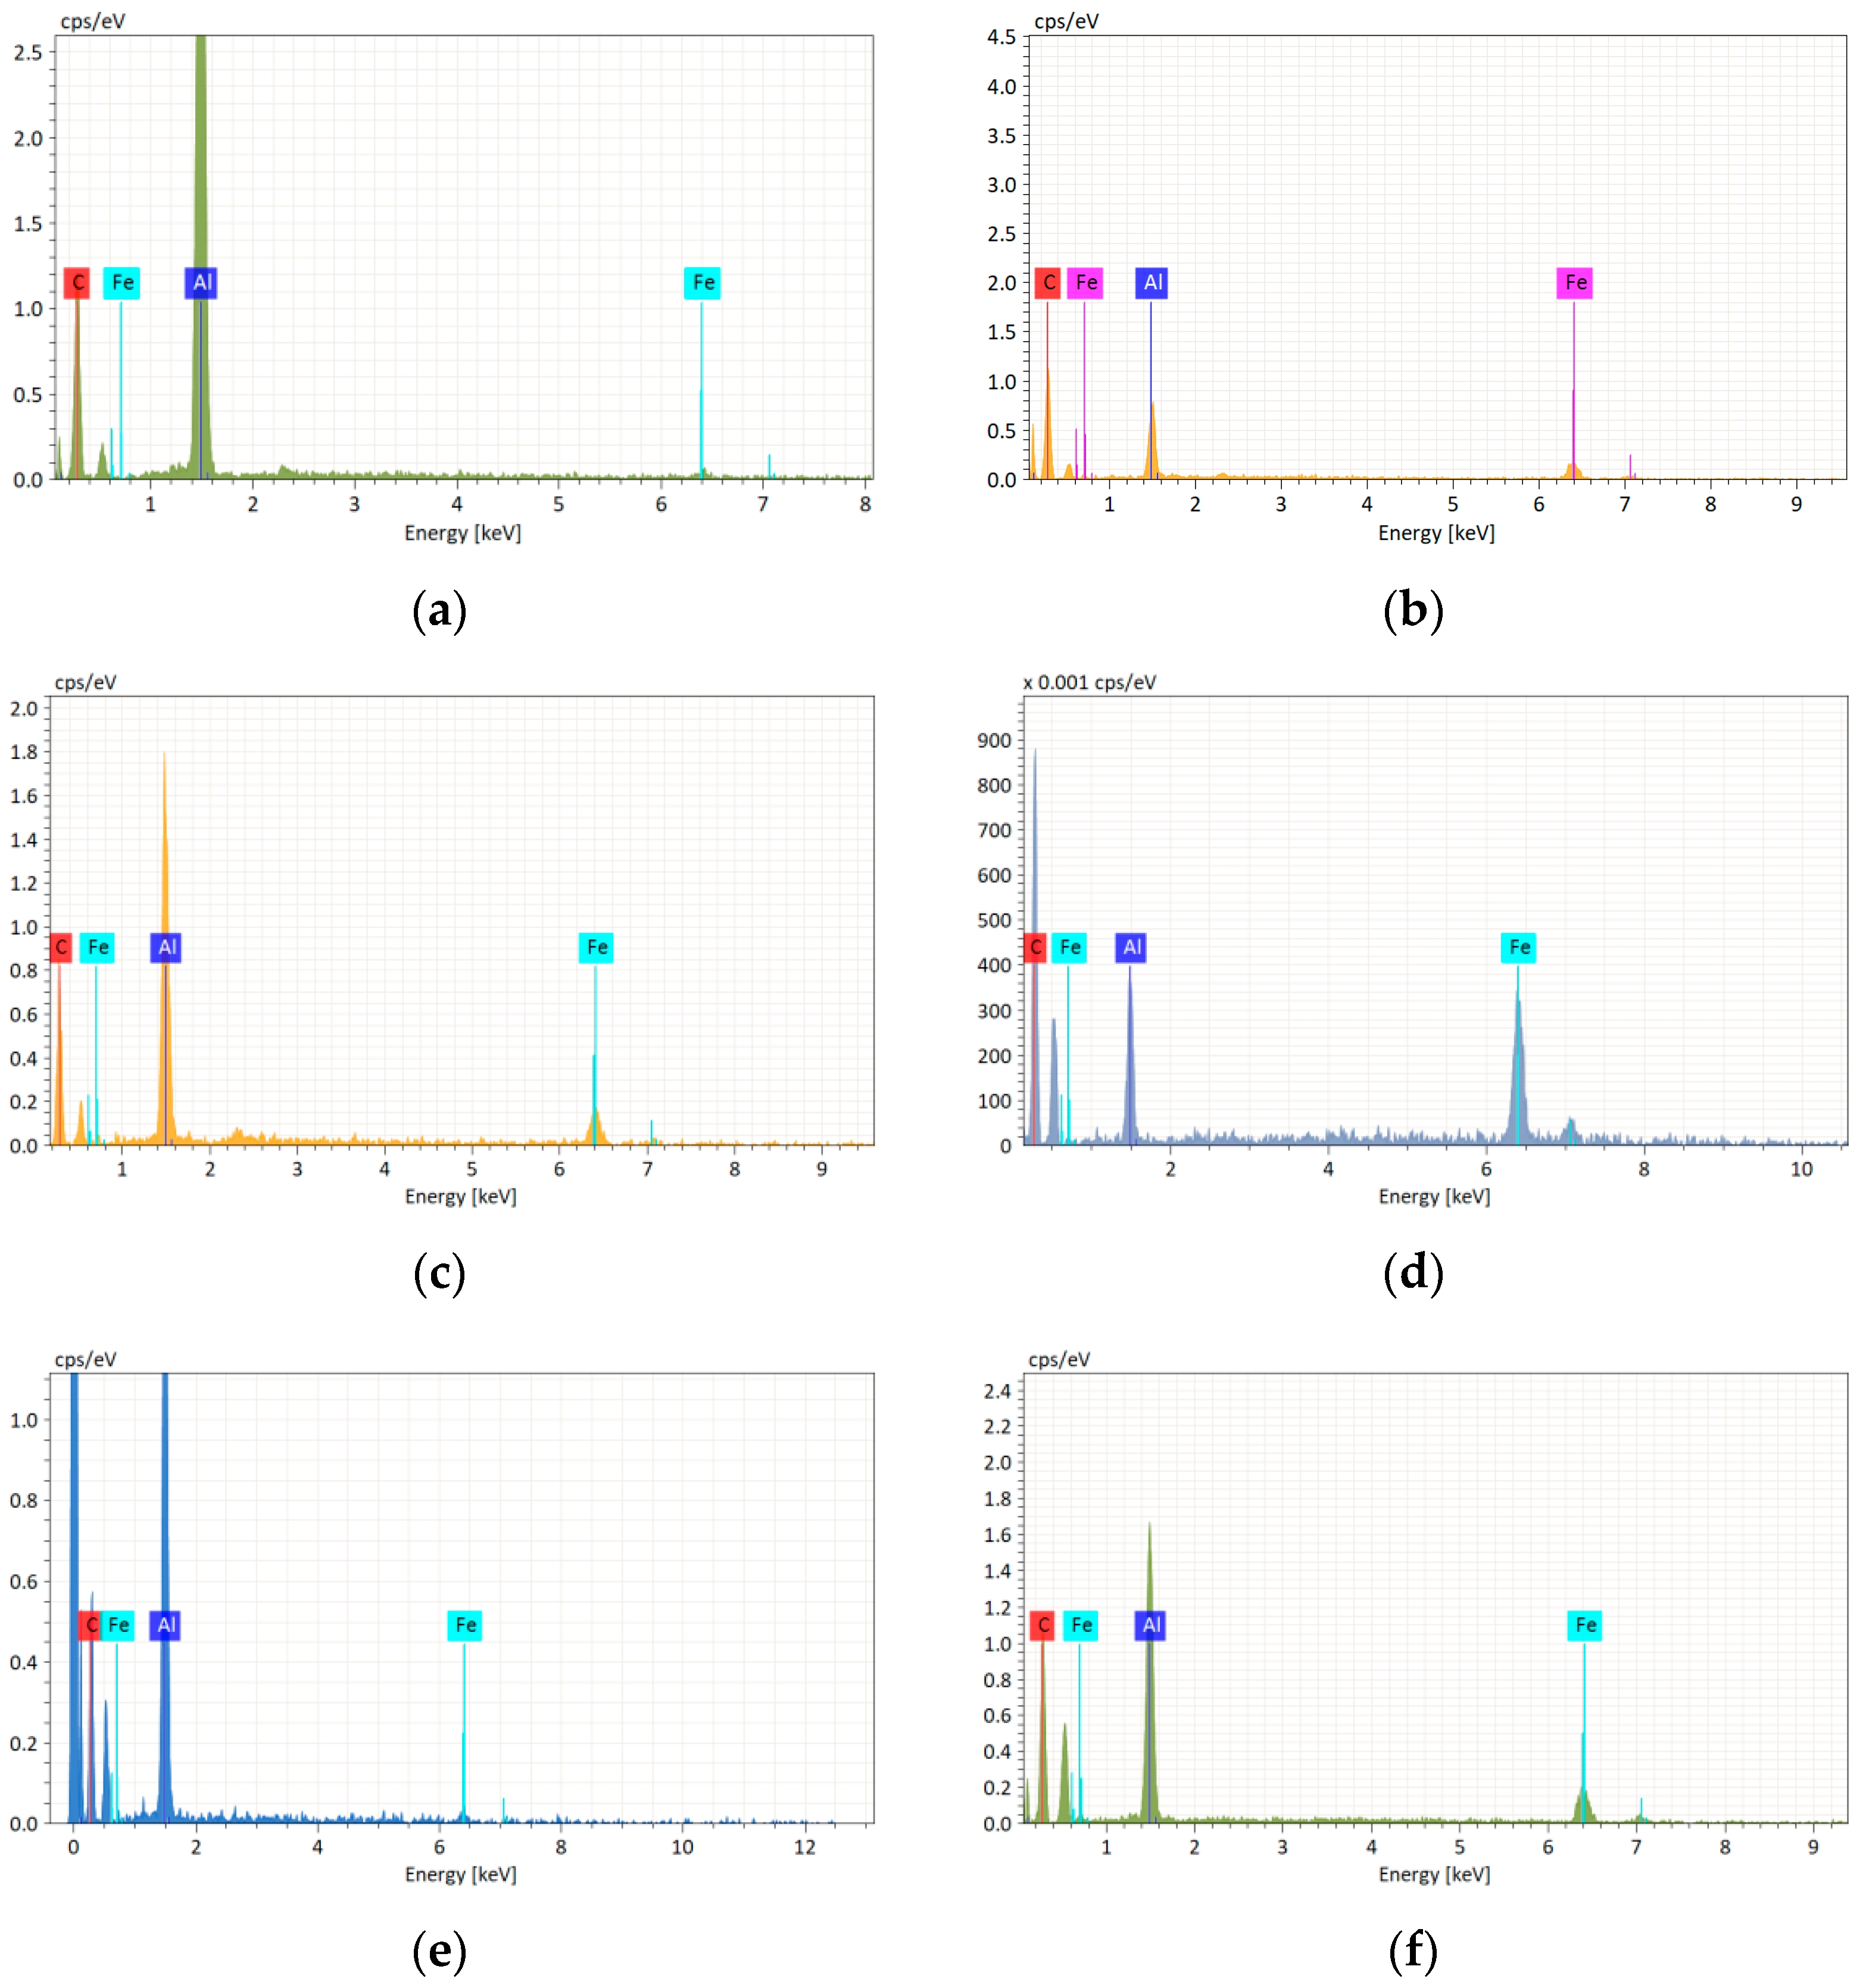
Figure 5a–f.
Figure 4a shows the worn surface of the Al with 0.1 wt.% GNPs, which exhibited a smooth appearance with shallow grooves and some debris. The EDS analysis (
Table 1 and
Figure 5a) indicated that zone 1 had a high carbon content of 82.74%, which suggested that GNPs were embedded in the surface and acted as solid lubricants, reducing the friction and wear. Zone 2 had a low C content and a high Al content of 97.70%, which indicated that it was part of the contact zone.
Figure 4b shows the worn surface of the Al with 0.5 wt.% GNPs, which exhibited a rougher appearance with deeper grooves and more debris. The EDS analysis (
Table 2 and
Figure 5b) indicated that zone 1 had a high C content of 77.57%, which suggested that GNPs were also embedded in the surface, but less effectively than in
Figure 4a. Zone 2 had a low C content and a high Fe content of 43.17%, which indicated that it was mainly composed of iron from the counterface, forming a tribofilm that increased the friction and wear.
Figure 4c shows the worn surface of the Al with 1.1 wt.% GNPs, which exhibited a very rough appearance with severe grooves, large debris and cracks. The EDS analysis (
Table 3 and
Figure 5c) indicated that zone 1 had a very high C content of 87.34%, which suggested that GNPs were agglomerated on the surface, forming abrasive particles that increased the friction and wear. Zone 2 had a moderate C content of 74.09%, which suggested that GNPs were partially embedded in the surface, but not enough to provide lubrication. Zone 3 had a low C content and a high Fe content of 24.91%, which indicated that it was also mainly composed of iron oxide from the counterface.
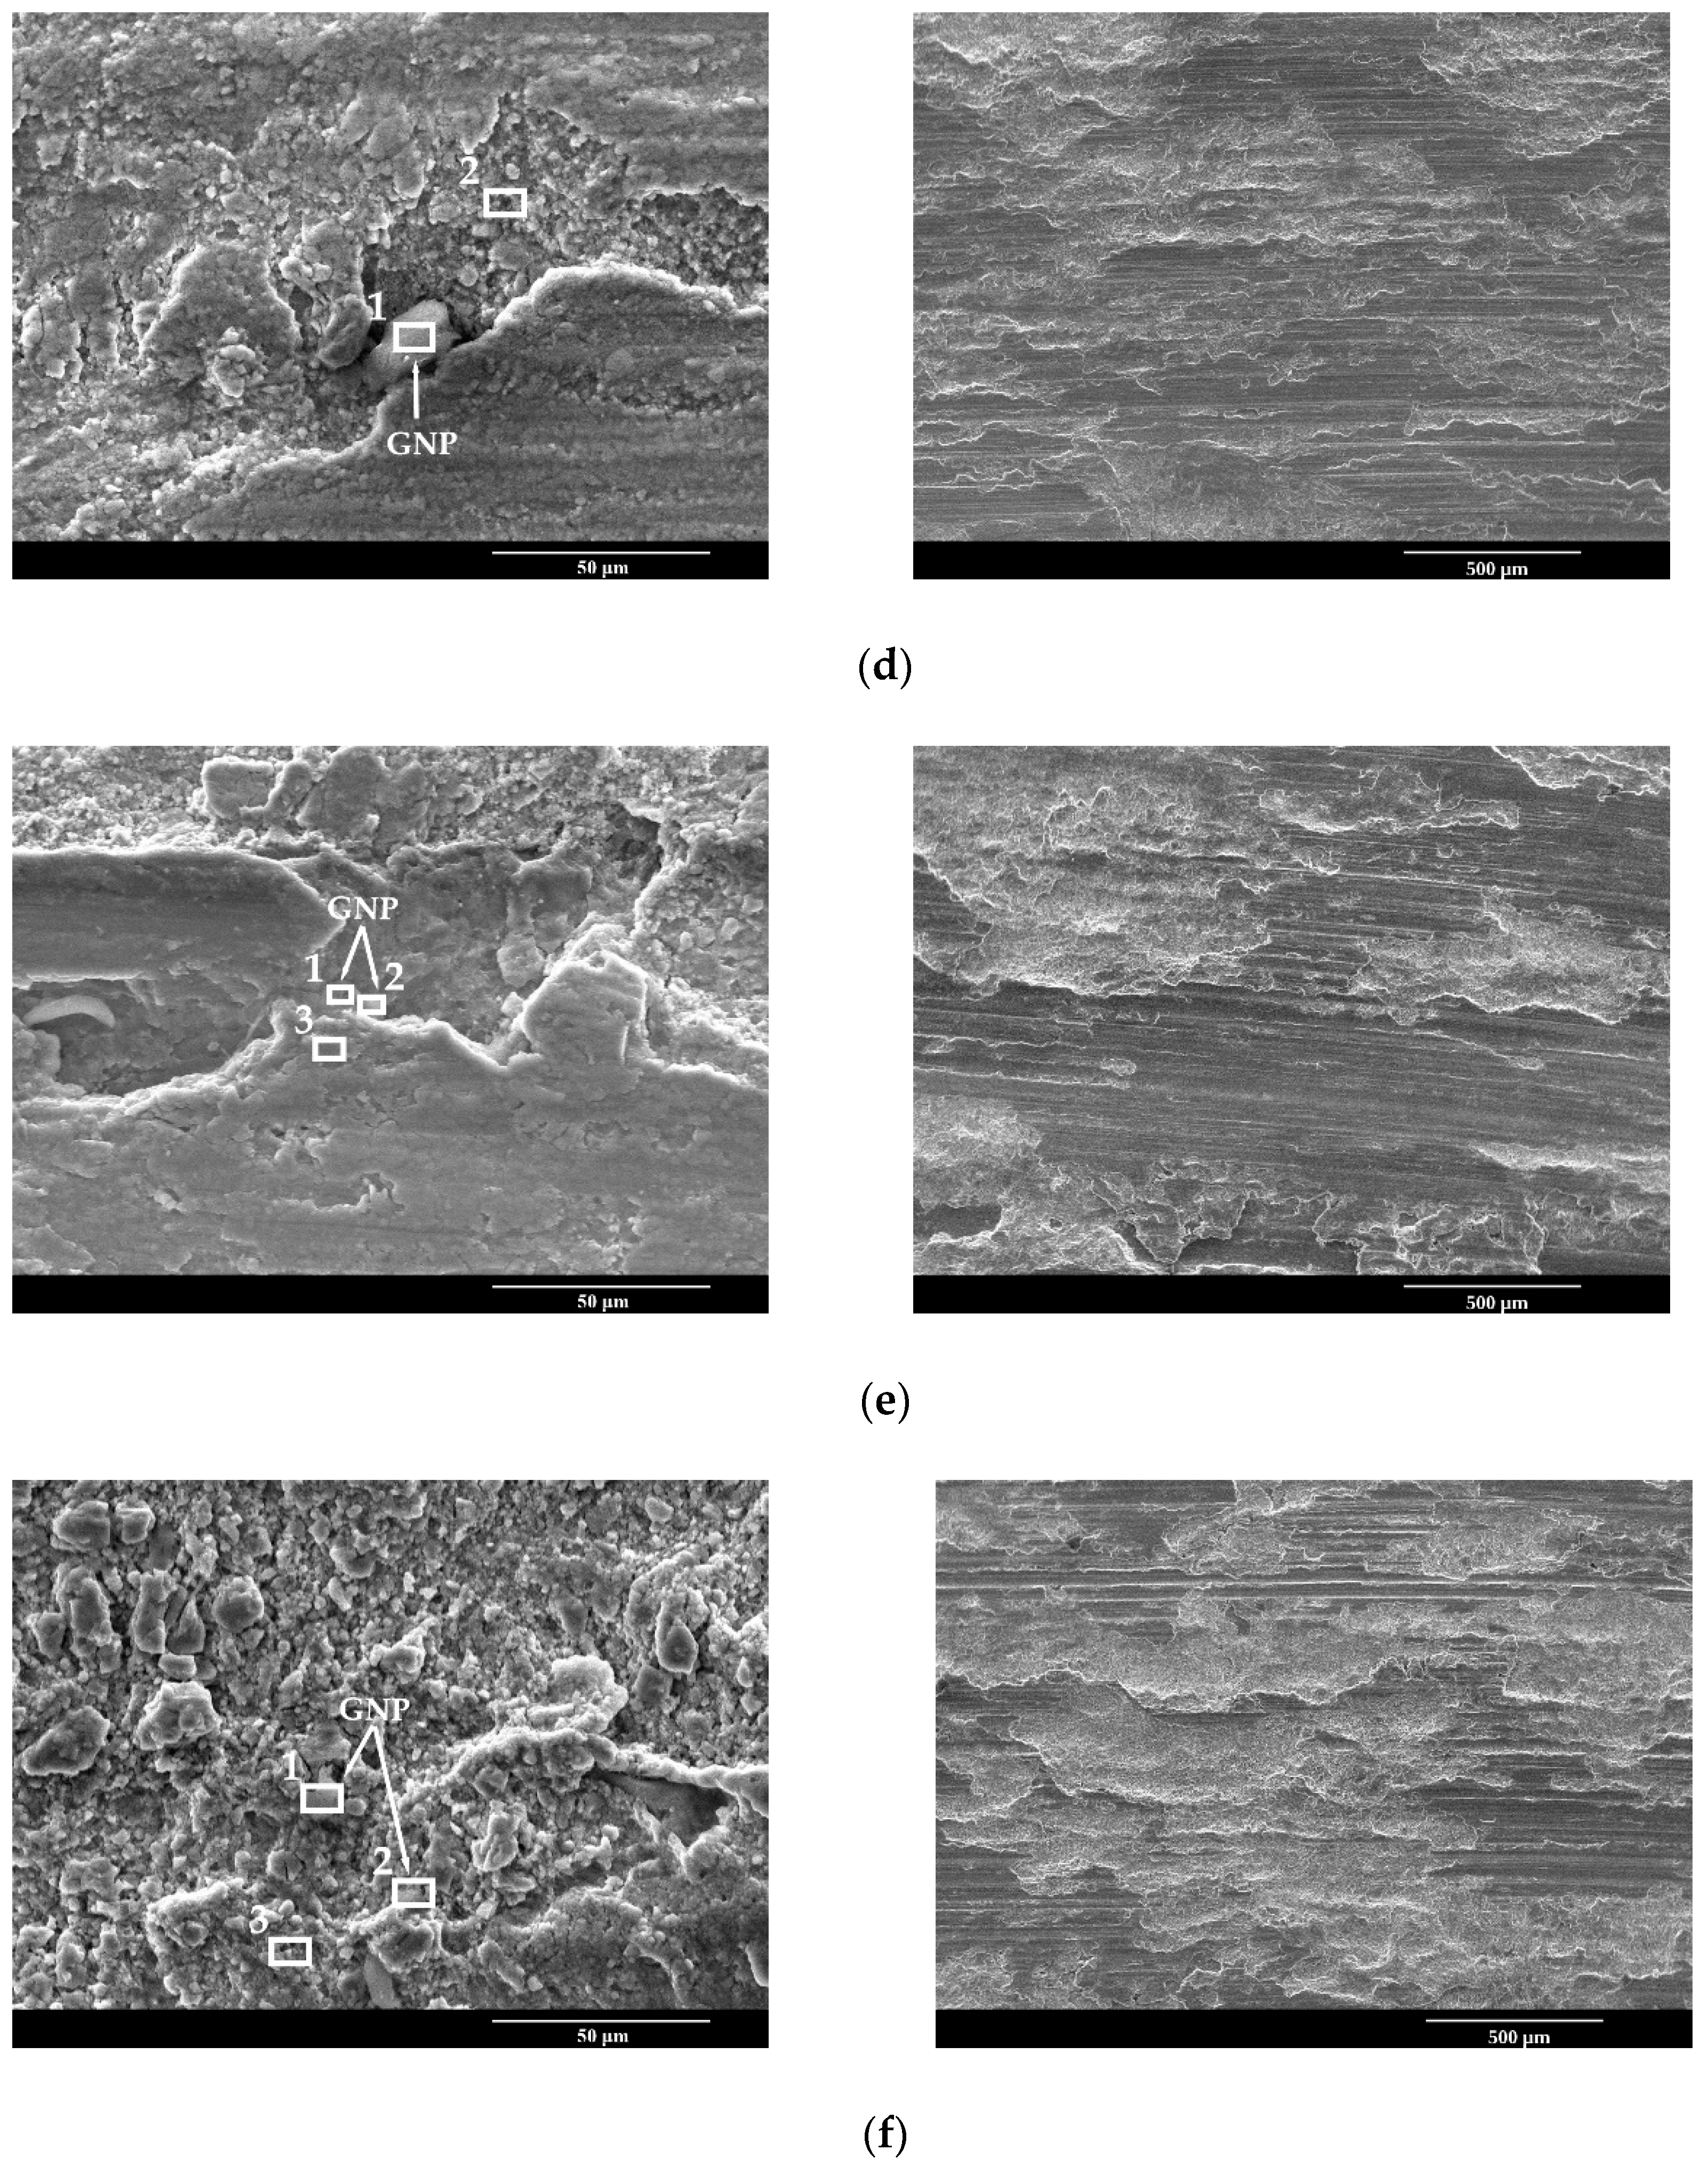
Figure 4d shows the worn surface of the annealed Al with 0.1 wt.% GNPs, which exhibited a similar appearance to
Figure 1a, but with more debris and some cracks. The EDS analysis (
Table 4 and
Figure 5d) indicated that zone 1 had a high C content of 82.36%, which suggested that GNPs were embedded in the surface and acted as solid lubricants, similar to
Figure 1a. Zone 2 had a low C content and a high Fe content of 37.63%, which indicated that it was mainly composed of iron oxide from the counterface, similar to
Figure 4b.
Figure 4e shows the worn surface of the annealed Al with 0.5 wt.% GNPs, which exhibited a smoother appearance than the same material with a different GNP concentration than in
Figure 4d (0.1 wt.%) and
Figure 4f (1.1 wt.%). The EDS analysis (
Table 5 and
Figure 5e) indicated that zone 1 had a high C content of 71.82%, which suggested that GNPs were embedded in the surface and acted as solid lubricants, similar to
Figure 4a,d. Zone 2 had a moderate C content of 62.50%, which suggested that GNPs were partially embedded in the surface, but less effectively than in zone 1. Zone 3 had a low C content and a high Al content of 85.89%, which indicated that it was mainly composed of the matrix material.
Figure 4f shows the worn surface of the annealed Al with 1.1 wt.% GNPs, which exhibited a rougher appearance than
Figure 4c, but with more debris. The EDS analysis (
Table 6 and
Figure 5f) indicated that zone 1 had a high C content of 72.30%, which suggested that GNPs were agglomerated on the surface, similar to
Figure 4c. Zone 2 had a moderate C content of 52.46%, which suggested that GNPs were partially embedded in the surface, but less effectively than in zone 1. Zone 3 had a low C content and a high Fe content of 21.31%, which indicated that it was also mainly composed of iron oxide from the counterface. The cracks in the annealed Al with 1.1 wt.% GNPs indicated that the material had a low ductility and a high brittleness due to the presence of nanosized Al
4C
3 particles, which were formed during the annealing process. These particles also contributed to the wear resistance of the material by hindering the plastic deformation and the crack propagation. However, the high GNP content also led to the formation of abrasive particles and tribofilms that increased the friction and wear.
The EDS of Al
4C
3 may be influenced by the Fe debris that can cause extra X-ray peaks of the Fe element and change the surface structure of Al
4C
3. The surface changes that occur when Fe atoms bind to the face of Al
4C
3 that has C atoms can lower the nucleation ability of the Al
4C
3 particles for heterogeneous solidification [
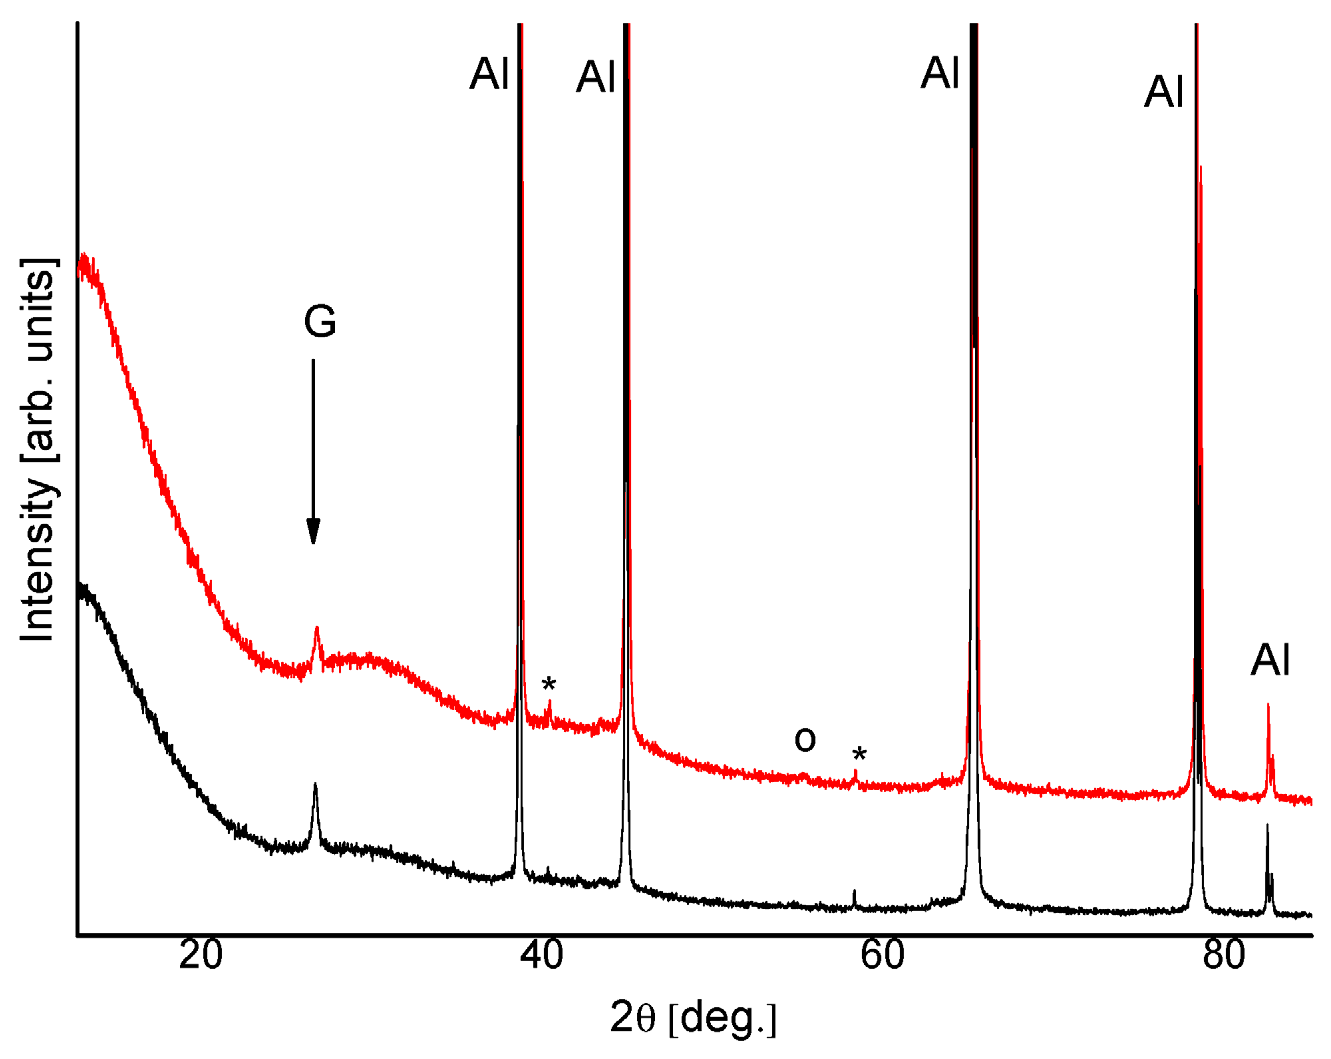
34]. Therefore, the employed XRD, TEM and HRTEM techniques were employed.
The wear mechanisms of Al/GNPs composites vary based on the number of GNPs added to the matrix, as observed in the SEM images. In the composite with 0.1 wt.% GNPs (
Figure 4a), the wear mechanism was primarily a mild abrasive wear. The surface appeared smooth with shallow grooves and some debris. The GNPs were embedded in the surface and acted as solid lubricants, effectively reducing the friction and wear. In the composite with 0.5 wt.% GNPs (
Figure 4b), the wear mechanism was mainly a moderate abrasive wear and an adhesive wear. The surface appeared rougher with deeper grooves and more debris. The GNPs were less effectively embedded in the surface, and it was possible that some iron from the counterface formed a tribofilm that increased the friction and wear. For the composite with 1.1 wt.% GNPs (
Figure 4c), the wear mechanism was primarily a severe abrasive wear and a delamination wear. The surface appeared very rough with severe grooves, large debris and cracks. The GNPs were agglomerated on the surface, forming abrasive particles that increased the friction and wear. Although the GNPs were partially embedded in the surface, they did not provide enough lubrication. Additionally, some iron from the counterface contributed to the wear.
The wear mechanisms of the annealed Al/GNPs composites also depend on the number of GNPs added to the matrix and the presence of Al
4C
3, as indicated by the SEM images. For the annealed composite with 0.1 wt.% GNPs (
Figure 4d), the wear mechanism was primarily a moderate abrasive wear and a slight adhesive wear. The surface exhibited grooves along the sliding direction and more damage than the composite with 0.1 wt.% GNPs without Al
4C
3 (
Figure 4a). However, the GNPs were embedded in the surface and acted as solid lubricants, reducing the friction and wear. For the annealed composite with 0.5 wt.% GNPs (
Figure 3e), the wear mechanism was primarily a severe abrasive wear and an adhesive wear. The surface displayed slightly deeper grooves and more damage than the annealed composite with 0.1 wt.% GNPs with Al
4C
3 (
Figure 4d). For the annealed composite with 1.1 wt.% GNPs (
Figure 4f), the wear mechanism was primarily a severe abrasive wear and a delamination wear, as seen by the surface’s severe grooves, large debris and cracks. The GNPs were agglomerated on the surface, forming abrasive particles that increased the friction and wear. Although the GNPs were partially embedded in the surface, they did not provide enough lubrication and some iron from the counterface contributed to the wear.
Comparing the wear surfaces of the composites to the different content of GNPs, it can be seen that adding more GNPs to Al did not necessarily improve its wear resistance, but rather had an optimal amount that balanced between lubrication and abrasion. According to Wu et al. [
19], this optimal amount was around 0.3 wt.% for Al–GNPs. However, incorporating a high fraction of 5 wt.% of graphene resulted in agglomeration and a higher wear rate, as shown by Ghazaly et al. [
28]. To understand the effect of the GNP content on the microstructure of Al composites, Zhang et al. [
30] produced an Al/GNSs nanocomposite and observed that 1 vol.% of reinforcement significantly reduced the size of the Al grains and improved the distribution of the GNPs in the Al matrix.
3.3. Wear Behavior
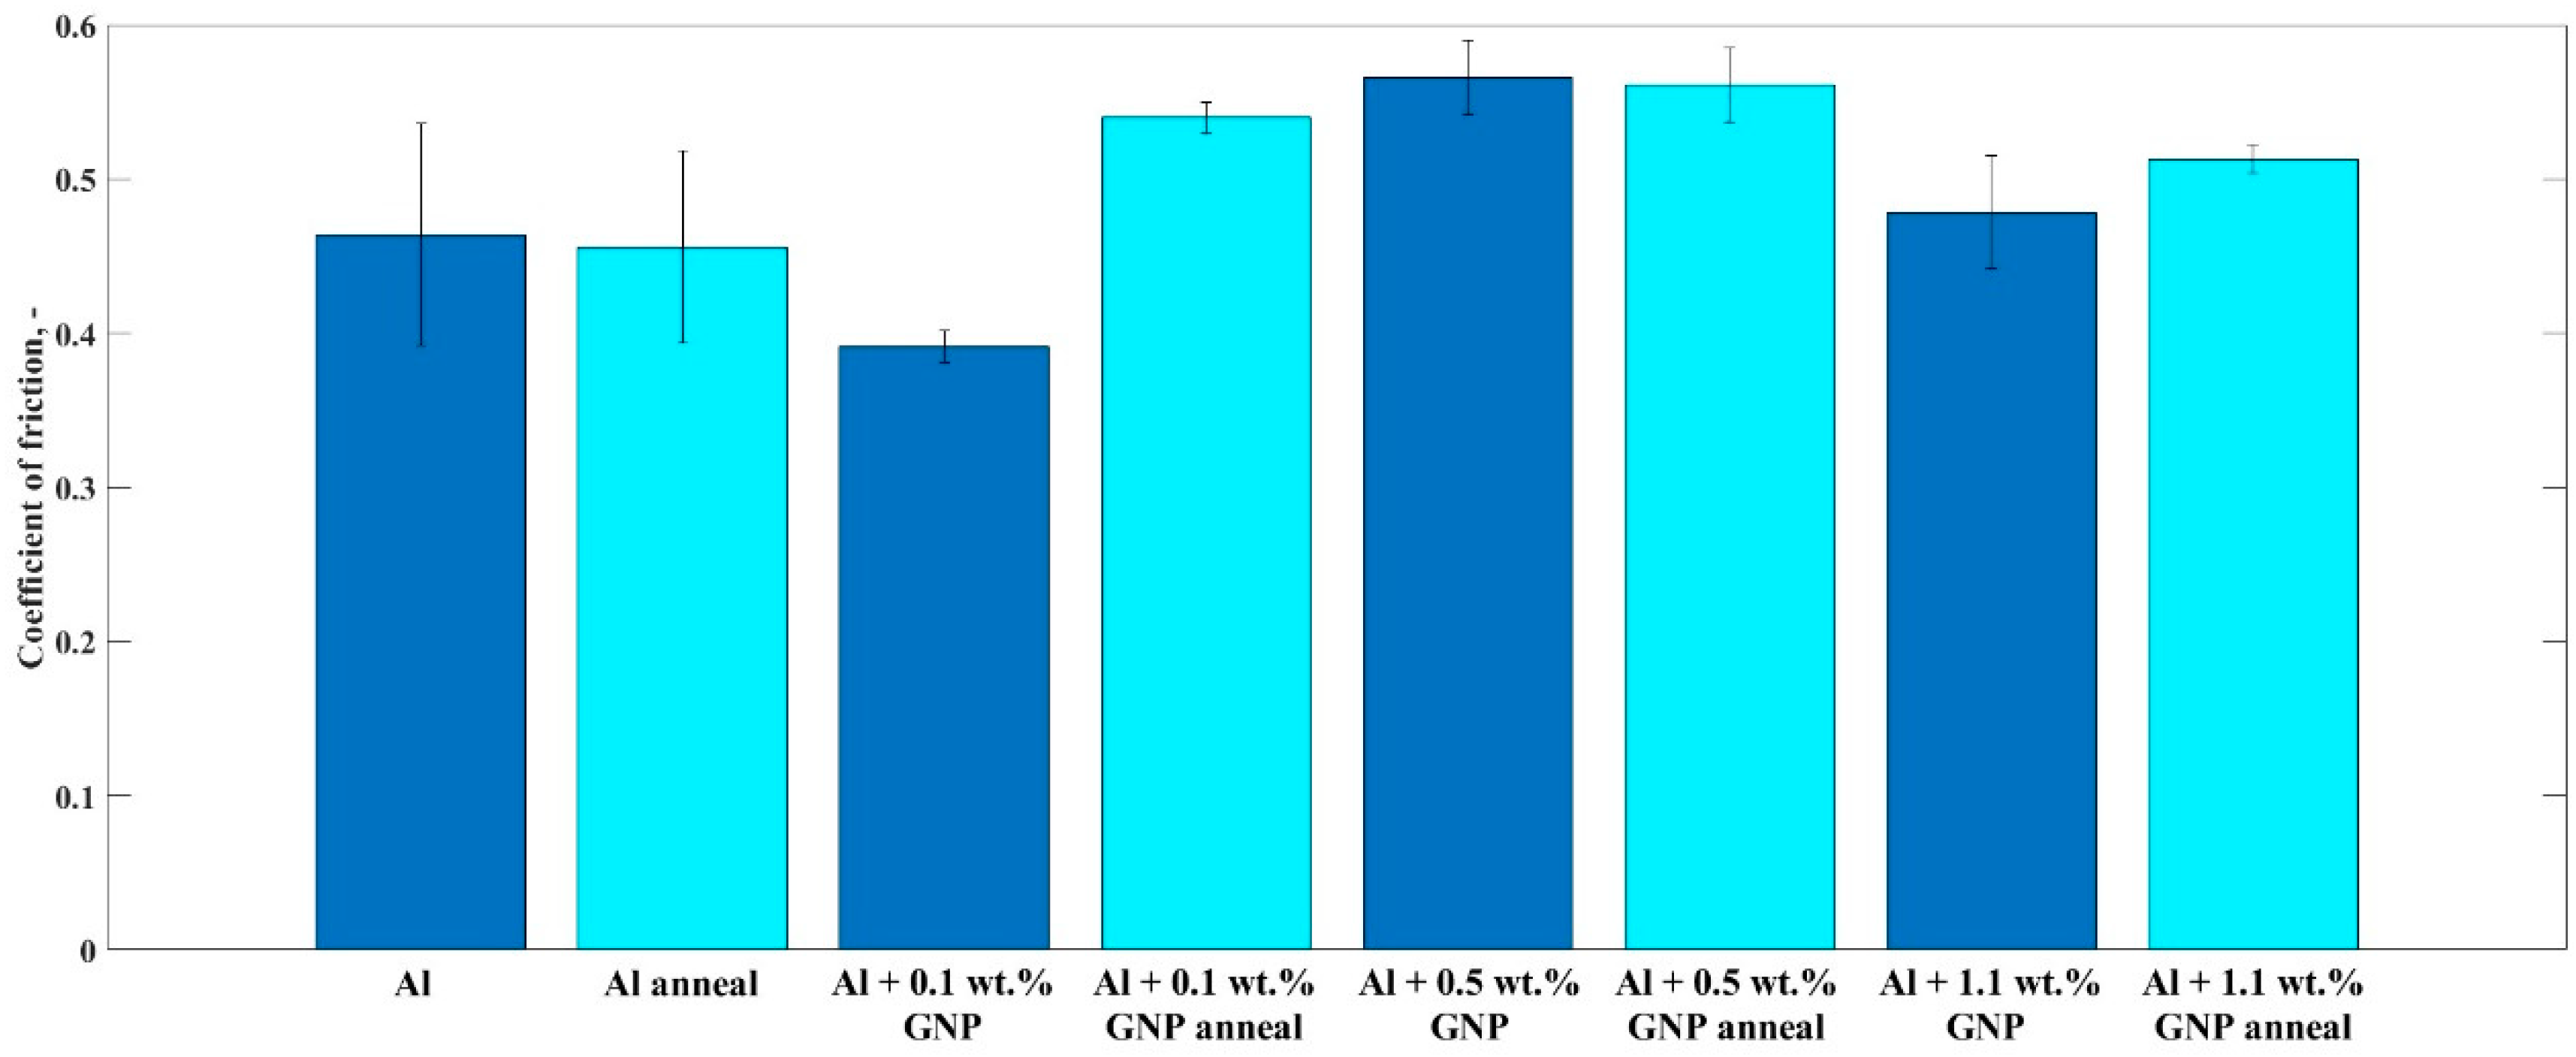
Figure 8 presents a comparison of the coefficient of the friction results for the aluminum-based nanocomposites reinforced with GNPs at weight percentages ranging from 0 to 1.1% and annealed aluminum-based nanocomposites reinforced with both GNPs and nanosized Al
4C
3 at the same weight percentages. The coefficient of friction is an important parameter for determining the tribological behavior of a material. A lower coefficient of friction indicates reduced resistance to sliding, which can result in less wear and damage to the material. The results presented in
Figure 8 allowed for a direct comparison of the tribological properties of the two different types of nanocomposites. The addition of GNPs to Al had a significant effect on the CF. As the concentration of GNPs increased, the CF also increased. This was particularly evident when comparing 0.1 wt.% GNP to 0.5 wt.% GNP, where the CF increased by approx. 44%. However, further increasing the GNP concentration to 1.1 wt.% led to a 15% decrease in the CF compared to 0.5 wt.%, which may be due to the agglomeration of GNPs at higher concentrations.
When Al4C3 was added to the Al/GNPs composite, the CF generally increased compared to the Al/GNPs composite without Al4C3. The annealed Al/GNPs with 0.1 wt.% GNPs and Al4C3 had a CF that was approx. 38% higher than the Al with 0.1 wt.% GNPs. However, the effect of Al4C3 on the CF appeared to diminish as the concentration of GNPs increased. For instance, the CF of the annealed Al with 0.5 wt.% GNPs and Al4C3 was only marginally higher than that of the Al with 0.5 wt.% GNP. The CF of the annealed Al with 1.1 wt.% GNPs with Al4C3 was 8% lower than the same composite with 0.5 wt.% GNPs, which was contrary to the trend observed for the other GNPs concentrations. This may have been due to the agglomeration of GNPs at higher concentrations and the formation of weak interfacial bonding between the Al matrix and GNPs.
While adding GNPs to Al increased the CF due to their high surface roughness and interlocking tendency with the matrix, which increased the frictional resistance and contact area between the sliding surfaces, the agglomeration of GNPs at higher concentrations decreased the CF by reducing the uniform distribution and dispersion of GNPs in the matrix, which resulted in less effective reinforcement and lubrication of the composite. However, the effect of Al
4C
3 to the annealed Al/GNPs composite increased the CF since Al
4C
3 is a hard and brittle phase that can increase the abrasive wear and plowing effect of the composite, leading to a higher frictional force and heat generation. As shown in
Figure 8, adding GNPs to Al increased the CF by approximately 44% when comparing 0.1 wt.% GNPs to 0.5 wt.% GNP, while adding Al
4C
3 to the Al/GNP composite with 0.1 wt.% GNPs increased the CF by approximately 38% compared to the Al with 0.1 wt.% GNP. These results suggested that the optimal concentration of GNPs for minimizing the CF of Al-based nanocomposites was 0.1 wt.%, which can enhance their tribological performance and durability. However, adding Al
4C
3 to the annealed Al/GNPs composite had a positive effect on the CF at low GNPs concentrations, but a negative effect at high GNPs concentrations.
After reviewing the studies [
19,
28,
29,
31], some similarities and differences were found in the tribological test parameters and results. One similarity was that all the studies investigated the tribological properties of aluminum-based composites with the addition of different concentrations of graphene. Moreover, they all used dry sliding wear tests to evaluate the tribological performance of the composites under the different sliding conditions, such as the normal load, sliding speed and sliding distance. The results showed that the tribological behavior of the composites was affected by the concentration of the nano-reinforcements and the sliding conditions.
However, there were also some differences in the tribological test parameters and results among the studies. For example, Wu et al. [
19] found that the optimal wear parameters for GNPs (0.5 wt.%)/AlSi10Mg composites were a load of 30 N and sliding speed of 0.9 m/s, whereas Khorshid et al. [
29] investigated the effects of normal loads of 5, 10, 15 N and sliding speeds of 0.14, 0.29, 0.4 m/s and indicated that the CF decreased at high loads of 15 N, while increasing the sliding speed to 0.4 m/s. Moreover, the effect of the concentration of the nano-reinforcements on the tribological properties varied among the studies. For instance, Ghazaly et al. [
28,
31] observed that adding 3 wt.% of graphene reduced the wear rate by 34% and the CF by 25% but incorporating a higher concentration of 5 wt.% of graphene resulted in agglomeration and a higher wear rate. In contrast, the current study found that the addition of GNPs to Al-based nanocomposites increased the CF by approximately 44% when comparing the 0.1 wt.% GNP to 0.5 wt.% GNP. However, the CF decreased by 15% when the GNPs concentration increased to 1.1 wt.%.
Overall, the similarities and differences in the tribological test parameters and results among the studies indicated that the tribological behavior of the composites was affected by various factors, such as the concentration of the nano-reinforcements, the sliding conditions and the synthesis and processing techniques. Therefore, it is important to carefully select the optimal combination of these factors to achieve the desired tribological performance of the composites in the specific applications.
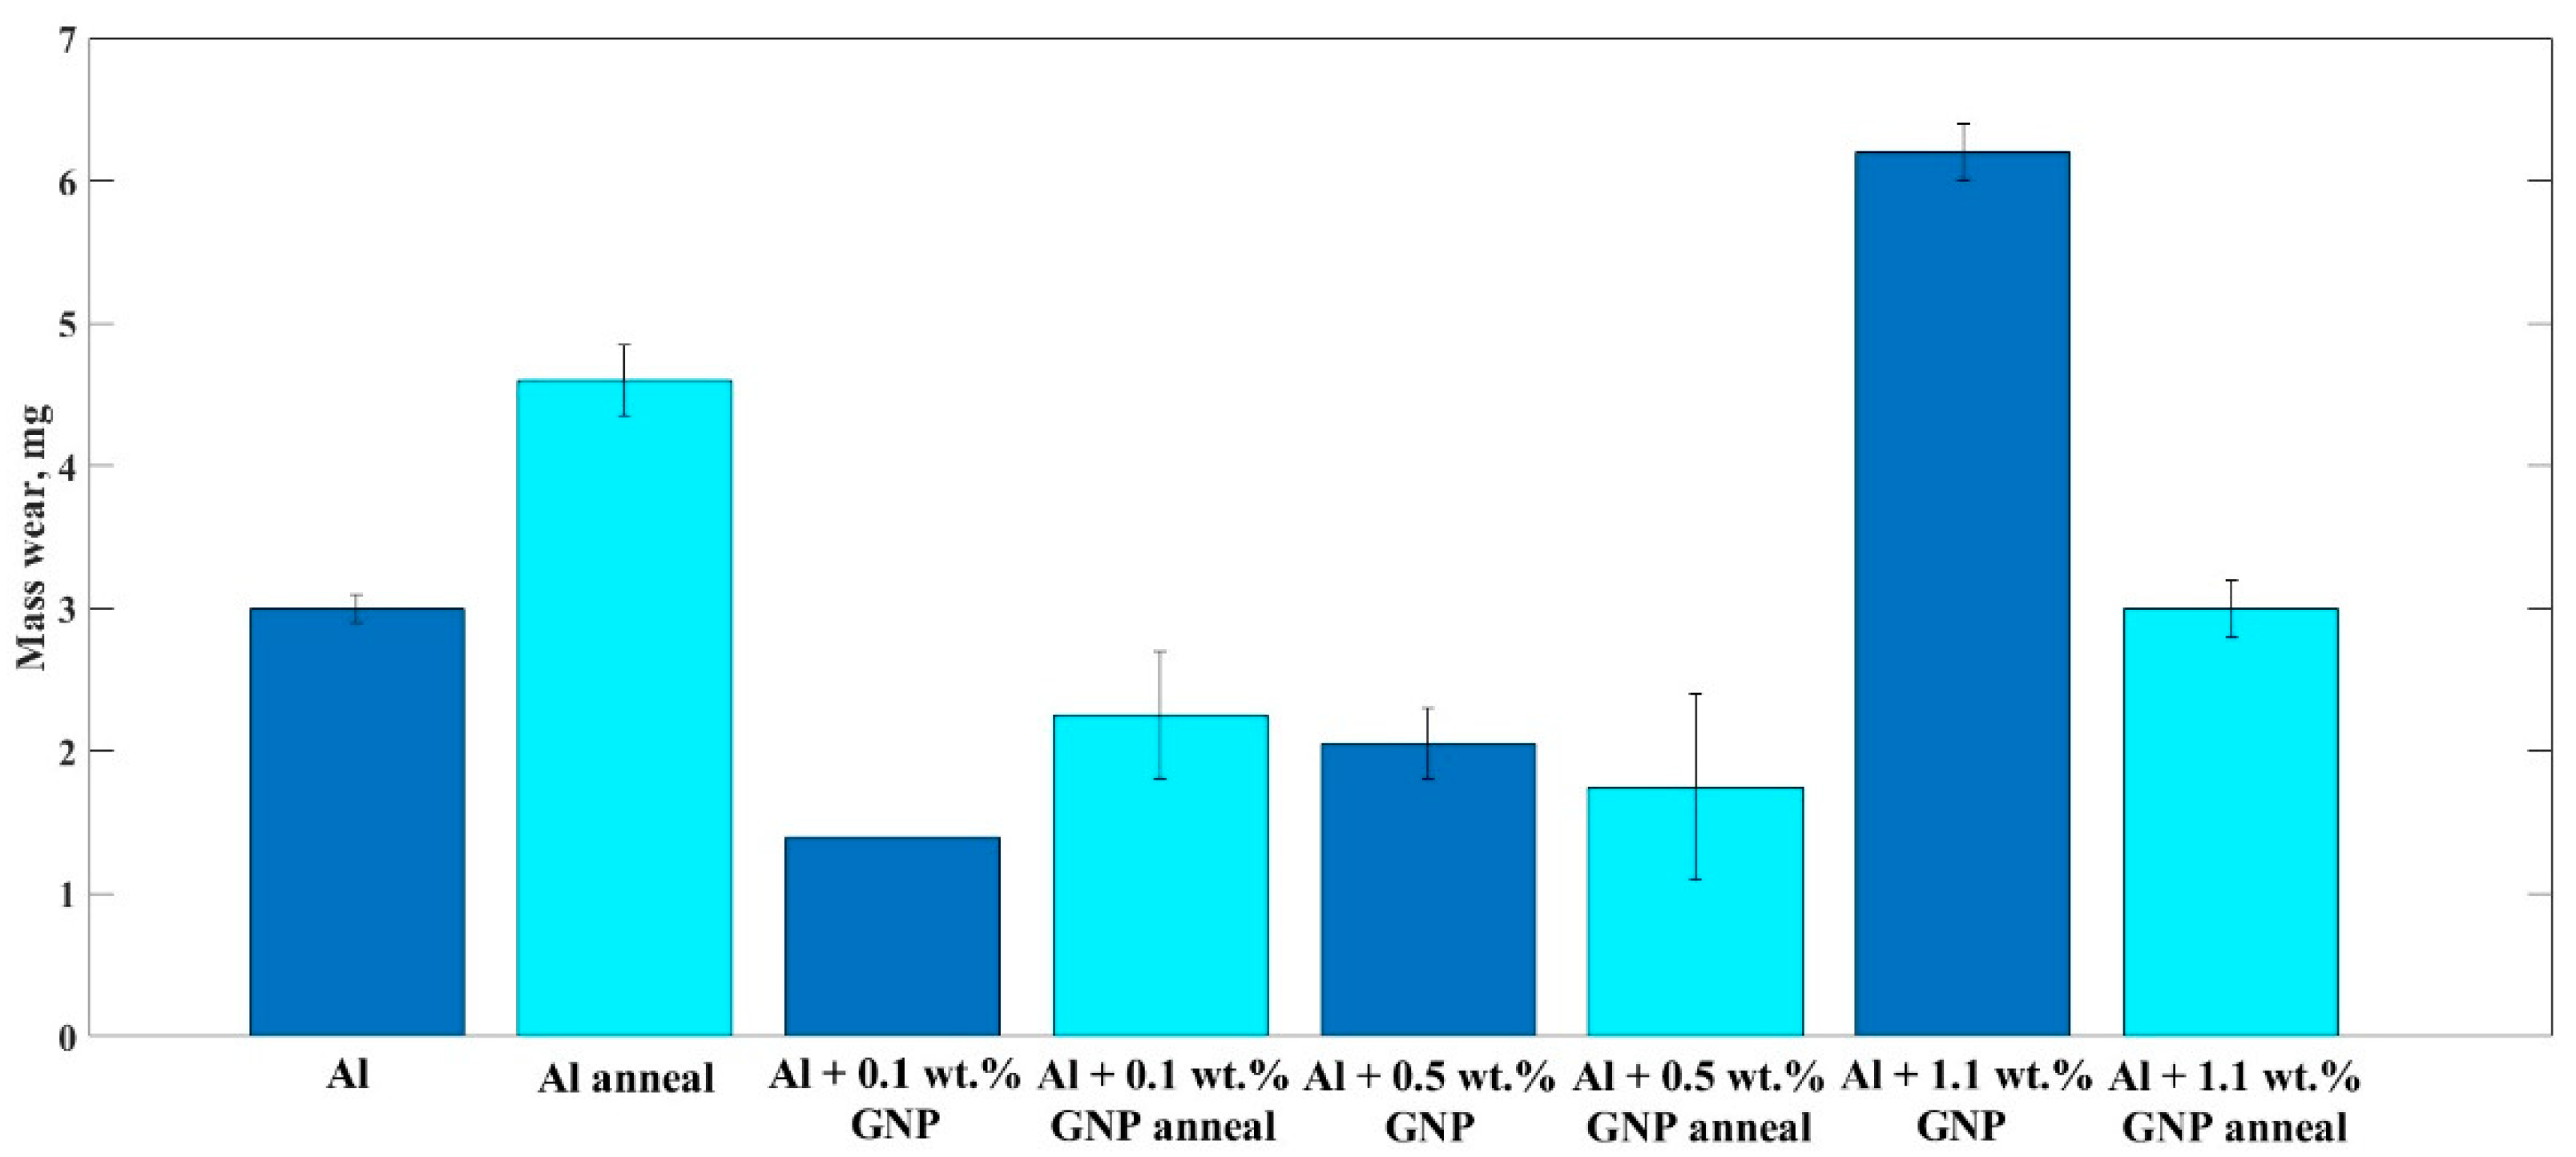
Figure 9 presents the mass wear of Al with GNPs (0–1.1 wt.%) and the annealed Al with GNPs (0–1.1 wt.%) at a 30 N load, 0.9 m∙s
−1 sliding speed and 540 m sliding distance under dry sliding friction conditions at room temperature. The mass wear increased as the concentration of GNPs increased. When comparing the Al with 0.1 wt.% GNP to 0.5 wt.% GNP, the mass wear showed a 46% increase. Further increasing the GNP concentration to 1.1 wt.% led to a 202% increase in the mass wear result, which may have been due to the agglomeration of GNPs at higher concentrations. By comparing all the concentrations of the annealed Al/GNP (0.1–1.1 wt.%) composite with the presence of Al
4C
3, the mass wear increased with the increase in the GNPs concentrations. The annealed Al/GNPs with 0.1 wt.% GNPs and Al
4C
3 had a mass wear that was approximately 38% higher than that of the Al with 0.1 wt.% GNPs. However, the effect of Al
4C
3 on the mass wear tended to diminish as the concentration of GNPs increased. For instance, the mass wear of the annealed Al with 0.5 wt.% GNPs and Al
4C
3 was 27% higher than that of the Al with 0.5 wt.% GNPs. The mass wear of the annealed Al with 1.1 wt.% GNPs with Al
4C
3 was 52% lower than the Al composite with 1.1 wt.% GNPs. This may have been due to the agglomeration of GNPs at higher concentrations and the formation of weak interfacial bonding between the Al matrix and GNPs.


