Article

Precipitation Hardening of the Electrical Conductor Aluminum Alloy 6201

by
Alyaqadhan Allamki
,
Majid Al-Maharbi
*,
Sayyad Zahid Qamar
and
Farooq Al-Jahwari
Department of Mechanical and Industrial Engineering, College of Engineering, Sultan Qaboos University, Al Khoudh, Al Seeb 123, Oman
*
Author to whom correspondence should be addressed.
Metals 2023, 13(6), 1111; https://doi.org/10.3390/met13061111
Submission received: 30 April 2023 / Revised: 30 May 2023 / Accepted: 7 June 2023 / Published: 13 June 2023

Abstract

:
Aluminum alloy 6201 is a wrought, heat-treatable alloy, which is used in electricity transmission and distribution lines. The alloy is processed in a commercial continuous casting and rolling system, which includes a series of in-line thermomechanical processes involving hot working, quenching, cold working and artificial aging. In this study and following cold working, the alloy is subjected to a solution heat treatment at 510 °C for an hour, quenched in ice water, and artificially aged at various temperatures for various times (150–200 °C for 2–30 h) (T6-temper) in order to investigate the effect of precipitation on mechanical properties and electrical conductivity. The results show that optimum mechanical properties and electrical conductivity were obtained after artificial aging at 155 °C for 30 h (155-30). The tensile strength was almost equal to that of the as received cold drawn wire of 326 MPa, but interestingly, electrical conductivity significantly increased to 58.6% IACS from a value of 52.7% IACS of the as received cold drawn wire. Intermetallic particles α-AlFeSi (Al8Fe2Si) and β-AlFeSi (Al5FeSi and Al9Fe2Si2) were observed in all samples, which were nucleated during solidification and homogenization; they were not affected by the aging process. β″/β′/β -precipitates formed during artificial aging, which affected the final mechanical properties and the final electrical conductivity.

1. Introduction

The aluminum–magnesium–silicon alloy 6201 is a popular electrical conductor, widely used for overhead distribution and transmission lines [1]. It has a mass conductivity twice that of copper, due to its low density of 2.7 g/cm3, which is less than one third of that of copper. It also has one of the highest strength-to-weight ratios among structural alloys in addition to an excellent corrosion resistance. Its tensile strength varies between 255 to 330 MPa and has an electrical conductivity in the range 52–57% IACS. It makes up the homogenous overhead conductor All Aluminum Alloy Conductor (AAAC).
AAAC, however, experiences corrosion, creep, erection, power loss, and other drawbacks. Therefore, it has been essential for manufacturers to improve its mechanical and electrical properties by improving the alloy performance [2,3,4]. Different approaches have been adopted to improve the alloy performance [5,6,7,8,9,10,11,12,13,14,15,16,17,18,19,20,21,22,23,24].
The commercial industry adopts a common processing method that includes, in order, cold working, natural aging, and precipitation heat treatment (also sometimes known as the AL3 wire) [7,8]. Al-Yagoot and Ul-Hamid [7] achieved only a small improvement (in the AL3 wire) in tensile strength, 309 MPa, over the minimum required, 295 MPa, according to the British Standard incorporating a European Standard BS EN (50183) [25]. Significant improvements in elongation, 8.3%, and electrical conductivity, 55.7% IACS, over the minimum standard values, 3.5% and 53% IACS, respectively, were also achieved. Alshwawreh et al. [8] could obtain a better tensile strength, 320 MPa, and electrical conductivity, 56% IACS. Part of the industry also applies T81-tempering [1], which includes, in order, natural aging, solution heat treatment, cold working, and precipitation heat treatment. Khangholi et al. [9] could achieve a moderate tensile strength, 322 MPa, which is accompanied by a low electrical conductivity, 53% IACS, lower than the minimum standard value.
Flores et al. and Jin et al. [10,11] suggested that cold working may be performed after solution and artificial aging treatments, to retain the effect of cold working hence obtain high mechanical properties (also known as the optimized thermomechanical process). The resulting tensile strength was as high as 424 MPa, however, electrical conductivity, 52.78% IACS, was lower than the minimum value [10,11]. Mulazimoglu et al. [12] added a low concentration of Sr, high tensile strength, 345 MPa, and a medium electrical conductivity, 54.2% IACS, was obtained.
Grain refinement is another mechanism of strengthening, following the Hall-Petch relationship (see Equation (1)).
σ y = σ 0 + k y d 1 / 2
where σy is the yield strength, d is the average grain diameter, and σ0 and k are material constants [26]. Hu et al. [13], Murashkin at al. [14], and Majchrowicz at al. [15] used different methods to refine the grain size. Hu et al. [13] induced a high amount of strains through repetitive continuous extrusion forming (R-Conform) at a high temperature for a short time. High tensile strength, 345 MPa, and a good elongation, 7.6%, were obtained. ECAP (equal channel angular pressing) is a sever plastic deformation grain refinement method that can be repeated without changing the sample cross-sectional area, hence inducing large amount of strains, up to 100%. Murashkin et al. [14] applied ECAP, which was repeated six times (six cycles) at the temperature 130 °C. High tensile strength, 364 MPa, and a medium electrical conductivity, 56.4% IACS, were achieved, but elongation, 3.5%, was equal to the minimum standard value. Majchrowicz et al. [15] hydrostatically extruded the alloy to a 4.0 mm wire. Good tensile strength, 332 MPa, a medium elongation, 8.8%, and a high electrical conductivity, 58% IACS, were achieved. Grain refinement methods, however, are not adopted commercially. Therefore, in this study, a solution heat treatment is incorporated after cold drawing followed by quenching and artificial aging (T6-temper); a process that can be adopted easily by the industry.

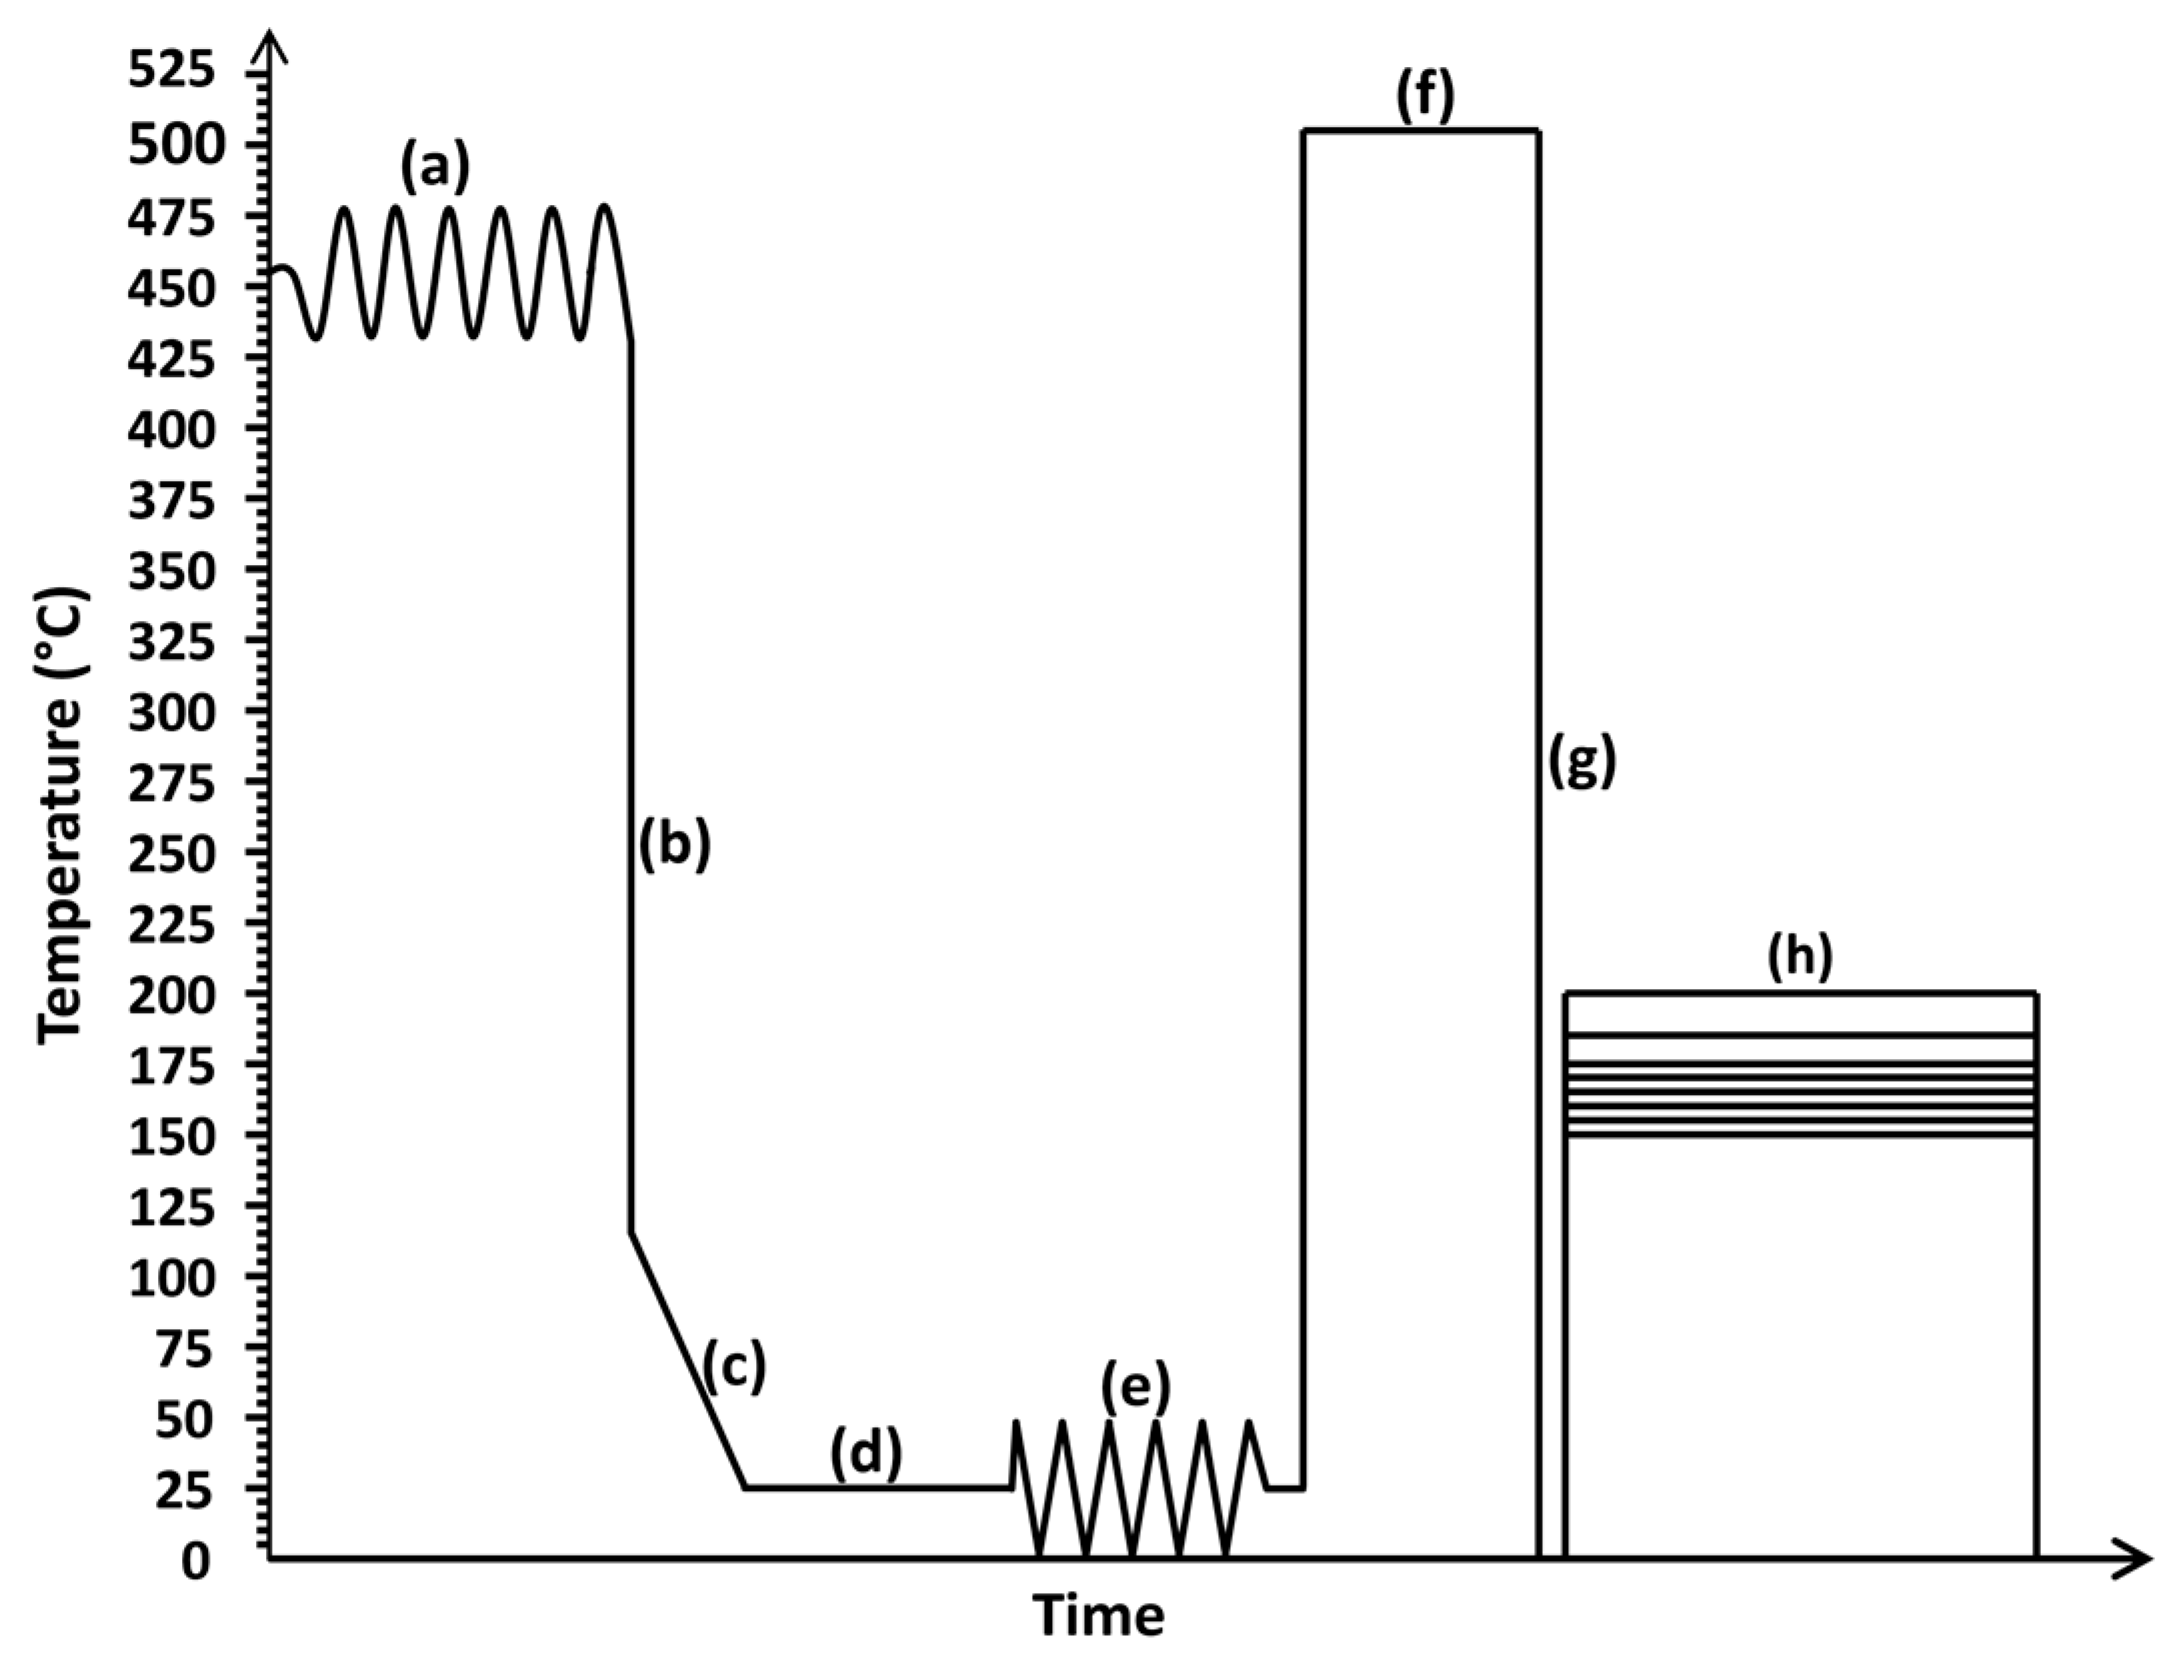
2. Materials and Methods

Several 1xxx and 6xxx wrought aluminum alloys are used for electricity transmission and distribution lines: 1080A, 1350, 1370, 6101 and 6201 [1,18,19]. 1080A, 1350, and 1370 alloys, ø 1.25–5.25 mm wires (also known as EC wires), are used in the overhead conductors All Aluminum Conductor (AAC) and Aluminum Conductor Steel Reinforced (ACSR). These are pure aluminum alloys of 99.5–99.8 wt.% Al; their electrical conductivity is 61.5–61.9% IACS minimum and tensile strength is in the range 155–200 MPa. 6101 and 6201 alloys, ø 1.5–5.0 mm wires, have the main alloying elements Mg and Si in 0.35–0.9 wt.% and 0.3–0.9 wt.%, respectively, with an aluminum content of 98.3 wt.%. Their tensile strength is 295 MPa minimum and their electrical conductivity is 53% IACS minimum. They make up the overhead conductor All Aluminum Alloy Conductor (AAAC).
AAC has excellent corrosion resistance; therefore, they are the preferred choice for coastal areas. AAC are only installed in areas where installation distance is short due to their low strength. They have high electrical conductivity, higher than ACSR and AAAC. ACSR is made of a steel core, that is surrounded by 1xxx aluminum conductors. The steel core contributes high strength while aluminum contributes excellent conductivity for low cost and weight. It is considered under difficult environmental conditions such as ice, wind, and high temperatures. ACSR has low corrosion resistance, lower than AAC and AAAC. AAAC is a homogenous conductor that is made of the 6xxx aluminum alloy with a strength to weight ratio higher than those of AAC and ACSR. AAAC has a tensile strength higher than that of the AAC, but lower than that of the ACSR. Its electrical conductivity is higher than that of the ACSR, but lower than that of the AAC. AAAC has a good corrosion resistance higher than that of the ACSR and lower than that of the AAC. AAAC is considered when a combination of moderate strength, lightweight, and good corrosion resistance is required.
The alloy 6201 was processed using a commercial continuous casting and rolling system (Oman Aluminium Processing Industries Spc (OAPIL), Suhar, Oman) following an in-line-homogenization production method that includes a series of in-line thermomechanical processes involving hot and cold working, solution heat treatment, quenching and artificial aging.
The alloy is prepared in a holding furnace at the temperature range 650–690 °C, in which all alloying elements are added (see Table 1). The molten metal then leaves the furnace and enters the casting wheel and emerges as a cast bar at a temperature of 480–540 °C. After that, the bar passes through a bar/induction heater at 510 °C, for homogenization; homogenization removes micro-segregation and distributes alloying elements uniformly in the matrix. The cast bar then reaches the rolling mill, passes through multiple 225 mm roll stands, and it is alternately compressed from side to side and top to bottom. Its length increases, its cross-section decreases, and emerges as an oval/round rod of a diameter of 9.50 mm. Because precipitation might occur at temperatures below 340 °C, the aluminum rod is quenched in the quench tube assembly to a temperature below 120 °C; rolling and quenching are performed fast enough to avoid precipitation [27]. The aluminum rod is delivered to the coiler by the rod conduit. After natural aging of 7 to 15 days, the rod is cold drawn (in the longitudinal direction) from ø 9.50 mm to a ø 3.50 mm wire (86% cold working) on a drawing machine, which is partially submerged in oil. This drawing is necessary because AAAC is made up of ø 1.5–5.0 mm wires, not rods.
In university laboratories, 100 and 300 mm length samples were cut through the transverse direction using the Linear Precision Saw, IsoMet 5000, Buehler (Lake Bluff, IL, USA). Samples were then solution heat treated in a Carbolite Muffle furnace (Carbolite Gero, Hope, Derbyshire, UK) at 510 °C for 1 h. Solution heat treatment allows dissolution of intermetallic particles and solute atoms in the matrix and removes the effects of hot and cold workings [28]. Solution heat treatment was directly followed by quenching in water with ice at 0 °C such that solute atoms and vacancies are retained in a supersaturated solid solution. The retained solute atoms and vacancies will assist a subsequent precipitation hardening. The supersaturated solid solution microstructure was then artificially aged at temperatures between 150 and 200 °C for times between 2 to 30 h in a Carbolite PF Oven (Carbolite Gero, Hope, Derbyshire, UK). The sample that was neither solution heat treated, nor precipitation heat treated is labeled “as-received”, while the sample that was only solution heat treated is labeled “as-solutionized”. The samples that were solution heat treated and precipitation heat treated are labeled using the precipitation temperature and precipitation time (150-2, 150-13, etc.). The temperature–time chart and details of the process are shown in Figure 1 and listed in Table 2, respectively.
Chemical composition was detected using the Inductive Coupled Plasma Optical Emission Spectrometer, Make Perkin Elmer, Model 8000 DV (ICP-OES, PerkinElmer, Waltham, MA, USA). It is a multi-element analysis technique in which a solution of concentrated nitric acid was used to extract alloying elements. Tensile tests were conducted on subsize standard samples of 100 mm total length and 25 mm gauge length in a Tinius Olsen Universal Testing Machine [29] with a displacement rate of 5 mm/min (strain rate of 3.334 × 10⁻³ s−1). An extensometer of 25 mm gauge length was used to measure elongation. Tinius Olsen Micro Vickers, Vickers, and Knoop hardness testing machine (Tinius Olsen, Salfords, Surrey, UK), FH-014-0001, was used to measure hardness. Micro Vickers (500 gf, 10 s dwell time) was used; three hardness measurements were taken for each sample. The electrical resistance in (mΩ) of 300 mm length samples was measured using the low resistance ohmmeter, Megger DLRO10-10A (Ductor), which utilizes the four terminal measurement method. Forward and reverse d.c. are applied to cancel the emf, and the measured resistance is the average of both the forward and the reverse measurements. The electrical resistance measurements were taken at the laboratory temperature, t = 23   ° C , which was then converted to the reference temperature, T = 20   ° C , using Equation (2):
R T = R t 1 + T ( t T )
where R T is the resistance at the reference temperature T , R t is the measured resistance at the temperature t , and T is the temperature coefficient of the resistance of the specimen being measured at the reference temperature T , 20 = 0.00347 .
The volume resistivity, ρ v (Ω·mm2/m or µΩ·m), was calculated using Equation (3),
ρ v = A / L R
where A is the cross-sectional area in mm2, R is the measured resistance in Ω and L is the length of the sample in m [30]. Electrical conductivity, σ v (% IACS), was then calculated using Equation (4),
σ v = 1 ρ v × 1.724
Standard metallographic preparation included cutting, mounting, grinding, polishing, and etching was performed. Weck’s tint etchant was used for etching. Optical and electron micrographs were taken using the digital Keyence VHX-1000E microscope (Keyence Corporation, Osaka, Japan) and the JEOL JSM-7800F Field Emission Scanning Electron Microscope (JEOL Ltd., Tokyo, Japan), respectively. The planimetric intercept method was used to measure the average grain size [31]. The average grain size measurements and intermetallic and precipitate area fraction measurements were calculated using the software ImageJ (1.53a, National Institutes of Health, Bethesda, MD, USA).

3. Results

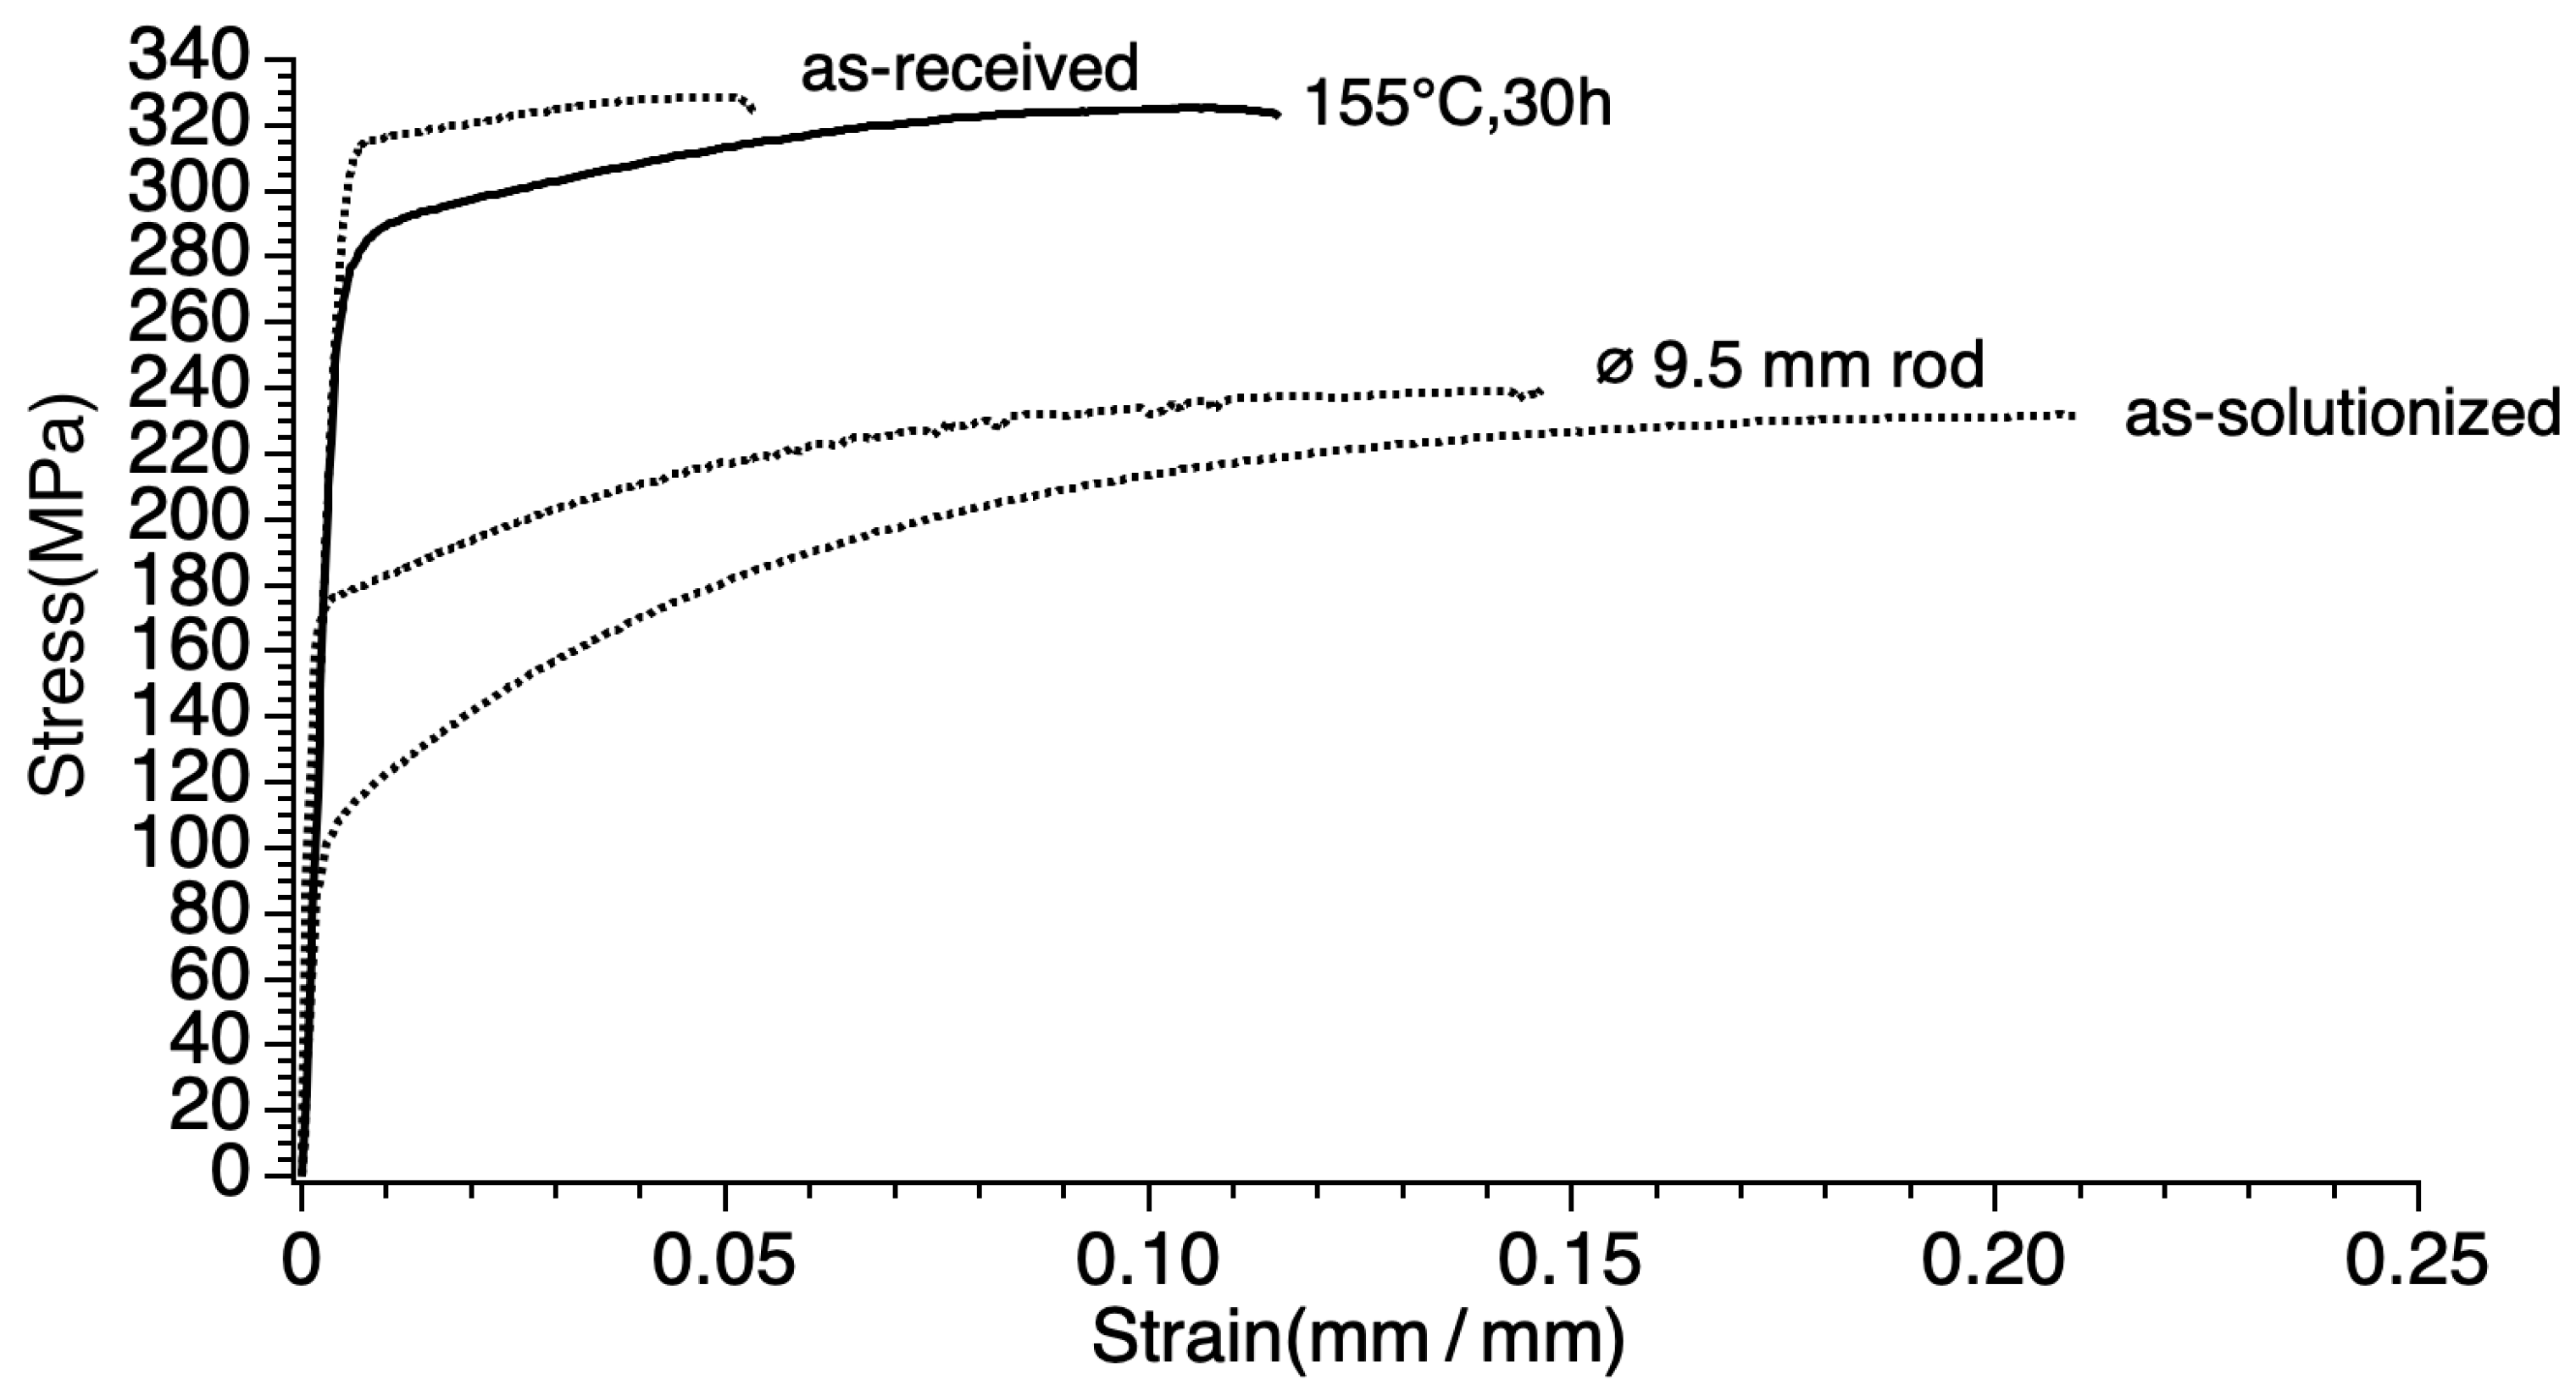
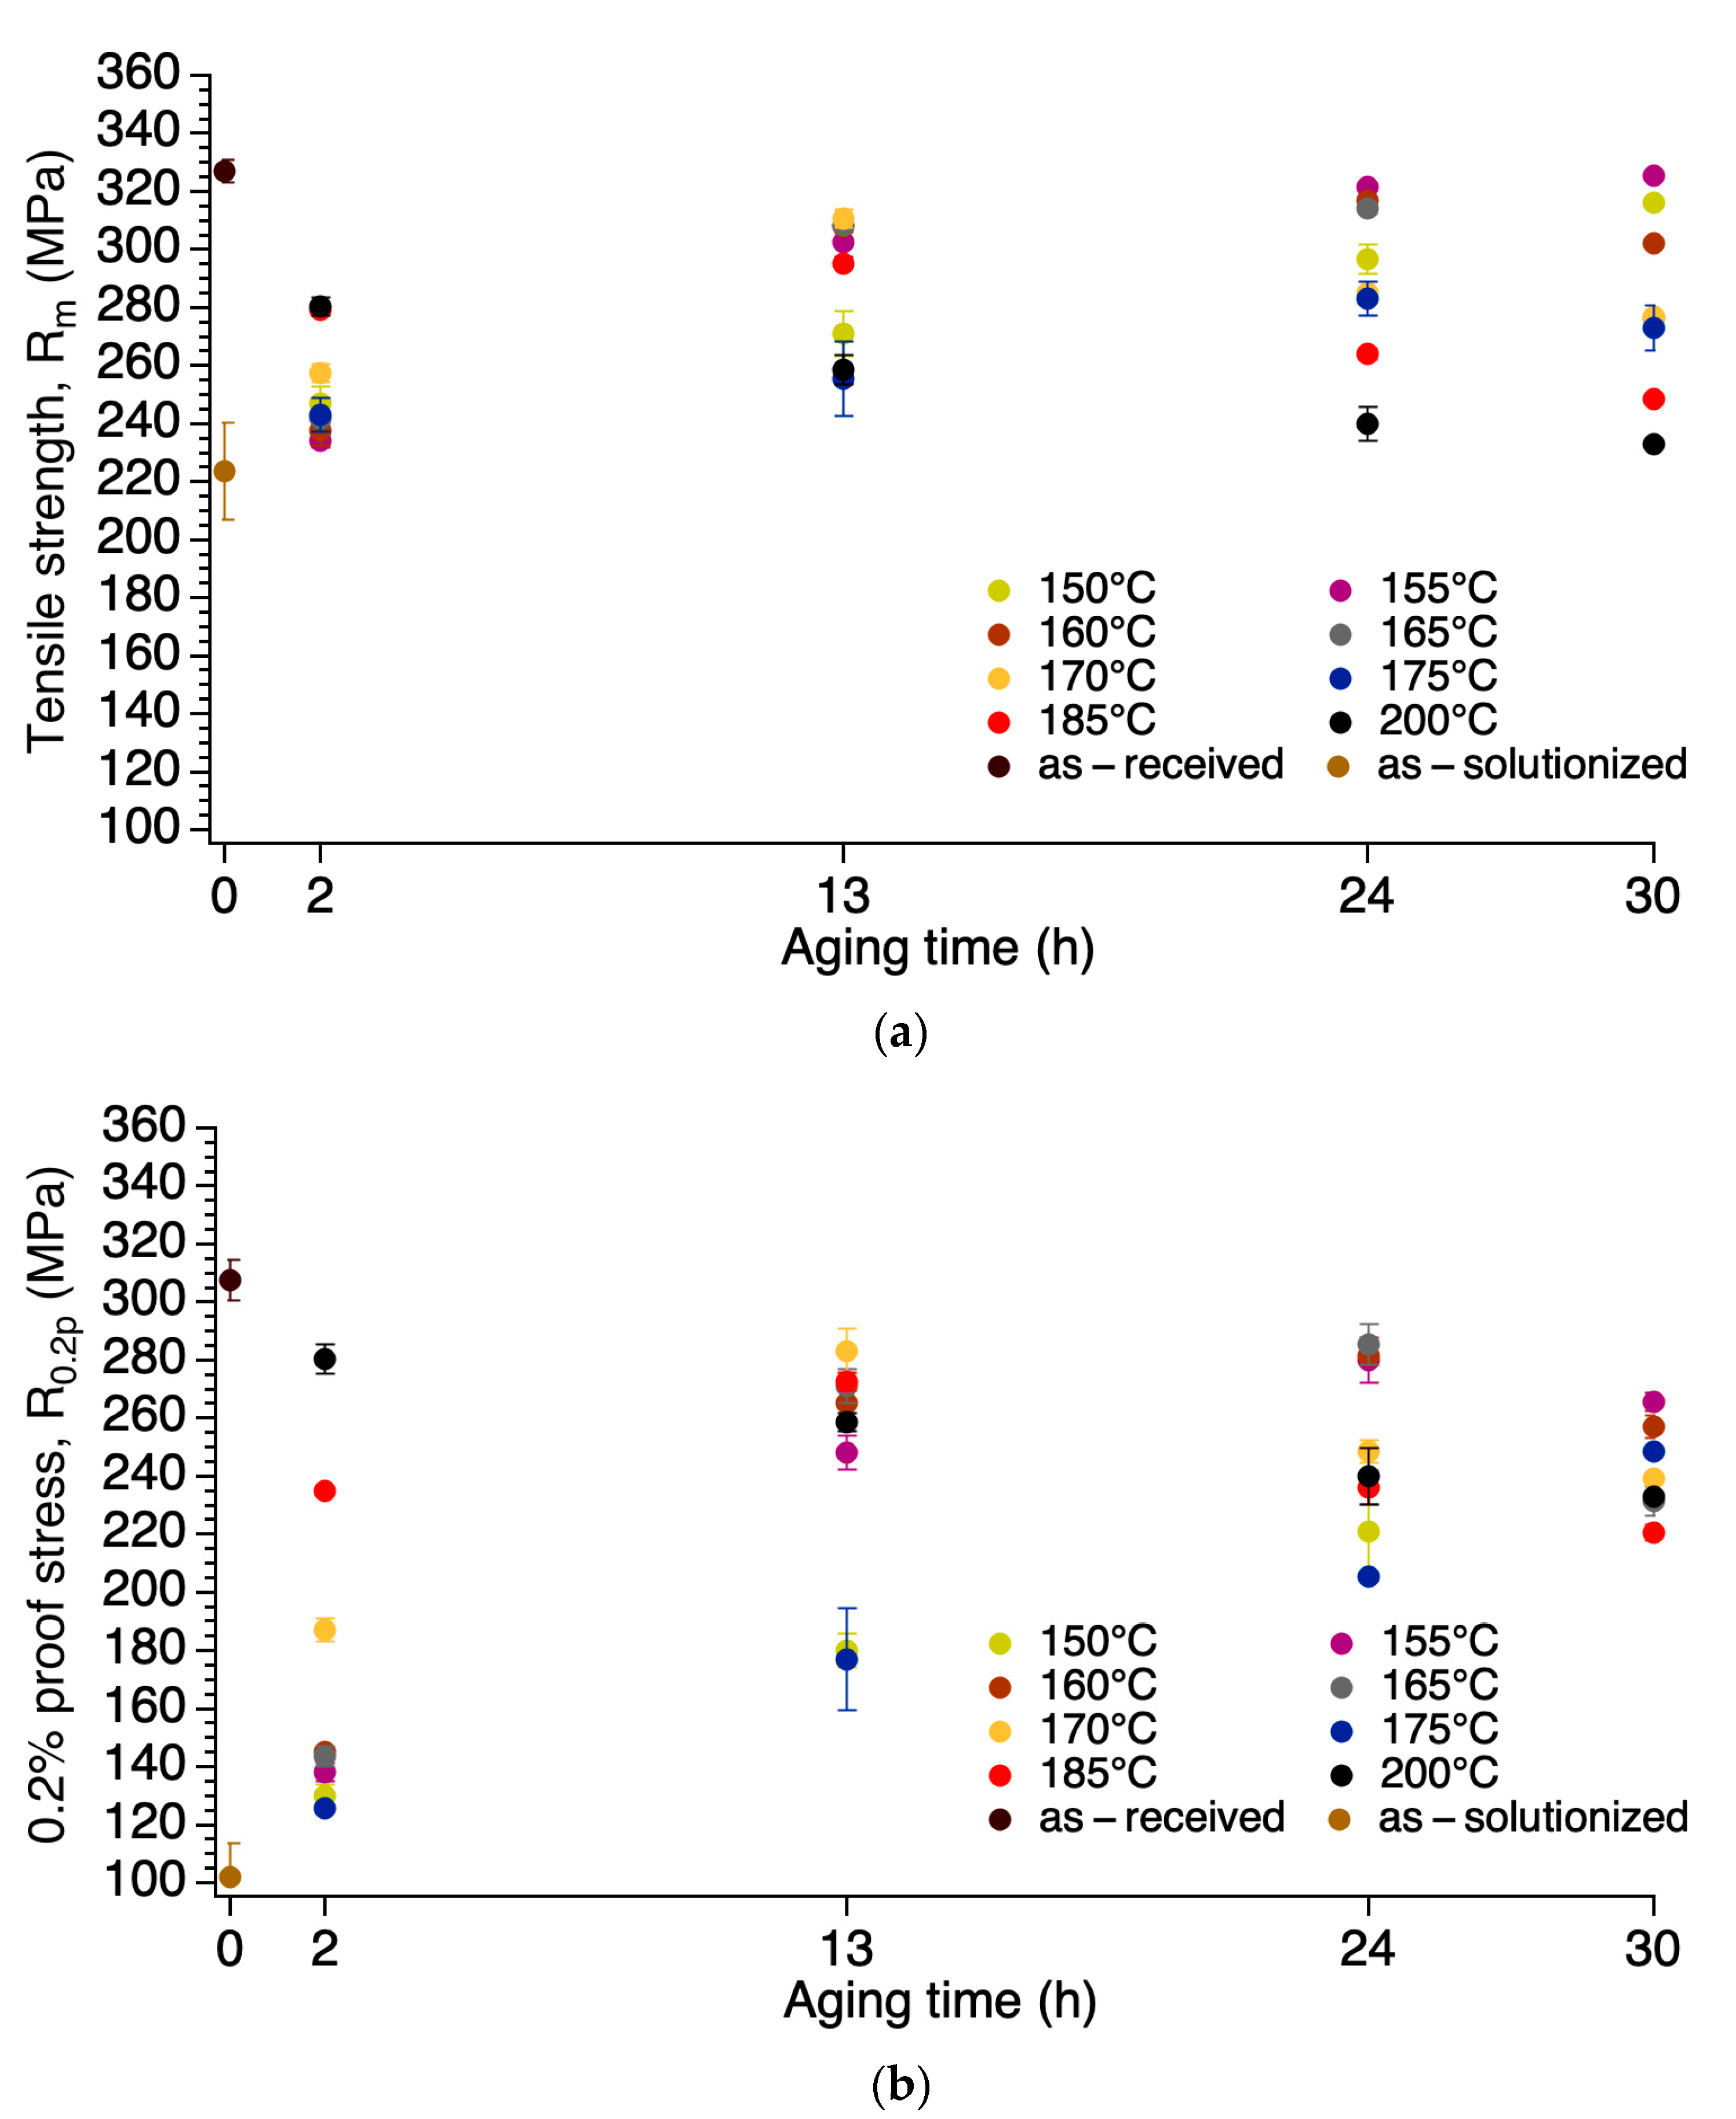
3.1. Mechanical Properties

The ø 9.5 mm rod is an intermediate, not a final product, that emerges after hot rolling the cast bar. The rod diameter may vary around 18, 15, 12, or 9.5 mm; wires which are used in this work were drawn from the ø 9.5 mm rod. The ø 9.5 mm rod has tensile and yield strengths of 240 and 176 MPa, respectively. It has a strain after fracture of 0.145 and a strain hardening exponent of 0.160 (Table 3).
The as-received sample is a heavily cold worked sample, ø 3.50 mm wire, which has the highest tensile and yield strengths of 329 and 311 MPa, respectively. However, it has the lowest strain after fracture of 0.055, hence a small strain hardening exponent of 0.0385. Among all investigated samples, it has the highest strengths and the lowest strain; tensile strength and strain are higher than the minimum accepted values according to both the ASTM B398 and the British Standard incorporating a European Standard BS EN 50183, 295 MPa and 0.035, respectively [1,25].
The as-solutionized sample is a ø 3.50 mm wire after solution heat treatment, it has tensile and yield strengths of 232 and 108 MPa, respectively, with a strain after fracture of 0.205. Solutionizing heat treatment decreases both tensile and yield strengths by one-third and two-thirds (the lowest strengths), respectively, while elongation was increased by four times. Strain hardening exponent, therefore, is at its maximum value, 0.291.
Samples 150-2, 150-13, 15-24, 150-30, etc., are ø 3.50 mm wires after successive solution heat treatment and artificial aging. Figure 2 shows stress–strain curves of the sample with the best mechanical properties, 155-30, as compared to the ø 9.50 mm rod, the as-received, and the as-solutionized samples. Summarized behaviors of tensile and yield strengths are shown later in Figure.

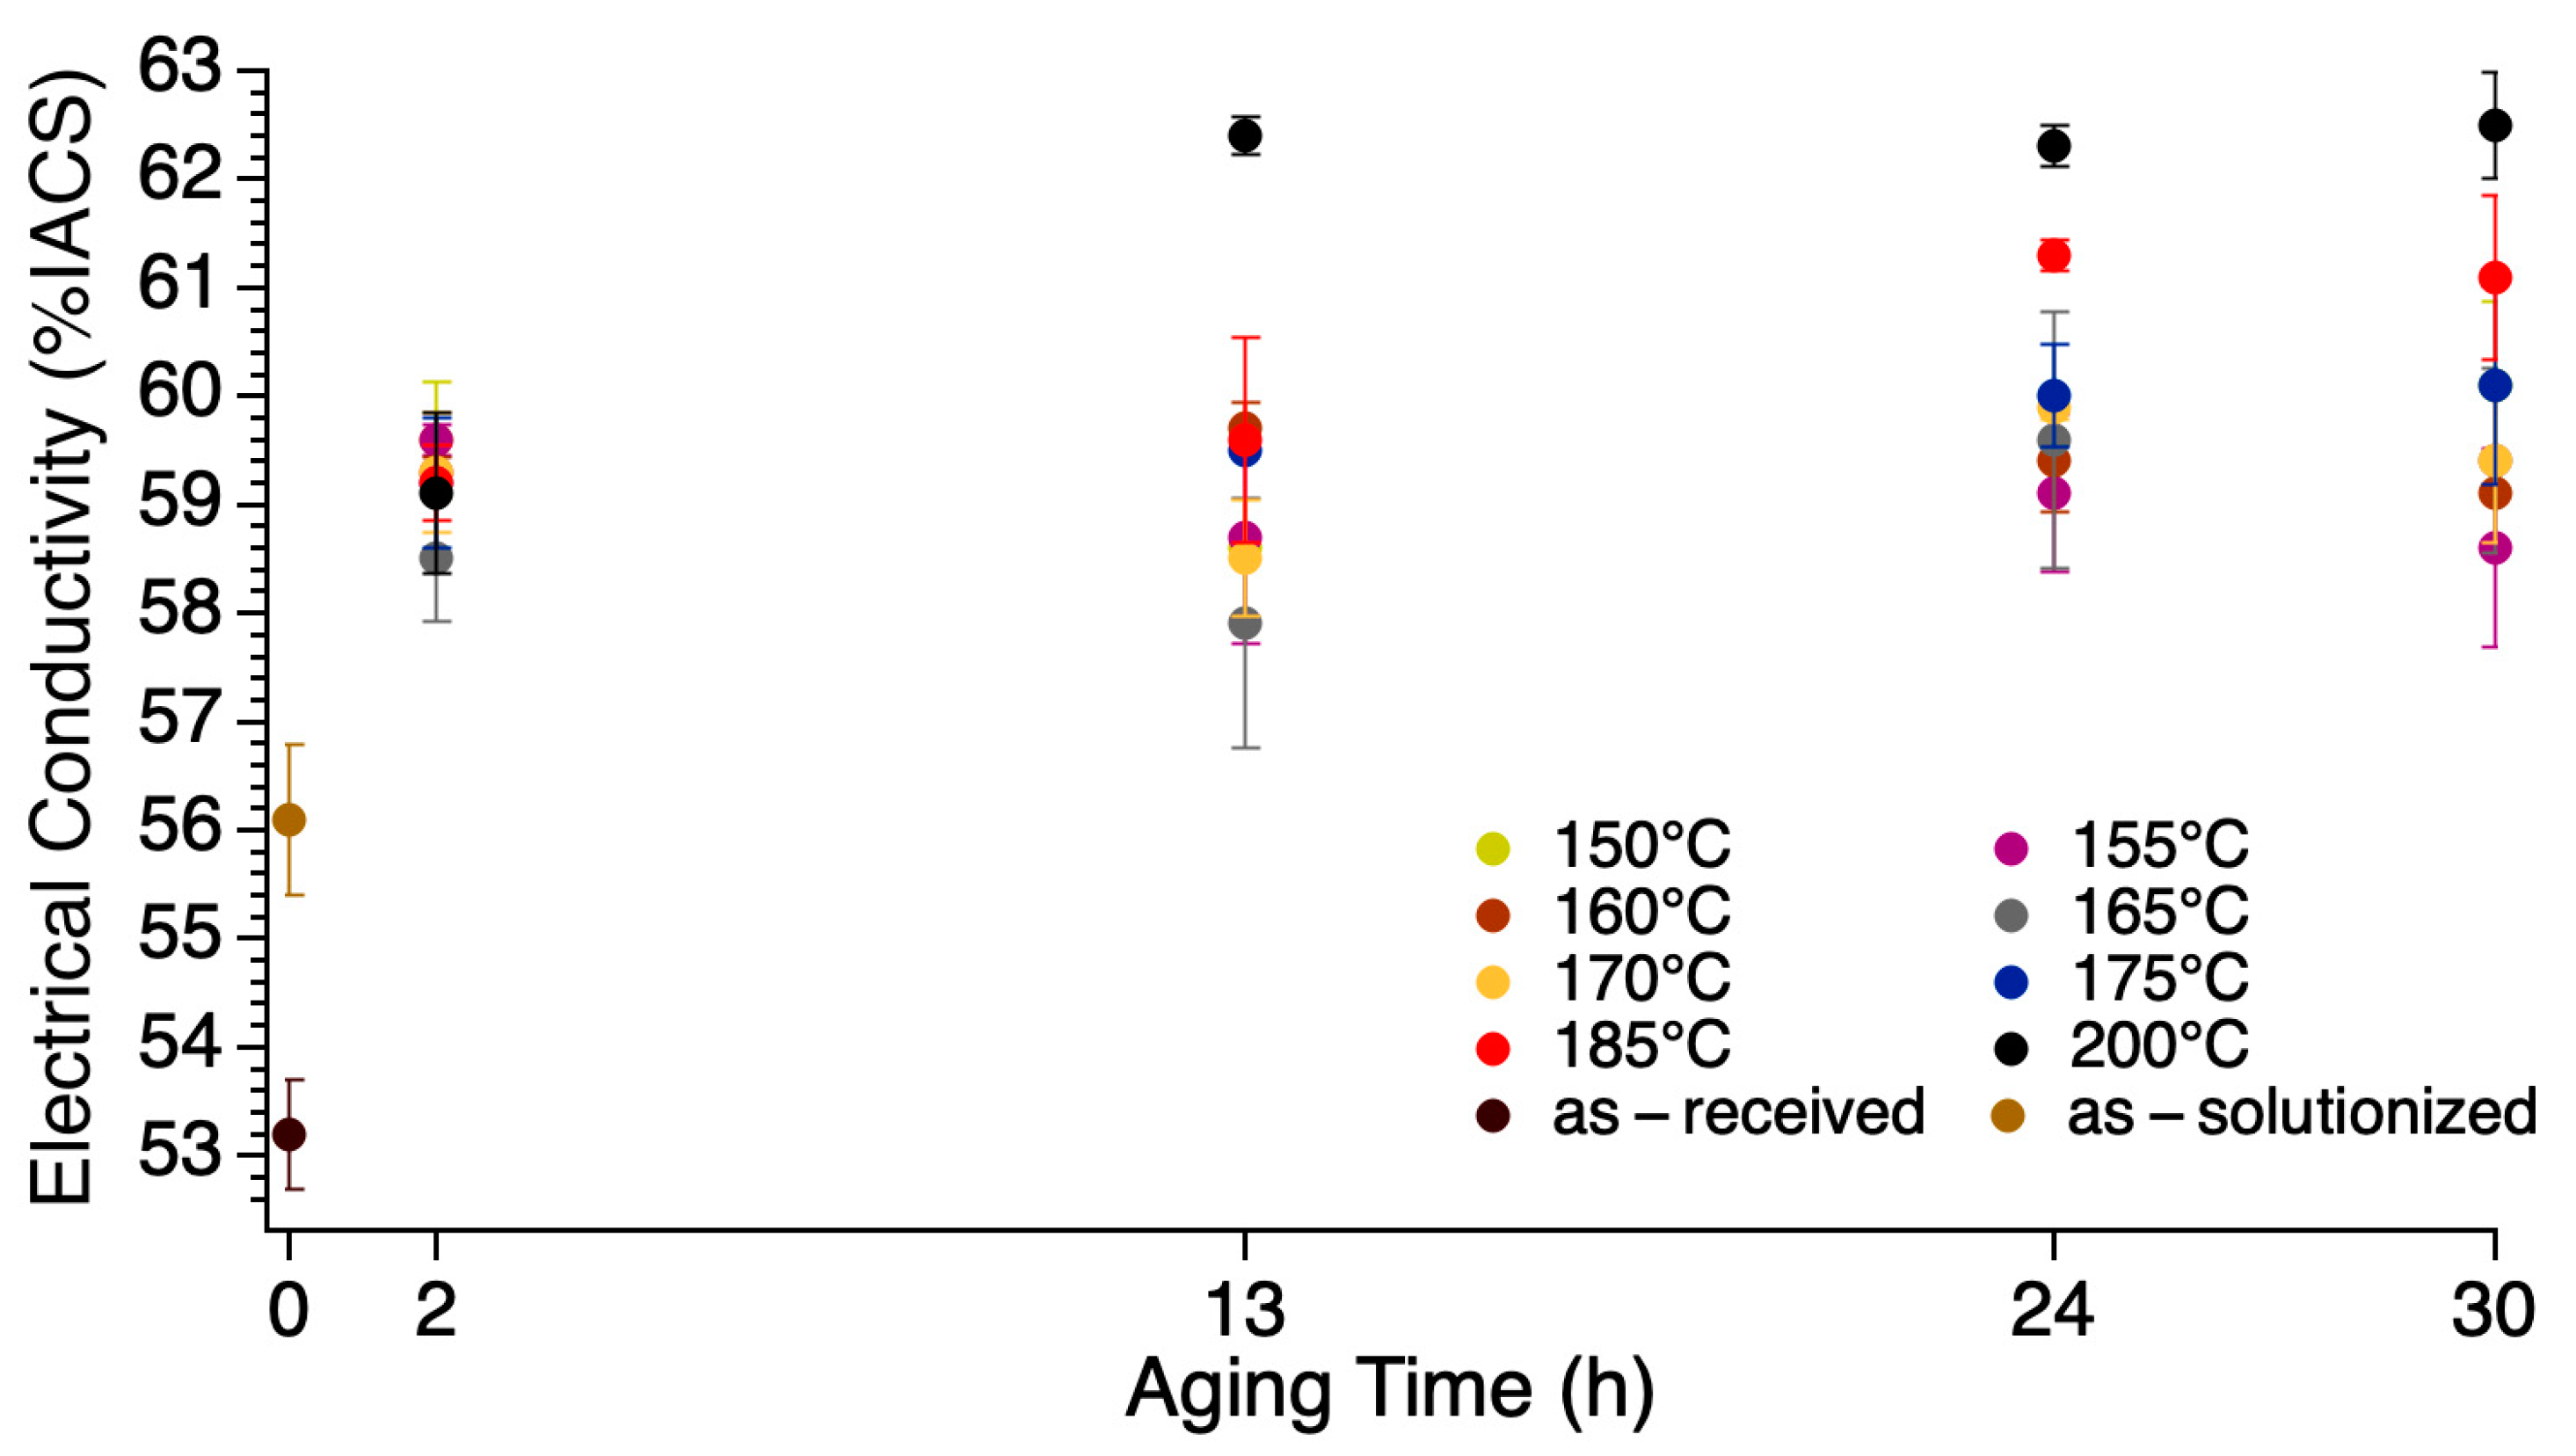
3.2. Electrical Conductivity
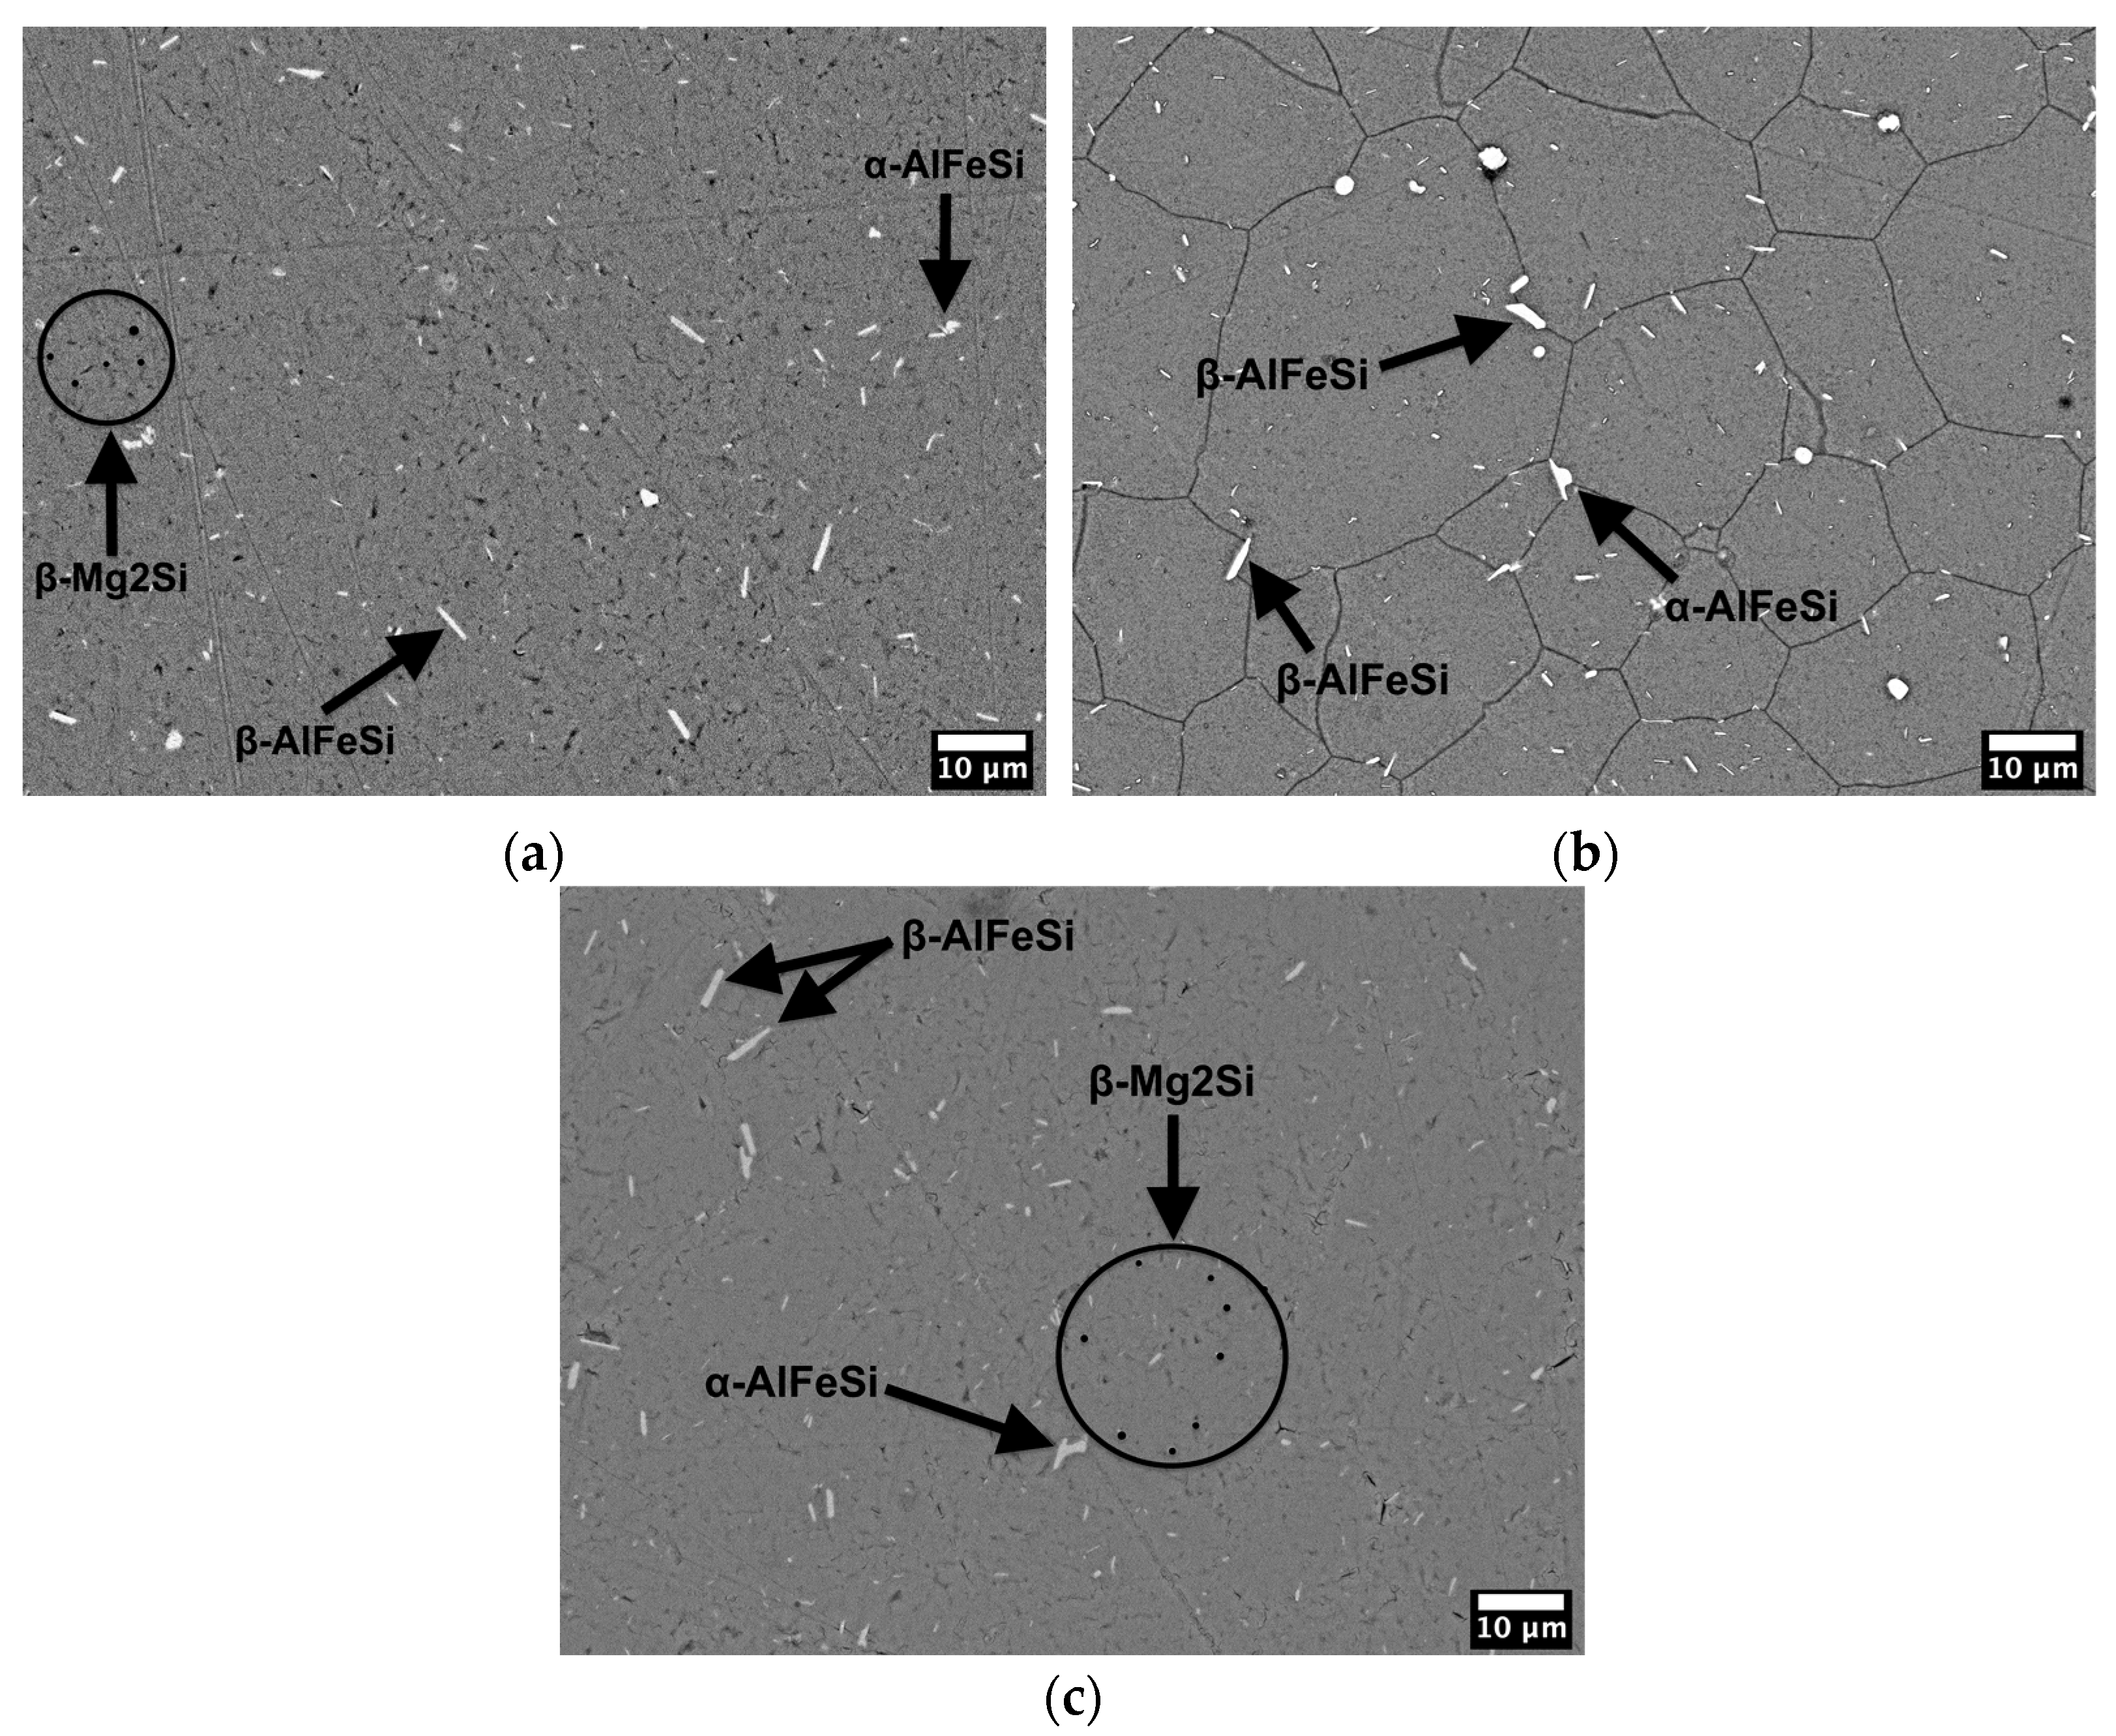
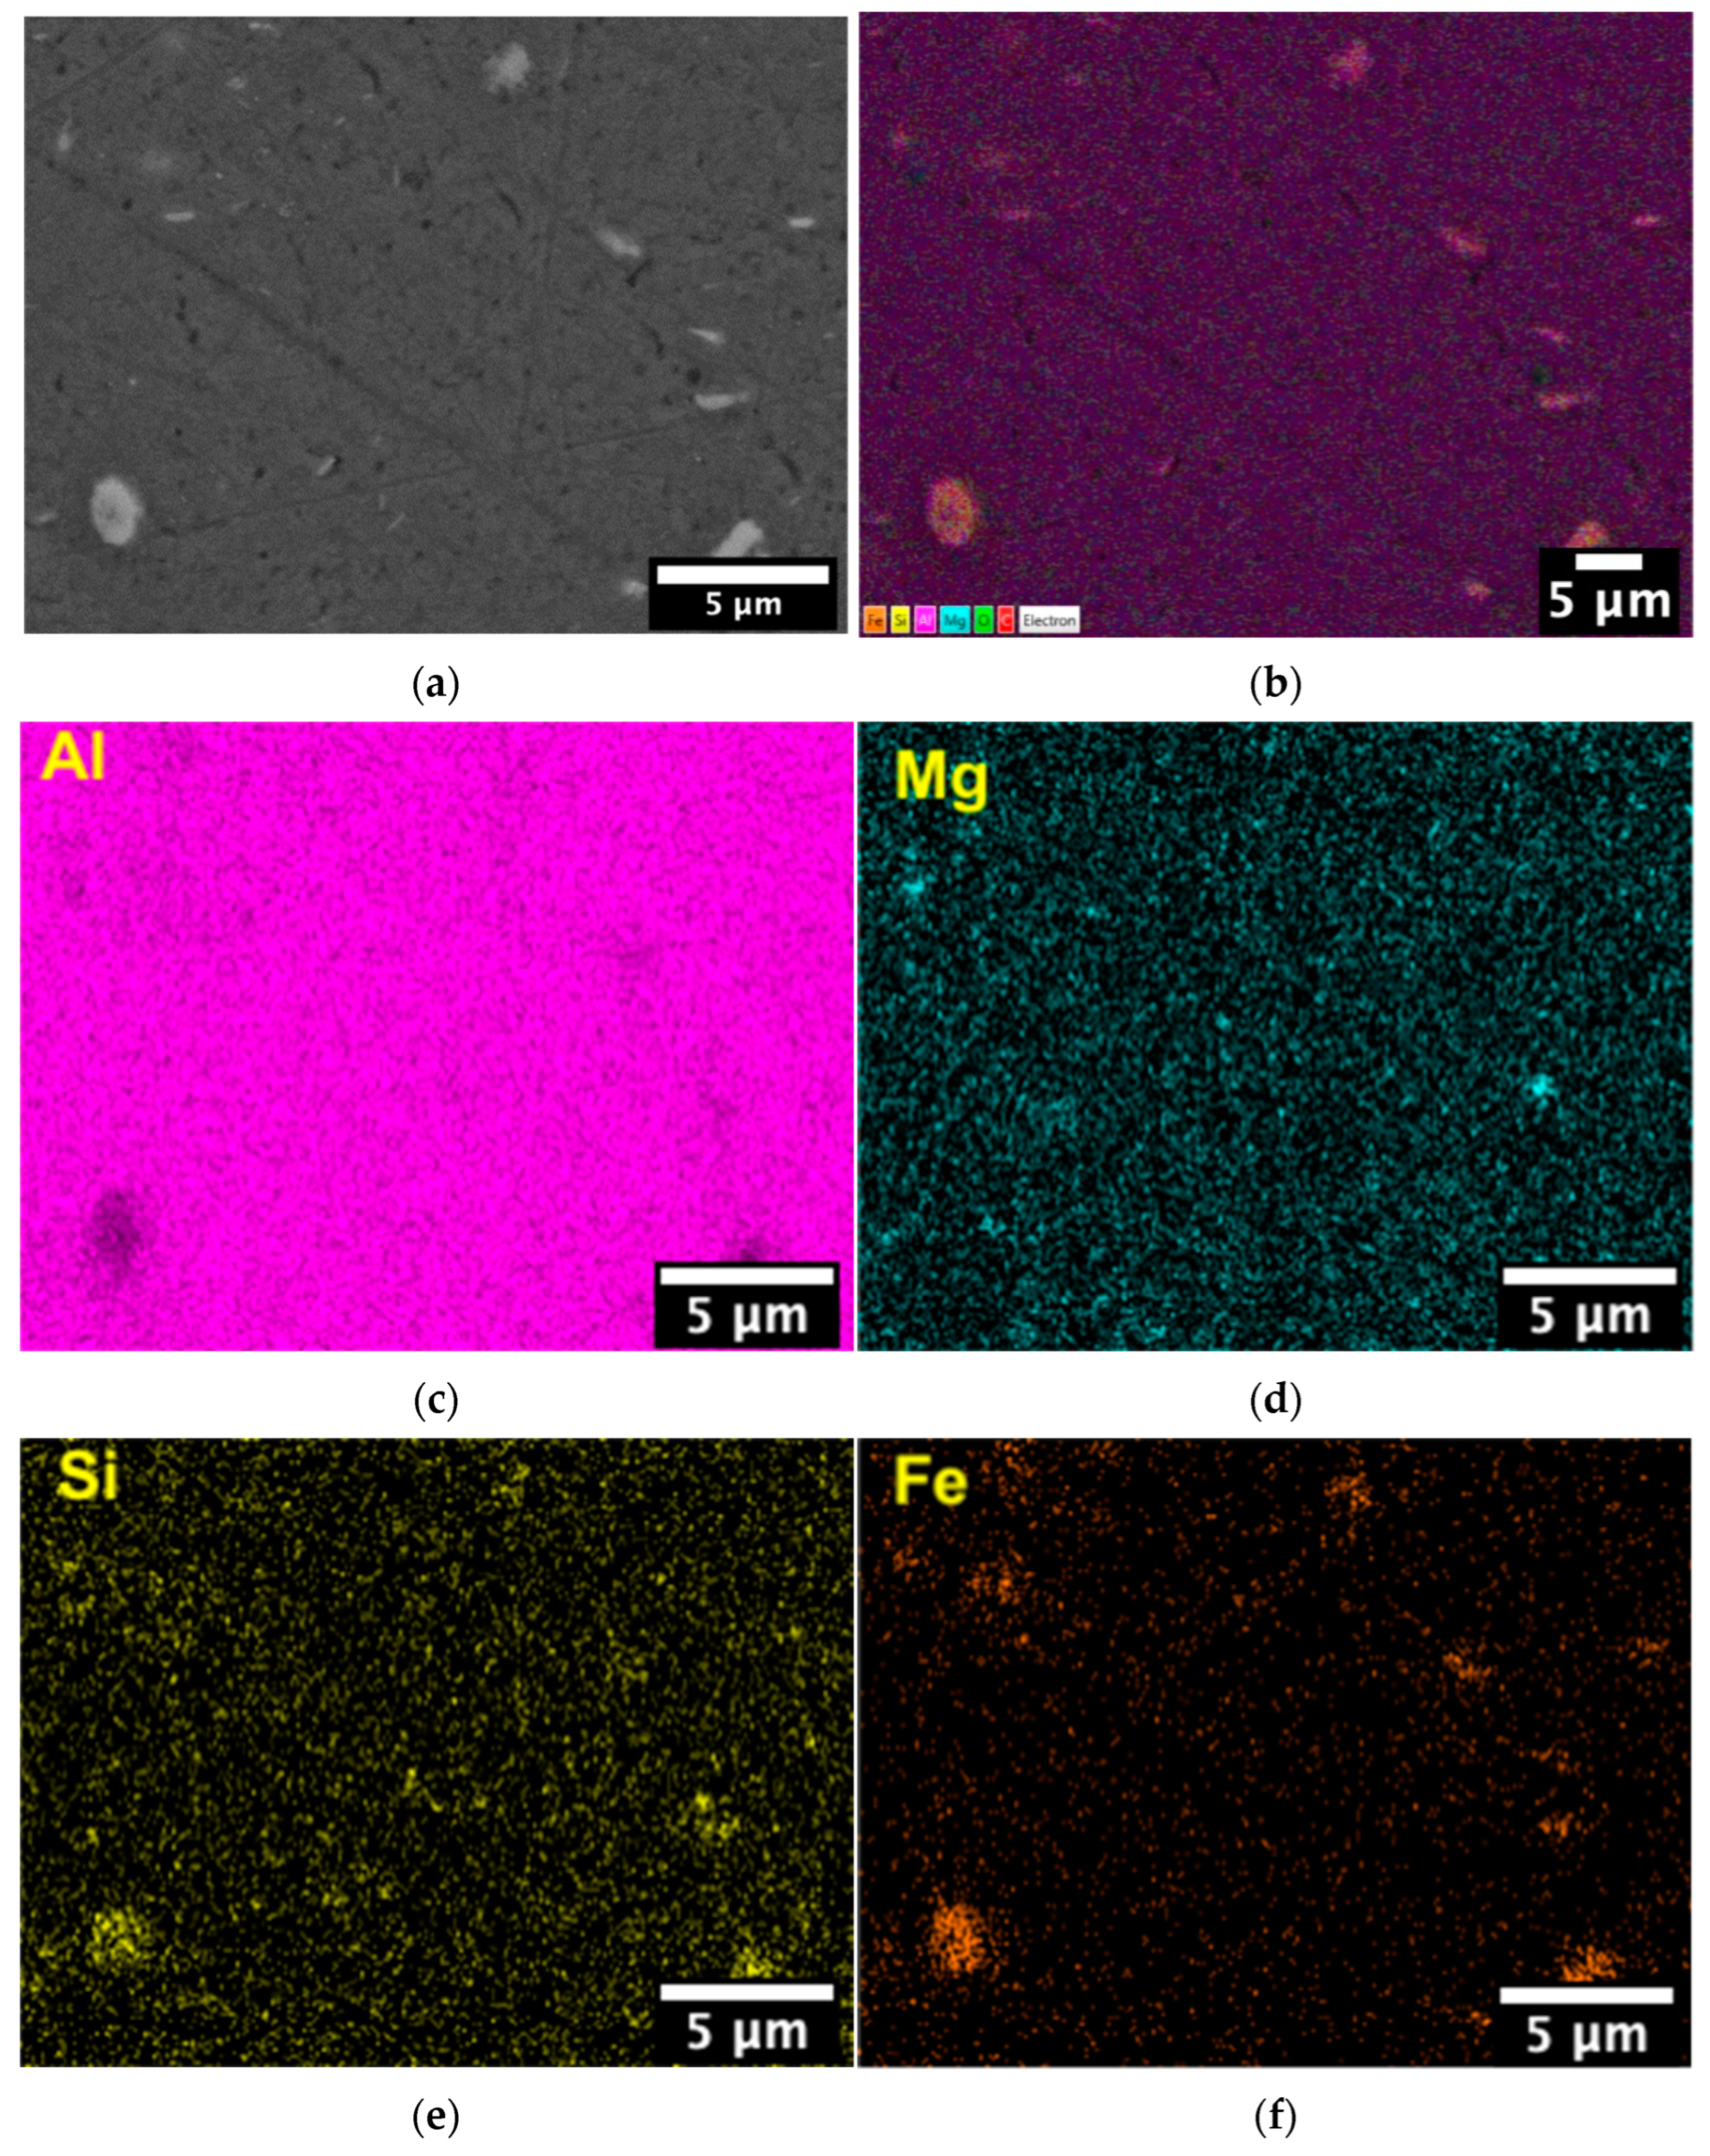
Although electrical conductivity was affected by the aging process (solutionizing and aging heat treatments), it was not specifically affected by each aging temperature and time (Figure 3). However, it can be observed that samples of high strengths (artificially aged at 150 and 155 °C) have relatively lower electrical conductivity than those of low strengths (artificially aged at 175, 185 and 200 °C).
The as-received sample has a low electrical conductivity of 52.7% IACS; it is less than the minimum accepted value, 53% IACS, according to the British Standard incorporating a European Standard BS EN 50183 [25]. This low electrical conductivity is due to the effect of the cold work; heavily cold worked metals usually have a large dislocation density, which work as obstacles to electron motion (also known as electron scattering).
During solution treatment, stresses are released, the microstructure becomes relaxed, solute atoms and second phase particles are dissolved in the matrix, and dislocations are annihilated (decrease). Crystal defects would decrease and there will be less obstruction to electron motion hence electrical conductivity would increase; this would be accompanied by a large decrease in the tensile strength. These changes in microstructure resulted in a medium electrical conductivity of 56.7% IACS. Further artificial aging resulted in a high electrical conductivity of up to 63.7% IACS.
Microstructure image analysis is conducted in order to investigate the structure-property relationship. As well as the as-received and the solutionizing treatments, only one artificial aged sample is considered, 155-30, which has the best compromise of mechanical properties and electrical conductivity (see Table 3).

3.3. Microstructure

Figure 4 shows equiaxed grain structures of the as-solutionized and the 155-30 samples of 23 and 29 µm average grain size diameters, respectively. The as-solutionized had recovered and recrystallized after solution treatment; thus, the microstructure was restored to the pre-hot/cold working conditions. It is expected that grains are still in the grain growth stage even after one hour of solutionizing; this would explain why some grains are larger than others. Further precipitation heat treatment (as in the 155-30 sample) increases the average grain size by 6 µm. The as-received sample is a heavily cold worked sample (86% cold working) of elongated grains, where according to the ASTM E112, there should be no attempt made to measure the grain size of a heavily cold worked material [31]. Similarly, due to the heavily deformed ø 9.50 mm rod (after the hot rolling of the cast bar), it was not possible to measure the grain size.
Figure 5 shows backscattered electron micrographs of the microstructure of the as-received, the as-solutionized and the 155-30 samples at the magnification, 1000×.
AlFeSi intermetallic particles are present in all samples, which formed during solidification and homogenization. Precipitates β-Mg2Si are observed in both the as-received and the 155-30 samples. Figure 6 shows an EDS elemental mapping of the 155-30 sample. AlFeSi intermetallic particles are observed in the Al mapping as the dark areas and as the white/shiny areas in the Fe and Si mappings. β-Mg2Si precipitates are the small phases which appear in the Si, but not in the Fe elemental mappings of the 155-30 sample.

4. Discussion

4.1. Mechanical Properties and Electrical Conductivity

Mechanical properties show different behaviors at the wide range of aging temperatures for the wide range of aging times. The as-solutionized sample is taken as the reference. Figure 7 shows a general improvement in strengths after artificial aging. It shows a persistent increase in tensile and yield strengths with aging time up to 30 h at 150 °C. Tensile strength at 155 °C persistently increases with aging time up to 30 h, while yield strength decreases during the time range 24–30 h. At 160 and 165 °C, the strengths increase with aging time up to 24 h (peak) before they decreases during the range 24–30 h. At 170 °C, the tensile and yield strengths increase with aging time up to 13 h (peak), before they decrease during the time range 24–30 h. At 175 °C, tensile strength increases with aging time up to 24 h of aging (peak), before it decreases during the range 24–30 h; yield strength persistently increases with aging time until after 30 h of aging. At 185 °C, strengths increase with aging time up to 13 h (peak) before they decrease during the time range 13–30 h. Finally, at 200 °C, the strengths persistently decrease with aging time; the peak value is within the first two hours of aging. It is clearly noted that the aging time that is required to reach the peak strength decreases with the increase in the aging temperature; while it took 24 h of aging at the temperatures 160, 165, and 175, and 13 h of aging at the temperatures 170 and 185, it took only 2 h to reach the peak at the temperature 200 °C.
The highest tensile strength was obtained after 30 h of aging at 155 °C; it is almost equal to that of the as-received. High tensile strength values were also obtained after the treatments 150-30 and 160-24. On the other hand, low values were obtained at the high aging temperatures 175, 185, and 200 °C. Yield strength shows the same behavior as that of tensile strength, but with large deviations at a fixed aging time. For example, the treatment 170-13 yields a 160 MPa stress larger than the treatment 175-13, while the difference in tensile strength of the same samples is 55 MPa.
The electrical conductivity shows an overall proportional behavior with aging temperature and time (Figure 3). A significant increase occurred during the first two hours; after that, the electrical conductivity was not significantly affected by each specific aging temperature and time. The values at all temperatures and times were unexpectedly high; they are higher than that of the 1xxx series aluminum electrical conductors 1350 (61.0% IACS) according to the ASTM B230 standards [32].
The strengths are inversely proportional to the electrical conductivity; tensile strength values are relatively low when electrical conductivity values are high (Figure 8). A linear equation that relates tensile strength (Y) with electrical conductivity (X) is shown in Figure 8b.

4.2. Microstructure

The low solid solubility Fe, Si, and Mg elements segregate the remaining liquid during solidification and form the intermetallic compounds α-AlFeSi (Al8Fe2Si) and β-AlFeSi (Al5FeSi and Al9Fe2Si2). α-AlFeSi has a Chinese script morphology while β-AlFeSi has an acicular morphology. α-AlFeSi has greater diffusivity with the matrix than β-AlFeSi; thus, it has stronger interphase bonding. Due to its compact shape, α-AlFeSi presents less stress concentration to the matrix. Therefore, α-AlFeSi is more desirable since it is less deleterious to mechanical properties. In fact, the volume fraction of the non-desired β-AlFeSi is far higher than that of the α-AlFeSi in all three samples (see Figure 5). The volume fractions of the intermetallic phase are found to be 0.78, 0.90, and 0.87% for the as-received, as-solutionized, and the sample artificially aged at 155 for 30 h (155-30), respectively. This intermetallic precipitate has been observed in other studies of various 6xxx alloys as well, but none of them determined its volume fractions [7,33].
The area fractions of the precipitate are 0.18 and 0.44% for the as-received and the 155-30 samples, respectively; the 0.44% area fraction is responsible for the improvement in strength in the artificially aged sample 155-30. The same conclusion was drawn by [7,33], but neither of them determined the precipitate area fraction. In addition, the increase in electrical conductivity with aging temperature and time implies that a high volume fraction of precipitates is present; precipitate formation consumes alloying elements, which are the main obstacles to electron motion. A reduction in alloying elements reduces electron scattering and, hence, increases electrical conductivity.
The precipitation state can be extracted using the strength behavior with aging time and temperature (Figure 7a). At the aging temperatures 150 °C and 155 °C and during the aging time 2–30 h, precipitates transformed from GPZ (Gunier Preston zones)-I to GPZ-II and subsequently to the needle-like, coherent β″-Mg2Si. The increase in strength with aging time is associated with the nucleation and growth of GPZ-I and GPZ-II (underaged) up to (peak), which is associated with the presence of the needle-like, coherent β″-Mg2Si. However, 30 h of aging at both temperatures was not enough for precipitates to transform (become coarser) into the semi-coherent, rod-like β′-Mg2Si and subsequently to the non-coherent, rod-like, stable β-Mg2Si; a longer aging time may be needed. A reduction in strength after the peak implies precipitate coarsening. At the aging temperatures 160, 165, and 175 °C, the peak value was obtained after 24 h, and thereafter, β″-Mg2Si transformed into β′-Mg2Si (overaged). The β″-Mg2Si transformation into β′-Mg2Si occurs after 13 h of aging at the temperatures 170 and 185 °C and within only two hours at 200 °C. The β′-Mg2Si transformation into β-Mg2Si (overaged) may occur, and is more likely at high temperatures.
The average grain size diameters of the as-solutionzed and the 155-30, 23, and 29 µm, respectively, are equal to the findings of [7], but less than the findings of [9,33]; this difference may be due to the different processing [9] and the different composition [33]. Taking the as-solutionized sample as the reference, the overall grain structure and area fraction of intermetallics are unchanged due to aging, and they are also not affected after varying the artificial aging temperature and time (see Figure 4 and Figure 5), which agrees with [33]. The area fraction of precipitates, on the other hand, has doubled after successive solutionizing and aging at 155 °C for 30 h. The precipitate area fraction was hardly measured using the BSE SEM images, which means that the sample 155-30 is in the underaged region and precipitates are fine, not coarse, which agrees with the findings of [33] as well.
Figure 9 shows the relationship of tensile strength versus electrical conductivity, which were achieved in this current and those previous studies of the same aluminum alloy electrical conductor. In this current study, a 326 MPa tensile strength and a 58.6% IACS electrical conductivity were achieved.
This achieved tensile strength is moderate compared to other studies of different processes (Table 4) [8,10,12,13,14,15]. Alshwawreh et al. [8] tested a ø 3.50 mm wire of the same alloy, achieved a tensile strength of 360 MPa after direct precipitation heat treatment at 130 °C for 5 h. Flores et al. [10] tested a square wire of a 2.65 mm side length and achieved a tensile strength of 410 MPa, in which the solution and precipitation heat treatments were prior to cold working. Higher tensile strength of 426 MPa was obtained after the addition of a 0.008 wt.% Bi to the same processed alloy [10]. Mulazimoglu et al. [12] added 0.003 wt.% Sr to the alloy 6201, and a tensile strength of 345 MPa was attained after a direct precipitation heat treatment at 175 °C for 3 h for a ø 2.80 mm wire. Hu et al. [13] subjected the alloy to a severe plastic deformation, continuous extrusion forming (Conform), and a tensile strength of 345 MPa was attained after a precipitation heat treatment at 120 °C for 3 h for a ø 2.97 mm wire. Murashkin et al. [14] subjected the alloy to a sever plastic deformation, equal channel angular pressing-conform (ECAP-C), and a tensile strength of 364 MPa was obtained after a precipitation heat treatment at 170 °C for 12 h for a ø 3.2 mm wire. Majchrowicz et al. [15] hydrostatically extruded the alloy before further tempered (T8-tempering). ø 4.0 and ø 3.0 mm wires were precipitation heat treated at 180 °C for 7 h and 180 °C for 2 h, respectively, achieved tensile strengths of 332 and 345 MPa, respectively. However, this study achieved the highest electrical conductivity of 58.6% IACS as well as the highest elongation of 11.5%. Alshwawreh et al. [8] achieved 53.5% IACS. Flores et al. [10] attained 53.5 and 52.7% IACS for the two processes, respectively. Mulazimoglu et al. and Murashkin et al. [12,14] attained 54.2 and 56.4% IACS, respectively, as well as elongation of 9.9 and 3.5%, respectively. Majchrowicz et al. [15] attained 58 and 55.8% IACS for the ø 4.0 and ø 3.0 mm wires, respectively, as well as elongation of 8.8 and 5.5% for the wires, respectively. Hu et al. attained an elongation of 7.6% [13].

5. Conclusions

The incorporation of a solution heat treatment between cold working and artificial aging retains strengths and remarkably improves electrical conductivity. Aluminum alloy is still a prominent choice for electricity transmission and distribution lines even though the other old conventional metals (e.g., copper, silver, and gold) or the recently discovered materials (e.g., superconductors) have higher electrical conductivities. Conventional metals such as copper, silver, and gold have good electrical conductivity and good mechanical properties; however, they are expensive and it may not be efficient to have some (mainly silver and gold) as electrical conductors. Superconductors, on the other hand, have almost zero resistivity, but at 0 K; even the recently developed iron-based superconductor is not compatible with the conventional earth temperatures, where they conduct electrons at less than 77 K. Although they can be engineered and manufactured, hence reduced cost, they have poor mechanical properties.
In this study, solution heat treatment is performed to encourage more precipitation (T6-temper). Precipitation not only strengthens metals, but also increases electrical conductivity due to alloying elements consumption; alloying elements are the most prominent obstacle to electrical conductivity, according to the electron classical theory.
The ø 9.50 mm rod of the aluminum alloy 6201 was cold drawn to a ø 3.50 mm wire. The wire was then solution heat treated at 510 °C for an hour, quenched in ice water, and artificial aged at the temperature range 150–200 °C for the time range 2–30 h.
The results show that the electrical conductivity was remarkably high; it exceeded the values of the previous studies as well as that of the 1350 alloy (EC wire), 61% IACS. Tensile strength was retained during artificial aging at the low temperatures 150 and 155 °C and significantly reduced during artificial aging at higher temperatures. The following conclusions could be drawn from this work:
1.
Electrical conductivity persistently increased after each processing step and treatment: 53.0% IACS of the ø 9.50 mm rod, 53.2% IACS of ø 3.50 mm wire (or the as-received), 56.1% IACS of the as-solutionzed, and 62.5% IACS of the sample artificial aged at 200 °C for 30 h (the artificial aging treatment with the largest value).
2.
Tensile strength did not consistently increase nor decrease, but fluctuated after each processing step and treatment: 238 MPa of the ø 9.50 mm rod, 327 MPa of the as-received, 224 MPa of the as-solutionzed, and 326 MPa of the sample artificial aged at 155 °C for 30 h (the artificial aging treatment with the largest value).
3.
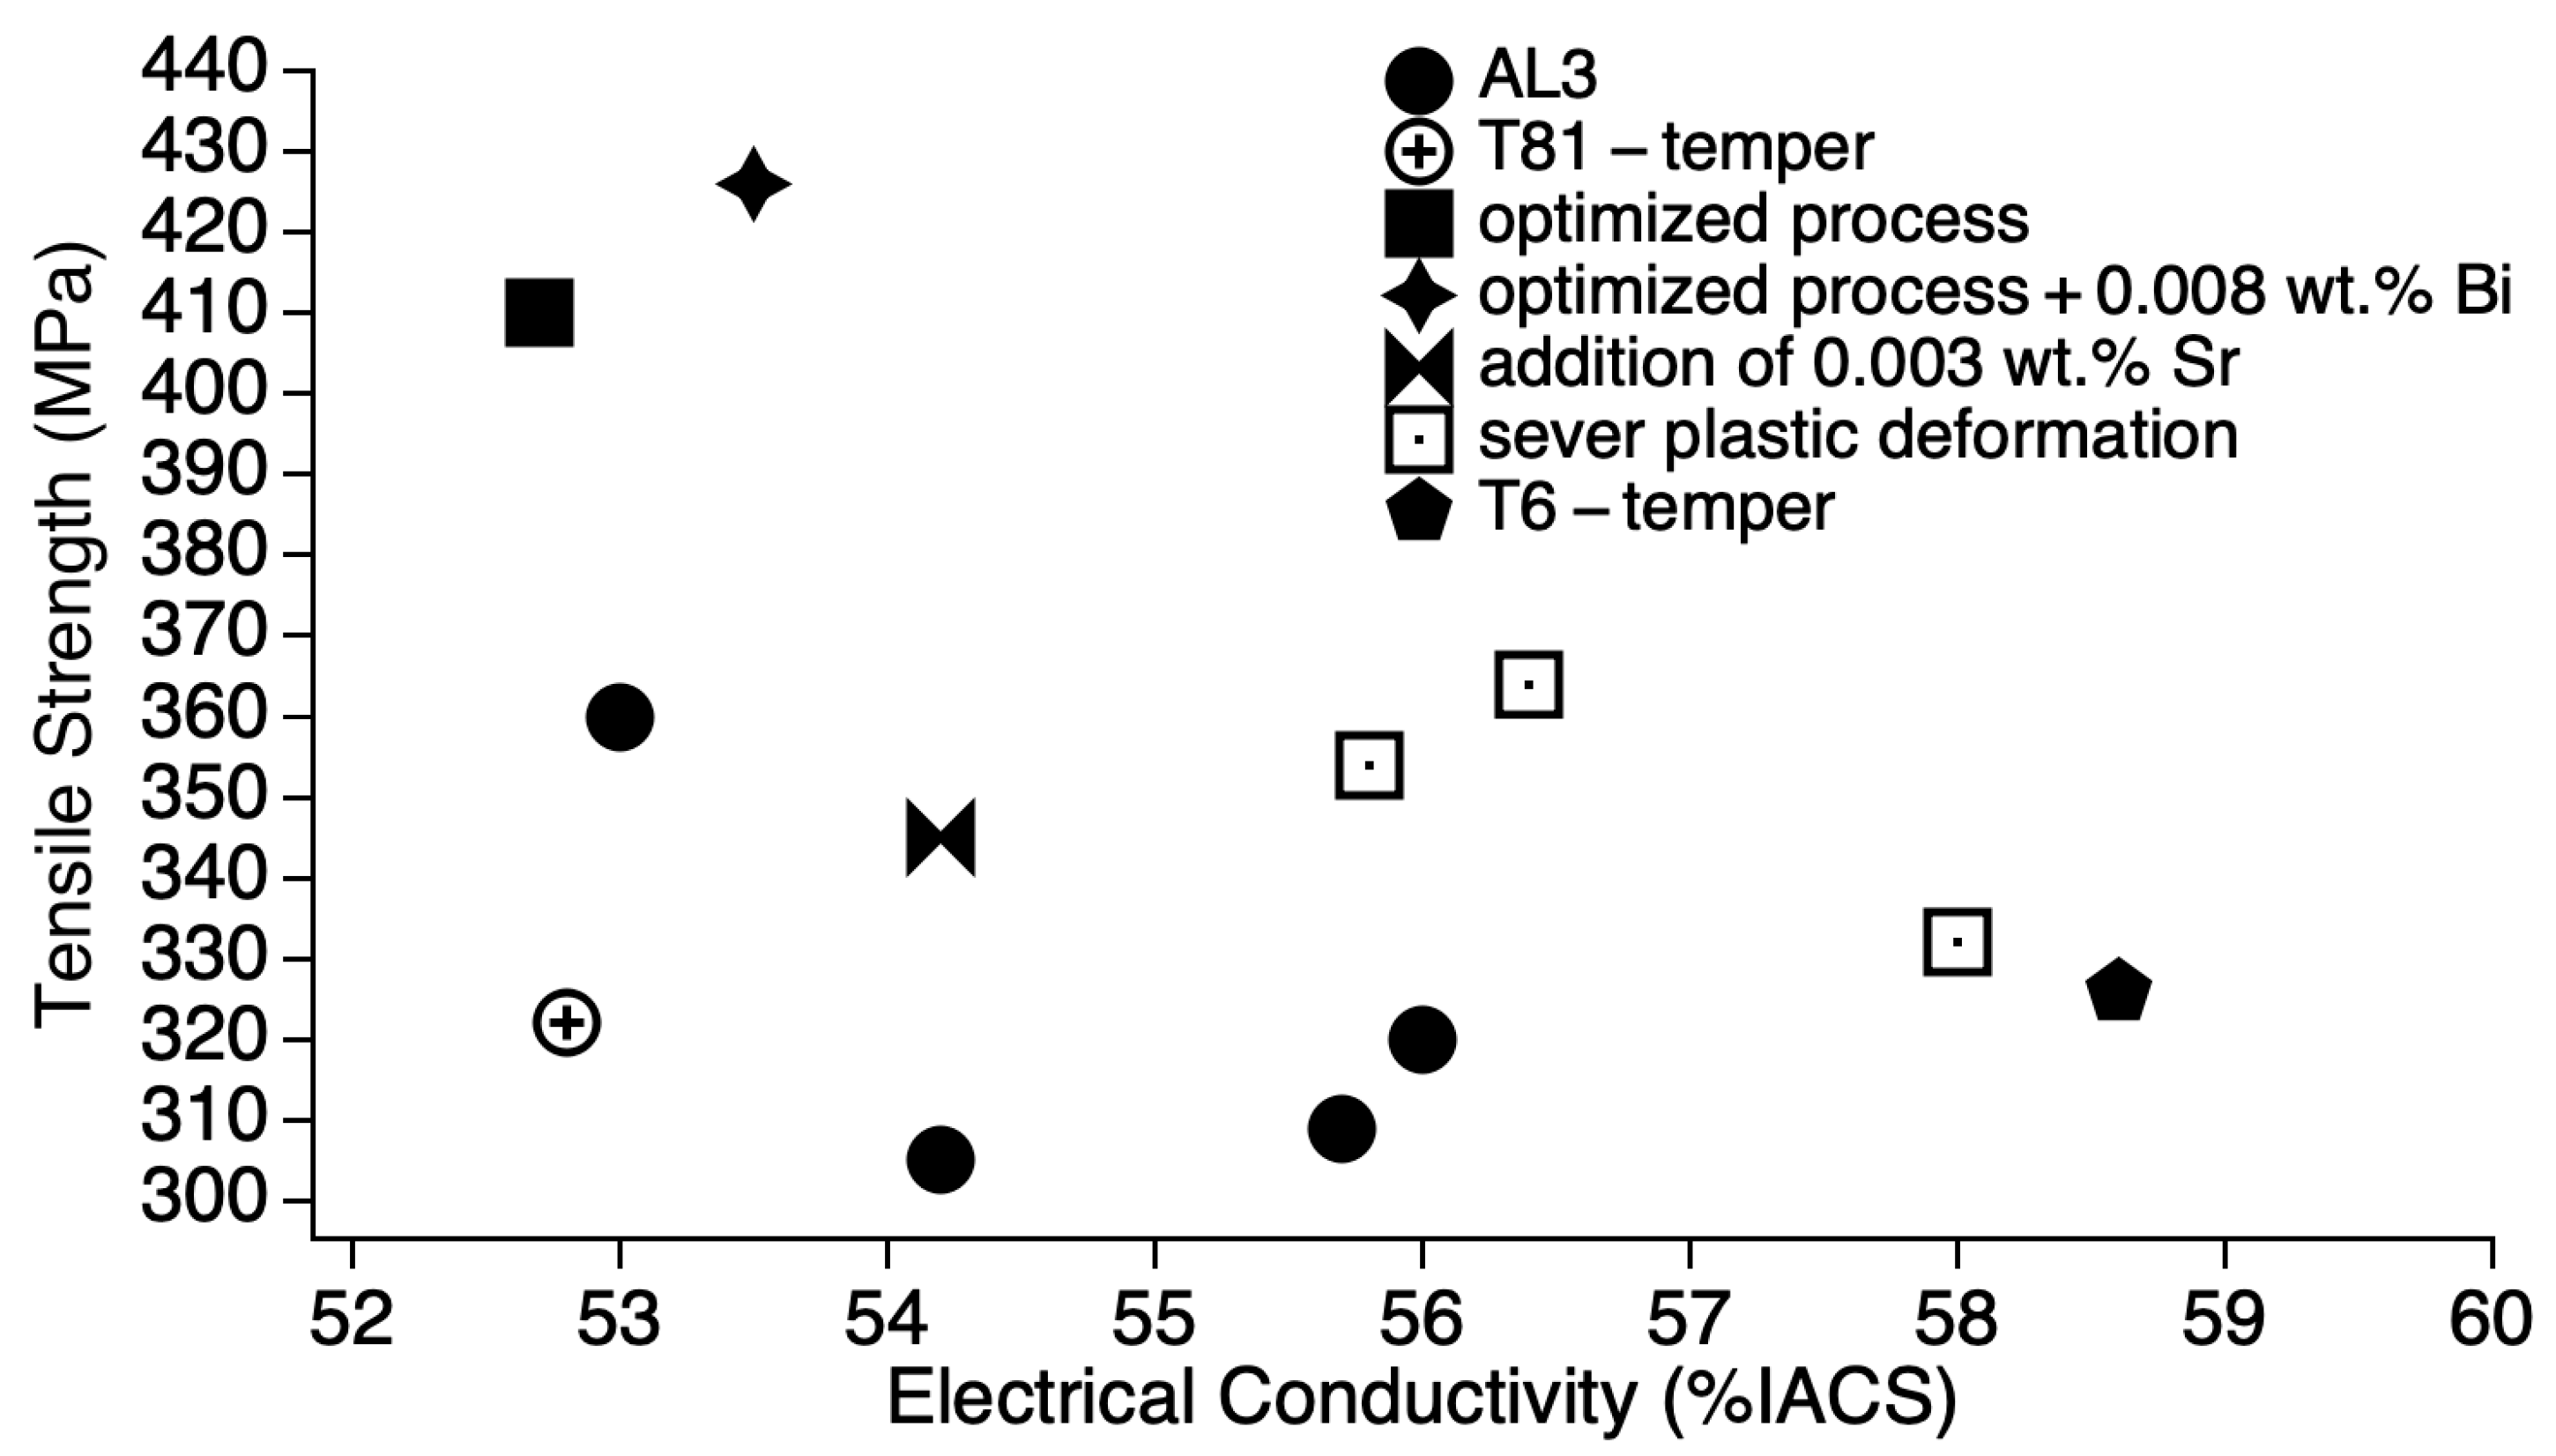
Tensile strength and electrical conductivity were found to have an inverse relationship. The sample artificially aged at 155 °C for 30 h (155-30) shows the best compromise of tensile strength and electrical conductivity; tensile strength was retained as that of the as-received (of the cold worked condition) of 326 MPa. The strain after fracture was as high as 11.5%, higher than the minimum accepted value (3.5%) and the value of the as-received. The electrical conductivity was as high as 58.6% IACS, higher than both the as-received and the as-solutionized samples as well as those of the previous studies.
4.
A significant amount of second phase particles must have nucleated (precipitation), which would explain the retainment of tensile strength, as in the case of the sample artificial aged at 155 °C for 30 h, with the remarkable increase in electrical conductivity. Precipitates are made up from alloying elements; therefore, a high number of precipitates results in low number of alloying elements; the previous is responsible for such strength retainment (after the reduction during solution treatment) and the latter is responsible for the high electrical conductivity.

6. Future Work

Determination of the precipitate volume fraction was not possible using the electron images. A metallurgical software such as MatCalc may be used in the future to determine the volume fraction of the precipitates for all samples. The volume fraction of precipitates will be measured as well for all samples using the software; the experimental results of the as-received, as-solutionized, and the artificially aged sample at 155 °C for 30 h (155-30) will be checked to see if they fit with the software results. Mechanical properties and electrical conductivity can then be correlated with the volume fraction of precipitates.

Author Contributions

Conceptualization, F.A.-J.; methodology, S.Z.Q.; validation, M.A.-M.; resources, A.A.; writing—original draft preparation, A.A.; writing—review and editing, M.A.-M.; supervision, S.Z.Q. and F.A.-J. All authors have read and agreed to the published version of the manuscript.

Funding

This research received no external funding.

Data Availability Statement

Available upon request.

Acknowledgments

I would like to thank Myo Tay Zar Myint, College of Science, Sultan Qaboos University, for SEM characterization. Additionally, I would like to thank Badar Al-Jabri, Oman Aluminum Processing Industries, for providing the aluminum alloy 6201 material.

Conflicts of Interest

The authors declare no conflict of interest.

References

  1. ASTM B398/B398M-15; Standard Specification for Aluminum-Alloy 6201-T81 and 6201-T83 Wire for Electrical Purposes. ASTM: West Conshohocken, PA, USA, 2015. [CrossRef]
  2. Karabay, S. Modification of AA-6201 Alloy for Manufacturing of High Conductivity and Extra High Conductivity Wires with Property Of. Mater. Des. 2006, 27, 821–832. [Google Scholar] [CrossRef]
  3. Karabay, S. Modification of Conductive Material AA6101 of OPGW Conductors against Lightning Strikes. Stroj. Vestn./J. Mech. Eng. 2013, 59, 451–463. [Google Scholar] [CrossRef] [Green Version]
  4. Davies, G. Aluminium Alloy (6201, 6101A) Conductors. In Proceedings of the 1989 International Conference on Overhead Line Design and Construction: Theory and Practice, London, UK, 28–30 November 1988. [Google Scholar]
  5. Sunde, J.K.; Marioara, C.D.; Wenner, S.; Holmestad, R. On the microstructural origins of improvements in conductivity by heavy deformation and ageing of Al-Mg-Si alloy 6101. Mater. Charact. 2021, 176, 111073. [Google Scholar] [CrossRef]
  6. Cho, C.-H.; Cho, H. Effect of dislocation characteristics on electrical conductivity and mechanical properties of AA 6201 wires. Mater. Sci. Eng. A 2021, 809, 140811. [Google Scholar] [CrossRef]
  7. Al-Yagoot, O.H.; Ul-hamid, A. Comparison of Microstructure and Properties of 6201 Al Alloy Wire Obtained by Two Different Hot Rolling Methods. In Conference Proceedings: Advances in Production and Processing of Aluminium (APPA); University of Bahrain: Manama, Bahrain, 2001; pp. 11-4-1–11-4-15. [Google Scholar]
  8. Alshwawreh, N.; Alhamarneh, B.; Altwarah, Q.; Quandour, S.; Barghout, S.; Ayasrah, O. Electrical Resistivity and Tensile Strength Relationship in Heat-Treated All Aluminum Alloy Wire Conductors. Materials 2021, 14, 5738. [Google Scholar] [CrossRef] [PubMed]
  9. Khangholi, S.N.; Javidani, M.; Maltais, A.; Chen, X.-G. Optimization of mechanical properties and electrical conductivity in Al–Mg–Si 6201 alloys with different Mg/Si ratios. J. Mater. Res. 2020, 35, 2765–2776. [Google Scholar] [CrossRef]
  10. Flores, F.U.; Seidman, D.N.; Dunand, D.C.; Vo, N.Q. Development of High-Strength and High-Electrical-Conductivity Aluminum Alloys for Power Transmission Conductors. In TMS Annual Meeting & Exhibition; Minerals, Metals and Materials Series; Part F4; Springer: Cham, Switzerland, 2018; pp. 247–251. [Google Scholar] [CrossRef]
  11. Jin, H.; Guan, R.; Huang, X.; Fu, Y.; Zhang, J.; Chen, X.; Wang, Y.; Gao, F.; Tie, D. Understanding the precipitation mechanism of copper-bearing phases in Al-Mg-Si system during thermo-mechanical treatment. J. Mater. Sci. Technol. 2022, 96, 226–232. [Google Scholar] [CrossRef]
  12. Mulazimoglu, M.H.; Zaluska, A.; Paray, F.; Gruzleski, J.E. The effect of strontium on the Mg2Si precipitation process in 6201 aluminum alloy. Met. Mater. Trans. A Phys. Metall. Mater. Sci. 1997, 28, 1289–1295. [Google Scholar] [CrossRef]
  13. Hu, J.; Zhang, W.; Fu, D.; Teng, J.; Zhang, H. Improvement of the mechanical properties of Al–Mg–Si alloys with nano-scale precipitates after repetitive continuous extrusion forming and T8 tempering. J. Mater. Res. Technol. Korean Inst. Orient. Med. 2019, 8, 5950–5960. [Google Scholar] [CrossRef]
  14. Murashkin, M.; Medvedev, A.; Kazykhanov, V.; Krokhin, A.; Raab, G.; Enikeev, N.; Valiev, R.Z. Enhanced Mechanical Properties and Electrical Conductivity in Ultrafine-Grained Al 6101 Alloy Processed via ECAP-Conform. Metals 2015, 5, 2148–2164. [Google Scholar] [CrossRef] [Green Version]
  15. Majchrowicz, K.; Pakieła, Z.; Chrominski, W.; Kulczyk, M. Enhanced strength and electrical conductivity of ultrafine-grained Al-Mg-Si alloy processed by hydrostatic extrusion. Mater. Charact. 2018, 135, 104–114. [Google Scholar] [CrossRef]
  16. Yang, C.; Masquellier, N.; Gandiolle, C.; Sauvage, X. Multifunctional properties of composition graded Al wires. Scr. Mater. 2020, 189, 21–24. [Google Scholar] [CrossRef]
  17. Jin, H.; Tie, D.; Guan, R. Precipitation behavior during re-aging of Al-Mg-Si-Cu alloy. Mater. Des. 2022, 220, 110883. [Google Scholar] [CrossRef]
  18. Kim, Y.; Mishra, R.K.; Sachdev, A.K.; Kumar, K.S. A combined experimental-analytical modeling study of the artificial aging response of Al–Mg–Si alloys. Mater. Sci. Eng. A 2021, 820, 141566. [Google Scholar] [CrossRef]
  19. Jin, H.; Guan, R.; Tie, D. Mechanical and Conductive Performance of Aged 6xxx Aluminum Alloy during Rotary Swaging. Crystals 2022, 12, 530. [Google Scholar] [CrossRef]
  20. Khangholi, S.N.; Javidani, M.; Maltais, A.; Chen, X.-G. Effects of natural aging and pre-aging on the strength and electrical conductivity in Al-Mg-Si AA6201 conductor alloys. Mater. Sci. Eng. A 2021, 820, 141538. [Google Scholar] [CrossRef]
  21. Sunde, J.K.; Marioara, C.D.; Holmestad, R. The effect of low Cu additions on precipitate crystal structures in overaged Al-Mg-Si(-Cu) alloys. Mater. Charact. 2020, 160, 110087. [Google Scholar] [CrossRef]
  22. Weng, Y.; Ding, L.; Jia, Z.; Liu, Q. Effect of combined addition of Ag and Cu on the precipitation behavior for an Al-Mg-Si alloy. Mater. Charact. 2021, 171, 110736. [Google Scholar] [CrossRef]
  23. Liu, Z.-T.; Wang, B.-Y.; Wang, C.; Zha, M.; Liu, G.-J.; Yang, Z.-Z.; Wang, J.-G.; Li, J.-H.; Wang, H.-Y. Microstructure and mechanical properties of Al-Mg-Si alloy fabricated by a short process based on sub-rapid solidification. J. Mater. Sci. Technol. 2020, 41, 178–186. [Google Scholar] [CrossRef]
  24. Lentz, M.C.; Rengel, M.; Stray, K.; Engler, O. A modified processing route for high strength Al-Mg-Si aluminum conductors based on twin-roll cast strip. J. Mater. Process. Technol. 2020, 278, 116463. [Google Scholar] [CrossRef]
  25. BS EN 50183; Conductors for Overhead Lines-Aluminium-Magnesium-Silicon Alloy Wires. British Standards Institiution: London, UK, 2000; pp. 1–12.
  26. Callister, W.D. Materials Science and Engineering: An Introduction; Materials & Design; John Wiley & Sons: New York, NY, USA, 2009; Volume 12, p. 992. [Google Scholar]
  27. Cofer, D.B.; Bass, J.A. Continuous Casting and Rolling of 6201 Aluminum Alloy. 1971. Available online: https://pdfpiw.uspto.gov/.piw?Docid=03613767&homeurl=http%3A%2F%2Fpatft.uspto.gov%2Fnetacgi%2Fnph-Parser%3FSect1%3DPTO1%2526Sect2%3DHITOFF%2526d%3DPALL%2526p%3D1%2526u%3D%25252Fnetahtml%25252FPTO%25252Fsrchnum.htm%2526r%3D1%2526f%3DG%2526l%3D50%2526s1%3D3 (accessed on 18 February 2020).
  28. B918/B918M-20a; Standard Practice for Heat Treatment of Wrought Aluminum Alloys. ASTM: West Conshohocken, PA, USA, 2021. [CrossRef]
  29. B557-15; Standard Test Methods for Tension Testing Wrought and Cast Aluminum- and Magnesium-Alloy Products (Metric). ASTM International: West Conshohocken, PA, USA, 2015. [CrossRef]
  30. B193-20; Standard Test Method for Resistivity of Electrical Conductor Materials. ASTM International: West Conshohocken, PA, USA, 2020. [CrossRef]
  31. ASTM E112-13; Standard Test Methods for Determining Average Grain Size. ASTM International: West Conshohocken, PA, USA, 2021. [CrossRef]
  32. B230/B230M-22; Standard Specification for Aluminum 1350-H19 Wire for Electrical Purposes. ASTM International: West Conshohocken, PA, USA, 2022. [CrossRef]
  33. Alexopoulos, N.D.; Robson, J.D.; Stefanou, G.; Stergiou, V.; Karanika, A.; Kourkoulis, S.K. Microstructural and mechanical characterization of the aging response of wrought 6156 (Al-Mg-Si) aluminum alloy. Alloys 2022, 1, 180–195. [Google Scholar] [CrossRef]
Figure 1. A set of the performed heat treatment experiments are shown in a temperature-time * chart (a) Hot rolling at 455 °C, (b) quenching to below 120 °C, (c) cooling at room temperature, (d) natural aging for 7–14 days, (e) 86% cold working, (f) solution heat treatment at 510 °C for 1 h, (g) quenching to 0 °C, and (h) artificial aging at 150, 155, 160, 165, 170, 175, 185, and 200 °C for 2, 13, 24, and 30 h. * Time is not to scale.
Metals 13 01111 g001
Figure 2. Stress–strain curves of the sample 155-30 as compared to the ø 9.5 mm rod, the as-received, and the as-solutionized.
Metals 13 01111 g002
Figure 3. Electrical conductivity over various aging temperatures and aging times.
Metals 13 01111 g003
Figure 4. (a) and (b) optical micrographs show the grain structure of the as-solutionized and the 155-30 specimens at the magnification, 1000×, respectively.
Metals 13 01111 g004
Figure 5. Scanning electron micrographs of the microstructure of the (a) as-received, (b) as-solutionized, and (c) 155-30 samples, type backscattered electrons (BSE), at the magnification, 1000×.
Metals 13 01111 g005
Figure 6. EDS elemental mapping of the 155-30 sample. (a) The microstructure without elemental mapping, (b) composed elemental mapping, and elemental mapping for the elements (c) Al, (d) Mg, (e) Si, and (f) Fe.
Metals 13 01111 g006
Figure 7. (a) Tensile strength and (b) yield strength over various aging temperatures and aging times.
Metals 13 01111 g007
Figure 8. (a) A 3D scatter plot shows tensile strength and electrical conductivity values after each artificial aging treatment and (b) a 2D plot shows an inverse linear relationship between the two variables.
Metals 13 01111 g008
Figure 9. Tensile strength and electrical conductivity of the 155-30 sample (T6-temper) as compared to previous studies: AL3, data from [7,8]; T81-temper, data from [9]; optimized process, data from [10]; optimized process + 0.008 wt.% Bi, data from [10]; addition of 0.003 wt.% Sr, data from [12]; and severe plastic deformation, data from [14,15].
Metals 13 01111 g009
Table 1. The chemical composition of the aluminum alloy 6201 in wt.%.
AlMgSiFeCuOther Elements
98.30.630.550.210.080.23
Table 2. Heat treatment experiment set for the ø 3.50 mm wire.
SpecimenPercentage Cold Working (%)Solution Heat TreatmentPrecipitation Heat TreatmentTemper Designation
Temperature (°C)Time (h)Temperature (°C)Time
(h)
As-Received86-----
As-Solutionized5101--O
150-2, 150-13, 150-24, 150-301502, 13, 24, 30T6
155-2, 155-13, 155-24, 155-301552, 13, 24, 30
160-2, 160-13, 160-24, 160-301602, 13, 24, 30
165-2, 165-13, 165-24, 165-301652, 13, 24, 30
170-2, 170-13, 170-24, 170-301702, 13, 24, 30
175-2, 175-13, 175-24, 175-301752, 13, 24, 30
185-2, 185-13, 185-24, 185-301852, 13, 24, 30
200-2, 200-13, 200-24, 200-302002, 13, 24, 30
Table 3. Mechanical properties and electrical conductivity of the sample 155-30 as compared to the ø 9.50 mm rod, the as-received and the as-solutionized samples.
SpecimenTensile Strength,
Rm
(MPa)
Percentage Total
Elongation at after Fracture on 25 mm, At
(%)
0.2% Proof Stress, Non-Proportional Extension a,
R0.2p
(MPa)
Strength Coefficient, K
(MPa)
Strain Hardening Exponent, nVickers Hardness, HV/0.5Electrical Conductivity nΩ·m
(% IACS)
ø 9.50 mm (rod)238 ± 5.014.5 ± 0159 ± 32.25374 ± 00.166 ± 0.011864.8 ± 2.153.0 ± 0.37
ø 3.5 mm (wire)as-received327 ± 3.925.0 ± 0.49308 ± 6.86387 ± 10.78 0.04 ± 0.00992 ± 8.353.2 ± 0.51
as-solutionized224 ± 16.6621 ± 1.47102 ± 11.76448 ± 23.520.298 ± 0.012770.1 ± 1.156.1 ± 0.70
155-30326 ± 0.9811.5 ± 0266 ± 2.94439 ± 4.90.09 ± 0.00584.5 ± 2.158.6 ± 0.91
a Because the materials have no yield phenomenon, the 0.2% proof strength, non-proportional extension (R0.2p) is considered instead.
Table 4. Different approaches are listed, including their pre-treatment and post-treatment mechanical properties and electrical conductivity.
Pre-TreatmentPrecipitation Heat Treatment Temperature and TimePost-Treatment
ReferenceDiameter/Side LengthTensile StrengthElongationElectrical ConductivityHardness, HVTensile StrengthElongationElectrical ConductivityHardness, HV
(mm)(MPa)(%)(% IACS) (°C, h)(MPa)(%)(% IACS)
[This work]3.5327 ± 3.925.0 ± 0.4953.2 ± 0.5192 ± 8.3155, 30326 ± 0.9811.5 ± 0.058.6 ± 0.9184.5 ± 2.1
[7]4.02833.55186170, 73098.355.7102
[8]1.70327-49.3-150, 5305-54.2-
3.50333-49.3-170, 1.5320-56-
130, 5360-53.5-
[9]4.72561.348102180, 43224.7552.8110
[10]2.65----200, 16410-53.5-
200, 7426-52.7-
[12]2.8----175, 33459.954.2-
[13]2.97----120, 33457.6--
[14]3.2----170, 123643.556.4-
[15]4.03057.850.987180, 73328.85891
3.03056.150.689180, 23545.555.895
Disclaimer/Publisher’s Note: The statements, opinions and data contained in all publications are solely those of the individual author(s) and contributor(s) and not of MDPI and/or the editor(s). MDPI and/or the editor(s) disclaim responsibility for any injury to people or property resulting from any ideas, methods, instructions or products referred to in the content.

