Abstract
The recovery of zinc from metallurgical dust sludge is a crucial component of using solid waste as a resource in the metallurgical process, and deep eutectic solvent–ultrasonic synergistic enhanced leaching is an efficient method of doing so with excellent economic effects. The leaching rate of zinc is used as the value of response in this study, along with the four process conditions of leaching temperature, leaching time, liquid–solid ratio, and ultrasonic power. By building a regression model, the relationship between the various parameter components is investigated, and a strategy for optimization is then chosen and confirmed. The findings indicate that, for the parameters of temperature 40 °C, ultrasonic power 90 W, liquid–solid ratio 7:1 g/L, stirring speed 250 rpm, and leaching duration 80 min, the prediction value of the regression model of the zinc leaching rate is 98.47%. The average zinc leaching rate obtained by the 3 parallel verification experiments was 98.49%; the deviation from the regression model’s predicted value was 0.02%. This demonstrated that the experimental results were consistent with those predicted by the regression model, the experimental results were reliable and trustworthy, and the optimization scheme was reasonable and accurate. Compared with the conventional leaching method (leaching rate: 91.61%), the method under ultrasound increased the zinc leaching rate by 6.88%.
1. Introduction
The effective utilization of zinc-containing dust and mud is an important direction for the development of the metallurgical industry in the future. Environmental problems, such as serious problems restricting social development and progress, and how to effectively treat zinc-containing dust and mud, are imminent. China is a major producer and consumer of zinc. According to statistics, in 2022, China’s refined zinc production reached 6.29 million tons [1], but it still needs to import a large amount of refined zinc ore, so the effective treatment of metallurgical dust and mud generated in the production process of the steel industry is an urgent problem that needs to be solved. Zinc is one of the most important non-ferrous metals in modern industry. Due to its excellent electrical conductivity, wear resistance, corrosion resistance, and other physical and chemical qualities, it is extensively utilized in a wide range of industries, including electronics, aviation, medical, construction, and transportation, as well as daily life [2,3]. As China’s economy continues to develop in a hurry, there is an increasing demand for and consumption of steel. At the same time, China is producing more crude steel each year, which results in the production of a significant amount of metallurgical dust that contains zinc [4]. Because of its chemical activity, zinc metal is frequently used as a substitute for precious metals and to separate impurities using its reducing properties; zinc sheets and plates are also employed in the battery production business [5,6,7].
When ultrasonic equipment is added to the traditional leaching process, the leaching rate can be increased, and the response time can be sped up to some amount compared to the traditional leaching method [8,9,10]. Zuzana et al. [11] studied the acidic leaching both of zinc and iron from basic oxygen furnace sludge. The experimental results prove that the amount of leached zinc was the highest (70%) when using a 1 M concentration of sulfuric acid, with the leaching time up to 15 min and at a temperature of 80 °C. Kukurugya et al. [12] studied the behavior of zinc, iron, and calcium from electric arc furnace (EAF) dust in hydrometallurgical processing in sulfuric acid solutions. The results show that the maximum zinc extraction, 87%, was achieved at the following conditions: 1 M H2SO4, 80 °C, and L:S ratio = 50. Lisarb et al. [13] proposed a process based on ultrasonic extraction of rare earth elements from carbonate rocks to avoid using concentrated reagents, high temperatures, and an excessive extraction time. In this pioneering work for rare-earth elements (REE) extraction from carbonatite rocks in a preliminary investigation, ultrasonic baths, cup horn systems, or ultrasound probes operating at different frequencies and power were evaluated. In addition, the power released to the extraction medium and the ultrasound amplitude were also investigated, and the temperature and carbonatite mass/volume of the extraction solution ratio were optimized to 70 °C and 20 mg/mL, respectively. Better extraction efficiencies were obtained by employing an ultrasound probe operating at 20 kHz for 15 min, an ultrasound amplitude of 40%, and a diluted extraction solution. A comparison of results with those obtained by mechanical stirring (500 rpm) using the same conditions was carried out, showing that the use of ultrasound increased the extraction efficiency by up to 35%. Rahimi et al. [14] selected extraction of vanadium from fuel oil fly ash using organic acid extraction from lemon juice, ultrasonication, and a H2O2-assisted leaching process. The V recovery was 88.7% under the optimum conditions of 27.9% lemon juice, 10% hydrogen peroxide, 0.01% solid–liquid ratio, 159 W ultrasonic power, 20 kHz, 2 h ultrasonic time, and 35 °C starting temperature. The effect of time on vanadium recovery was investigated. On this basis, the separate effect of ultrasound on V recovery was investigated, and the results showed that the recovery of V decreased significantly in the absence of ultrasound, indicating that both factors are essential in the leaching process. Yu et al. [15] researched a new method called ultrasound-assisted acid leaching. Compared with regular acid leaching, the ultrasound method reduced the leaching time from 120 to 40 min, and the sulfuric acid concentration reduced from 0.5 to 0.3 mol·L−1. Additionally, the leaching temperature could be reduced from 75 to 45 °C at a leaching rate of 78%. Ding et al. [16] systematically investigated the effect and mechanism of the gallium zinc leaching corundum on flue dust (CFD). The conditions for the leaching of valuable metals were optimized while varying the parameters, such as the leaching time, sulfuric acid concentration, and leaching temperature. It was found that under the conditions of a sulfuric acid concentration of 25 wt%, 90 °C leaching temperature, and 50 min leaching duration, the leaching efficiencies of gallium and zinc can be increased from 62.78% to 82.56% and 94.43% to 99.57%, respectively, as the ultrasound was implemented. Wang et al. [17] designed a two-step leaching method to selectively recover Cd, Zn, Cu, and Pb from metallurgical sludge. In the first step, 82.89% Cd, 55.73% Zn, 10.85% Cu, and 0.25% Pb were leached with 0.7 M HCl for 240 min and then treated with 0.2 M EDTA for 480 min. The leaching efficiency of Cd, Zn, Cu, and Pb was increased to 99.76, 91.41, 71.85, and 94.06%, respectively. Wang et al. [18] studied in detail the elemental migration and transformation behavior of ferric chloride hexahydrate (FeCl3·6H2O) in the process of Zn hydrothermal extraction. The results showed that the leaching efficiencies of the zinc, lead, calcium (Ca), and manganese (Mn) extracted were 97.4%, 98.3%, 93.4%, and 97.5%, respectively, under optimal leaching conditions. Ma et al. [19] proposed an activation pretreatment method combining calcium activation and microwave heating; the results indicated that under the optimal pretreatment conditions, including a microwave activation temperature of 400 degrees C, CaO addition of 25%, and activation time of 20 min, the zinc leaching rate reached 91.67%, which was 3.9% higher than that by the conventional roasting pretreatment.
Deep eutectic solvents have piqued the interest of researchers worldwide as a new green solvent due to their biodegradability and low cost, as well as their promising results in a variety of sectors, such as chemical reactions and separation procedures [20,21,22,23,24]. Wang et al. [25] investigated the leaching of zinc from ZnO dust by adding nitrilotriacetic acid (NTA) to choline chloride-urea deep eutectic solvent. The effects of major leaching process parameters, such as leaching temperature, leaching time, solid–liquid ratio, and NTA concentration, were investigated. At a leaching temperature of 79.0 °C, a leaching time of 35.4 h, a liquid/solid ratio of 12:1, and an NTA concentration of 0.07 mol/L, zinc recovery reached 87.9%. He et al. [26] proposed an efficient and safe method for the leaching of LiNixCoyMnzO2 (NCM) cathode active material from waste LIBs using choline chloride-phenylphosphonic acid deep eutectic solvents (DES) as the raw material. The leaching conditions were optimized according to the leaching time, solid–liquid ratio, and leaching temperature. Under the optimal experimental conditions, the leaching efficiencies of Li, Co, Ni, and Mn reached 97.7%, 97.0%, 96.4%, and 93.0%, respectively. Niu et al. [27] used a novel choline-urea ionic liquid as a leaching agent. The conventional and ultrasonic leaching of zinc were compared, and the influence of the liquid–solid ratio, temperature, time, ultrasonic power, and other conditions on the zinc leaching rate were analyzed. The results showed that the choline chloride-urea ionic liquid has a special solubilization ability for ZnO, and the leaching rate of Zn at temperature 60 °C, ultrasonic power 350 W, and leaching time 240 min reached more than 98%. Compared with the literature in this paper, the leaching agent was replaced by ChCl-MA with better effect. Meanwhile, the full-factorial optimization design was adopted to reduce the number of experiments and the consumption of the main experimental parameters.
Although the traditional methods of acid or alkaline treatment are effective in recovering zinc from dust sludge containing zinc, they are also prone to release toxic fumes, and the waste liquid is difficult to manage, leading to environmental pollution. Deep eutectic solvent–ultrasonic synergistic enhanced leaching is a reasonable and efficient way to leach zinc when compared to conventional leaching with a variety of acids and bases, not only because the experiment is straightforward, the process is quick and cheap, and the waste solution disposal is simple, resulting in the least amount of environmental pollution, but also because the leaching rate is relatively high [28]. Experiments using ultrasound-enhanced leaching are carried out under the presumption that there is no interaction between the experimental parameters and that only one parameter is modified at a time [29].
In order to investigate the effective leaching of Zn from Zn-containing dust sludge, a deep eutectic solvent–ultrasonic synergistic improved leaching approach was adopted, along with a full-factorial experimental design. The optimization method was developed by creating a fitted regression model for Zn leaching and examining how the process parameters interacted. This model was then validated by experiments that were optimized to obtain higher Zn leaching rates while simulating the experimental process.
2. Materials and Methods
2.1. Analysis of Raw Material Composition
Chemical multi-elemental analysis was used to analyze the metallurgical dust sludge in order to ascertain its chemical elemental composition and establish a theoretical foundation for further investigation. Table 1 shows the findings of the multi-elemental analysis of the samples of dust and sludge containing zinc.

Table 1.
Chemical multi-element analysis of Zn-containing dust sludge (%).
As indicated in Table 1, samples of dust containing zinc have a complex chemical makeup. The main elements in Zn-containing dust are Fe and Zn, of which the Zn content is 11.87%, coexisting with valuable metal elements, such as PbO, CuO, Al2O3, and Cl, and containing large amounts of SO3, K2O, SiO2, and CaO.
2.2. XRD Analysis
In order to determine the mineral elemental composition of the Zn-bearing dust sample, the mineral sample properties were analyzed using an XRD (RIGAKU D/MAX2500PC, Tokyo, Japan), and the results are shown in Figure 1.
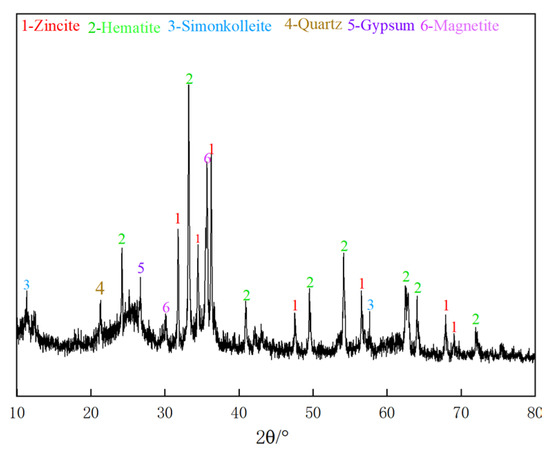
Figure 1.
XRD pattern analysis.
According to the XRD spectrum of Figure 1, zinc is present as zincite and simonkolleite, and iron is present as hematite and magnetite. In addition, the Zn-bearing dust sludge contains a large number of veinstone minerals, especially quartz and gypsum.
2.3. SEM-EDS Analysis
According to the SEM images of zinc-containing sludge samples, it can be seen in Figure 2 and Figure 3 that the particles of most zinc-containing sludge samples are blocky with rough surface. It is obvious that there are several dense flocs scattered across the mineral surface and between the flocs when the image is zoomed in 12,000 times. The element content of each location is variable due to the complex composition, as can be observed from the energy spectrum spot sweep analysis of the zinc-containing sludge samples. Its primary constituents are oxides, which include Zn, Fe, O, Si, Ca, and Cl. The typical peak absorption of the O element is high, which can suggest that its content is rather high.

Figure 2.
SEM images analysis of Zn-containing dust sludge samples.

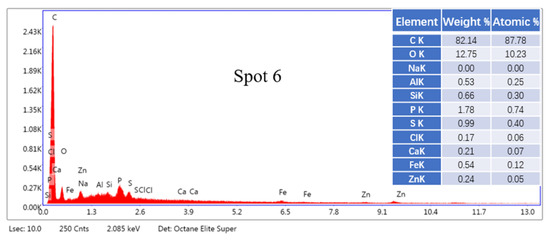
Figure 3.
EDS point scan analysis of Zn-containing dust sludge samples.
2.4. Particle Size Composition Analysis
Laser diffraction particle size analysis was performed on the Zn-bearing dust sludge samples, and the results are shown in Figure 4.

Figure 4.
Laser particle size results for zinc-containing dust samples.
According to the findings of the laser particle size analysis, 99.76% of the Zn-containing dust sludge samples have a particle size distribution that is primarily below 80 μm. Among them, 89.51% of the particles had a size smaller than 45 m, and the volume-weighted average particle size of the dust sludge containing zinc was 18.66 μm.
2.5. Leaching Experiments
2.5.1. Principle of Leaching Experiment
In this experiment, deep eutectic solvent–ultrasonic coordinated enhanced leaching was used for the efficient leaching of zinc, the most valuable target element in metallurgical dust sludge. During the leaching process, ZnO, the main Zn-containing substance in the Zn-containing dust sludge, complexes with ChCl-MA DES to form the complex [ZnOCl(HOOCCH2COOH)2]−, which dissolves ZnO. The chemical reaction formula can be expressed as [30]:
ZnO + HOOCCH2COOH + [Cl]− ↔ [ZnOClHOOCCH2COOH]−
2.5.2. Leaching Experiment Process
This paper discusses the study of ultrasonic-enhanced leaching of zinc-containing dust mud by a full-factorial optimization design. The treatment process of zinc-containing dust mud is shown in Figure 5. The leaching solution can effectively treat the target element after precipitation.
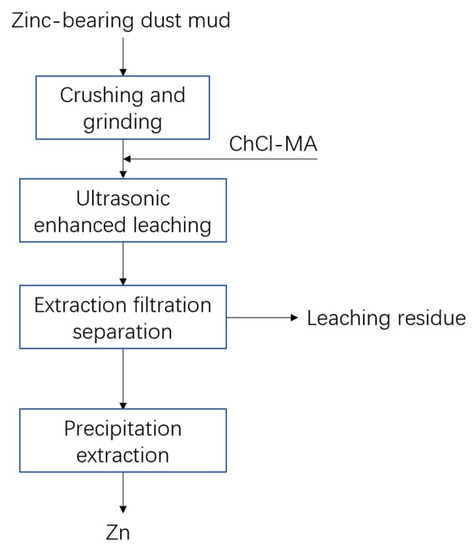
Figure 5.
Process flow of zinc-containing dust and mud treatment.
As illustrated in Figure 6, the ultrasonic leaching experiment was carried out in a 200 mL beaker. Using an electronic balance, 10.00 g of the original Zn-containing dust sludge from a steel factory in Shanxi was measured in the beaker. ChCl-MA DES solution was then added at a predetermined liquid-to-solid ratio and well mixed. The beaker was placed on a magnetic stirrer for water bath heating, and the ultrasonic emission probe (detailed parameters are shown in Table 2) was placed 1–2 cm below the liquid surface and used to control the leaching ultrasonic power, temperature, stirring rate, and leaching time. After the completion of the ultrasonic leaching test, the leachate was filtered using a vacuum extractor to separate the filtrate from the filtrate, and the filtrate was removed and dried, and weighed on an electronic balance. Chemical elemental analysis of the filter residue was performed, and the leaching rate of zinc was obtained as Equation (2):
- where m0—Mass of the zinc-containing dust sludge sample, g;
- x0—Zinc content of Zn-containing dust samples, %;
- m1—Mass of the leached residue sample, g;
- x1—Zinc content of the residue sample, %.

Figure 6.
Ultrasonic-enhanced leaching system and ultrasonic emission probe.

Table 2.
Main parameters of ultrasonic equipment.
Table 2.
Main parameters of ultrasonic equipment.
| Equipment Type | FS-600 |
|---|---|
| Power | 600 W |
| Working frequency | 20 kHz |
| Power adjustable range | 0–100% |
| Handling capacity | 500 μL–500 mL |
| Standard emitter diameter | 18 mm |
2.5.3. Full-Factorial Experimental Design
In this experiment, the leaching stirring speed was set to 250 rpm, and a full-factorial experimental design was carried out using Minitab® 19.1 (64-bit) to examine the interactions between the experimental parameters. In the experimental design, the leaching rate (η) was used as the response value, and a total of four process parameters, namely, leaching ultrasonic power (A, Ultrasonic power), temperature (B, Temperature), leaching time (C, Time), and liquid–solid ratio (D, Liquid solid ratio), were selected as the parameter factors. The experimental conditions and the values and codes of each parameter factor level (Table 3) are shown below.

Table 3.
Experimental process conditions and factor levels of each parameter taken and coded.
3. Results and Analysis
3.1. Design of Regression Model
Overall, 3 central sites were chosen, and a total of 19 experiments were carried out in this experiment; it was designed as a 4-factor, 2-level, full-factorial experiment. The experimental design method uses randomization to guarantee the unpredictability of the experimental process, checks to make sure all terms are unconfounded, and sets the default values for the remaining terms. Table 4 and Table 5 display the outcomes, as well as the experimental design table.

Table 4.
Experimental design results.

Table 5.
Leaching experimental results.
3.2. Variance Analysis of Regression Model
Using Minitab® 19.1 (64-bit), the experimental results were analyzed by multiple second-order fitting, and the regression model of the zinc leaching rate was obtained as follows:
where η(Zn) is the leaching rate of zinc; TEMP is the leaching temperature; TM is the leaching time; LSR is the liquid–solid ratio; UP is the ultrasonic power. According to the regression model of the zinc leaching rate, the variance analysis of parameter factors is carried out, and the results are shown in Table 6. According to Table 6, the p value of the regression model of the zinc leaching rate is 0.029, which is less than 0.05, and the model is significant; the p value of the fitting term of the model is 0.855, which is greater than 0.05, indicating that there is no fitting phenomenon in the model, and there are no other uncontrollable factors that cannot be ignored. The fitting result of the regression model is reliable and accurate.
η(Zn)% = 4.74 − 0.0343UP + 0.0189TEMP − 0.0189TM − 0.578LSR + 0.000235UP × TEMP + 0.000242 UP × TM + 0.00338 UP × LSR − 0.000327TEMP × TM + 0.00353 TEMP × LSR + 0.00499 TM × LSR

Table 6.
Regression model of zinc leaching rate.
3.3. Residual Analysis
Following a residual analysis, the normal probability diagram of residuals and the sequence diagram of the residual are produced, as displayed in Figure 7 and Figure 8, respectively. The normal probability diagram of residuals requires that the distribution is roughly a straight line, and the residuals and order should be randomly distributed, with no obvious law. Figure 7 and Figure 8 show that the residual analysis result does not contain any aberrant values and satisfies the criteria, demonstrating the suitability of the regression equation [31].

Figure 7.
Normal probability diagram of residual error.

Figure 8.
Residual and sequence diagram.
3.4. Variance Analysis of Regression Model
3.4.1. Standardized Effect Diagram Analysis
The normalized effect diagram generated in the regression model can well explain the significance of each parameter factor and the interaction results between parameter factors in the experiment. With the help of the normalized effect normal diagram, single data items and secondary data items that do not conform to the normal distribution in the regression model can be screened out; through the Pareto diagram of standardized effect, we can obtain which parameter factors and their interactions are the most important [32].
The normal diagram and Pareto diagram of the standardized effect of the zinc leaching rate in the regression model are displayed in Figure 9, as shown. The Pareto diagram shows that the main effects A, B, and C are all above the baseline of 2.306, which shows that the influence of ultrasonic power, temperature, and time on the response value is significant. According to the normal diagram of the standardized effect, only the main effects A, B and C, that is, ultrasonic power, temperature, and time, are significant in the zinc leaching process. The three-parameter factors are independent of each other, and the main effect B (that is, temperature) is farther from the standard diagonal line, so the temperature has the most significant influence on zinc leaching.
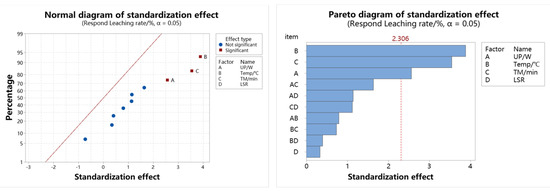
Figure 9.
Normalized effect plot of zinc leaching rate.
3.4.2. Factor Plot Analysis
The main effects plot in the factor plot shows the relationship between the leaching rate and the individual parameter factors, and the interaction plot in the factor plot illustrates how the relationship between one parameter factor and the leaching rate depends on the value of the second parameter factor. The factor plot in the regression model can visually reflect the correlation between the response value (i.e., the leaching rate) and the factors of each parameter [32].
The factor main effect plot and the factor interaction plot of the zinc leaching rate in the regression model are depicted in Figure 10 and Figure 11, respectively. The impact of changing each parameter factor from a low to a high level on the leaching rate can be seen in Figure 10 and Figure 11. It can be seen from Figure 10 and Figure 11 that the slopes of the low-level points to the high-level points of the four-parameter factors in the main effect plot are greater than zero, indicating that the influence of the four-parameter factors on the zinc leaching rate is all positive, that is, it increases with the increase of the factor level, but the strength of the effect is different. The slope of the slash in the factor plot indicates the strength of the influence of the parameter factor on the response value (that is, the leaching rate); the greater the slope of the slope, the stronger the influence of the parameter factor on the response value (that is, the leaching rate). As shown in the main effect diagram of the zinc leaching rate, the influence on the zinc leaching rate is temperature > leaching time > ultrasonic power > liquid–solid ratio. Figure 11 displays the factor interaction plot of the regression model’s zinc leaching rate. The interaction between the ultrasonic power–temperature parameter variables is especially important during the leaching process of zinc, as can be observed from Figure 10.

Figure 10.
Factor main effect plot of zinc leaching rate.
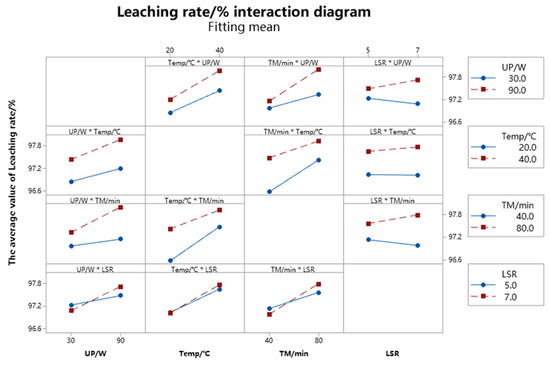
Figure 11.
Factor interaction effect diagram of zinc leaching rate.
3.4.3. Contour Plot and Surface Diagram Analysis
Contour and surface diagrams provide a more intuitive representation of the relationship between the response value (i.e., the leaching rate) in the regression model and two continuous variables based on the model. Contour plots and surface diagrams are different representations of the relationship between the response value and two continuous variables based on the model equation in a regression model, and the contour and surface are curved, indicating that there are statistically significant quadratic terms in the regression model [33].
Figure 12 shows the contour plot and surface diagram of the response value (i.e., zinc leaching rate) in the regression model. The maximum zinc leaching rates are located in the upper right corner of Figure 12a–l, which correspond to the high-level values of each of any two continuous variables; the minimum value of zinc leaching is located in the lower left corner of the plot and corresponds to the low-level value of any two continuous variables. It can be seen from Figure 12 that the higher the value of any two continuous variables in the leaching experiment within their horizontal range, the corresponding response value will also increase, but this does not indicate the final experimental result, because the contour plot and surface diagram only represent the significant relationship between the response value in the regression model and the two continuous variables based on the model equation, and the optimal result cannot be obtained, and the optimal result of the experiment will be obtained by the response optimization design.

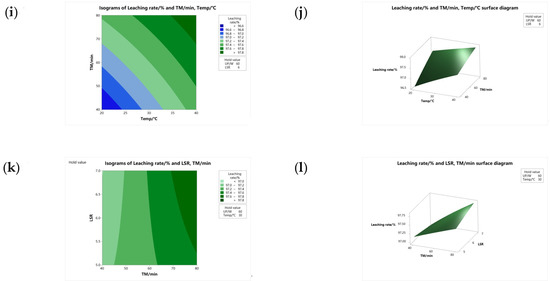
Figure 12.
Isogram and surface diagram of zinc leaching rate: (a) TEMP—UP Isogram; (b) TEMP—UP surface diagram; (c) LSR—UO Isogram; (d) LSR—UP surface diagram; (e) LSR—TEMP Isogram; (f) LSR—TEMP surface diagram; (g) TM—UP Isogram; (h) TM—UP surface diagram; (i) TM—TEMP Isogram; (j) TM—TEMP surface diagram; (k) LSR—TM Isogram; (l) LSR—TM–LSR surface diagram.
3.5. Factor Response Optimization and Experimental Validation
Response optimization in Minitab® 19.1 (64-bit) helps identify combinations of variable settings that jointly optimize a single response or a set of responses.
The best leaching conditions for this optimization test are a liquid–solid ratio 7:1, leaching temperature 40 °C, ultrasonic power 90 W, and leaching time 80 min. At this time, the predicted value of the zinc leaching rate reaches 98.47%, and the test results are good. This information can be obtained through analysis and fitting of the software, as shown in Figure 13 as the results of the response optimization test.

Figure 13.
Response optimization results.
In order to evaluate the correctness of the model, we ran three sets of parallel trials, the results of which are displayed in Table 7. It can be seen from Table 7 that the leaching results of zinc were 98.52%, 98.46%, and 98.49%, respectively, and the average value was 98.49%, and the relative error with the predicted value was only 0.02%. It is confirmed that the variance between the experimental findings and the predicted values of the regression model is minimal and largely consistent, indicating that the regression model’s accuracy is high and the optimization scheme’s confidence level is high [34].

Table 7.
Comparison of predicted and test values.
3.6. Comparative Experiment of Conventional–Ultrasonic Leaching
The optimal zinc leaching conditions for metallurgical dust sludge under an ultrasonic field are as follows: leaching temperature 40 °C; ultrasonic power 90 W; liquid–solid ratio 7:1 g/L; rotating speed 250 rpm; and leaching time 80 min, for which the zinc leaching rate can reach 98.49%. Under the optimal process conditions, a comparison between conventional stirring and ultrasound enhancement for an effect on the leaching rate of the zinc from metallurgical dust sludge was conducted. The results are as shown in Figure 14: the zinc leaching rate under the conventional rate was 95.9% and was increased by 6.88% under ultrasound enhancement at 90 W.
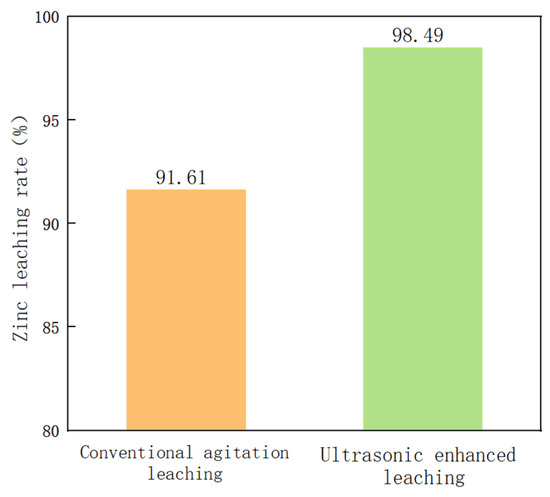
Figure 14.
Comparison of zinc leaching rate between conventional and ultrasonic treatment of zinc. Conventional: leaching temperature = 40 °C, leaching time = 80 min, stirring speed = 250 rpm. Ultrasonic: leaching temperature = 40 °C, leaching time = 80 min, ultrasonic power = 90 W, stirring speed = 250 rpm.
3.7. Leaching Residue Analysis
3.7.1. Chemical Multi-Element Analysis of Leaching Residue
Table 8 shows the chemical multi-element analysis of leaching residue under the optimum leaching conditions. It can be seen from the table that the zinc content of the sample decreased from 11.87% to 0.25% before and after leaching. The content of TFe changed from 34.83% to 36.31%, and the content of other oxides did not change obviously. It can be shown that ChCl-MA DES has a strong dissolving ability for zinc oxide in zinc-bearing dust and mud.

Table 8.
Analysis of main chemical elements in leaching residue.
3.7.2. XRD Analysis of Leaching Residue
The XRD analysis results of leaching residue are shown in Figure 15.

Figure 15.
XRD diagram of leaching residue.
Figure 15 demonstrates that hematite, carbon, and quartz make up the bulk of the leaching residue. The characteristic peaks of zinc-containing minerals, such as sphalerite, completely vanish when compared to the initial XRD image of zinc-containing dust and mud, indicating that the majority of the zinc elements in these materials have been efficiently leached.
Hematite’s primary characteristic peaks, on the other hand, are still present, and its peak intensity is very high, indicating that ChCl-MA DES has a unique capacity for dissolving Zn. This contrasts with the leaching degree of metallic iron by ChCl-MA DES, which is low.
3.7.3. Analysis of Leaching Residue Particle Size Composition
Laser diffraction particle size analysis was performed on the leaching residue, and the results are shown in Figure 16.

Figure 16.
Laser particle size results for leaching residue.
3.7.4. SEM-EDS Analysis of Leaching Residue
The leaching residue was examined by SEM-EDS after leaching in order to explore the changes in the morphology and surface composition of zinc-containing dust and mud raw materials and the leaching residue. The results are displayed in Figure 17. Figure 17 is the SEM image of the surface of the leaching residue. The figure illustrates the disappearance of the relatively dense and bright flocs and stripes on the sample’s surface prior to leaching and the appearance of a significant number of holes and obvious gullies following leaching. The mineral particles are also shown to be small and evenly dispersed, and there is no fine mineral adhesion on the surface of the leaching residue following leaching. It is inferred that this is related to the dissolution of metallic zinc in zinc-containing dust mud.
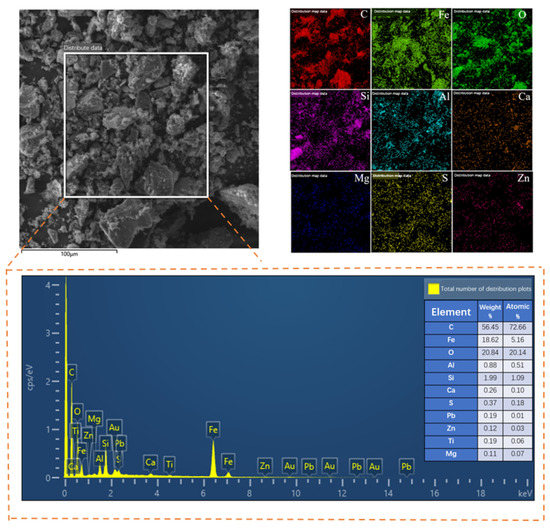
Figure 17.
SEM-EDS analysis of leaching residue.
4. Conclusions
- (1)
- In this paper, the collaborative enhanced leaching method of low eutectic solvent–ultrasonic was adopted, and the full-factorial experimental design was used to study the high-efficiency leaching of zinc in the zinc-containing dust mud. The leaching rate (𝜂) was taken as the response value, and Ultrasonic power (A, Ultrasonic power), Temperature (B, Temperature), and leaching time (C, ultrasonic power) were selected. Four conditions (Time) and liquid–solid ratios (D, liquid–solid ratio) are the investigated factors. The optimal leaching conditions obtained in this experiment are as follows: Under the optimal conditions, the ratio of liquid to solid was 7:1, the leaching temperature was 40 °C, the ultrasonic power was 90 W, and the leaching time was 80 min. The predicted value of the regression model was 98.47%. The average zinc leaching rate obtained by the 3 groups of parallel verification experiments was 98.49%, and the deviation from the predicted value of the regression model was 0.02%. The verification experiment results were consistent with the results predicted by the regression model, the experimental results were reliable, and the optimization scheme was reasonable and accurate.
- (2)
- The effects of conventional stirring and ultrasonic strengthening on the leaching rate of zinc in metallurgical dust sludge were compared under the optimum process conditions. The zinc leaching rate was increased by 6.88% under ultrasonic enhancement. At the same time, the zinc leaching rate can be kept above 98%, indicating that the process conditions have a certain guiding significance for practical application.
- (3)
- The treatment of zinc-containing dust mud is a difficult problem in the iron and steel industry. The use of low eutectic solvent–ultrasonic synergism to enhance the leaching of zinc-containing dust mud can reduce industrial loss to a certain extent and has certain economic benefits. However, the separation and utilization of other valuable elements still need further research.
Author Contributions
Conceptualization, F.N. and Z.B.; methodology, J.Z.; software, Z.C.; validation, J.Z., S.H. and Z.C.; formal analysis, S.H.; resources, F.N.; data curation, Z.B. and J.Z.; writing—original draft preparation, J.Z. and Z.B.; writing—review and editing, J.Z.; visualization, F.N.; supervision, F.N.; project administration, J.Z.; funding acquisition, F.N. All authors have read and agreed to the published version of the manuscript.
Funding
National Natural Science Foundation of China Grant Program (51904106); Natural Science Foundation of Hebei Province (E2021209015); Key Projects of Hebei Provincial Education Department (ZD2022059); Hebei Province San San San Talent Project (B20221005).
Data Availability Statement
Data available on request due to restrictions e.g., privacy or ethical. The data presented in this study are available on request from the corresponding author. The data are not publicly available due to As the data needs.
Conflicts of Interest
The authors declare no conflict of interest.
References
- National Bureau of Statistics of China. China Statistical Yearbook; China Statistics Press: Beijing, China, 2022.
- Ju, H.; Li, Y. State of The Art on Inhibitiion for Zinc and Aluminium. Corros. Sci. Prot. Technol. 2006, 18, 353–356. [Google Scholar]
- Wang, S.M. Study on Formation Mechanism of Mechanical Zinc Plating. Master’s Thesis, Kunming University of Science and Technology, Kunming, China, 2002. [Google Scholar]
- Page, M.; Weidenfeller, B.; Hartmann, S. Influence of temperature and aging on the thermal diffusivity, thermal conductivity and heat capacity of a zinc die casting alloy. J. Alloys Compd. 2019, 786, 1060–1067. [Google Scholar] [CrossRef]
- Chang, L.M.; Ling, L.; Nie, P. Aqueous zinc ion battery: Research progress on zinc metal anode 2021. J. Jilin Norm. Univ. Nat. Sci. Ed. 2021, 42, 8–15. [Google Scholar]
- Lan, B.X. Research on Vanadium-Based Cathode Material (Ag0.33V2O5 and FeVO4•nH2O@rGO) for Aqueous Zinc Ion Batteries. Master’s Thesis, Hubei University of Technology, Wuhan, China, 2020. [Google Scholar]
- Yao, Z.Y. Lithium-Rich Li-Zn Alloy as a Novel Anode Material for Lithium Secondary Batteries. Master’s Thesis, University of Electronic Science and Technology of China, Chengdu, China, 2020. [Google Scholar]
- Liu, Q.F.; Liao, Y.L.; Wu, Y.; Xi, J.J.; Ji, G.X. Research progress on enhancing leaching efficiency of chalcopyrite. Chem. Ind. Eng. Prog. 2022, 41, 6099–6110. [Google Scholar]
- Guo, P.; Wang, S.X.; Zhang, L.B. Selective removal of antimony from refractory gold ores by ultrasound. Hydrometallurgy 2019, 190, 105161. [Google Scholar] [CrossRef]
- Zhang, J.; Wu, A.X.; Wang, Y.M.; Chen, X.S. Experimental research in leaching of copper-bearing tailings enhanced by ultrasonic treatment. J. China Univ. Min. Technol. 2008, 18, 98–102. [Google Scholar] [CrossRef]
- Zuzana, H.T.; Frantisek, K.; Zita, T.; Dusan, O.M.L.; Andrea, M.; Tomas, H. Acidic leaching both of zinc and iron from basic oxygen furnace sludge. J. Hazard. Mater. 2011, 192, 1100–1107. [Google Scholar]
- Kukurugya, F.; Vindt, T.; Havlík, T. Behavior of zinc, iron and calcium from electric arc furnace (EAF) dust in hydrometallurgical processing in sulfuric acid solutions: Thermodynamic and kinetic aspects. Hydrometallurgy 2015, 154, 20–32. [Google Scholar] [CrossRef]
- Lisarb, O.D.; Thais, L.G.; Paola, A.M.; Edson, I.M.; Fabio, A.D.; Erico, M.M.F. Ultrasound-assisted extraction of rare-earth elements from carbonatite rocks. Ultrason. Sonochem. 2018, 40 Pt B, 24–29. [Google Scholar]
- Rahimi, G.; Rastegar, S.O.; Rahmani, C.F.; Gu, T. Ultrasound-assisted leaching of vanadium from fly ash using lemon juice organic acids. RSC Adv. 2020, 10, 1685–1696. [Google Scholar] [CrossRef]
- Yu, B.Q.; Kou, J.; Sun, C.B.; Xing, Y. Extraction of copper from copper-bearing biotite by ultrasonic-assisted leaching. Int. J. Miner. Metall. Mater. 2021, 29, 212–217. [Google Scholar] [CrossRef]
- Ding, W.; Bao, S.X.; Zhang, Y.M.; Xiao, J.H. Mechanism and kinetics study on ultrasound assisted leaching of gallium and zinc from corundum flue dust. Miner. Eng. 2022, 183, 107624. [Google Scholar] [CrossRef]
- Wang, F.; Yu, J.X.; Xiong, W.L.; Xu, Y.L.; Chi, R.A. A two-step leaching method designed based on chemical fraction distribution of the heavy metals for selective leaching of Cd, Zn, Cu, and Pb from metallurgical sludge. Environ. Sci. Pollut. Res. Int. 2018, 25, 1752–1765. [Google Scholar] [CrossRef] [PubMed]
- Wang, H.G.; Gao, J.M.; Liu, W.W.; Zhang, M.; Guo, M. Recovery of metal-doped zinc ferrite from zinc-containing electric arc furnace dust: Process development and examination of elemental migration. Hydrometallurgy 2016, 166, 1–8. [Google Scholar] [CrossRef]
- Ma, A.Y.; Zheng, X.M.; Gao, L.; Li, K.Q.; Omran, M.; Chen, G. Enhanced Leaching of Zinc from Zinc-Containing Metallurgical Residues via Microwave Calcium Activation Pretreatment. Metals 2021, 11, 1922. [Google Scholar] [CrossRef]
- Wei, L.; Fan, Y.J. Progress of Deep Eutectic Solventsand Their Applications. Chemistry 2011, 74, 333–339. [Google Scholar]
- Hu, P.C.; Jiang, W.; Zhong, L.J. Study on Properties of Deep Eutectic Solvents and Their Applications. Mod. Chem. Ind. 2018, 38, 53–57. [Google Scholar]
- Xiong, X.Q.; Han, Q.; Shi, L.; Xiao, S.Y.; Bi, C. Application of Deep-Eutectic Solvents in Green Organic Synthesis. Chin. J. Org. Chem. 2016, 36, 480–489. [Google Scholar] [CrossRef]
- Bai, F.; Li, J.; Hua, C. Research Progresses of Deep Eutectic Solvents and Its Application in Separationand Catalysis. Mater. Sci. Forum. 2018, 921, 312. [Google Scholar] [CrossRef]
- Daniel, C.; Maria, C.; Gutierrez, M.; Luisa, F. Resorcinol-Based Deep Eutectic Solvents as Both Carbonaceous Precursors and Templating Agents in the Synthesis of Hierarchical Porous Carbon Monoliths. Chem. Mater. 2010, 22, 6146–6152. [Google Scholar]
- Wang, S.X.; Xu, C.Y.; Lei, Z.; Li, J.R.; Lu, J.L.; Xiang, Q.Q.; Chen, X.; Hua, Y.X.; Li, Y. Recycling of zinc oxide dust using ChCl-urea deep eutectic solvent with nitrilotriacetic acid as complexing agents. Miner. Eng. 2022, 175, 107295. [Google Scholar] [CrossRef]
- He, X.H.; Wen, Y.P.; Wang, X.Y.; Cui, Y.R.; Li, L.B.; Ma, H.Z. Leaching NCM cathode materials of spent lithium-ion batteries with phosphate acid-based deep eutectic solvent. Waste Manag. 2023, 157, 8–16. [Google Scholar] [CrossRef] [PubMed]
- Niu, F.S.; He, S.T.; Zhang, J.X.; Chen, W. Study on Ultrasonically-Enhanced Deep Eutectic Solvents Leaching of Zinc from Zinc-Containing Metallurgical Dust Sludge. Metals 2022, 12, 1856. [Google Scholar] [CrossRef]
- Liu, Z.X.; Wang, L. Experimental Design and Data Processing; Chemical Industry Press: Beijing, China, 2015; p. 4144. [Google Scholar]
- Zhu, M.; Dong, L.F.; Qi, H.G.; Zhao, S.Y.; Wang, L.S. Application of DOE total factor experimental design method in reducing the rate of picking off the stem line by air separation. Silicon Val. 2014, 7, 129+132. [Google Scholar]
- Dong, J.J. Study on Leaching Behaviors of Zinc-Bearing Dust Sludge Based on Deep Eutectic Solvents. Master’s Thesis, North China Institute of Technology, Tangshan, China, 2022; p. 000193. [Google Scholar]
- He, Z.; Zhang, J.K.; Wang, L.L. Six Sigma Management, 1st ed.; China Economic Publishing House: Beijing, China, 2013. [Google Scholar]
- Gürkan, E.H.; Tibet, Y.; Çoruh, S. Application of Full Factorial Design Method for Optimization of Heavy Metal Release from Lead Smelting Slag. Sustainability 2021, 13, 4890. [Google Scholar] [CrossRef]
- Li, W.Y.; Jiao, F.; Chen, C.; Qin, W.Q.; Liu, W. Full-factorial Experimental Design for Leaching of Aluminum and Silver from Waste Photovoltaic Modules. Chin. J. Nonferrous Met. 2023, 33, 898–911. [Google Scholar]
- Liu, W.; Liu, Z.L.; Liu, C. Optimization of bioleaching low-grade copper-molybdenum ore by response surface methodology. J. Cent. South Univ. Sci. Technol. 2021, 52, 3111–3120. [Google Scholar]
Disclaimer/Publisher’s Note: The statements, opinions and data contained in all publications are solely those of the individual author(s) and contributor(s) and not of MDPI and/or the editor(s). MDPI and/or the editor(s) disclaim responsibility for any injury to people or property resulting from any ideas, methods, instructions or products referred to in the content. |
© 2023 by the authors. Licensee MDPI, Basel, Switzerland. This article is an open access article distributed under the terms and conditions of the Creative Commons Attribution (CC BY) license (https://creativecommons.org/licenses/by/4.0/).