Abstract
Based on the historical data of a commercial blast furnace (BF), the evaluation and prediction models for the BF comprehensive operating status were established by big data mining methods. Firstly, based on the data resources of the data warehouse of BF ironmaking, clean data were obtained by processing the original data with the problem of null values, outlier data, and blowing-down operations data. Then, the AHP_EWM_TPOSIS evaluation model was built with the combined weight of AHP and EWM and the improved TOPSIS algorithm. Finally, the model evaluation results were verified with the actual production situation, and the comprehensive matching rate reached 94.49%, indicating that the model can accurately judge the comprehensive operating status of BF. The evaluation result was the target parameter for building the BF comprehensive operating status prediction model. The results showed that the stacking model achieved better results than the base models in all indicators. The accuracy index of the deviation between the predicted value and the actual value within ±0.05 reached 94.50%, which meets the practical needs of BF production. The evaluation and prediction models provided timely and accurate furnace condition information to the operators in the BF smelting process, which promoted the long-term stable operation of the BF condition.
1. Introduction
The fluctuation of BF conditions seriously affected the yield, the quality of molten iron, and energy consumption in BF production [1,2,3]. The smooth operation of a BF is the key to obtaining a high quality, high yield, low consumption, and long life. Due to the dynamic time-varying and strong coupling in BF production, there is no specific index that can directly characterize the operation status of a BF [4]. Whether by using the direct observation method, such as by observing iron notch, slag notch, tuyere, and the movement state of a probe, or by using the indirect observation method, such as in analyzing CO2 curve or judging hot air pressure, blast pressure, blast volume, and shaft temperatures, all of these have the disadvantage of one-sided localization and subjective experience. It is difficult to provide a timely prediction and warning for BF production conditions, and to effectively guide the stable production, because of the time lag of the operation status judgment. The expert experience evaluation system, based on mechanism knowledge and mechanism model, cannot guide the actual BF production well due to the higher constraints of the system, the small amount of data in the model training set, and the subjective nature of an expert’s experience [5,6,7,8,9,10]. The accurate judgment and prediction of BF operating conditions are still the focus and difficulty of current research.
With the development of technology, new technologies and concepts represented by big data bring hope for solving the current problems. Ma Steel comprehensively selected the parameters that characterize the operating state of BF based on mathematical statistics and expert experience. According to a comparison between the real-time operating parameter index and the set parameter index, the BF smooth-running index was established to accurately judge the BF operation status [11]. Li Hongyang used the factor analysis method to extract the hidden common factors in the BF production parameters by considering the 19 status parameters to calculate the BF status index, then the AdaBoost model was used to predict it 3 h in advance, which achieved a better prediction result [12].
Based on the above comments, a study of the evaluation and prediction models is important to estimate and predict the comprehensive operating status of BF. In this study, based on the historical data of a commercial BF, big data mining technologies were used to establish a comprehensive BF evaluation model that integrates furnace condition, yield, quality, and energy consumption, with production indexes as the starting point, by deeply mining the production data of a BF, which could quickly judge the operating status of a BF and accurately predict it in the proceeding hour. Based on the evaluation and prediction results provided by the model, it is used to guide the BF production, which promotes the effective long-term stable operation of BF conditions and achieves high quality, high production, low consumption, and long service life in BF production.
2. Data Preparation
2.1. Research Steps
The research process needs to be established before data preparation. The steps of the research process are shown in Figure 1. Firstly, we established the data warehouse of BF ironmaking based on the big data platform. Then, we selected the data related to BF production and carried out the data processing work to obtain the clean data for model building. Secondly, we built the evaluation model to evaluate the BF comprehensive operating status. Based on this, we took the evaluation results as the target and built the prediction model to predict the BF’s future operating status. Finally, we provided the operators with production information on the evaluation results and predictions in order to guide BF production.
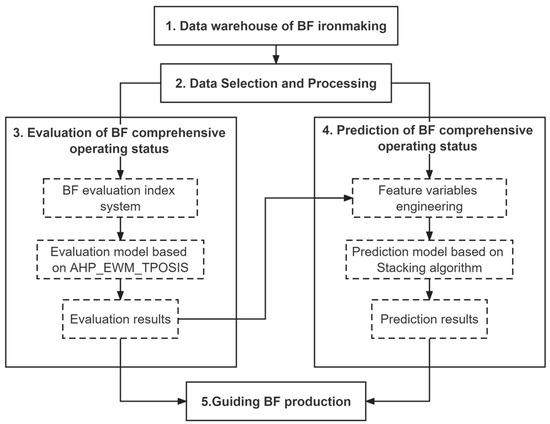
Figure 1.
Steps of the research process.
2.2. Data Warehouse of BF Ironmaking
The establishment of the BF ironmaking data warehouse was based on the strong data resource of the BF ironmaking big data platform. The big data platform integrates all data from the BF production process, and provides the complete data services for the life cycle of BF ironmaking, including the basic services of data transmission, data storage, data management, data modeling, data analysis, and intelligent applications. The big data platform realizes the information and intelligence of BF ironmaking [13]. The architecture of BF ironmaking big data platform is shown in Figure 2.
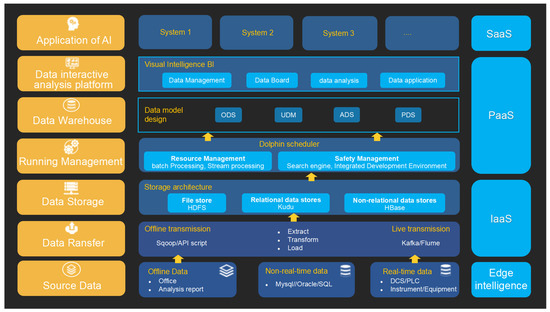
Figure 2.
Architecture of BF ironmaking big data platform.
BF ironmaking is a long production process involving many production parameters. The effective management of the whole process data can provide convenient data extraction and analysis for model development. In order to improve the availability of the data, erroneous data correction, data frequency processing, and data association integration were completed on the source data. Based on the dimensions of the collected data, the different production processes were divided into themes and the structure and content of the individual data tables of the BF were designed. Finally, a versatile and efficient data warehouse template was created for BF ironmaking. The architecture of the BF ironmaking data warehouse is shown in Figure 3.
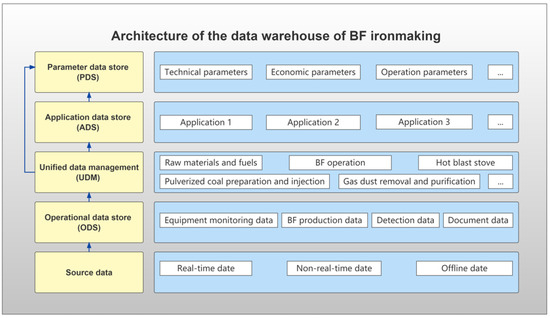
Figure 3.
Architecture of the BF ironmaking data warehouse.
As shown in Figure 3, an operational data store (ODS) stores the massive underlying source data streams by modules. Unified data management (UDM) cleans, transforms, and integrates source data to divide and arrange the data by theme according to the process and business needs of BF production. An application data store (ADS) provides data links between the integration layer and different application scenarios, enabling independent data storage for the applications. A parameter data store (PDS) consolidates the important parameters of interest in BF production, allowing the users or applications to extract metric data in the most convenient way.
2.3. Data Selection and Processing
2.3.1. Data Selection
The data was selected from a 2500 m3 No.4 commercial BF for vanadium–titanium ore smelting. A total of 535 parameter variables were selected based on the data resource for the BF; these parameters contain all the data for the production. The data collection and description of BF are shown in Table 1.

Table 1.
Data collection and description of BF.
As shown in Table 1, different types of data are collected and stored in different ways during the BF production process. According to the production process and the characteristics of the data type, the BF data are divided into two categories of non-real-time discrete data (non-real-time data) and real-time continuous data (real-time data). Non-real-time discrete data refers to the relevant data recorded during the production, this type of data generally includes raw material and fuel, slag and iron test data, and some manually entered production data. Real-time continuous data refers to the temperature, pressure, and flow data recorded in real-time by monitor equipment.
2.3.2. Data Processing
The production environment of a BF is complex. The constraints of production conditions can lead to variable data quality issues with null values and outlier data [14,15,16,17]. Therefore, the data processing of raw data is required. Considering the characteristics of data types, the targeted works of data processing were completed according to their causes. The data processing methods of null values and outlier data are shown in Table 2. The data processing work improves the quality of the data and ensures that this data can be better used for data analysis or data mining. The data processing methods of null values and outlier data are shown in Table 2.
Table 2.
Data processing methods of null values and outlier data.
The operations of BF blowing-down cannot be avoided during normal production. The BF production is at a standstill during the BF blowing-down to allow for maintenance works such as changing air outlets, welding, and patching gas systems, etc. The data during BF blowing-down are not useful. So, this part of BF data was deleted according to the production log.
3. Evaluation Model for BF Comprehensive Operating Status
The production index was the target point with furnace condition, yield, quality, and energy consumption to develop the evaluation model for the BF comprehensive operating status. Firstly, the index evaluation system of BF comprehensive operating status was established with the selected characterization parameters. Then, the combination of AHP and EWM based on game theory was used to determine the index weights. Finally, the evaluation model was built using the improved TOPSIS algorithm.
3.1. Related Research Methods
3.1.1. Combined Weighting Based on Game Theory
The analytical hierarchy process (AHP) is based on the evaluator’s knowledge and experience, which is interpretable and systematic [18]. The entropy weighting method (EWM) is objective and reflects the law of the data [19]. A single method of weighting can lead to a less accurate weighting because some aspect of the information is overlooked or overemphasized, thus affecting the judgment of the final rating. Game theory considers the role of different weighting outcomes in the evaluation process. It assumes that the weight vectors are independent in order to find the minimization bias of the combined and sub-vector weights, and balances the differences in the single weights by developing reasonable weight allocation coefficients, thus reducing the information loss of a single assignment. In this study, game theory is applied to the combined weighting of AHP and EWM to obtain the combination weights of evaluation indexes [20]. The steps of the combined weighting method based on game theory are as follows.
Step 1, determine the basic weight vector set of a scheme , then any linear combination of K weight vectors is:
where is a linear combination of weight coefficients and is a vector of weights.
Step 2, find the linear combination vector with all other vectors whose extreme differences reach a combined minimum and determine the combined most satisfactory weight vector .
Using the matrix differential equation property, the system of linear equations, corresponding to the optimized first order derivative condition equivalent to Equation (2), is obtained as follows:
Step 3, the vector of weight coefficients is normalized. The calculation formula is:
Step 4, calculate the final weight vector .
3.1.2. Improved TOPSIS Algorithm
TOPSIS, as a comprehensive evaluation method, can make full use of the information of the original data to accurately reflect the gap between the evaluation objects, so as to obtain their relative pros and cons [21]. TOPSIS usually uses the Euclidean distance to calculate similarity. The Euclidean distance is the linear distance between two points in space, and it does not consider the correlation between indexes. The evaluation results calculated with Euclidean distance cannot truly reflect the advantages of each sample. In this study, we improved the problem by using the Mahalanobis distance instead of the Euclidean distance in order to solve the problem of index correlation [22,23]. Compared with the Euclidean distance, the Mahalanobis distance can better reflect the correlation between indexes. The establishment steps are as follows.
Step 1, establish the multi-index decision matrix:
where is the initial value of the jth index of the ith evaluation object.
Step 2, construct the forward decision matrix.
According to the attribute characteristics of the evaluation indexes, the evaluation indexes of the BF can be divided into three categories: the extremely large indexes, the extremely small indexes, and the intermediate indexes. The different interval directions of the evaluation indexes could make the analysis confusing. In order to simplify the analysis, all the indexes were converted into extremely large indexes. The specific method is as follows.
The extremely small indexes converted to extremely large indexes:
The intermediate indexes converted to extremely large indexes:
Construct the forward decision matrix:
where is the ith sample value of the evaluation object, is the value of the extremely large indexes after conversion, is the optimal value of the intermediate indexes, and is the positive value of the jth index of the ith evaluation object.
Step 3, construct the standardized decision matrix:
where is the standardized value of the jth indicator of the ith evaluation object.
Step 4, construct the standardized weighted decision matrix:
where is the weighted standardized value of the jth indicator of the ith evaluation object and is the value of the combination weight.
Step 5 is the proximity calculation.
Firstly, determine the positive ideal solution and negative ideal solution of each evaluation index.
Secondly, calculate the Mahalanobis distance from each evaluation sample sequence to the positive ideal solution and the negative ideal solution , namely and :
where and is the correlation coefficient matrix, .
The correlation coefficient between indexes was calculated using the Deng correlation degree, and the calculation formula is:
where is the resolution, here = 0.5.
The correlation coefficient matrix is:
Thirdly, calculate the degree of closeness of each sample based on the positive ideal solution and the negative ideal solution:
where, according to the size of the value , the comprehensive operation of BF is sorted, and the larger value of , the better the BF operation is.
3.2. Evaluation Model Based on AHP_EWM_TPOSIS
3.2.1. BF Evaluation Index System
BF ironmaking features a long process sequence, complex internal reaction mechanism, large hysteresis, strong coupling, and non-linearity. The melting process of a vanadium-titanomagnetite BF is more complex in comparison with that of a BF with common ores. Based on the data resources of the BF data warehouse, and combined with BF process theory and actual production demand, 33 parameters were selected with the assistance of the operators and experts from the BF site as the evaluation index of the BF comprehensive operating status. The evaluation indexes of the BF comprehensive operating status are shown in Table 3.
Table 3.
Evaluation indexes of the BF comprehensive operating status.
As shown in Table 3, these index parameters are highly relevant to the 4# vanadium-titanium BF; they contain the main parameters and reflect the comprehensive situation of the BF production operation. By focusing on and regulating these parameters, the BF operators can achieve control of the 4# BF operation. The evaluation index system of the BF comprehensive operating status is shown in Figure 4.
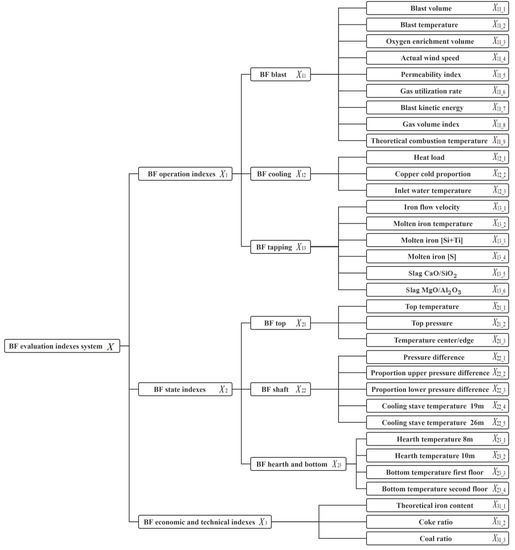
Figure 4.
Evaluation index system of the BF comprehensive operating status.
As shown in Figure 4, 33 indexes were divided into three categories of the BF operating parameters, the BF state parameters, and the BF economic and technical index parameters. The BF operating parameters refer to the production parameters that the operators focus on and control when adjusting the furnace conditions, which comprehensively reflect the operating conditions of the BF. The BF state parameters include various sensor parameters for monitoring BFs, such as temperature and pressure. They are the result variables of operating parameters and reflect the operating condition of the BF. The economic and technical index parameters are used to characterize the results of the BF operation, and generally include economic and technical parameters such as yield and coke rate.
3.2.2. Combination Indexes Weights Analysis
The combination weights of the BF evaluation indexes are shown in Table 4.
Table 4.
Weights of the BF evaluation indexes.
As shown in Table 4, the AHP method has a relatively balanced distribution of weights based on the production experience of experts. The weights for blast volume, theoretical iron content, and the coke ratio are higher, which is consistent with the BF’s goal of smooth operation, high production, and low consumption. The EWM method has a very variable distribution of weights based on the original data itself. The weights of oxygen enrichment volume, blast volume, and coal ratio are relatively large, because in case of BF fluctuations in the actual production process, it is preferred to ensure stable and smooth furnace conditions by reducing the volume of blast volume, oxygen and coal injection, and the extent of the reduction in these parameters is large. The comparison shows that the AHP and EWM methods differ significantly in the weighting of some indexes, such as oxygen enrichment volume, theoretical iron content and coal ratio, which should be given more attention. The combined weighting method based on game theory assigns new weights to these indexes. The final weighting results are more scientific and correspond to the actual production conditions of the BF. The combined weighting method balances the importance of subjective weights (AHP) and objective weights (EWM) by minimizing the deviation between the weights of the two weighting methods. The combination weights reflect the characteristics of the indexes themselves, while making effective use of the original information in the data of the indexes.
3.2.3. Evaluation Results and Discussion
The values of the BF comprehensive operating status (GL04_Score) were graded and defined based on the actual production conditions and process experiences. The description of the evaluation level can provide an intuitive view of the BF comprehensive operating status. The evaluation level of the BF comprehensive operating status is shown in Table 5.
Table 5.
Evaluation level of the BF comprehensive operating status.
The evaluation results of the BF operating status at different times during BF production were selected to test the adjustment effect of the actual BF operating status. The results of the evaluation of the BF operating status and the main indicators for the hours T1, T2, and T3 are shown in Table 6. As shown in Table 6, the T1 time has a low fuel ratio and a high gas utilization rate, whilst the BF has sufficient airflow and a high theoretical iron content. The BF production is in a stable and efficient state. At the time of T2, in the absence of a large change in the blast volume, the fuel ratio is relatively high and the amount of iron is relatively low, but there is not much deviation from the optimum range. The BF production is normal and stable. At the time of T3, the BF is operating abnormally due to changes in the raw material and fuel, whilst the fuel ratio remains high and other BF indicators are at historically low levels. The BF production is in abnormal furnace status at this time. Therefore, the evaluation results based on the AHP_EWM_TPOSIS model have a high degree of matching with the actual blast furnace operating status.
Table 6.
BF operating status and main indicators at different times.
The data on the BF operating status for one shift (8 h) was selected for evaluation. The evaluation results and the BF key parameters are shown in Figure 5. Referring to the production log, it was found that the furnace condition becomes worse as the pressure difference increases, whilst the operators improve the situation by reducing the blast volume. Then, the pressure difference returned to normal and the blast volume was increased until the BF operating status returned to a stable production level. During this period, the key parameters, such as top temperature, top pressure, and gas utilization rate, all showed large fluctuations, and the fluctuation trend was consistent with the evaluation scores. It can be seen that the evaluation model can accurately judge the BF operating status, and the scores of the model provided timely and accurate information for the furnace conditions with the operators.
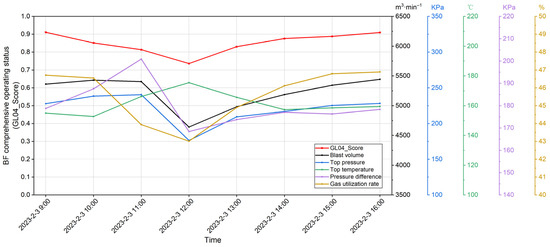
Figure 5.
Evaluation results of BF operating status and BF key parameters in 8 h.
On the basis of this, we compared the evaluation results of the BF operating status under different weighting methods during the shift time period, and the results are shown in Figure 6. As can be seen from Figure 6, there are differences in the results of the AHP and EWM weighting methods. The EWM method showed a volatile trend, while the AHP method showed a flat trend. The combined weighting method, based on game theory, can balance the difference in weights between the AHP and EWM methods, reduce the information loss of separate weighting, and its evaluation results can more truly reflect the trend change in the BF, further validating the effectiveness of the combined weighting method.
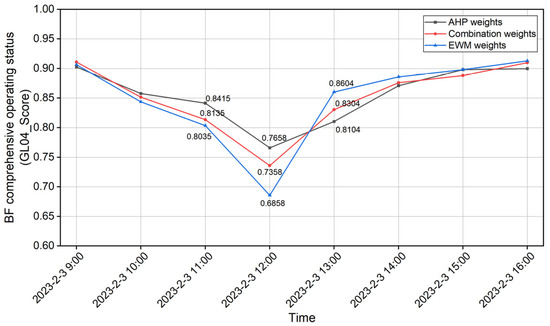
Figure 6.
Results of BF operating status under different weighting methods.
In order to further verify the effectiveness of the model, a total of 744 groups of the BF actual production data in March 2023 were selected to test the practical application of the model. The model of AHP-EWM-TPOSIS was used to evaluate the BF operating status. The difference level, d, is introduced when judging the actual situation, which represents the deviation between the evaluation results and the actual situation. The larger the absolute value, the greater the deviation. The model evaluation matching result is shown in Table 7.
Table 7.
Result of the model evaluation matching.
It can be seen from Table 7 that there were 596 groups of complete matching (d = 0), accounting for 80.11%, and 106 groups of reliable matching (d = ±1), accounting for 14.38%, and the comprehensive matching rate (|d| ≤ 1) was 94.49%. The evaluation model established in this study had a high degree of matching and accurately judged the BF operating status. The evaluation results could provide real-time and effective information for operators in the optimization process of the BF smelting process, avoiding operators’ decision-making mistakes, and ensuring the stable and smooth operation of BF.
4. Prediction Model Based on Stacking Algorithm
The evaluation result of the evaluation model for the BF operating status is the end-of-hour result. It is a good characterization for the BF operating status, but the operators are equally concerned about the future BF operating status. Therefore, the BF operation evaluation result (GL04_Score) as the target parameter, and the integrated learning algorithm of stacking, were used to build the BF comprehensive operating status prediction model, which predicted the BF operating status in the proceeding hour and provided the trend of the BF operating status for the operators.
4.1. Model Principle of Stacking
The BF production process is complex, and its data distribution is diverse, with a certain regularity and randomness. The feature redundancy is greatly reduced by screening important feature variables with the feature engineering. However, it is difficult for a single model to accurately capture the complex production situation of BF and achieve better prediction results. Therefore, the stacking ensemble learning algorithm was used to predict the BF comprehensive operating status [24]. As a typical representative of the combined strategy learning method, it generally consists of a homogeneous or heterogeneous base model and a two-layer structure of the model used for combined learning. In this study, the individual learners of the five base models of Random Forest [25], Extra Trees [26], Gradient Boosting [27], Neural Network [28], and Support Vector Machines [29] were selected as the first layer learner, and the AdaBoost [30] was selected as the second layer learner. The algorithmic structure of the stacking model is shown in Figure 7.
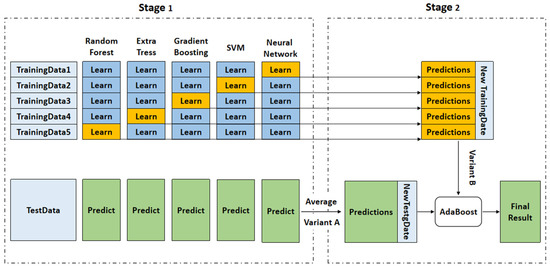
Figure 7.
Algorithmic description of the stacking algorithmic.
As shown in Figure 7, the description of the stacking algorithmic is as follows:
- (1)
- The training set data are divided into five parts, each part of them includes the validation set and test set.
- (2)
- We traversed the five basic models to make a prediction for the test set of each part and each sample generated five kinds of prediction results. The five results were averaged and spliced, and we used the results of the five models predicted on the training set as the new features for the next layer.
- (3)
- We used the learning model to fit and predict the data set after the combination of new features and target parameters and, finally, to obtain the prediction result.
4.2. Model Building
4.2.1. Feature Variables Engineering
Autocorrelation Analysis of Target Feature
In addition to being affected by process parameters, the BF operating status (GL04_Score) also has a strong correlation with time series data. The autocorrelation function (ACF) was used to analyze the correlation of the target variable. ACF describes the relationship between variables in the same series at different time intervals over time, i.e., the correlation between two variables at time t and time t + t′. The higher the correlation value, the stronger the dependence between the two variables. The Autocorrelation function values of the target feature are shown in Figure 8.
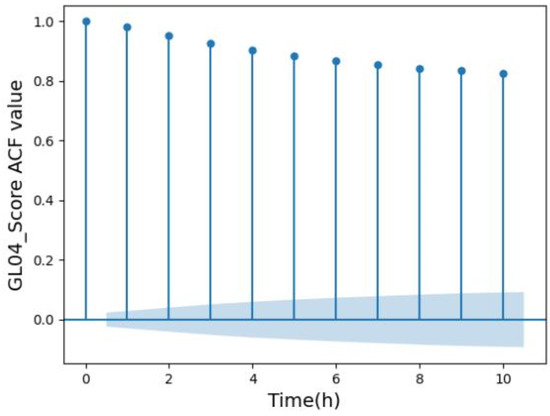
Figure 8.
Autocorrelation function values of GL04_Score.
As shown in Figure 8, the autocorrelation function values of the target variable (GL04_Score) decrease from 1 as the delay time increases. The ACF value is still greater than 0.9 when the autocorrelation window is four hours, indicating that the target variable itself has a strong autocorrelation. In the actual production, the operators focus on the first 4 h of the operating status to keep track the changes in the BF. Therefore, the new features of the first four-hourly values, GL04_Score1, GL04_Score2, GL04_Score3 and GL04_Score4, should be added to the set of feature variables.
Principal Component Analysis
The hearth and bottom part of the BF contain the temperature information of different heights and directions, a total of 156 feature variables. The cooling part of BF contains the temperature information of different heights and directions, as well as the flow and pressure information of cooling water in different directions, for a total of 172 feature variables [31]. The data types of these feature variables are similar and highly correlated. The analysis of a single feature variable has little significance for BF production, so the two parts of the data need to be integrated for analysis as a whole. In this study, principal component analysis (PCA) was selected for the data dimensionality reduction. PCA can map data from high to low dimensions to reduce the dimensionality of features while retaining as much information as possible about the data [32]. The results of dimensionality reduction are shown in Figure 9.
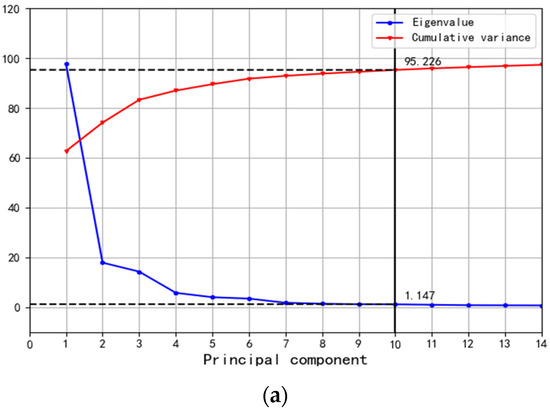
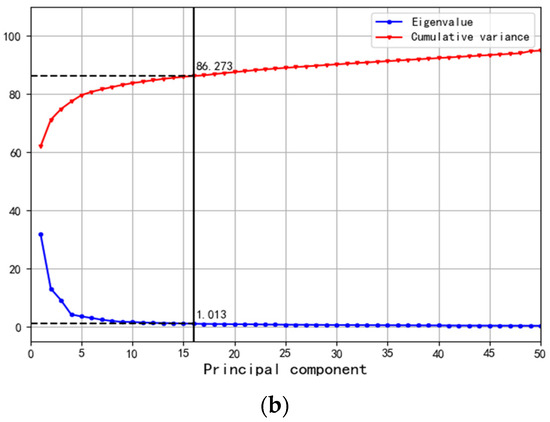
Figure 9.
Results of dimension reduction based on PCA. (a) Hearth part of BF. (b) Cooling part of BF.
As shown in Figure 9, the eigenvalue threshold is set to 1 according to the objective of the data analysis. For the hearth and bottom of the BF, 10 independent feature variables (FCA1_1–FCA1_10) were extracted from the 156 feature variables, and the cumulative variance reached 95.226%. For the cooling part of the BF, 16 independent feature variables (FCA2_1–FCA2_16) were extracted from the 172 feature variables, and the cumulative variance reached 86.273%. The combined information of the two parts reached 90.750%, which met the condition for data mining. As a result, the number of features was reduced from 328 to 26 by PCA dimensionality reduction, which achieved the purpose of compressing the data with minimal loss of information and reduced the feature redundancy of the model.
Feature Variables Selection
The BF smelting process is time-varying and highly coupled. The input feature variables of the model by a single feature selection method do not allow the model to achieve good prediction results. Therefore, a combination of multiple feature selection methods was used to select the feature variables [33,34]. Firstly, the set of feature variables was initially selected by correlation analysis of Spearman and maximum information coefficient (MIC). Then, the set of feature variables was further screened by the ironmaking process and production experience. Finally, a random forest recursive feature elimination method (REF) was used to obtain the set of final feature variables for the model prediction.
Spearman and MIC correlation analysis were used to analyze the non-linear data of the BF. The results of Spearman and MIC correlation analysis are shown in Figure 10 and Figure 11.
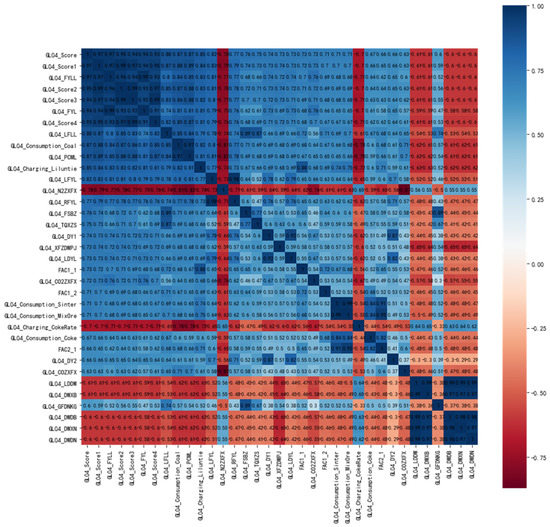
Figure 10.
Spearman correlation coefficient values greater than 0.6.
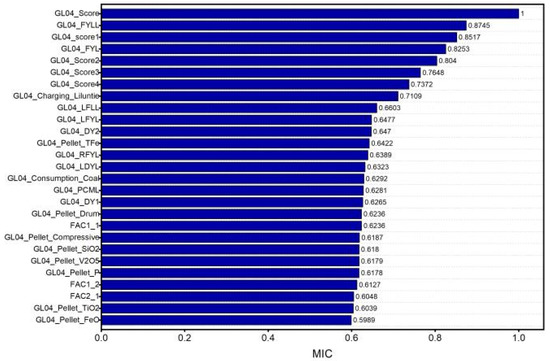
Figure 11.
MIC correlation analysis values greater than 0.6.
As shown in Figure 10 and Figure 11, taking the union of the selected sets of feature variables by Spearman and MIC correlation analysis methods resulted in a total of 43 feature variables being selected. These feature variables were initially selected only in terms of relevance and there are still issues of redundancy between the variables. Therefore, further screening based on process and production experience was required. The result of the feature variables after screening based on process and production experience is shown in Table 8.
Table 8.
Result of the feature variables after screening.
As shown in Table 8, 30 feature variables were obtained after screening. In order to select the most useful features of the model from the original feature variables, the set of feature variables was further selected by REF. The result of the feature variables selection by REF is shown in Figure 12.
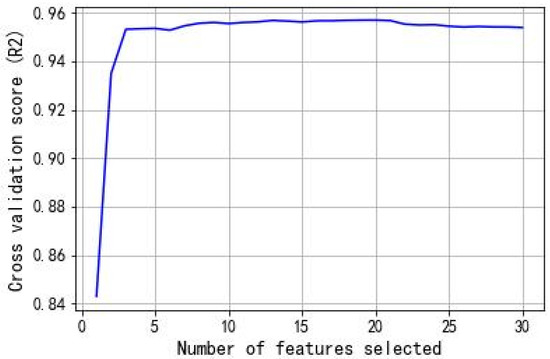
Figure 12.
Result of feature variables selection of REF.
As shown in Figure 12, the number of features added started at 2 and the model cross-validation score rapidly increased to a high point. The score peaked when the number of feature variables reached 20, and then decreased slightly and began to stabilize. The final number of feature variables selected was determined to be 20. The result of the final feature variables is shown in Table 9.
Table 9.
Result of final feature variables.
As shown in Table 9, the number of feature variables was reduced from 535 to 20 by the process of feature variables selection. The number of model input feature variables was significantly reduced from the original variables. The final feature variables contain important operational information about the BF operating status. These variables are consistent with those that are important in the practical production of BF. By focusing on and adjusting these variables, operators are able to control the operating status of the BF.
4.2.2. Model Prediction and Analysis
Considering that the BF ironmaking data has a significant time series character, the model data set was split chronologically in a ratio of 9:1. The front 90% of the data was used as the training set for model training, and the remaining 10% was used as the test set for model testing. The impact of feature selection on the predictive effectiveness of the model was analyzed, while the properties of the stacking algorithm were compared with the predictive performance of other models. The prediction and evaluation results of different models are shown in Table 10, and the prediction results of the stacking model are shown in Figure 13 and Figure 14.
Table 10.
Prediction and evaluation results of different models.
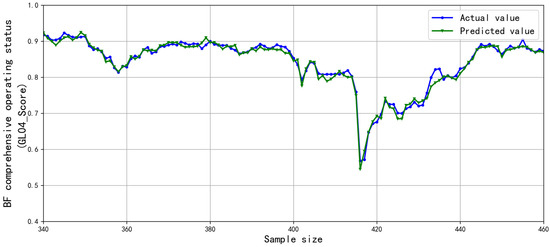
Figure 13.
Prediction result of the stacking model.
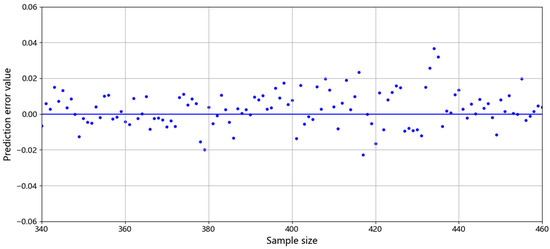
Figure 14.
Prediction errors of the stacking model.
As shown in Table 10, the evaluation indicators of all the models with feature selection were higher than those without feature selection, indicating that the combination of multiple feature selection methods can have a positive effect on improving the model prediction performance. The stacking algorithm had a better performance than the base models in all indicators, and provided an accurate prediction of the BF operating status. The R2 of the stacking algorithm reached 0.9353, the indicator of prediction accuracy error within ±0.03 reached 87.97%, and the accuracy indicator within ±0.05 reached 94.50%. The prediction results of the stacking model are shown in Figure 13 and Figure 14. As can be seen from Figure 13 and Figure 14, the stacking algorithm showed satisfactory predictive performance. When the BF conditions fluctuate, the model can accurately predict the BF operating status and capture the changing trends. The prediction error (±0.05) was within the acceptable range and met the practical requirements of BF production. Therefore, the prediction model based on the stacking algorithm in this study can provide the accurate BF operating status in the proceeding hour for the operators, which is of great significance in guiding BF production.
It should be noted that the results are only applicable to the No.4 vanadium–titanium ore smelting BF. However, the analysis process, including the data processing and the BF operating status evaluation and prediction, is generally applicable to all types of BF. Therefore, it can be used as a general and effective system to accurately judge and predict BF production status.
5. Conclusions
The aim of this study was to achieve the purpose of BF production guidance by mining the historical production data. This study combined big data mining techniques with machine learning to build evaluation and prediction models for BF comprehensive operating status. The following conclusions were obtained.
- (1)
- Based on the data resources of the BF ironmaking data warehouse, the original variables related to the BF parameters were selected, and the cleaned data for the models were obtained by dealing with the null values, outlier data, and blowing-down operations data.
- (2)
- Combined with BF process theory and actual production demand, 33 parameters characterizing the BF operating status were selected to establish the index evaluation system. The index weights were determined by a combination of AHP and EWM. The evaluation model was built using the improved TOPSIS algorithm. The model was able to accurately evaluate the BF operating status, and the evaluation results match the actual production situation. The comprehensive matching rate reached 94.49%, which can provide timely and effective information for the operators.
- (3)
- The BF comprehensive operating status prediction model was built by using the BF operation evaluation result as the target parameter. The feature extraction of variables was achieved by feature construction and PCA dimensionality reduction, and the final input feature variables were determined using a combination of multiple feature selection algorithms and production process experience. The stacking model was selected for prediction, and the results showed that the stacking model achieved better results than the base models in all indicators. The accuracy index of the deviation between the predicted value and the actual value within ±0.05 reached 94.50%, which meet the practical needs of BF production.
- (4)
- The evaluation and prediction models provided timely and accurate information and grasped the trends in the furnace conditions for operators in the BF smelting process. This has important practical implications for the production process, which effectively promoted the long-term stable operation of BF conditions, and achieved the purpose of high quality, high yield, low consumption, and long life in BF production.
- (5)
- The evaluation and prediction models for BF operating status have achieved a satisfactory application performance. However, there are still some in-depth optimization works to be done. In terms of model prediction, we can try to make predictions for the proceeding two or three hours to achieve a longer-term trend for the BF operating status.
Author Contributions
Conceptualization, H.L. (Hongwei Li), X.L. (Xiaojie Liu) and Q.L.; data curation, H.L. (Hongyang Li), X.B. and S.C.; formal analysis, H.L. (Hongwei Li) and X.L. (Xin Li); funding acquisition, X.L. (Xin Li) and X.L. (Xiaojie Liu); methodology, H.L. (Hongwei Li), X.L. (Xiaojie Liu) and H.L. (Hongyang Li); resources, H.L. (Hongyang Li) and S.C.; project administra-tion, Q.L.; supervision, H.L. (Hongwei Li) and Q.L.; software, H.L. (Hongwei Li) and X.L. (Xin Li); validation, H.L. (Hongwei Li) and S.C.; writing—original draft, H.L. (Hongwei Li) and X.B.; writing—review and editing, H.L. (Hongwei Li) and Q.L. All authors have read and agreed to the published version of the manuscript.
Funding
This research was funded by the National Nature Science Foundation of China (NO.52004096), Hebei Higher Education Fundamental Research Funds Research Project (NO.JQN2020032).
Institutional Review Board Statement
Not applicable.
Informed Consent Statement
Not applicable.
Data Availability Statement
Not applicable.
Acknowledgments
Thanks to the North China University of Science and Technology for the training and educating. Thanks to my teacher Lyu Qing for his careful guidance. And thanks to the classmates in my team for their companionship.
Conflicts of Interest
The authors declare no conflict of interest.
References
- Hu, Y.; Zhou, H.; Yao, S.; Kou, M.; Zhang, Z.; Wang, L.P.; Wu, S. Comprehensive evaluation of the blast furnace status based on data mining and mechanism analysis. Int. J. Chem. React. Eng. 2021, 20, 111–118. [Google Scholar] [CrossRef]
- Zhou, P.; Zhang, R.; Xie, J.; Liu, J.; Wang, H.; Chai, T. Data-Driven Monitoring and Diagnosing of Abnormal Furnace Conditions in Blast Furnace Ironmaking: An Integrated PCA-ICA Method. IEEE Trans. Ind. Electron. 2021, 68, 622–631. [Google Scholar] [CrossRef]
- Wang, S.; Zhao, Q.; Liu, H.; Han, Y.; Wang, J. Abnormality monitoring and causality analysis based on KF-PDC and IACE in blast furnace ironmaking process. Ironmak. Steelmak. 2022, 49, 634–645. [Google Scholar] [CrossRef]
- Gao, D.; Zhu, X.Z.; Yang, C.; Huang, X.; Wang, W. Deep weighted joint distribution adaption network for fault diagnosis of blast furnace ironmaking process. Comput. Chem. Eng. 2022, 162, 107797. [Google Scholar] [CrossRef]
- Ma, F.T.; Zhang, J.L.; Zhang, L.; Jiao, K.X.; Hao, L.Y.; Liu, F.L. Introduction of development and progress of mathematical modeling technology in iron-making area and discussion on application prospects of big data technology. Iron Steel 2018, 53, 1–9. [Google Scholar] [CrossRef]
- Chu, M.S.; Wang, H.T.; Liu, Z.Y.; Tang, J. Research Progress on Mathematical Modeling of Blast Furnace Ironmaking Process. Iron Steel 2014, 49, 1–8. [Google Scholar] [CrossRef]
- Ueda, S.; Natsui, S.; Nogami, H.; Yagi, J.-I.; Ariyama, T. Recent Progress and Future Perspective on Mathematical Modeling of Blast Furnace. ISIJ Int. 2010, 50, 914–923. [Google Scholar] [CrossRef]
- Wu, S.; Han, H.; Liu, X. Mathematical Model for Blast Furnace Burden Optimization Based on the High-temperature Reactivity. ISIJ Int. 2010, 50, 987–993. [Google Scholar] [CrossRef]
- Bozkurt, E.; Orak, I.M.; Tunçkaya, Y. Performance analysis of hot metal temperature prediction in a blast furnace and expert suggestion system proposal using neural, statistical and fuzzy models. Met. Res. Technol. 2021, 118, 321. [Google Scholar] [CrossRef]
- Sun, W.; Wang, Z.; Wang, Q. Hybrid event-, mechanism- and data-driven prediction of blast furnace gas generation. Energy 2020, 199, 117497. [Google Scholar] [CrossRef]
- Cheng, W.S.; Shen, Y.F. Application of Smooth Running Index in Masteel’s BF. Ironmaking 2016, 35, 11–14. [Google Scholar]
- Li, H.; Bu, X.; Liu, X.; Li, X.; Li, H.; Liu, F.; Lyu, Q. Evaluation and Prediction of Blast Furnace Status Based on Big Data Platform of Ironmaking and Data Mining. ISIJ Int. 2021, 61, 108–118. [Google Scholar] [CrossRef]
- Li, H.Y.; Liu, X.J.; Li, X.; Bu, X.P.; Li, H.W.; Lyu, Q. Application of industrial Internet platform for blast furnace iron making. Iron Steel 2021, 56, 10–18. [Google Scholar] [CrossRef]
- Deng, W.; Guo, Y.; Liu, J.; Li, Y.; Liu, D.; Zhu, L. A missing power data filling method based on improved random forest algorithm. Chin. J. Electr. Eng. 2019, 5, 33–39. [Google Scholar] [CrossRef]
- Dai, H.; Kan, J.F.; Li, W.R.; Zhou, W.D. Outlier detection for sliding window of multi-variable time series. J. Nanjing Univ. Inf. Sci. Technol. (Nat. Sci. Ed.) 2014, 6, 515–519. [Google Scholar] [CrossRef]
- Zhao, J.; Chen, S.-F.; Liu, X.-J.; Li, X.; Li, H.-Y.; Lyu, Q. Outlier screening for ironmaking data on blast furnaces. Int. J. Miner. Met. Mater. 2021, 28, 1001–1010. [Google Scholar] [CrossRef]
- Chen, S.F.; Liu, X.J.; Li, H.Y.; Bu, X.P.; Lyu, Q.; Liu, F.L. Preliminary study on missing data processing of blast furnace ironmaking. China Metall. 2021, 31, 17–23. [Google Scholar] [CrossRef]
- Li, W.Q.; Xu, G.H.; Zuo, D.D.; Zhu, J.L. Corporate social responsibility performance-evaluation based on analytic hierarchy process-fuzzy comprehensive evaluation model. Wirel. Pers. Commun. 2021, 118, 2897–2919. [Google Scholar] [CrossRef]
- Shi, Q.; Wu, J.; Ni, Z.; Lv, X.; Ye, F.; Hou, Q.; Chen, X. A Blast Furnace Burden Surface Deep-Learning Detection System Based on Radar Spectrum Restructured by Entropy Weight. IEEE Sensors J. 2020, 21, 7928–7939. [Google Scholar] [CrossRef]
- Zhu, D.; Wang, R.; Duan, J.; Cheng, W. Comprehensive weight method based on game theory for identify critical transmission lines in power system. Int. J. Electr. Power Energy Syst. 2021, 124, 106362. [Google Scholar] [CrossRef]
- Lu, L.; Yuan, Y. A novel TOPSIS evaluation scheme for cloud service trustworthiness combining objective and subjective aspects. J. Syst. Softw. 2018, 143, 71–86. [Google Scholar] [CrossRef]
- Ji, C.; Liang, X.; Peng, Y.; Zhang, Y.; Yan, X.; Wu, J. Multi-Dimensional Interval Number Decision Model Based on Mahalanobis-Taguchi System with Grey Entropy Method and Its Application in Reservoir Operation Scheme Selection. Water 2020, 12, 685. [Google Scholar] [CrossRef]
- Guo, S.D.; Li, Q.; Jing, Y.Q. Comprehensive Evaluation of Urban Air Quality Based on Improved TOPSIS Method. Henan Sci. 2021, 39, 1842–1849. [Google Scholar]
- Li, H.; Li, X.; Liu, X.; Bu, X.; Li, H.; Lyu, Q. Prediction of blast furnace parameters using feature engineering and Stacking algorithm. Ironmak. Steelmak. 2021, 49, 283–296. [Google Scholar] [CrossRef]
- Brokamp, C.; Jandarov, R.; Hossain, M.; Ryan, P. Predicting Daily Urban Fine Particulate Matter Concentrations Using a Random Forest Model. Environ. Sci. Technol. 2018, 52, 4173–4179. [Google Scholar] [CrossRef]
- Liu, S.; Lyu, Q.; Liu, X.J.; Sun, Y.Q. Synthetically predicting the quality index of sinter using machine learning model. Ironmak. Steelmak. 2019, 47, 828–836. [Google Scholar] [CrossRef]
- Rathakrishnan, V.; Beddu, S.B.; Ahmed, A.N. Predicting compressive strength of high-performance concrete with high volume ground granulated blast-furnace slag replacement using boosting machine learning algorithms. Sci. Rep. 2022, 12, 9539. [Google Scholar] [CrossRef] [PubMed]
- David, S.F.; David, F.F.; Machado, M. Artificial neural network model for predict of silicon content in hot metal blast furnace. Mater. Sci. Forum 2016, 869, 572–577. [Google Scholar] [CrossRef]
- Luo, S.; Chen, T.; Jian, L. Using Principal Component Analysis and Least Squares Support Vector Machine to Predict the Silicon Content in Blast Furnace System. Int. J. Online Eng. (iJOE) 2018, 14, 149–162. [Google Scholar] [CrossRef]
- Luo, S.; Dai, Z.; Chen, T.; Chen, H.; Jian, L. A weighted SVM ensemble predictor based on AdaBoost for blast furnace Ironmaking process. Appl. Intell. 2020, 50, 1997–2008. [Google Scholar] [CrossRef]
- Li, H.; Liu, X.; Li, X.; Li, H.; Bu, X.; Chen, S.; Lyu, Q. Prediction Model for Vanadium Content in Vanadium and Titanium Blast Furnace Smelting Iron Based on Big Data Mining. ISIJ Int. 2022, 62, 2301–2310. [Google Scholar] [CrossRef]
- Yuan, D.F.; Cao, F.J.; Li, D.R. Prediction model of blast furnace temperature with principal component analysis combined with extreme learning machine. J. Inn. Mong. Univ. Sci. Technol. 2017, 36, 327–332. [Google Scholar] [CrossRef]
- Zhang, Z.Z.; Guo, F.A.; Liu, D.M.; Tang, F. Multi-model integrated short-term load prediction based on maximum mutual information coefficient and wavelet decomposition. Comput. Appl. Softw. 2021, 38, 82–87. [Google Scholar]
- Zhao, J.; Li, H.W.; Liu, X.J.; Li, X.; Li, H.Y.; Lyu, Q. Prediction model of permeability index based on Xgboost. China Metall. 2021, 31, 22–29. [Google Scholar] [CrossRef]


Disclaimer/Publisher’s Note: The statements, opinions and data contained in all publications are solely those of the individual author(s) and contributor(s) and not of MDPI and/or the editor(s). MDPI and/or the editor(s) disclaim responsibility for any injury to people or property resulting from any ideas, methods, instructions or products referred to in the content. |
© 2023 by the authors. Licensee MDPI, Basel, Switzerland. This article is an open access article distributed under the terms and conditions of the Creative Commons Attribution (CC BY) license (https://creativecommons.org/licenses/by/4.0/).