Abstract
CO2 + O2 is a relatively mature, neutral, in situ leaching process that has been widely used. However, the decrease in uranium concentration in the leaching solution during production has become a serious problem in the western section of the south ore belt of the Shihongtan deposit in Xinjiang, China. In order to solve this problem, mineralogy and batch tests were carried out to explore the reason for the low uranium resource leaching efficiency and determine better leaching process parameters. A total of 16 tests were carried out under different conditions of CO2/O2 ratios and HCO3− concentrations. The results show that: (1) The uranium minerals in the ore were mainly pitchblende and titanium-bearing uranium mineral. Part of the uranium resources were mixed in quartz, which were difficult to activate and recover. The high content of calcium carbonate and clay minerals in ore and the high TDS (total dissolved solid) content in groundwater would cause a reduction in porosity. (2) According to the uranium concentration and uranium leaching rate, a better leaching efficiency was obtained when the pH was lower than 6.6, and the HCO3− concentration was 800 mg/L. This result could serve as a reference for production in other similar mines.
1. Introduction
Uranium is very unevenly distributed around the world, with Chinese uranium production representing only 5% of the global total. Uranium is distributed in 23 provinces and autonomous regions in China, mainly consisting of sandstone-type (45.51%), volcanic-type (21.84%), granite-type (16.38%) and carbonaceous–siliceous-mudstone-type (8.34%) deposits [1,2]. At present, China’s recoverable coal reserves will only last for 33 years, so it is extremely urgent to comprehensively optimize China’s energy structure [3]. As of December 2020, the total installed capacity can reach 48.74 million kW [4]. China’s supply of natural uranium accounts for only a quarter of the demand [5], which cannot meet the demand associated with the rapid development of nuclear power. In 2035, China is expected to produce only one-fifth of its total demand [6], and the demand for imported uranium resources continues to increase under the “dual carbon” target [7,8].
At present, uranium is mainly produced from sandstone-type uranium deposits in China. CO2 + O2 in situ leaching uranium technology, the third-generation in situ leaching uranium production technology in China, is a type of technology that is suitable for high carbonate deposits, with the advantages of having a low cost and causing a low amount of pollution [9]. In the neutral (CO2 + O2) leaching process, the leaching agent is composed of layers of water, CO2, and O2. O2 can oxidize the tetravalent uranium in the deposit to soluble hexavalent uranium. CO2 dissolves in H2O and reacts to generate H2CO3. Under neutral conditions, H2CO3 ionizes to generate a large amount of HCO3−, which can complex with uranyl ions to form stable uranyl dicarbonate or uranyl tricarbonate (UO2(CO3)22−, UO2(CO3)34−) [10]. The specific reaction leaching mechanism is as follows (chemical Equations (1)–(4)):
2UO2(Uraninite) + O2 = 2 UO3
CO2 + H2O = H2CO3
H2CO3 + CaCO3 = Ca(HCO3)2
UO22+ + nHCO3− = UO2(CO3)n 2−2n + n H+
Gao [11], Ji [12], Liu [13], Yan [14], Du [15], and Asghar [16] have demonstrated the feasibility of the industrial application of a CO2 + O2 in situ leaching process in different deposits. Their results verified the feasibility of a CO2 + O2 in situ leaching process and proposed production parameters for specific uranium deposits. After decades of development, China has successfully established several in situ uranium leaching mines in northern Xinjiang and Inner Mongolia.
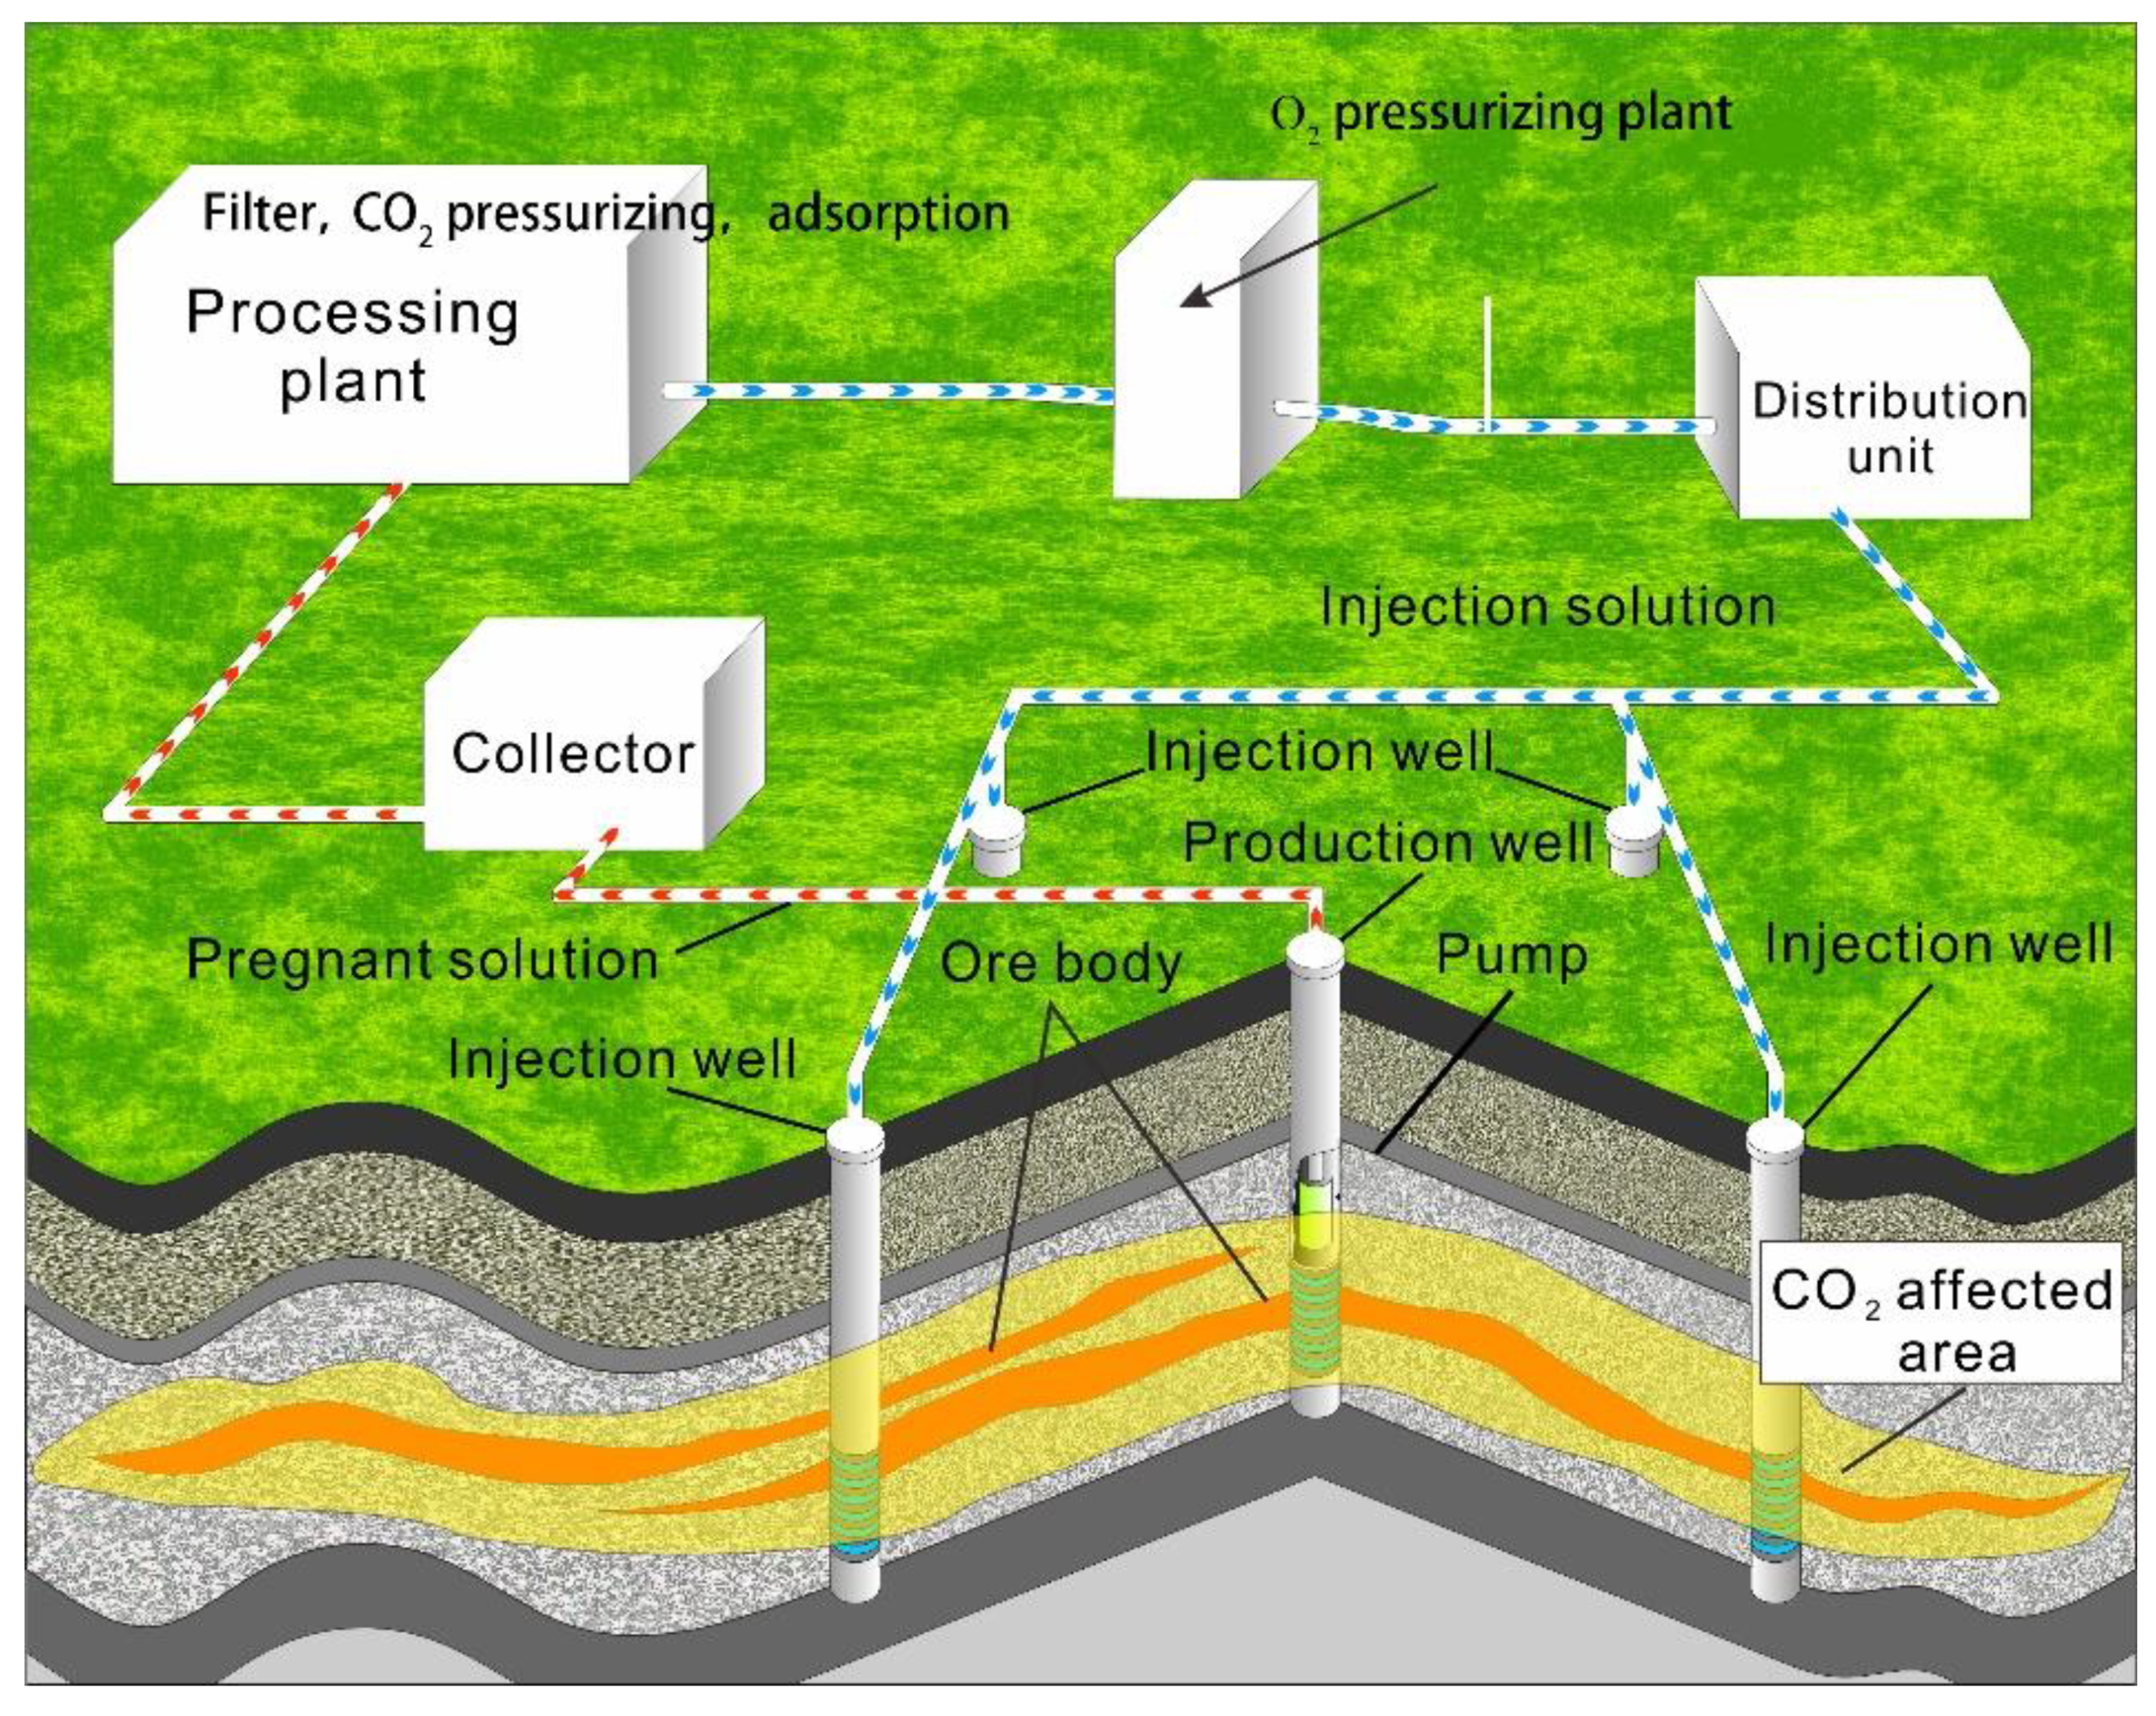
The in situ leaching mining process (Figure 1) includes two parts: hydrometallurgy and mining. The mining system is responsible for configuring the leaching solution and recovering the leaching solution, while the hydrometallurgy system is responsible for treating liquid-phase uranium into solid uranium. The leaching solution is mechanically filtered to remove solid impurities and then added to the CO2 gas to be sent to the adsorption tower. The tail liquid is distributed to the injection drilling well through the central control room and injected into the ore-bearing layer, forming a uranium-containing leaching solution in the ore layer. After passing through the extraction well, it enters the hydrometallurgy workshop for resin adsorption and leaching recovery. The adsorbed tail liquid is then re configured with a leaching agent as the leaching solution for reuse [17].
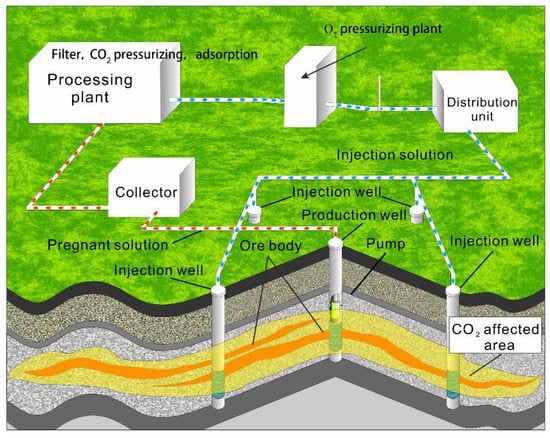
Figure 1.
Production process of CO2 + O2 in situ leaching.
The Shihongtan uranium deposit, located in Xinjiang, China, is an important natural uranium mining base. The Shihongtan deposit is a typical interlayer oxidation-zone sandstone-type uranium deposit in China, characterized by multiple mineralization layers, a high grade, and large reserves. The ore is loose and has good in situ leaching conditions [18,19]. The uranium concentration in the mining area of the west section in the south ore belt continues to decrease during production, and is lower than the production design index. In order to investigate the cause of the low uranium concentration in the leaching solution and improve production efficiency, process mineralogy and laboratory-condition tests were carried out to study the occurrence and type of uranium ore and optimize the leaching process parameters. The results explain the reason why uranium resources were difficult to leach, and provide reference for mining the Shihongtan deposit and other similar uranium deposits.
2. Tectonic Background and Regional Geological Setting
The Shihongtan uranium mining area is located on the Aiding Lake slope belt on the southwest edge of the Tuha Basin (Figure 2). This area is a monoclinic structural layer developed on a carboniferous basement [20]. The exposed strata, from old to new, are successively: the Shuixigou Group of the Middle and Lower Jurassic, the Taoshuyuanzi Formation of the Tertiary, and the Quaternary. The Quaternary system consists of weathered grayish yellow sandy conglomerate, while the Tertiary system consists of brick red gravel mudstone, argillaceous sandstone, and calcareous sandy conglomerate. The Jurassic Shuixigou Group is a set of coal-bearing clastic rock formations, divided into the Badaowan Formation, Sangonghe Formation, and Xishanyao Formation, from bottom to top. Each lithologic group consists of several conglomerates, coarse sandstone, medium sandstone, fine sandstone, siltstone, mudstone, coal seams, and coal lines [21]. The overall formation is a monoclinic layer, gently dipping northward, with an inclination angle of 1°–10°. The ore bodies mainly occur in the sand bodies of the Xishanyao Formation of the Middle Jurassic, divided into the north zone and south zone. Their occurrence is strictly controlled by the interlayer oxidation zone. And the ore bodies are mainly developed in the squeezed area of the interlayer oxidation zone. Sometimes, wing ore bodies or residual bodies also exist in the reduction zones of the upper and lower wings of the oxidation zone [22].
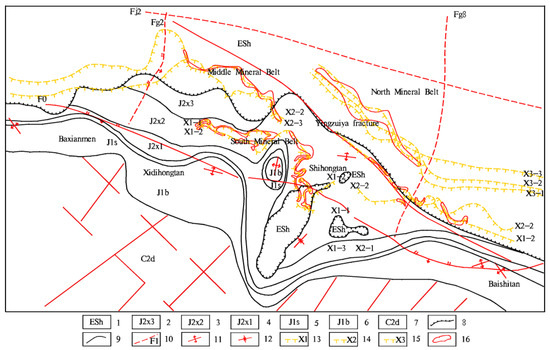
Figure 2.
Geological sketch of southern belt of Shihongtan uranium deposit, Turpan, Xinjiang [23]. 1—Paleogene Shanshan Group; 2—The third lithological segment of the Xishanyao Formation in the Middle Jurassic; 3—The second lithological segment of the Xishanyao Formation in the Middle Jurassic; 4—The first lithological segment of the Xishanyao Formation in the Middle Jurassic; 5—Lower Jurassic Sangonghe Formation; 6—Lower Jurassic Badaowan Formation; 7—Upper Carboniferous Dihaer Formation; 8—Unconformity contact boundary; 9—Stratigraphic boundary; 10—Fault structure; 11—Anticline; 12—Syncline; 13—Front line of interlayer oxidation zone in the first lithological section of Xishanyao Formation; 14—Front line of interlayer oxidation zone in the second lithological section of Xishanyao Formation; 15—Xishan Kiln front line of interlayer oxidation zone in the third lithological segment of the formation; 16—Uranium ore belt.
The length of the Shihongtan sandstone uranium deposit is generally 1–2 km and the width is 200–300 m; The thickness of the ore body is 3.5–8.4 m, with an average of 5.37 m. In uranium ore, uranium mainly exists in the form of adsorbed uranium (accounting for approximately 45~51%). The relatively rich ore (U > 0.1%) contains ultramicroscopic pitchblende and uranite, and a small amount of uraninite, uranium-bearing titanium iron oxide, uranium-bearing zircon, and monazite [24]. Adsorbed uranium is related to granular, silty pyrite, carbonaceous and chlorite clay cement, argillite feldspar, volcanic debris, etc. [25] The development of calcareous sandstone in the mining area is the biggest unfavorable factor for the in situ leaching of uranium. The number of layers of calcareous sandstone is generally 3–7, with a single layer thickness of less than 1 m being the majority, followed by 1–2 m, and very few layers greater than 2 m. Calcareous sandstone is selectively developed along the edge of the sand body or the upper and lower parts of the sand layer, and is most likely to occur in the contact part of the sand body with mudstone and siltstone [26]. Calcareous sandstone is preferentially developed along sandstone layers with a coarser grain size, better sorting ability, and better permeability. In thicker and larger sand bodies, calcareous sandstone develops along the lower gravel-bearing sand body, possibly related to the erosion surface developed in the thick sand body. Calcareous sandstone generally occurs in the form of intermittently distributed beaded lenses, or is developed in an irregular block-like bedding direction, generally extending for 3–5 m. Calcareous sandstone is basically discontinuous on the profile, with a tendency to extend no more than 10 m. Calcareous sandstone is mostly dense calcareous cemented sandstone or conglomerate. After later transformation, different degrees of decalcification occur near the upper and lower layers of calcareous sandstone, becoming sub-loose or even loose sandstone. From dense and hard calcareous sandstone to loose sandstone, the CO2 and CaO content significantly decreases [27].
3. Material and Method
3.1. Material
3.1.1. Rock
The ore was recovered in the west section of the south ore belt of the Shihongtan uranium deposit, Xinjiang. The primary stone of the rock was gray and light gray. The lithology of the core sample was complex, including conglomerate and sandstone. The ore-bearing sand body was mainly composed of mudstone and siltstone, with a few impermeable lenses. In terms of grain size structure, the ore was mainly composed of coarse grains and medium grains with gravel. The skeleton particles of the ore-bearing sand body were mainly composed of quartz, rock debris and feldspar. The fillings were mostly argillaceous matrix and clay minerals, and calcite cement could be seen locally with loose cementation. Organic reducing substances such as a coal interlayer or coal line could be seen in the core. The proportions of ores with particle size < 0.25, 0.25~0.5, 0.5~1, and >1 mm were 23.55%, 24.47%, 24.83%, and 27.15%, respectively. The porosity of the ore was approximately 0.16, and the mud content of the rock was approximately 14.1%.
3.1.2. Chemistry of Aquifer Groundwater
The ore bed water was also taken from the south section of the Shihongtan uranium deposit. And the chemical composition was shown in Table 1. The groundwater type was Cl-SO4-Na-Ca, with a pH value of approximately 7.7, and Eh of approximately 225 mV.

Table 1.
Chemical composition of aquifer water (mg/L).
3.2. Method
3.2.1. Mineralogy
The main methods of mineralogical research included: (1) Mineral identification by optical microscope; (2) Scanning electron microscopy to explore the microscopic morphology and mineral composition analysis of ores; (3) X-ray fluorescence spectrometry to measure the uranium content.
3.2.2. Batch Test
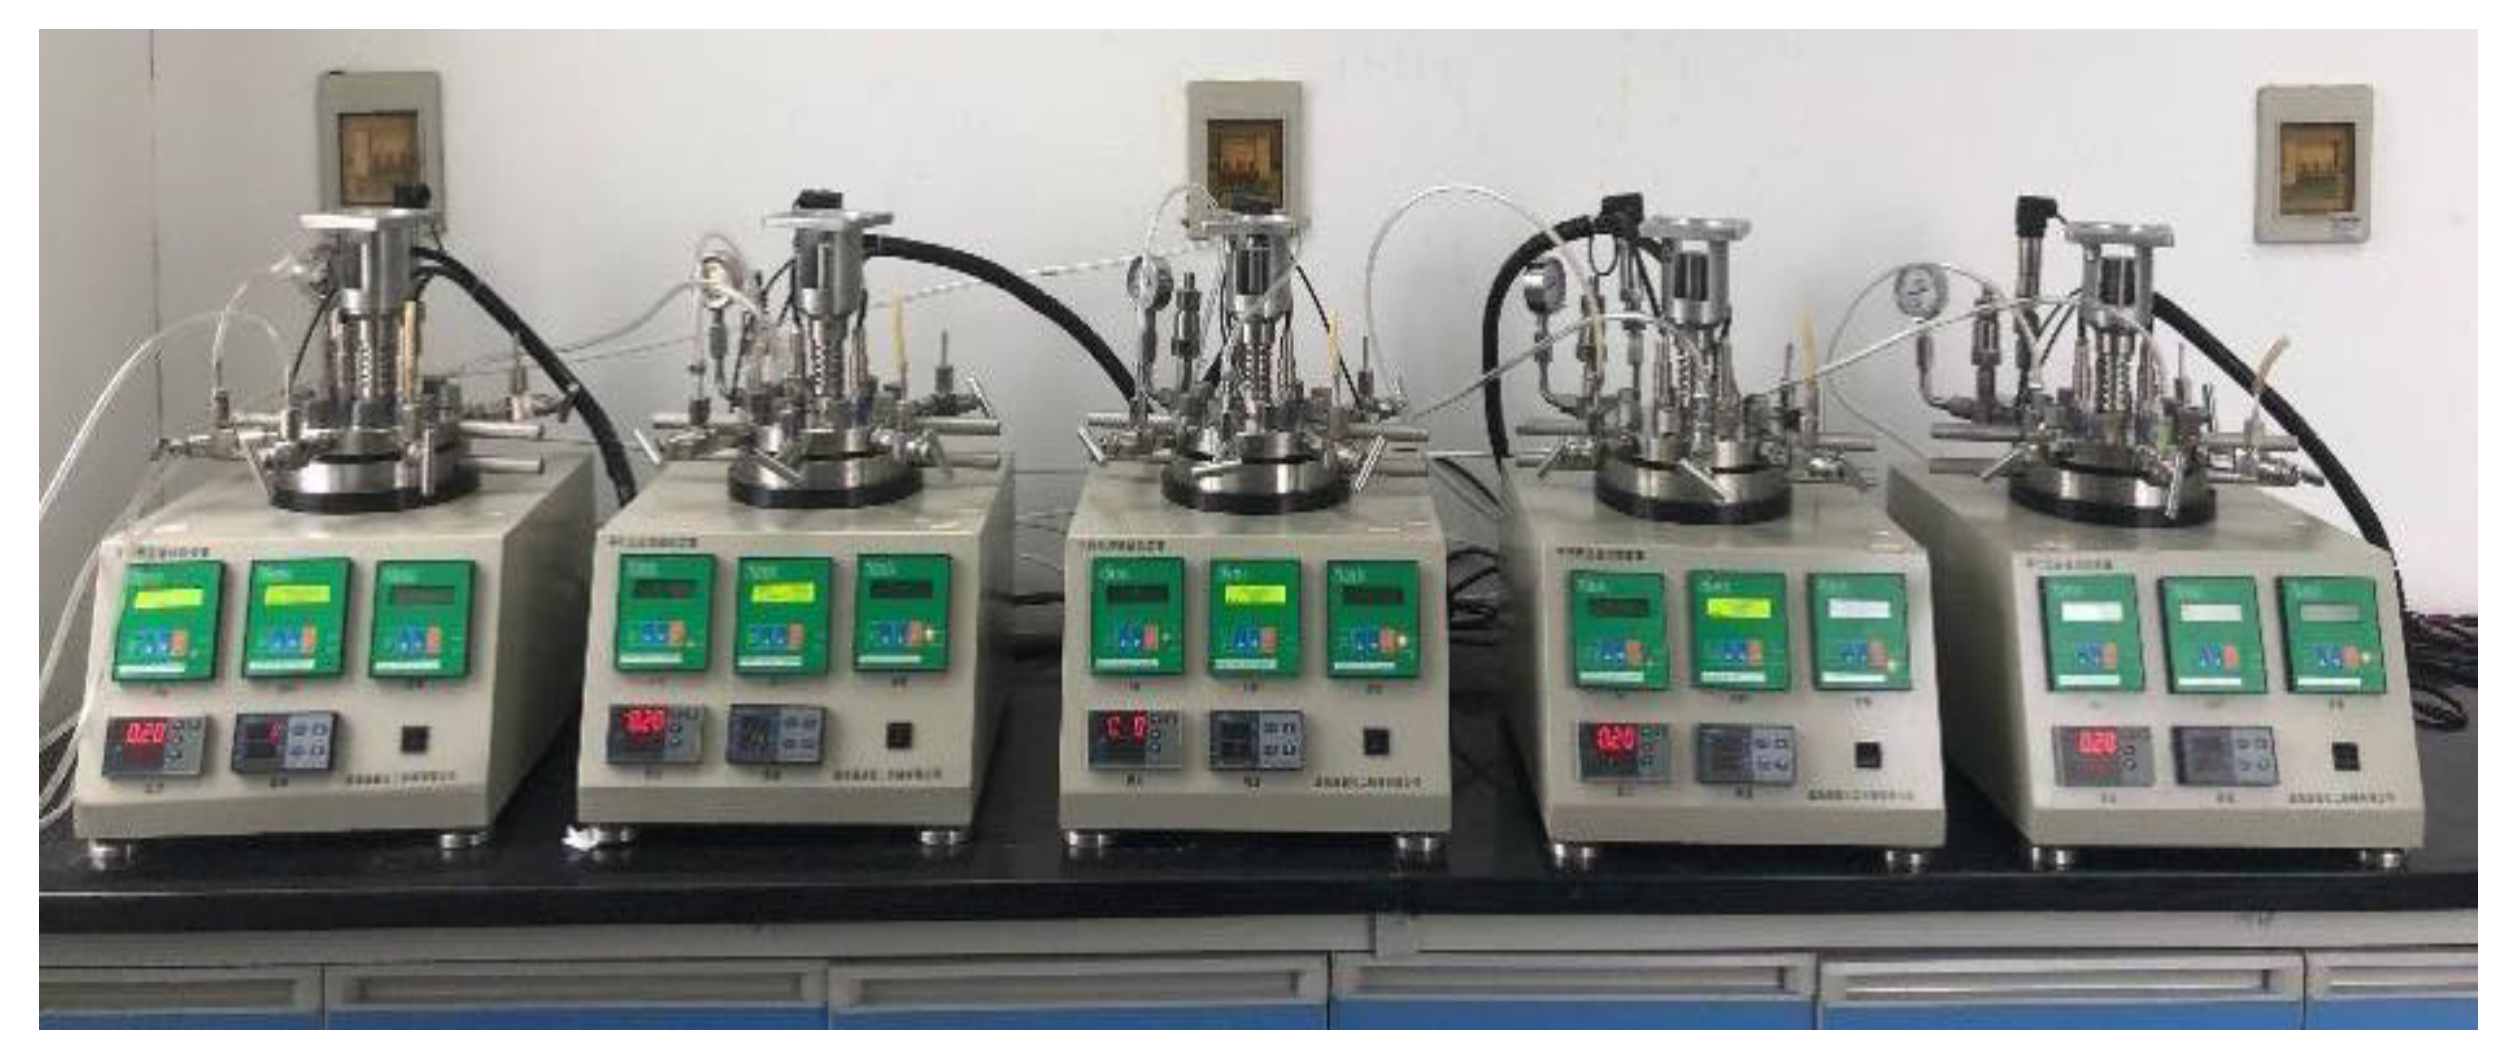
A batch test was carried out in the high-pressure reactor (Figure 3), equipped with an air inlet, air outlet, sampling port, pressure sensor, safety explosion-proof port, pH sensor, ORP sensor, DO sensor, and mixing power device, and this supported real-time monitoring and storage.
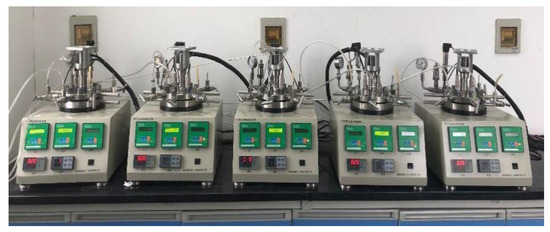
Figure 3.
Physical picture of an autoclave.
The total pressure of the CO2 and O2 mixture was set at 0.2 MPa, with the ratios of 1:1, 1:3, 1:7, and 1:10. The leaching solutions with HCO3− concentrations of 650, 800, 950, and 1100 mg/L were prepared by adding NH4HCO3 to the solution. A total of 24 groups of static uranium leaching tests were carried out with the liquid–solid ratio of 5:1. And the test slag samples were collected to test the uranium content.
The batch test process was as follows:
- (1)
- Sample processing. Firstly, the mud skin was removed from the surface of the core sample to avoid its impact on the test. Secondly, the cores were broken and then screened according to the particle size of less than 0.25 mm, 0.25~0.5 mm, 0.5~1 mm, and greater than 1 mm. Thirdly, the rock samples of each particle size were thoroughly stirred to make them uniform. Finally, the samples were reconfigured according to the ore grading and reserved for leaching tests.
- (2)
- Preparation of solution. Using mineral water as the matrix, NH4HCO3 was added to prepare 750 mL of HCO3− extractant with concentrations of 500 mg/L, 650 mg/L, 800 mg/L, 950 mg/L, and 1100 mg/L, respectively. Ultrapure water was used as the HCO3− concentration 0 solution and it was placed in a sealed reactor.
- (3)
- Loading. The autoclave was charged with the sample, and then the bolts were tightened and evenly distributed on the flange to achieve reliable sealing without leakage.
- (4)
- Inject CO2 + O2. A gas mixture with a CO2:O2 ratio of 1:1 was injected and the pressure was adjusted to control the pH distribution of the leaching system to 6.2, 6.4, 6.6, and 6.8.
- (5)
- On-line sampling and monitoring. During the leaching process, all data in the autoclave were detected in real time by the detection and control system, and feedback was displayed in time by the pH display table, OPR display table, dissolved oxygen display table, and pressure display table. At the predetermined sampling time, the uranium concentration and bicarbonate concentration of the uranium mineral leaching solution were detected through the sampling port, and the sampling volume was measured.
- (6)
- When the test time reached 48 h, the oxygen outlet was closed and the exhaust port was opened. After the internal pressure of the reactor was restored to 1 atmospheric pressure (external pressure), the bolts of the cover were unscrewed in turn, the reactor cover was opened, the leaching supernatant and slag sample were removed, and the reactor was cleaned.
- (7)
- Solid–liquid separation. After the test, the supernatant was taken and placed in a polyethylene centrifuge bottle to analyze anions in the leaching solution. At the same time, the slag sample in the autoclave was placed in a centrifugal bottle, and the centrifugal speed was set at 45 r/min for 5 min to separate the solid and liquid. The chemical composition of centrifugal liquefaction components were detected.
- (8)
- Cleaning the slag. After centrifugation, the slag was washed. A total of 100 mL deionized water was added to each group of slag samples, and the samples were stirred evenly. The samples were put into a centrifuge for solid–liquid separation, and the centrifugal liquefaction components were detected. The cleaned slag sample was dried at a low temperature in a drier; then, the slag was weighed and mixed evenly, and 50 g was taken for conducting the major element analysis.
4. Result
4.1. Form and Distribution of Uranium
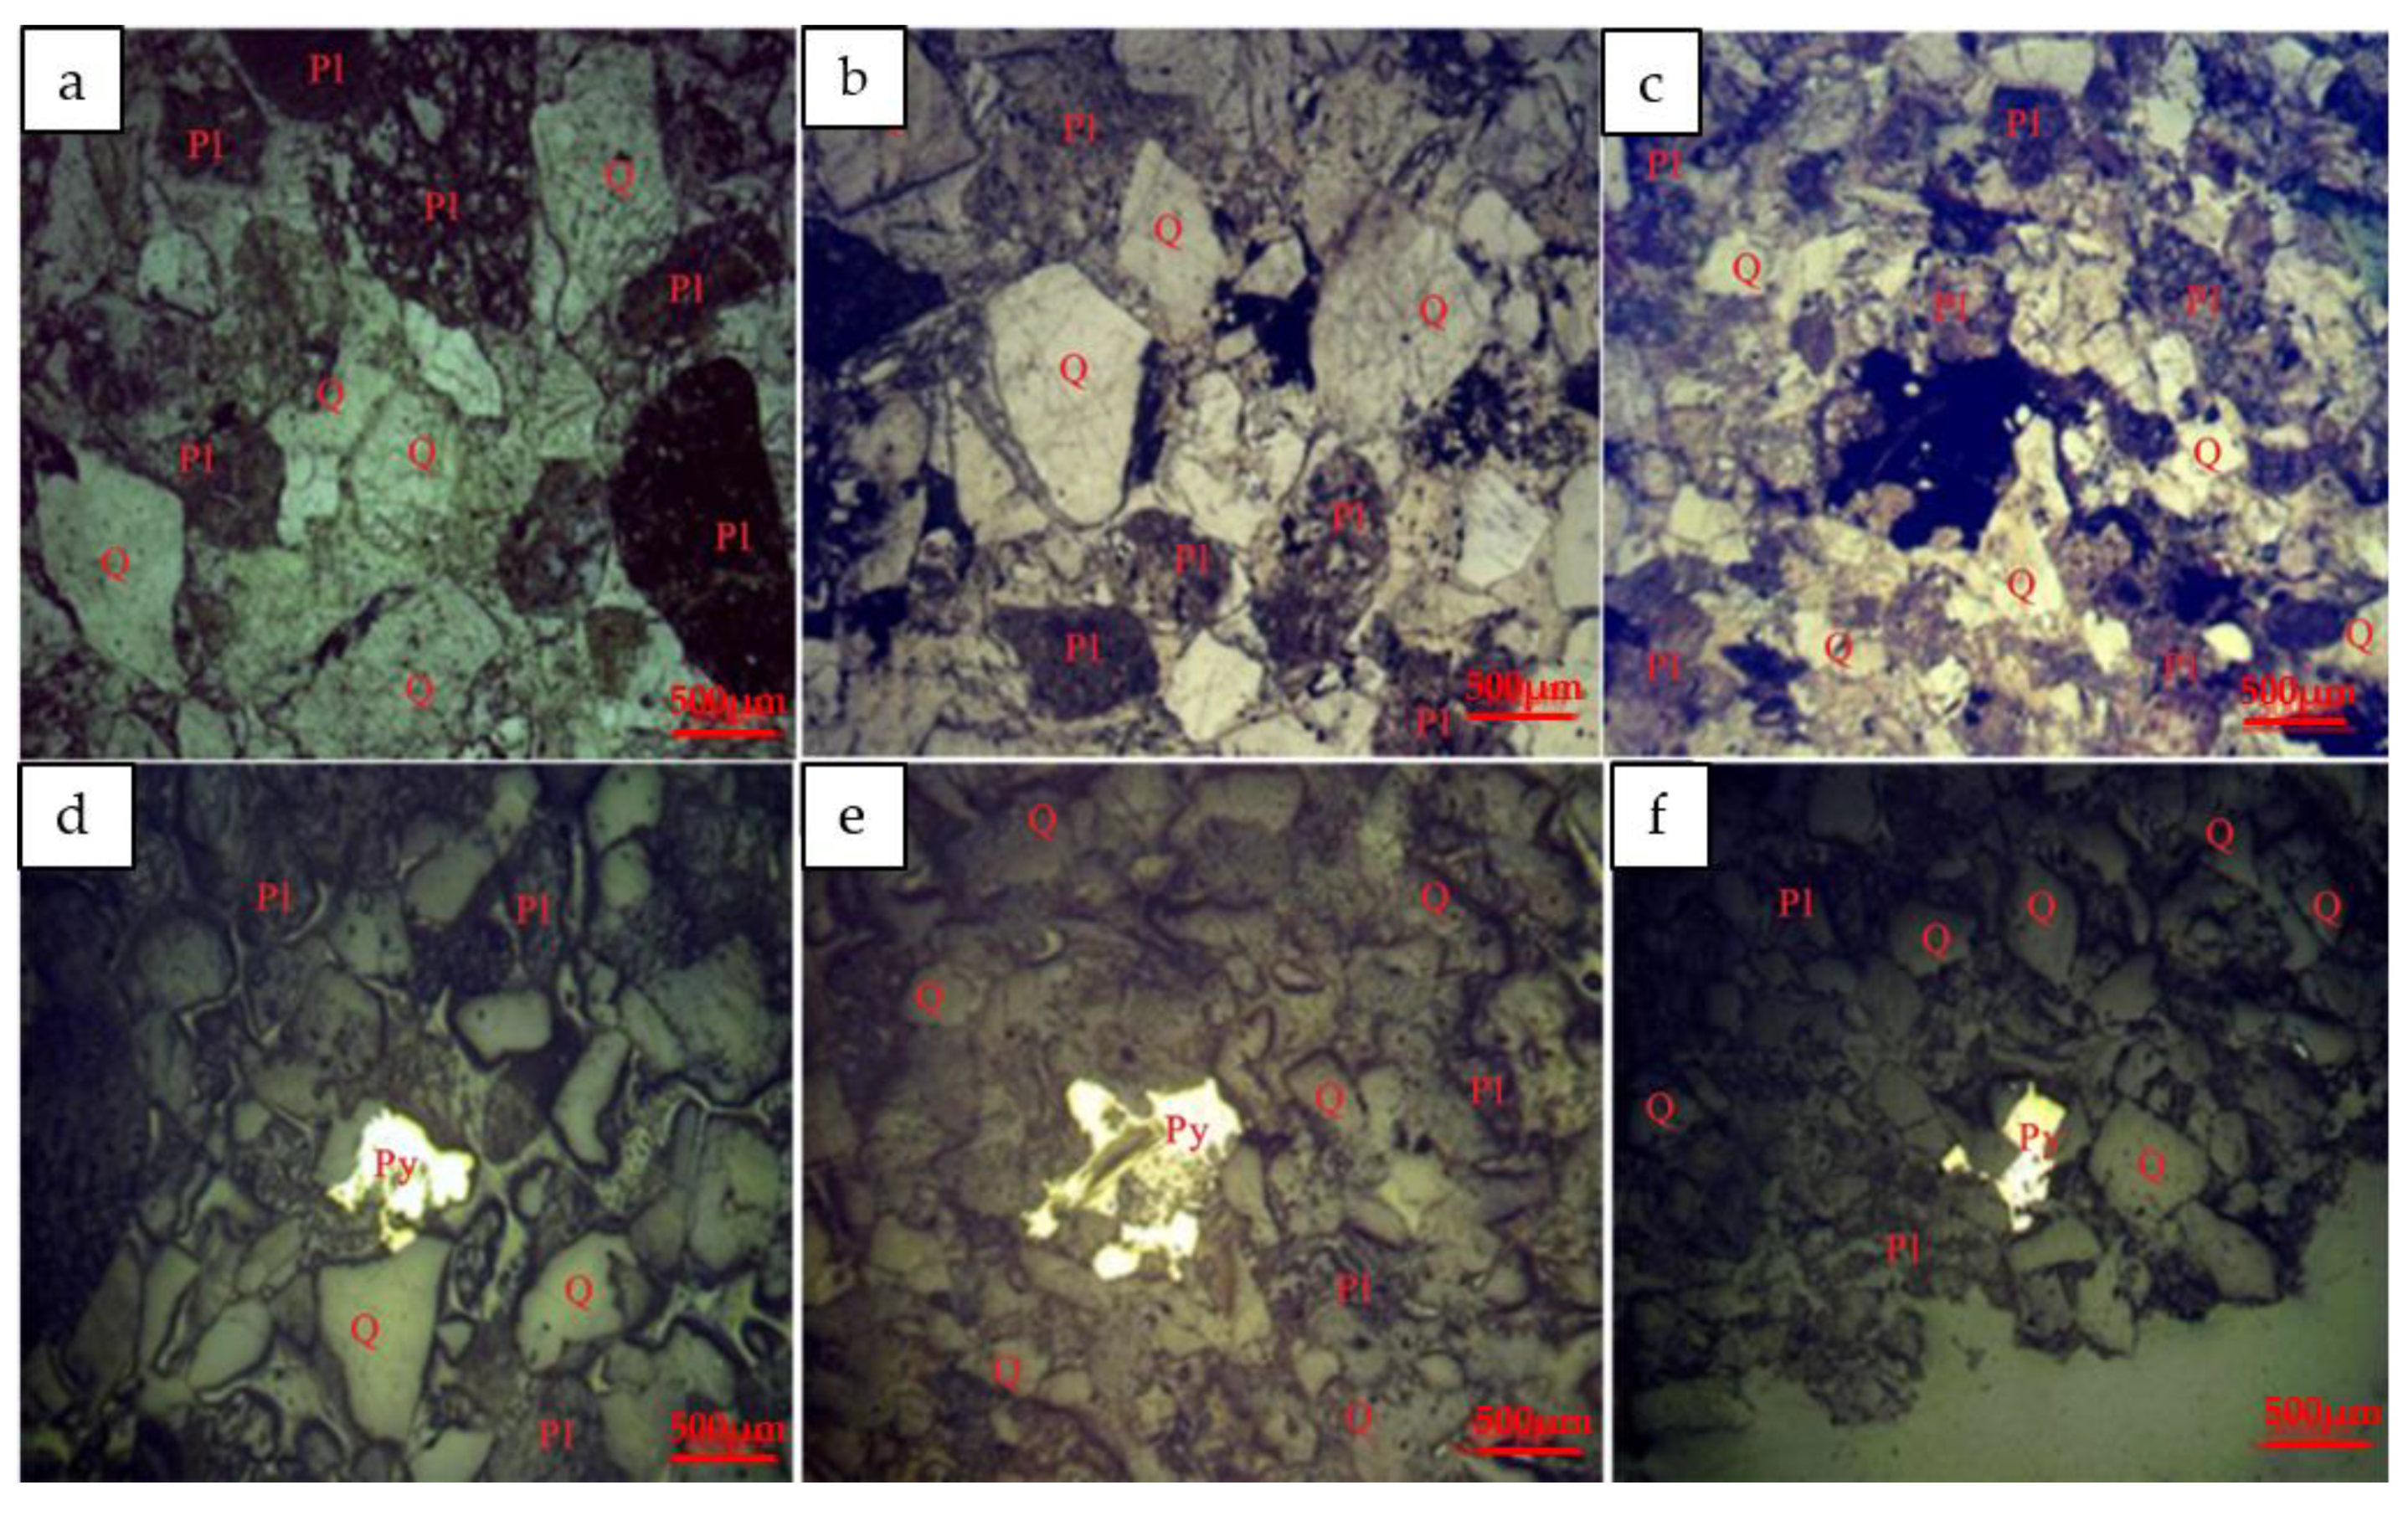
Figure 4 is the photo of ore optical microscope. The ore sample was coarse-grained and medium-grained sandstone, part of which was fine sandstone and siltstone. The clastic particles were mainly feldspar and quartz, with a certain amount of mica minerals and rock debris. The sample mainly developed argillaceous cementation, and a small amount of calcareous cementation can be seen. Clay minerals were filled between clastic particles, and feldspar was severely weathered, which may be an important source of clay minerals (Figure 4a–c). Pyrite and other metal minerals were mainly developed between the particles of clastic particles and between the corrosion pits in the particles, with different shapes (Figure 4d–f). Some of them were seriously corroded. There may be small uranium minerals around the pyrite.
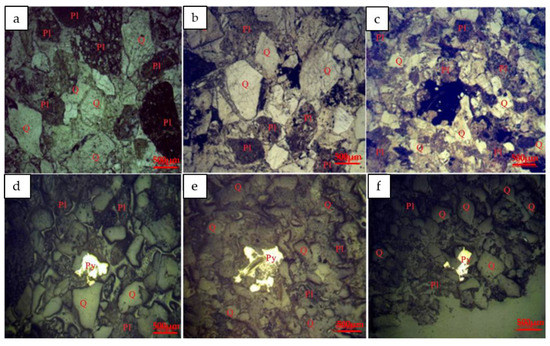
Figure 4.
Photo of rock optical microscope. (Q—quartz; Py—pyrite; Pl—anorthite). (a–c)—clay in the minerals; (d–f)—pyrite in the minerals.
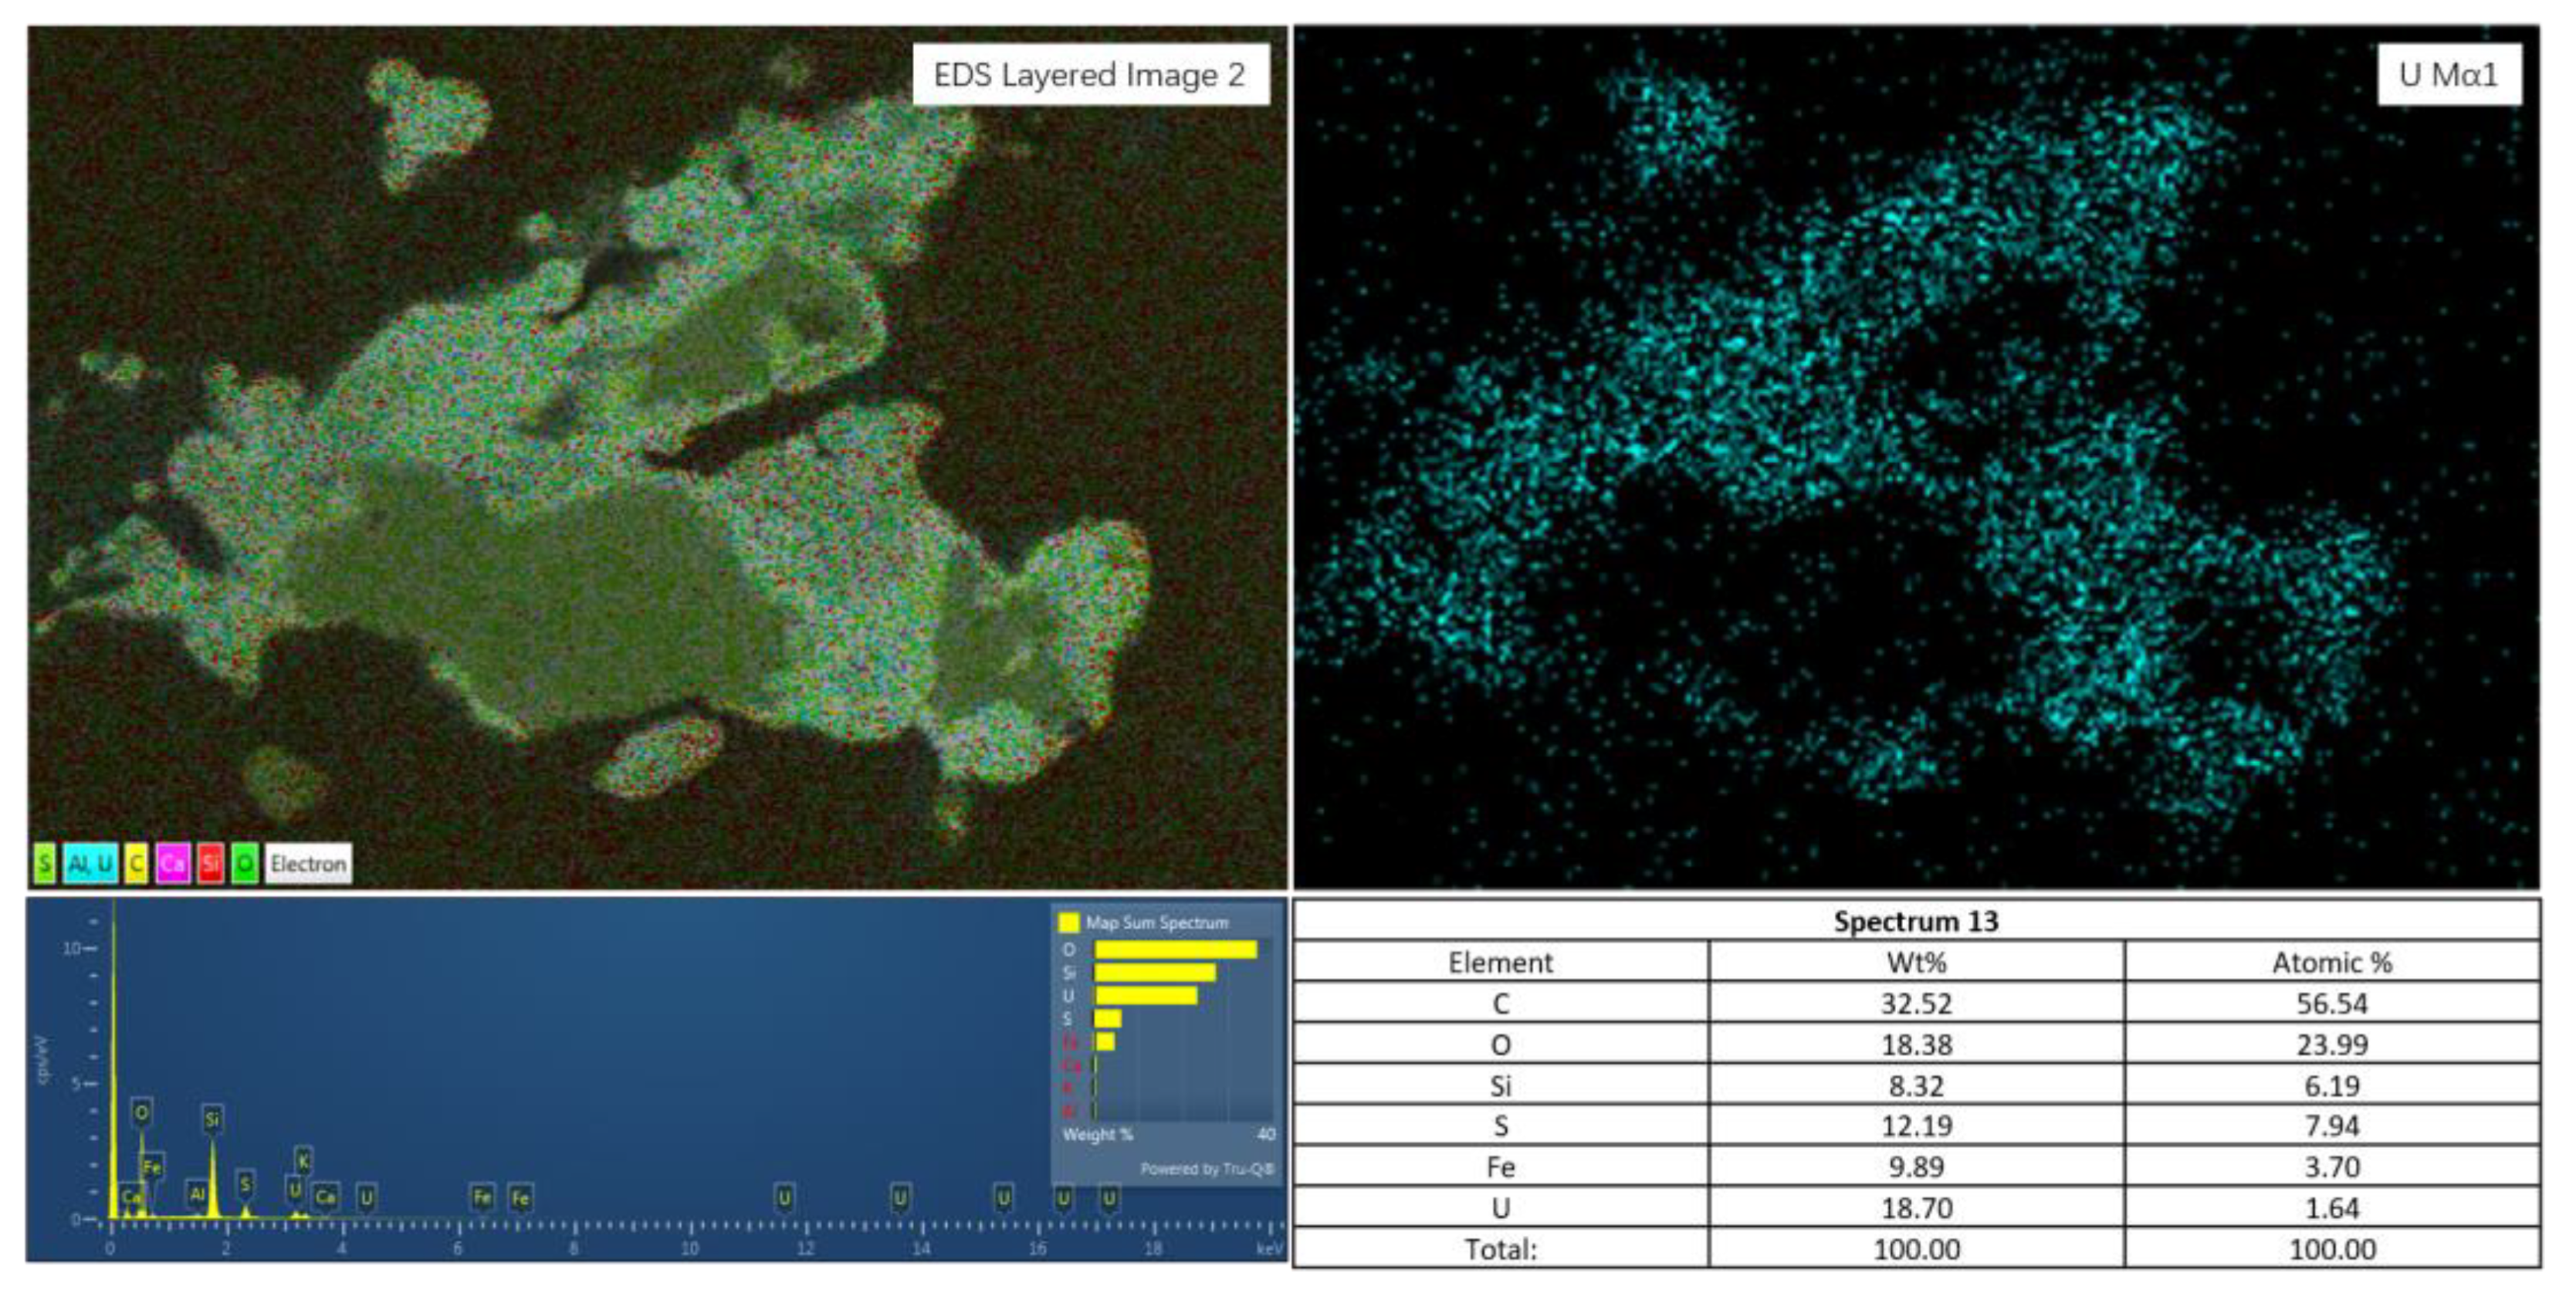
According to the analysis of the ore micro area morphology and ore composition by SEM, the main uranium minerals included pitchblende, uraninite, and uranite, which were unevenly distributed. The independent uranium minerals in the ore were mainly pitchblende and titanium-bearing uranium minerals. Pitchblende was mainly in the form of submicron fine particles, which mainly existed in the corrosion pits (Figure 5). There were some titanium-rich uranium minerals in the cracks and edges of mica particles, and some titanium-bearing uranium ores existed in the corrosion pits. Uranium ore was associated with pyrite.
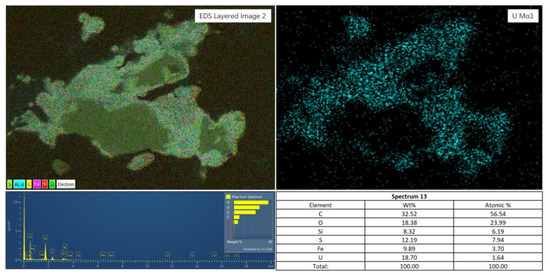
Figure 5.
XRD pattern.
The main element content test (Table 2) and individual element content test (Table 3) were conducted for mixed ore samples and ore samples with different particle sizes.
Table 2.
Main content of mixed sample and sample with different sizes (%).
Table 3.
Individual content of mixed sample and samples with different sizes.
The results of the geochemical major element contents showed that quartz and feldspar were the main rock forming minerals. The high content of SiO2 and Al2O3 in the ore and the low content of K and Na indicated that feldspar was seriously weathered and argillized. The high content of CaO, CO2, and LOI with the microscope results showed that calcium carbonate mainly existed in the ore.
The content of U in the sample was not high, and it was well-distributed in different particle sizes. The content of U in fine sand with a particle size less than 0.25 mm was the highest, accounting for 31.3%. The distribution of TFe2O3 and FeO in ores with different particle sizes was relatively uniform, and the comparison of their contents showed that the Fe in this batch of ores was mainly in the reduced state. There was a weak correlation between SO3 and FeO, indicating that Fe in the formation mainly existed in the form of pyrite.
The results of mineral process mineralogy showed that the ore contained reducing coal or carbon, which was not conducive to uranium activation leaching. Additional oxidants needed to be added to improve the redox potential. The crystallinity of fine uranium ore particles in the ore dissolution pit and fractures was not high, and they were easy to recover. However, the uranium resources mixed in quartz were difficult to activate and recover. The calcium content in the ore was relatively high, while pyrite and other sulfides were relatively low, and calcium carbonate or calcium sulfate blockage may occur in the process of in situ leaching. In addition, the feldspar in the ore was obviously clayed, and the clay particles were small. It was easy to block the pore throat in the area where the seepage velocity of the in situ leaching flow field was slow, causing the flow velocity to drop.
4.2. Uranium
4.2.1. Uranium Concentration
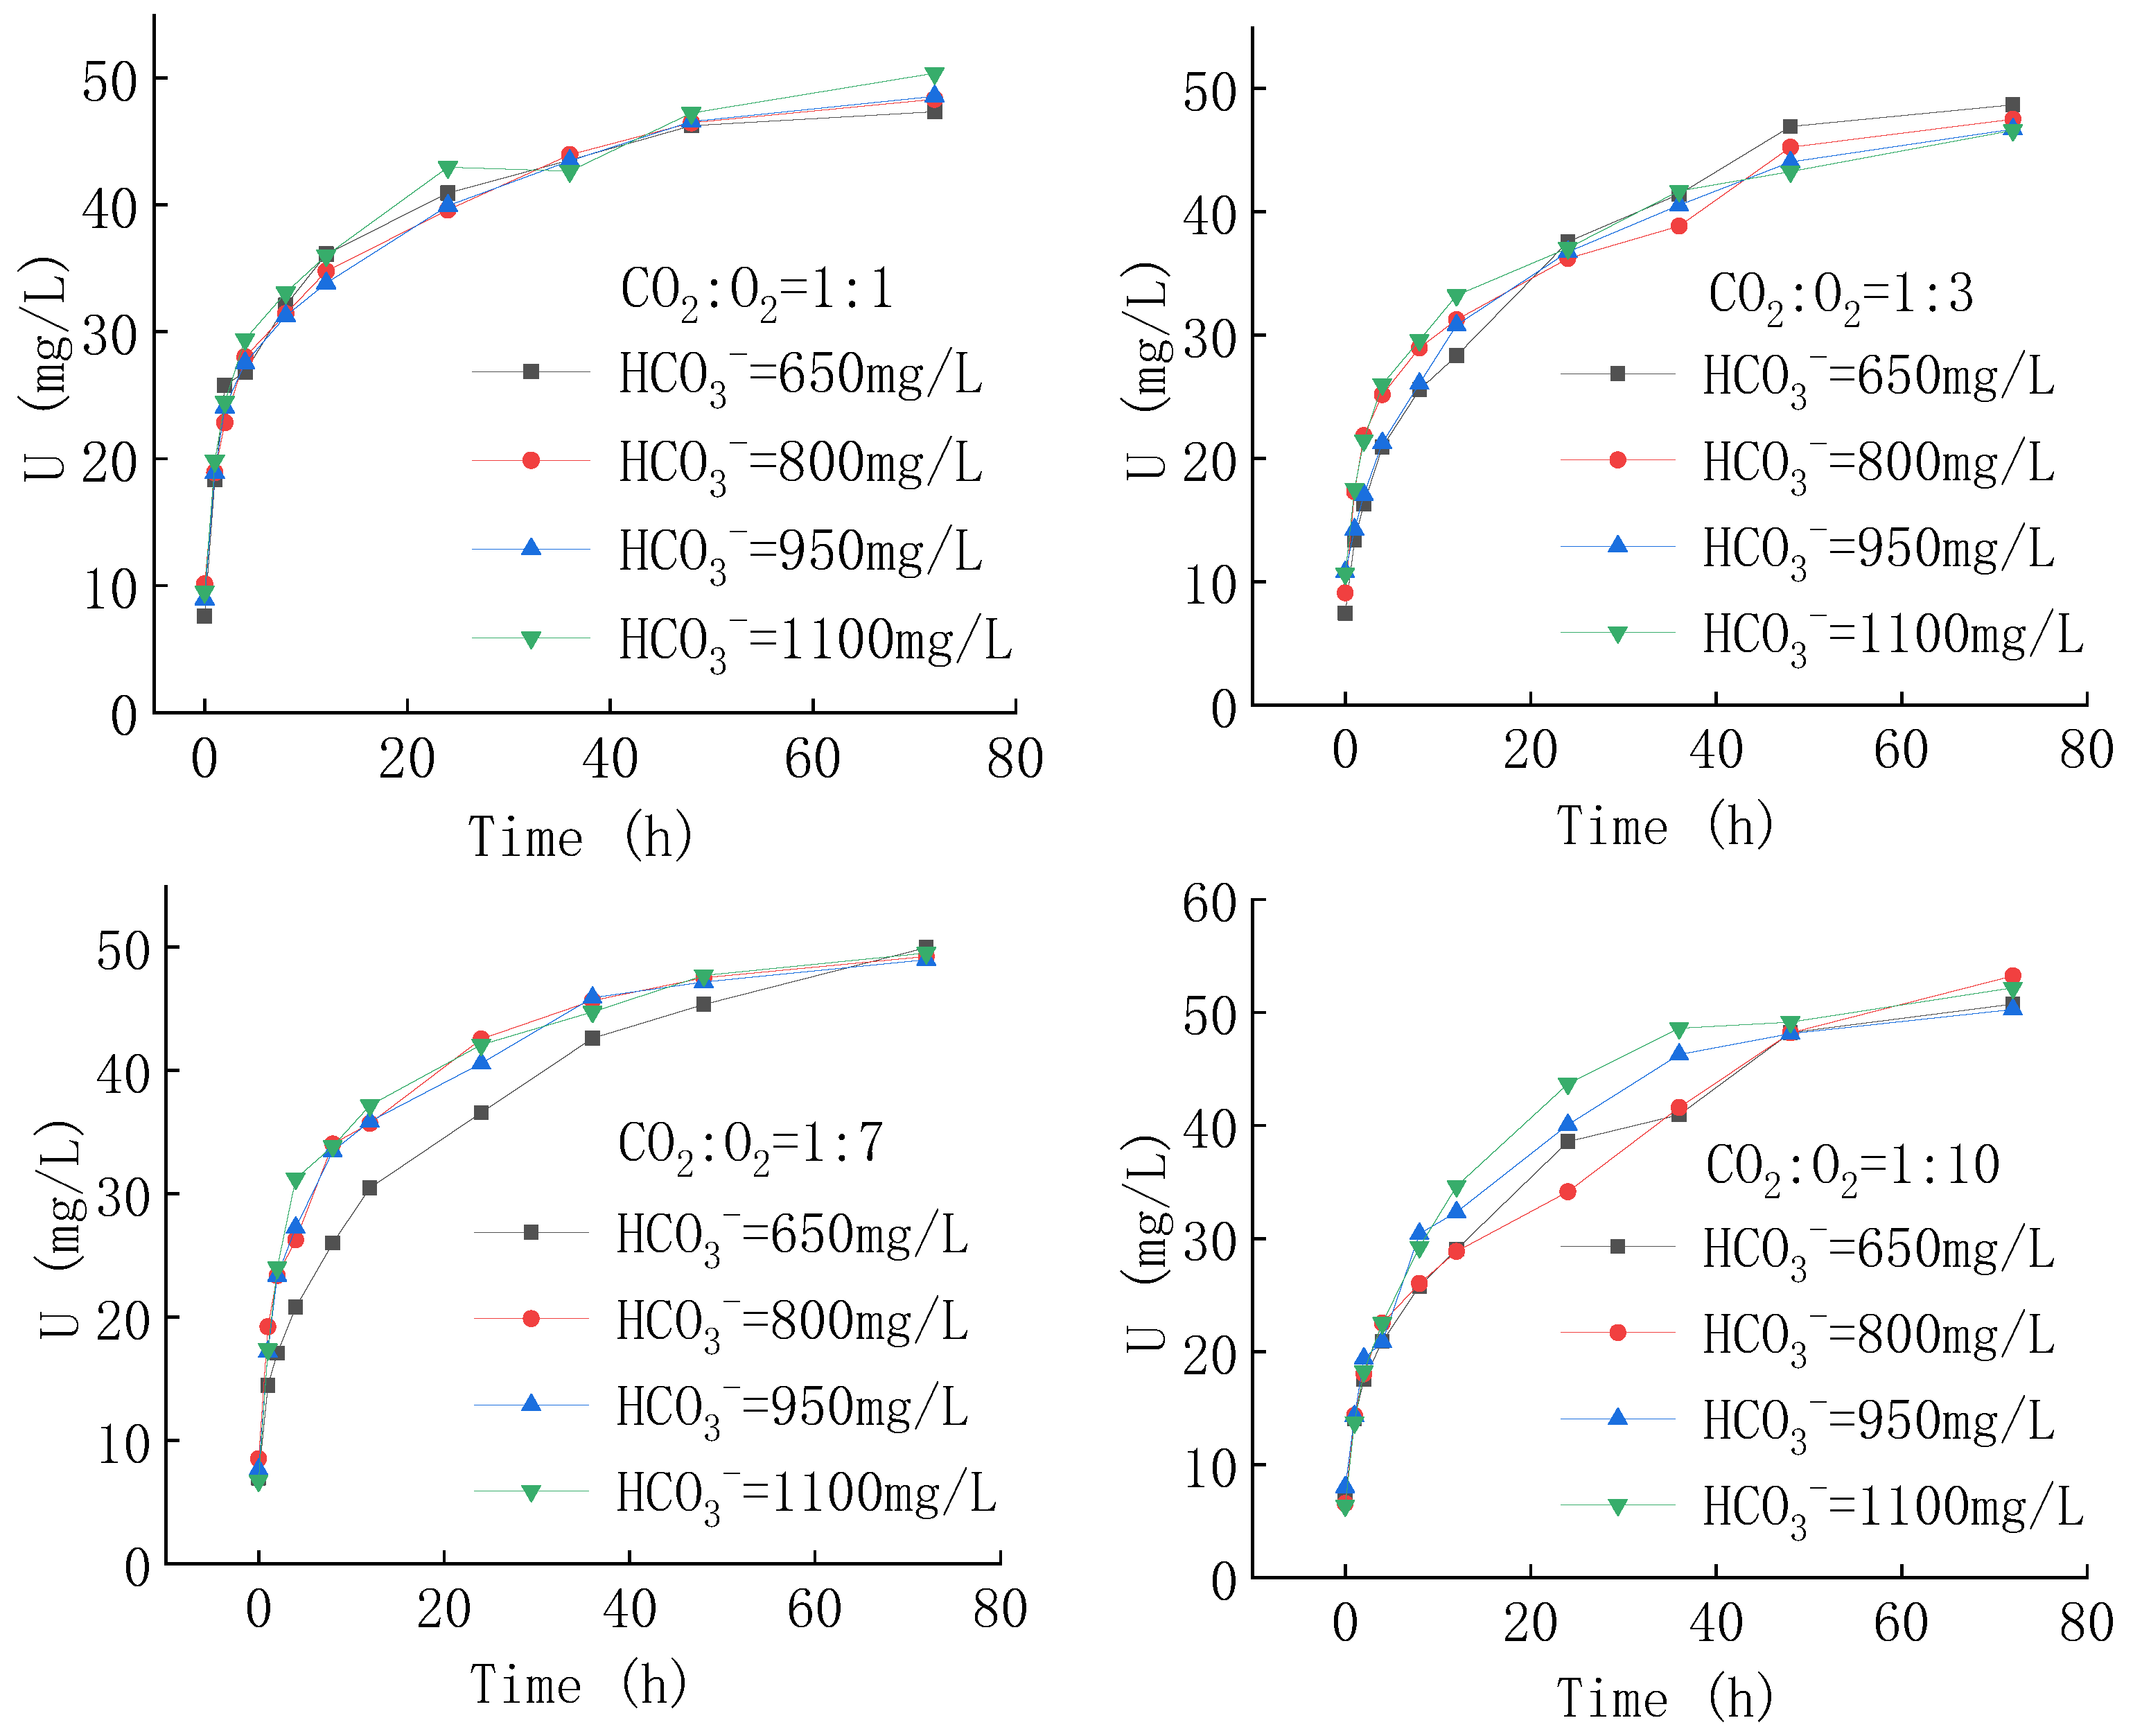
CO2:O2 was 1:1, 1:3, 1:7, and 1:10 with HCO3− concentrations of 650, 800, 950, and 1100 mg/L, respectively, controlling the pH value of the solution to between 6.2~6.4, 6.4~6.6, 6.6~6.8, and 6.8~7 in turn. Under different pH and HCO3− concentration conditions, the variation in uranium concentration over time (Table A1) is shown in Figure 6.
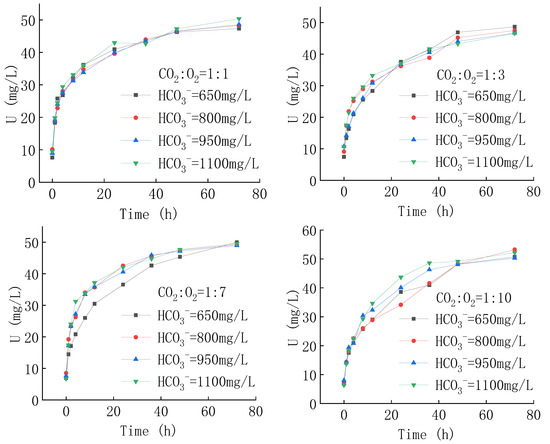
Figure 6.
Breakthrough curve of U concentration.
Under the same HCO3− concentration, the uranium concentration increased with increasing pH; Under the same pH condition, the uranium concentration increased significantly with increasing HCO3− concentration. However, when the HCO3− concentration was greater than 800 mg/L, the uranium concentration did not increase, but decreased.
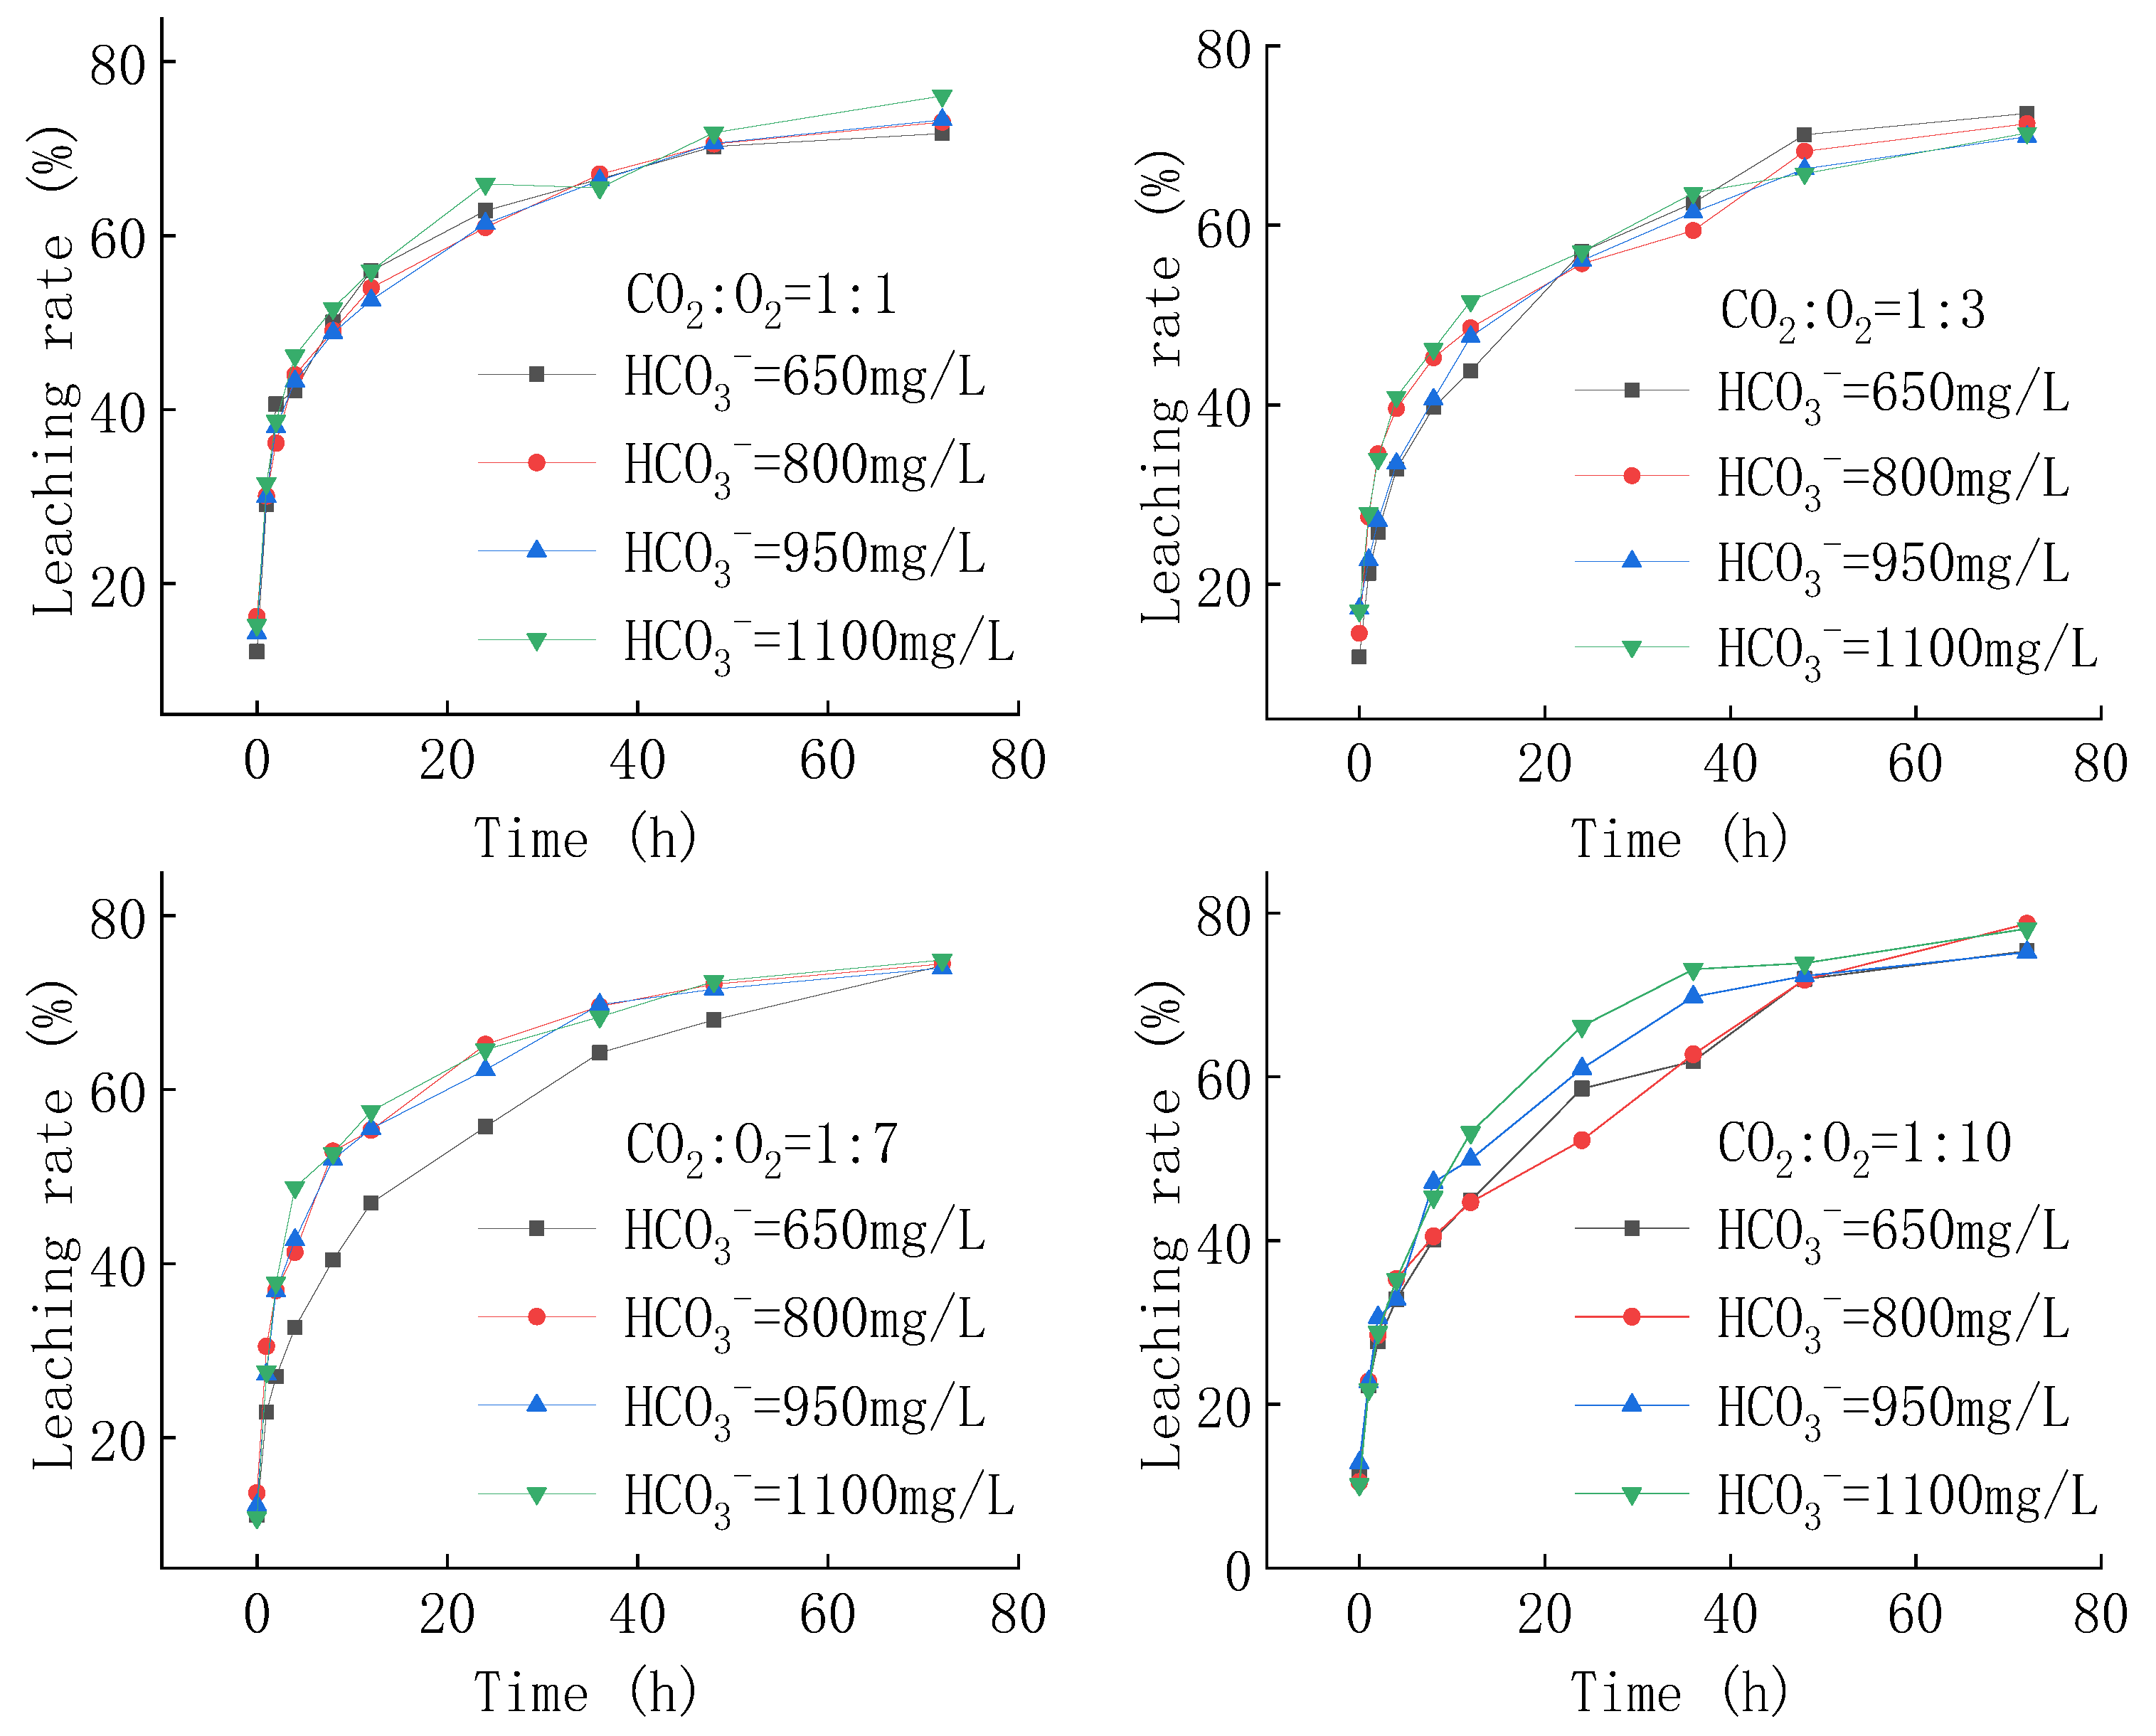
The U leaching rate (Table A2)was calculated according to the U concentration in the solution. The results are shown in Figure 7.
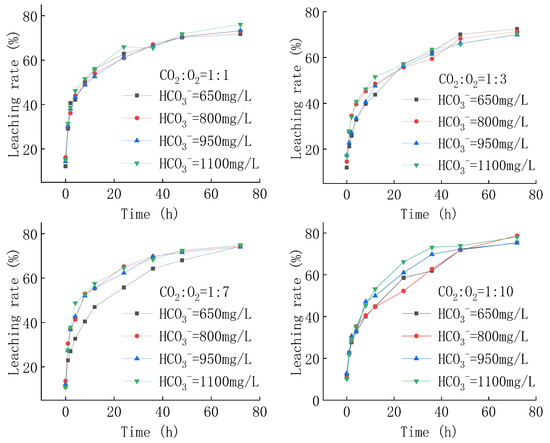
Figure 7.
Breakthrough curve of U leaching rate.
Figure 6 shows that the leaching rate in the uranium leaching condition test was between 69% and 79%. Under the same HCO3− concentration, the U leaching rate decreased with the increase in pH; Under the same pH value, the uranium leaching rate reached the highest value when the concentration of HCO3− was 800 mg/L. The continuous increase in HCO3− concentration did not cause the continuous increase in uranium leaching rate.
The uranium concentration increased rapidly within the 8 h before the test. At this stage, U (VI) leaching in ore and U (IV) oxidation leaching on the ore surface were dominated by O2, and U concentration increased rapidly. After the activation and dissolution of uranium resources on the surface, uranium ores and titanium-bearing uranium ores mixed in quartz could not be effectively contacted with the leaching solution for activation and recovery, and the leaching rate would not continue to increase [28,29].
4.2.2. Relationship between pH and HCO3−
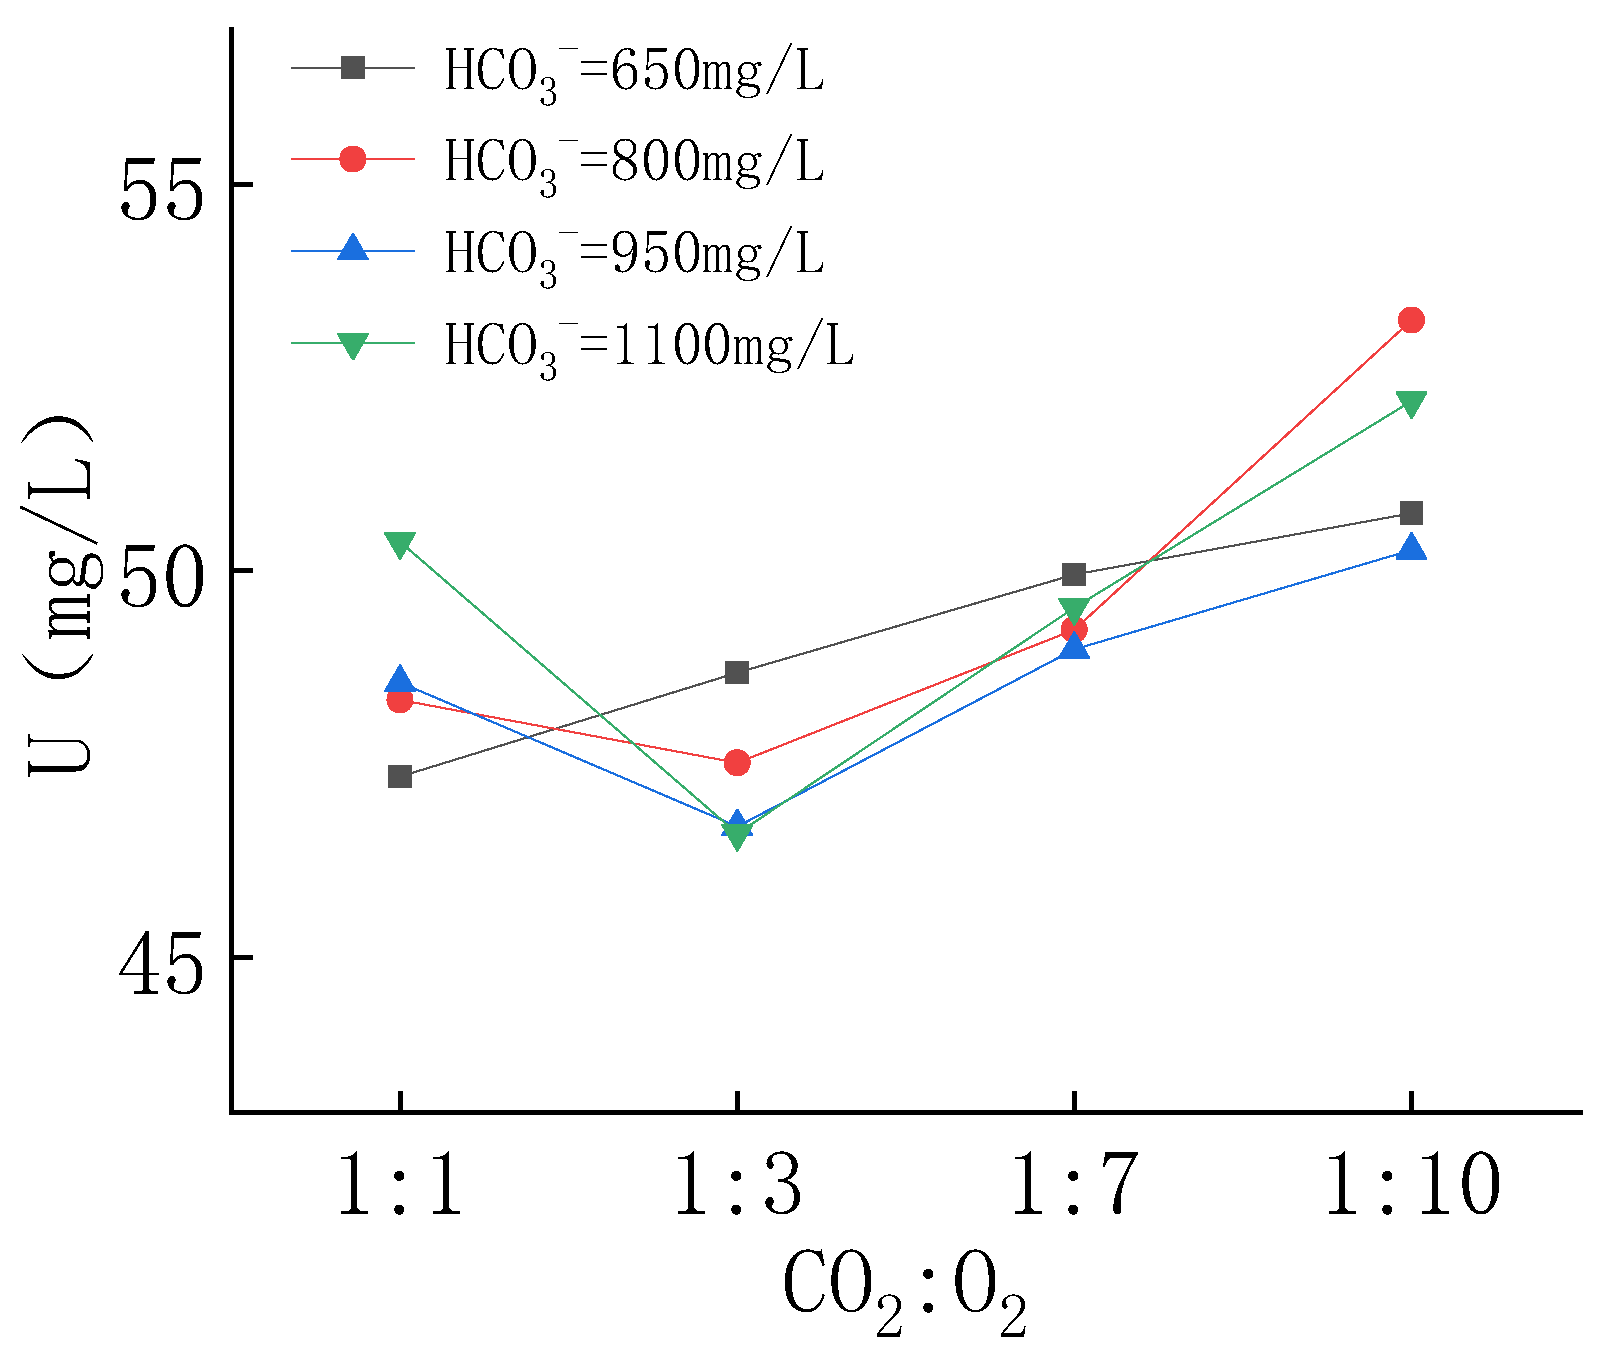
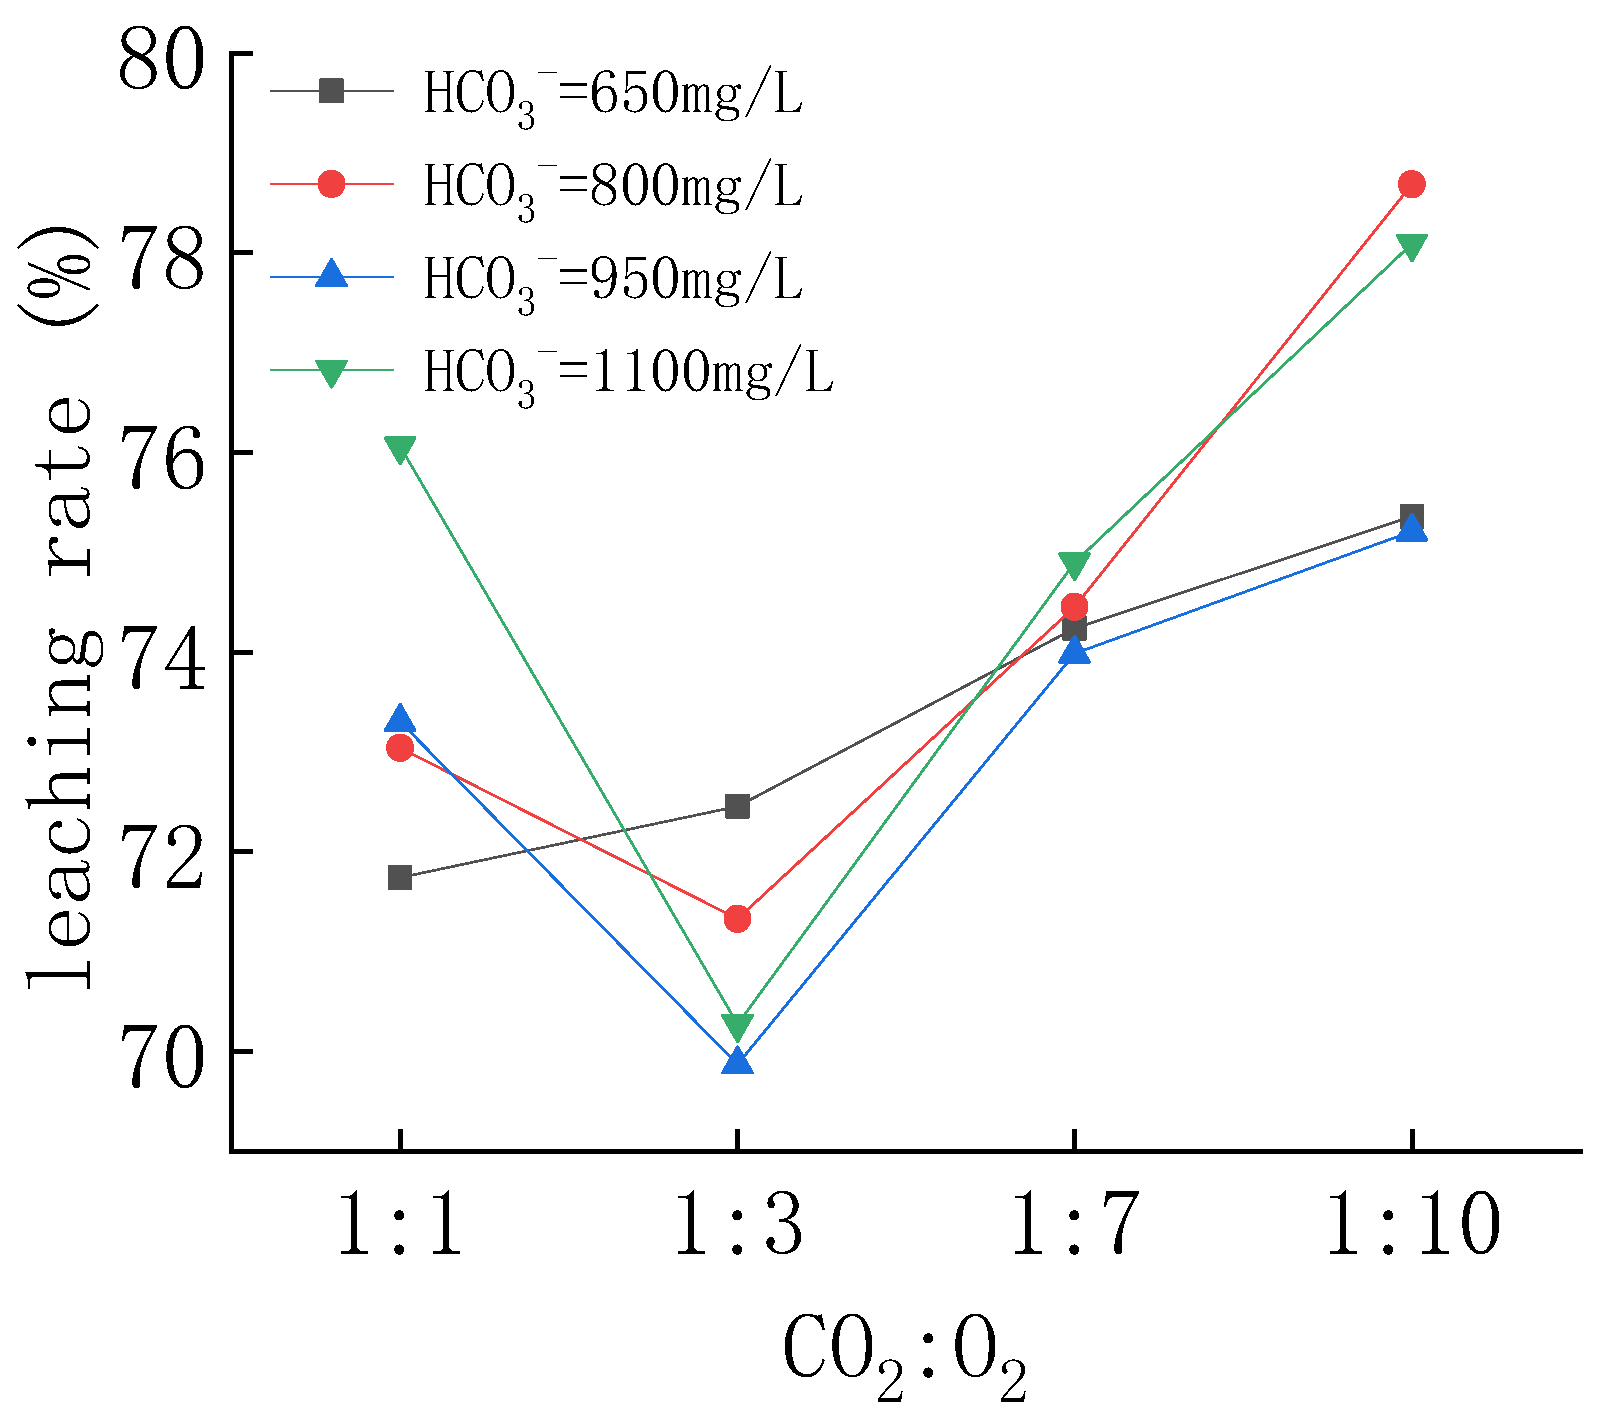
The pH and HCO3− concentration had a great influence on the uranium concentration and leaching rate, as shown in Figure 8 and Figure 9. Under stable conditions, when the pH value was 6.8~7 and HCO3− concentration was 800 mg/L, the growth rate of uranium concentration followed a logarithmic expression: C(U) = −0.59 × exp(−t/24.02) + 0.79. U concentration reached the maximum value of 53.2 mg/L, and the uranium leaching rate reached the maximum value of 78.2%, followed by 1100, 650, and 950 mg/L.
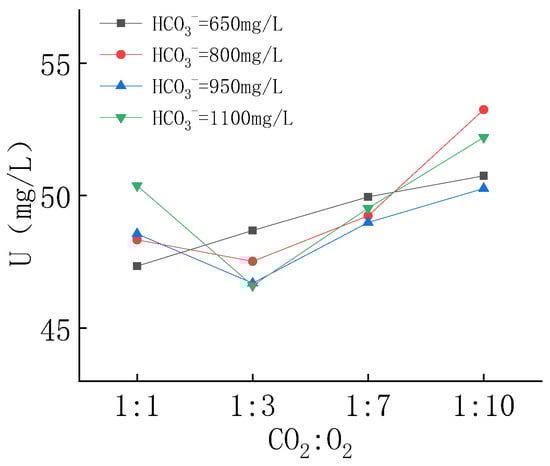
Figure 8.
U concentration under different conditions.
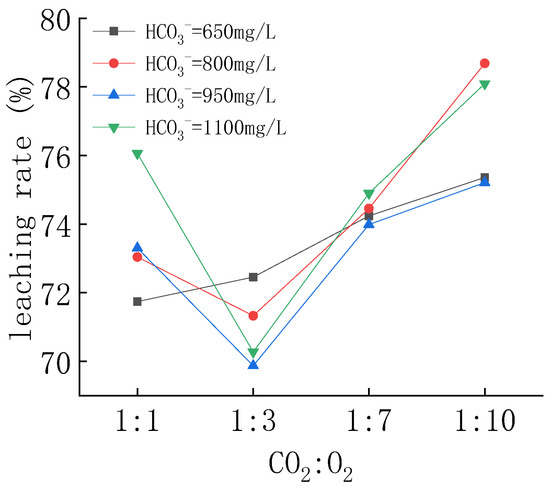
Figure 9.
U leaching rate under different conditions.
In the neutral leaching process, HCO3− and UO22+ generated UO2CO3, UO2(CO3)22− or UO2(CO3)34−. Of these, UO2CO3 was unstable, and the increase in CO32− concentration was conducive to the stable migration of uranyl ions. The increase in HCO3− concentration could promote ionization to produce CO32−, and improve the activity of CO32−. The change in pH affected the evolution of H2CO3, HCO3−, and CO32−. When pH > 6, the increase in pH promoted HCO3− ionization to generate CO32−, and the proportion of CO32− in the total carbon increased. Increasing the pH and HCO3− concentration was conducive to increasing the uranium leaching concentration and leaching rate [30]. PHREEQCI calculation results show that UO2(CO3)34− accounted for more than 99.99% of all U forms in the solution, followed by UO2(CO3)22−, accounting for less than 0.07%.
4.2.3. Precipitation in U Leaching
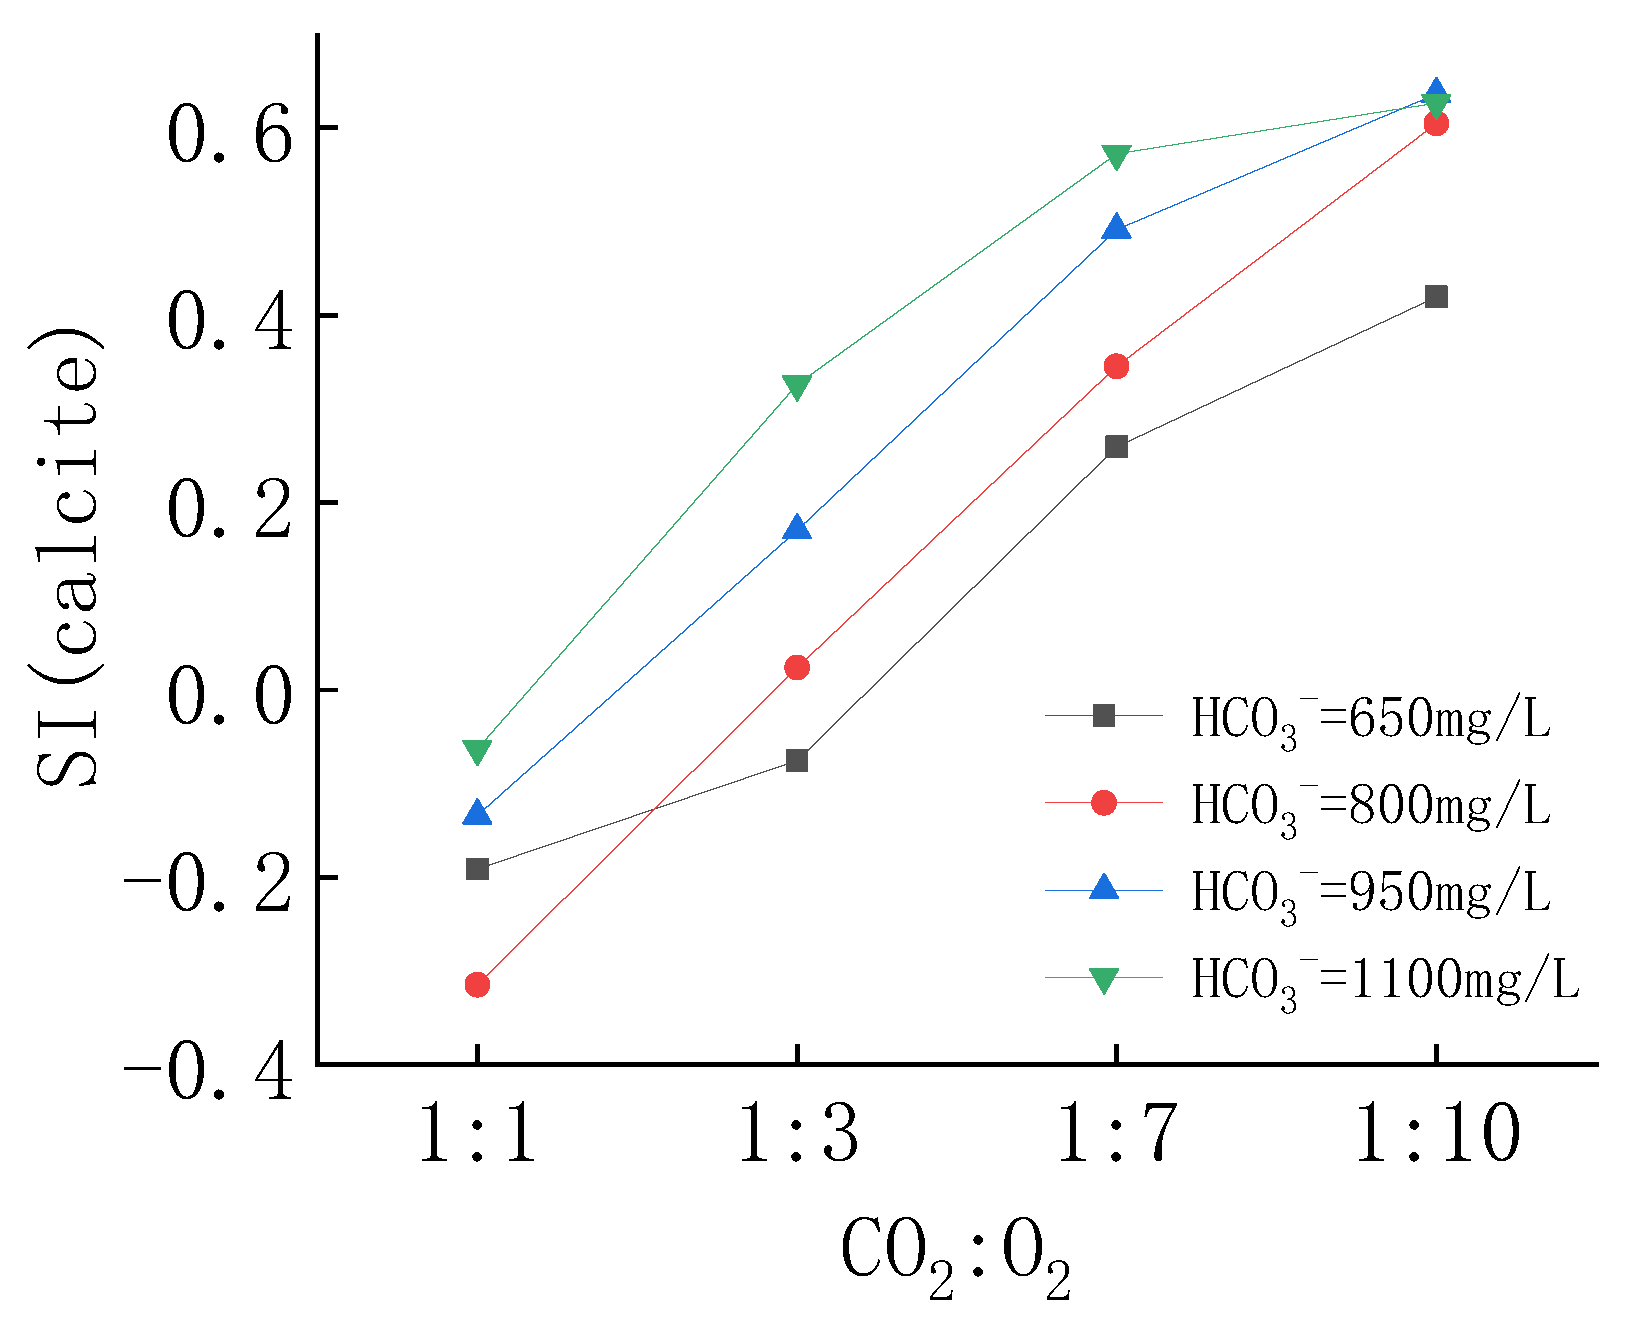
A high pH value would cause calcium precipitation. PHREEQCI was used to calculate the saturation index of CaCO3 (Table A3) and CaSO4 (Table A4) in the solution under different stable conditions, as shown in Figure 10 and Figure 11.
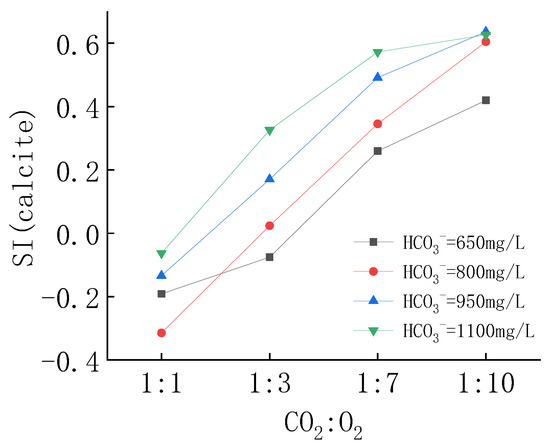
Figure 10.
SI (calcite) under different conditions.
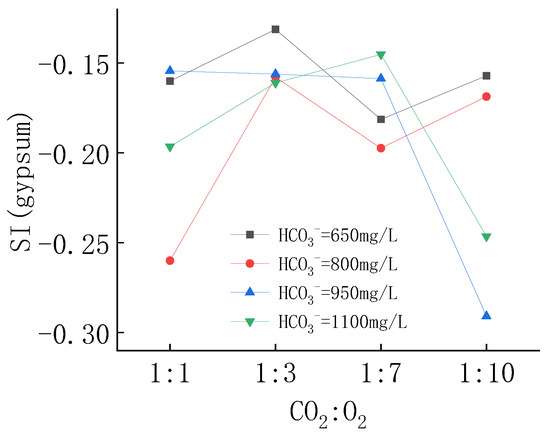
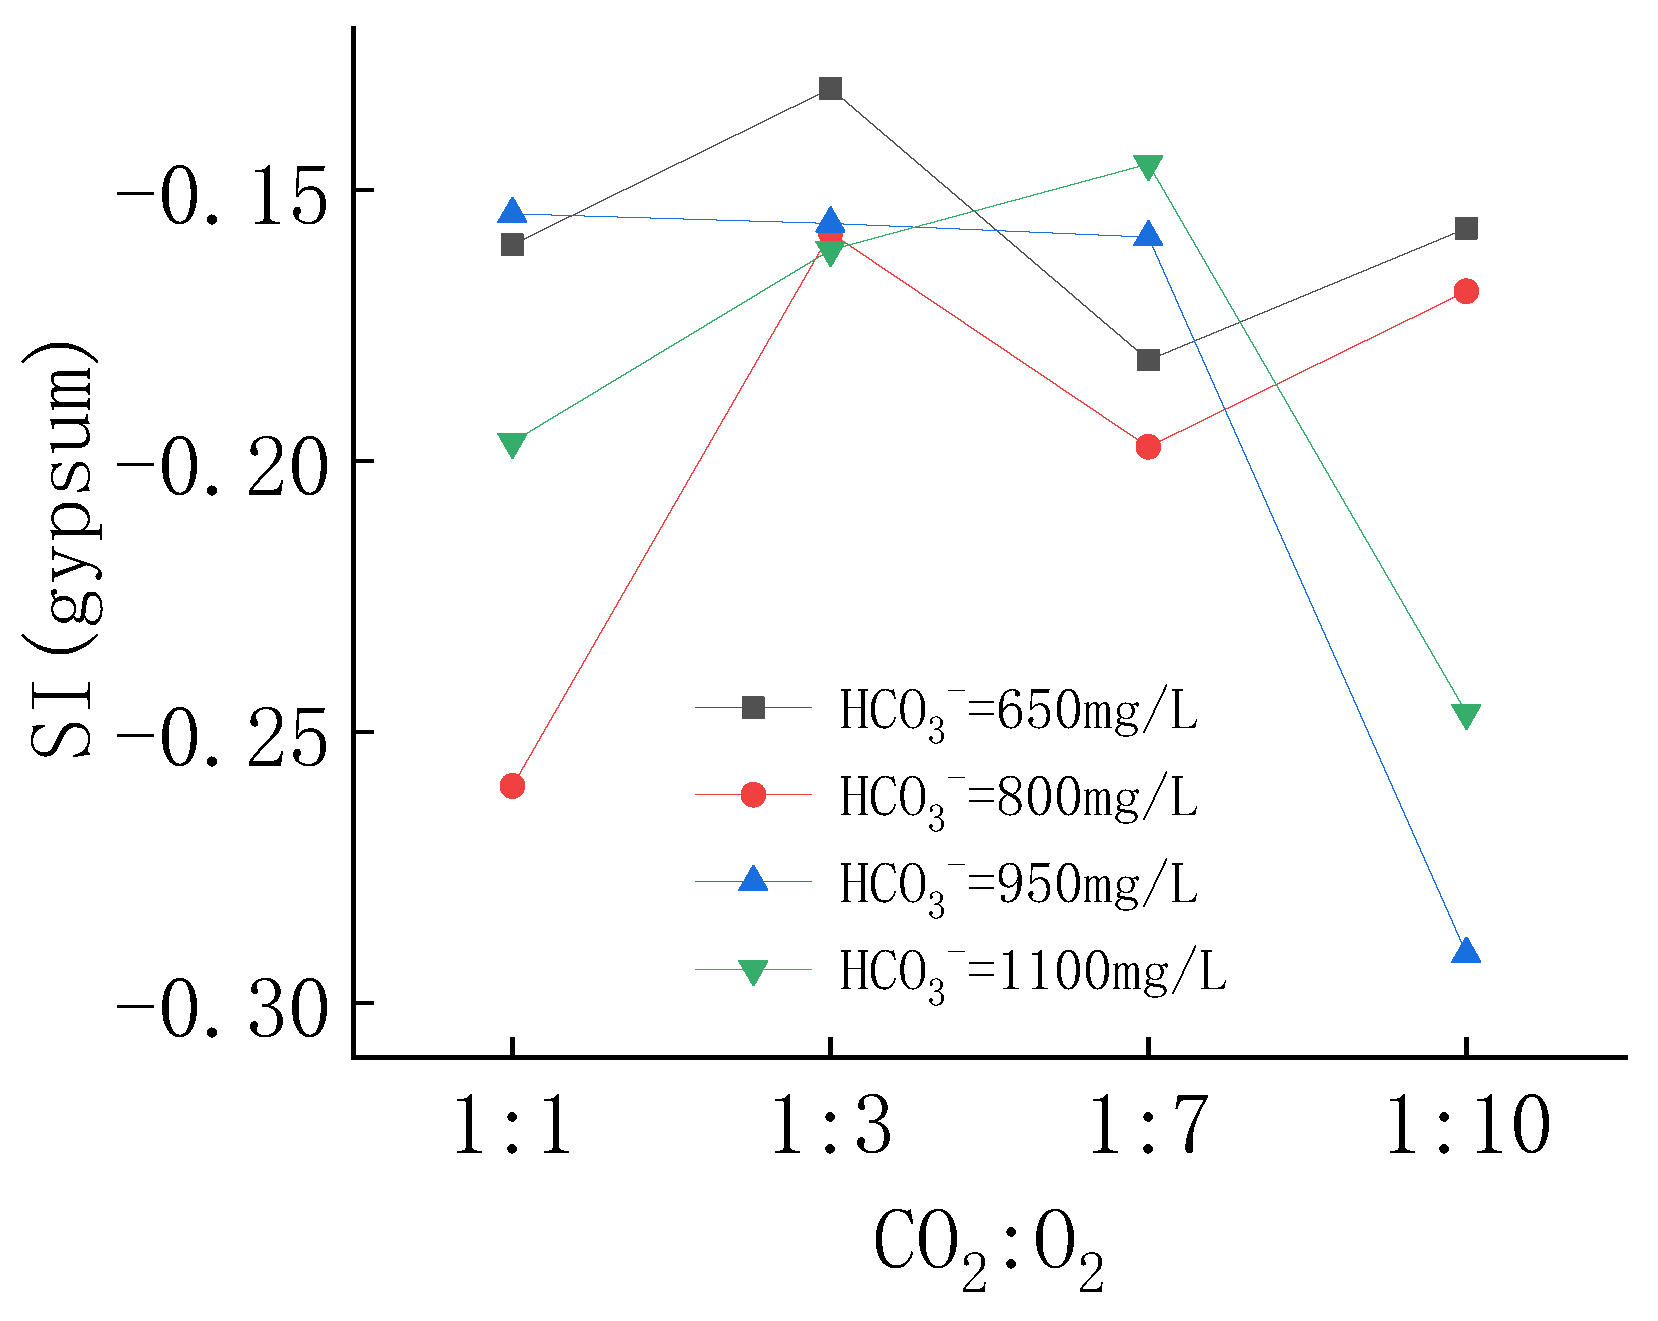
Figure 11.
SI (gypsum) under different conditions.
The results show that SI (calcite) was between −0.4 and 0.6, and SI (gypsum) was between −0.3 and −0.1. SI (calcite) was closely related to pH and HCO3− concentration. Under the same HCO3− conditions, SI (calcite) increased with increasing pH; Under the same pH condition, the increase in HCO3− concentration caused the increase in SI (calcite); When the pH value was greater than 6.4 and the HCO3− concentration was greater than 800 mg/L, SI (calcite) started to be greater than 0, indicating that CaCO3 started to precipitate. SI (gypsum) was less than 0 under all conditions, indicating that CaSO4 precipitation did not occur in the solution. CaCO3 precipitation attached to the mineral surface would reduce the uranium leaching efficiency.
5. Discussion
Chen [31] and Cheng [32] conducted experiments on a sandstone-type uranium deposit in Inner Mongolia, and the results showed that a good uranium leaching effect can be achieved when the concentration of HCO3− is 800 mg/L. Xu [10] and Zhang [33] conducted leaching performance tests on ores from a certain uranium mine in Xinjiang, and also achieved good uranium leaching results at a HCO3− concentration of 800 mg/L. Asghar [28] conducted a neutral leaching test on the ore of the Xinjiang Mengqiguer uranium mine and obtained the same conclusion. When the HCO3− concentration was higher than 800 mg/L, the uranium concentration did not increase significantly, and the economic benefits decreased. Moreover, the higher the HCO3− concentration, the greater risk of calcite precipitation [34,35]. This experiment was carried out on the Shihongtan uranium mine, and the obtained process parameters were consistent with previous research conclusions.
In the process of the in situ leaching of uranium, uranium leaching involved the phase transition process of solid-phase dissolution into the liquid phase and the process of continued migration in the liquid phase. The phase transition process of uranium included the dissolution of uranium minerals and liquid-phase saturation precipitation, as well as the adsorption desorption of adsorbed uranium. In the liquid phase, convection was the main solute transport, and molecular diffusion could be ignored. However, for ore leaching in dead-end pores and microbial leaching processes, molecular diffusion played a major role [36]. Zhou [29] divided uranium leaching into four stages according to the uranium resources leached from different parts and migration: (1) dissolution of hexavalent uranium in open pores and desorption of adsorbed uranium, (2) oxidation and dissolution of tetravalent uranium in open pores, (3) dissolution and dispersion of uranium ore in micropores, and (4) normal dissolution and migration of uranium resources. In the first stage, due to the mobility of uranium resources, uranium concentration peaks would be formed, while in the second stage, this would be due to the concentration of leaching agent. The third stage required the dissolution of the leaching solution to expand the cracks, and the increase in the concentration of the leaching agent in the fourth stage would not significantly improve the migration and leaching of uranium. CO2 reacted with water to generate carbonic acid, which was less aggressive and could not effectively open rock fractures. Uranium minerals mixed in the rock could not be effectively leached.
6. Result
The uranium resources in the western section of the south ore belt of the Shihongtan deposit were mainly pitchblende, uranium ore, and ilmenite. A considerable proportion of uranium minerals were wrapped by quartz and other minerals, meaning they cannot effectively contact with the solution and are not easily recovered. Moreover, the feldspar in the ore was obviously clayed, and the calcium carbonate content was high, which easily caused the blockage of the pore throat of the in situ leaching flow field. In addition, reducing coal or carbon was developed in the ore bed, which required enough oxidants to activate uranium resources.
The pH and HCO3− concentration affected CO32− activity in the solution, and the precipitation of calcium had a greater impact on U concentration and the leaching rate. Considering the stable and efficient uranium leaching efficiency and low-risk calcium precipitation, the optimum HCO3− concentration of the leaching solution was 800 mg/L and the pH value was controlled below 6.6 to maintain a high uranium leaching efficiency.
Author Contributions
X.Y., Data analysis, Formal analysis, Writing—original draft; J.L., Writing—editing and review, Resources; L.X., Funding acquisition, Writing—editing and review; Y.Z., Writing—editing and review, Resources; K.Z., Data curation, Formal analysis (mineral analysis part); M.H., Data curation, Formal analysis (solution analysis part). All authors have read and agreed to the published version of the manuscript.
Funding
National Natural Science Foundation of China (No. U1967209 and No. 42072285).
Data Availability Statement
The data presented in this study are available in Appendix A.
Conflicts of Interest
The authors declare no conflict of interest.
Appendix A
Table A1.
U concentration.
Table A1.
U concentration.
| t | CO2:O2 = 1:1 | CO2:O2 = 1:3 | CO2:O2 = 1:7 | CO2:O2 = 1:10 | ||||||||||||
|---|---|---|---|---|---|---|---|---|---|---|---|---|---|---|---|---|
| 650 | 800 | 900 | 1100 | 650 | 800 | 900 | 1100 | 650 | 800 | 900 | 1100 | 650 | 800 | 900 | 1100 | |
| 0 | 7.60458 | 10.11685 | 8.93803 | 9.5217 | 7.44197 | 9.08301 | 10.78159 | 10.64274 | 6.93894 | 8.52062 | 7.63175 | 6.73 | 6.967 | 6.56187 | 8.01769 | 6.37418 |
| 1 | 18.34184 | 18.90831 | 18.89222 | 19.84814 | 13.3461 | 17.29962 | 14.23818 | 17.54023 | 14.43997 | 19.21386 | 17.18365 | 17.38936 | 14.055 | 14.35018 | 14.29984 | 13.75811 |
| 2 | 25.79157 | 22.84245 | 24.04522 | 24.47714 | 16.30054 | 21.85135 | 17.0571 | 21.45476 | 17.08004 | 23.35944 | 23.35491 | 24.0103 | 17.523 | 18.02553 | 19.39315 | 18.26911 |
| 4 | 26.82705 | 28.01986 | 27.54211 | 29.42099 | 20.92645 | 25.16433 | 21.25599 | 26.00173 | 20.79791 | 26.25737 | 27.25434 | 31.21216 | 20.899 | 22.53461 | 20.84075 | 22.52334 |
| 8 | 32.09153 | 31.42265 | 31.25668 | 33.08043 | 25.57186 | 28.96378 | 26.06878 | 29.58387 | 26.00566 | 34.04085 | 33.45517 | 33.85589 | 25.784 | 26.03549 | 30.4218 | 29.2562 |
| 12 | 36.12264 | 34.77399 | 33.82721 | 36.0198 | 28.32943 | 31.24583 | 30.81595 | 33.23257 | 30.46729 | 35.7006 | 35.85647 | 37.16542 | 29.0455 | 28.8646 | 32.3488 | 34.63547 |
| 24 | 40.93494 | 39.61399 | 39.94124 | 42.96927 | 37.56604 | 36.21887 | 36.73767 | 37.06246 | 36.57258 | 42.55012 | 40.57395 | 42.07826 | 38.573 | 34.14263 | 40.0642 | 43.68072 |
| 36 | 43.52884 | 43.94837 | 43.4745 | 42.65271 | 41.42968 | 38.84805 | 40.54568 | 41.696 | 42.61494 | 45.66048 | 45.89132 | 44.75 | 40.951 | 41.60074 | 46.28897 | 48.614 |
| 48 | 46.23752 | 46.4745 | 46.5575 | 47.2405 | 46.9305 | 45.239 | 44.043 | 43.2655 | 45.35863 | 47.50854 | 47.17843 | 47.70715 | 48.216 | 48.197 | 48.13631 | 49.149 |
| 72 | 47.3419 | 48.33115 | 48.557 | 50.375 | 48.6845 | 47.521 | 46.6975 | 46.6055 | 49.95361 | 49.23819 | 48.98395 | 49.52528 | 50.745 | 53.2415 | 50.27 | 52.194 |
Table A2.
U leaching rate.
Table A2.
U leaching rate.
| t | CO2:O2 = 1:1 | CO2:O2 = 1:3 | CO2:O2 = 1:7 | CO2:O2 = 1:10 | ||||||||||||
|---|---|---|---|---|---|---|---|---|---|---|---|---|---|---|---|---|
| 650 | 800 | 900 | 1100 | 650 | 800 | 900 | 1100 | 650 | 800 | 900 | 1100 | 650 | 800 | 900 | 1100 | |
| 0 | 0.12187 | 0.16213 | 0.14324 | 0.15259 | 0.11926 | 0.14556 | 0.17278 | 0.17056 | 0.1112 | 0.13655 | 0.1223 | 0.10785 | 0.11165 | 0.10516 | 0.12849 | 0.12187 |
| 1 | 0.29096 | 0.30058 | 0.29999 | 0.31521 | 0.21224 | 0.27496 | 0.22722 | 0.27918 | 0.22933 | 0.30494 | 0.27273 | 0.27571 | 0.22327 | 0.22781 | 0.22742 | 0.29096 |
| 2 | 0.40621 | 0.36144 | 0.37971 | 0.38682 | 0.25795 | 0.34537 | 0.27082 | 0.33974 | 0.27017 | 0.36908 | 0.3682 | 0.37814 | 0.27692 | 0.28467 | 0.30621 | 0.40621 |
| 4 | 0.42194 | 0.44009 | 0.43284 | 0.46193 | 0.32822 | 0.3957 | 0.33462 | 0.40881 | 0.32665 | 0.4131 | 0.42744 | 0.48755 | 0.32821 | 0.35317 | 0.32821 | 0.42194 |
| 8 | 0.50045 | 0.49085 | 0.48824 | 0.51651 | 0.39751 | 0.45237 | 0.4064 | 0.46224 | 0.40432 | 0.52919 | 0.51992 | 0.52698 | 0.40107 | 0.40538 | 0.4711 | 0.50045 |
| 12 | 0.55946 | 0.5399 | 0.52586 | 0.55953 | 0.43787 | 0.48577 | 0.47588 | 0.51565 | 0.46963 | 0.55348 | 0.55507 | 0.57542 | 0.44881 | 0.44679 | 0.49931 | 0.55946 |
| 24 | 0.62856 | 0.6094 | 0.61365 | 0.65932 | 0.5705 | 0.55718 | 0.56091 | 0.57064 | 0.55729 | 0.65184 | 0.6228 | 0.64597 | 0.58561 | 0.52258 | 0.61009 | 0.62856 |
| 36 | 0.66508 | 0.67043 | 0.66341 | 0.65486 | 0.6249 | 0.5942 | 0.61453 | 0.63588 | 0.64238 | 0.69563 | 0.69768 | 0.68359 | 0.6191 | 0.6276 | 0.69774 | 0.66508 |
| 48 | 0.70247 | 0.7053 | 0.70596 | 0.71819 | 0.70083 | 0.68242 | 0.66281 | 0.65755 | 0.68025 | 0.72114 | 0.71545 | 0.72441 | 0.71938 | 0.71865 | 0.72324 | 0.70247 |
| 72 | 0.71741 | 0.73041 | 0.73301 | 0.76058 | 0.72456 | 0.71328 | 0.69871 | 0.70272 | 0.7424 | 0.74454 | 0.73987 | 0.749 | 0.75358 | 0.78688 | 0.7521 | 0.71741 |
Table A3.
SI (Calcite).
Table A3.
SI (Calcite).
| t | CO2:O2 = 1:1 | CO2:O2 = 1:3 | CO2:O2 = 1:7 | CO2:O2 = 1:10 | ||||||||||||
|---|---|---|---|---|---|---|---|---|---|---|---|---|---|---|---|---|
| 650 | 800 | 900 | 1100 | 650 | 800 | 900 | 1100 | 650 | 800 | 900 | 1100 | 650 | 800 | 900 | 1100 | |
| 0 | −0.481 | −0.4189 | −0.2072 | −0.2042 | −0.0229 | −0.0369 | 0.165 | 0.2484 | 0.1671 | 0.2438 | 0.3622 | 0.4832 | 0.4482 | 0.5511 | 0.5497 | 0.5713 |
| 1 | −0.4409 | −0.4215 | −0.1708 | −0.1611 | −0.0634 | −0.0446 | 0.2241 | 0.3131 | 0.292 | 0.3617 | 0.4353 | 0.4926 | 0.4804 | 0.6303 | 0.5835 | 0.6578 |
| 2 | −0.4284 | −0.3973 | −0.1539 | −0.1934 | −0.0462 | −0.0301 | 0.2513 | 0.3262 | 0.2576 | 0.3786 | 0.4643 | 0.5023 | 0.4616 | 0.6427 | 0.6275 | 0.6539 |
| 4 | −0.3781 | −0.4497 | −0.1607 | −0.101 | −0.0171 | −0.0221 | 0.1862 | 0.3163 | 0.289 | 0.3688 | 0.4478 | 0.5256 | 0.4279 | 0.631 | 0.5666 | 0.6658 |
| 8 | −0.3354 | −0.4229 | −0.1776 | −0.1331 | −0.1372 | 0.0073 | 0.0959 | 0.2382 | 0.2708 | 0.4027 | 0.4485 | 0.5267 | 0.4182 | 0.6486 | 0.498 | 0.652 |
| 12 | −0.298 | −0.3906 | −0.1655 | −0.1415 | −0.2494 | 0.0287 | 0.1347 | 0.2413 | 0.2454 | 0.3092 | 0.4919 | 0.5412 | 0.4072 | 0.6628 | 0.5642 | 0.6772 |
| 24 | −0.327 | −0.3423 | −0.1661 | −0.0173 | −0.2116 | 0.0392 | 0.0686 | 0.2127 | 0.1984 | 0.3617 | 0.4453 | 0.5215 | 0.4284 | 0.5727 | 0.5487 | 0.6004 |
| 36 | −0.2973 | −0.3214 | −0.1366 | −0.1177 | −0.165 | −0.0062 | 0.1128 | 0.275 | 0.3011 | 0.3071 | 0.4502 | 0.5623 | 0.3965 | 0.6036 | 0.6016 | 0.6781 |
| 48 | −0.2906 | −0.3249 | −0.1733 | −0.1034 | −0.1028 | −0.0073 | 0.1019 | 0.2694 | 0.2372 | 0.339 | 0.4595 | 0.5573 | 0.4167 | 0.5331 | 0.5474 | 0.6426 |
| 72 | −0.1911 | −0.3148 | −0.1338 | −0.063 | −0.0755 | 0.0238 | 0.1705 | 0.3263 | 0.2595 | 0.3456 | 0.4915 | 0.5723 | 0.4194 | 0.6047 | 0.6361 | 0.6265 |
Table A4.
SI (Gypsum).
Table A4.
SI (Gypsum).
| t | CO2:O2 = 1:1 | CO2:O2 = 1:3 | CO2:O2 = 1:7 | CO2:O2 = 1:10 | ||||||||||||
|---|---|---|---|---|---|---|---|---|---|---|---|---|---|---|---|---|
| 650 | 800 | 900 | 1100 | 650 | 800 | 900 | 1100 | 650 | 800 | 900 | 1100 | 650 | 800 | 900 | 1100 | |
| 0 | −0.1974 | −0.2548 | −0.1751 | −0.2517 | −0.2069 | −0.2137 | −0.1705 | −0.1698 | −0.2518 | −0.242 | −0.2061 | −0.1924 | −0.2067 | −0.1907 | −0.3127 | −0.3307 |
| 1 | −0.2016 | −0.2595 | −0.1688 | −0.2489 | −0.2093 | −0.2042 | −0.1685 | −0.1703 | −0.2177 | −0.2467 | −0.2019 | −0.1876 | −0.2012 | −0.1806 | −0.3065 | −0.2838 |
| 2 | −0.2123 | −0.2536 | −0.1636 | −0.2987 | −0.1998 | −0.2132 | −0.1689 | −0.1687 | −0.2224 | −0.2381 | −0.1877 | −0.1732 | −0.2102 | −0.1776 | −0.2803 | −0.2978 |
| 4 | −0.1917 | −0.2537 | −0.1707 | −0.2302 | −0.1979 | −0.2102 | −0.1681 | −0.1691 | −0.2118 | −0.2453 | −0.2049 | −0.1793 | −0.1946 | −0.1758 | −0.3032 | −0.2688 |
| 8 | −0.1966 | −0.269 | −0.1712 | −0.28 | −0.1873 | −0.2133 | −0.1973 | −0.2196 | −0.2167 | −0.2205 | −0.2011 | −0.1782 | −0.1968 | −0.176 | −0.298 | −0.2833 |
| 12 | −0.2056 | −0.2686 | −0.1673 | −0.2748 | −0.1862 | −0.2077 | −0.1693 | −0.2321 | −0.2082 | −0.2451 | −0.1812 | −0.1626 | −0.208 | −0.1817 | −0.2852 | −0.2729 |
| 24 | −0.2087 | −0.2682 | −0.1561 | −0.1713 | −0.1936 | −0.1898 | −0.1836 | −0.2421 | −0.1985 | −0.2204 | −0.1752 | −0.1573 | −0.1513 | −0.1779 | −0.2955 | −0.2918 |
| 36 | −0.1995 | −0.2529 | −0.1526 | −0.2639 | −0.1644 | −0.1833 | −0.167 | −0.1724 | −0.2067 | −0.2256 | −0.1693 | −0.1523 | −0.1844 | −0.1687 | −0.2866 | −0.2769 |
| 48 | −0.1994 | −0.2508 | −0.1866 | −0.2749 | −0.1439 | −0.1669 | −0.1567 | −0.181 | −0.1868 | −0.2255 | −0.1609 | −0.1482 | −0.1637 | −0.1857 | −0.2908 | −0.2566 |
| 72 | −0.1601 | −0.26 | −0.1544 | −0.1965 | −0.1313 | −0.1579 | −0.1562 | −0.1611 | −0.1814 | −0.1974 | −0.1587 | −0.1452 | −0.1571 | −0.1687 | −0.2909 | −0.2465 |
References
- Asghar, F.; Sun, Z.; Chen, G.; Zhou, Y.; Li, G.; Liu, H.; Zhao, K. Geochemical characteristics and uranium neutral leaching through a CO2 + O2 system—An example from Uranium Ore of the ELZPA Ore Deposit in Pakistan. Metals 2020, 10, 1616. [Google Scholar] [CrossRef]
- Asghar, F.; Zhou, Y.; Sun, Z.; Li, G.; Xu, L.; Zhao, K. CO2 + O2 neutral leaching experiment of uranium ore from Mengqiguer deposit in Xinjiang. Nonferrous Met. Extr. Metall. 2021, 8, 46–55. [Google Scholar]
- Cao, L.; Qiao, H.; Zhou, W.; Wu, Z. Analysis on affecting factors of metallogenic difference in the southern ore belt of Shihongtan uranium deposit. World Nucl. Geosci. 2018, 35, 77–83. [Google Scholar]
- Chen, J.; Zhu, P.; Xu, Q.; Wei, X.; Liu, W. Laboratory test of neutral leaching of a uranium ore in Inner Mongolia. Uranium Min. Metall. 2013, 32, 72–75+86. [Google Scholar]
- Cheng, W.; Miao, A.; Li, J.; Zhou, L.; Chang, J. Analysis of leachability for a sandstone uranium deposit with high acid consumption and sensitivities in inner Mongolia. Prog. Rep. China Nucl. Sci. Technol. 2013, 3, 156–162. [Google Scholar]
- Du, Z.; Niu, X.; Su, X.; Guo, Z.; Cheng, Z.; Shen, H.; Zhang, W. CO2 + O2 in-situ leaching test of one uranium deposit in inner Mongolia. Uranium Min. Metall. 2013, 32, 1–4. [Google Scholar]
- Gao, B.; Du, Y.; Sun, Z. Analyzed the conditions of leaching uranium ins south area of Shihongtan uranium deposit. China Min. Mag. 2013, 22, 89–92. [Google Scholar]
- He, X.; Chen, L.; Xie, X.; Xiao, B.; Long, H.; Wen, C. Analysis of blockage formation reason during the acid in-situ leaching and chemical deblocking of 512 deposit. In Progress Report on China Nuclear Science & Technology, Proceedings of 2019 Academic Annual Meeting of Chinese Nuclear Society Volume 2 (Uranium Geology Volume 2), Baotou, China, 20–23 August 2019; China Atomic Energy Press: Beijing, China, 2019; pp. 346–352. [Google Scholar]
- Hu, P.; Li, X.; Chen, G.; Ren, J. Present situation and development of ISL radiation protection and regulation in China. Uranium Min. Metall. 2019, 38, 70–74. [Google Scholar]
- Ji, H.; Zhou, Y.; Sun, Z.; Yang, Y. Analysis of and discussion on CO2 + O2 in-situ leaching of uranium process at Mengqiguer deposit. Nonferrous Met. Extr. Metall. 2018, 3, 55–59. [Google Scholar]
- Jin, G.; Wu, Q.; Wang, T. Sedimentary system of the Second lithologic member of Xishanyao formation and its control on Uranium mineralization in the north belt of Shihongtan Uranium deposit, Turpan-Hami basin. Uranium Geol. 2021, 37, 1001–1012. [Google Scholar]
- Grancea, L.; Mihalasky, M.J.; Fairclough, M. Uranium Resources 2020, Production and Demand; International Atomic Energy Agency: Vienna, Austria, 2020. [Google Scholar]
- Li, J. Application of Artificial intelligence neural networks in lithology identification and porosity and permeability prediction-An example from Shihongtan uranium deposit. Northwestern Geol. 2010, 43, 6–7+32–37. [Google Scholar]
- Li, Y.; Pan, S.; Ning, S.; Shao, L.; Jing, Z.; Wang, Z. Coal measure metallogeny: Metallogenic system and implication for resource and environment. Sci. China Earth Sci. 2022, 65, 1211–1228. [Google Scholar]
- Liu, J.; Sun, Z.; Zhou, Y.; Li, X.; Shi, W. Hydrogeochemical conditions of in-situ leaching uranium exploration for Shihongtan deposit. Met. Mine 2010, 405, 77–79. [Google Scholar]
- Liu, S.; Liu, J.; Zhou, Y.; Yang, Y.; Wang, R.; Shi, W.; Liao, S. Study on characteristics of ore-containing layer blockage during in-situ leaching of uranium mining. Nonferrous Met. Extr. Metall. 2022, 8, 65–75. [Google Scholar]
- Liu, Z.; Yang, B.; Zhao, X.; Wang, T. Mineral ingredient and geochemical characteristics of uranium mineralization at Shihongtan uranium deposit, Turpan-Hami basin. Xinjiang Geol. 2018, 36, 257–261. [Google Scholar]
- Niu, Q.; Cao, L.; Sang, S.; Wang, W.; Yuan, W.; Chang, J.F.; Jia, X.; Zheng, W.; Zhang, Z.X. A small-scale experimental study of CO2 enhanced injectivity methods of the high-rank coal. Pet. Sci. 2021, 18, 1427–1440. [Google Scholar]
- Su, X.; Li, X.; Liu, N.; Wang, J.; Zhang, L. Application of the Environment Friendly Technology of In-Situ Leaching of Uranium. China Min. Mag. 2016, 25, 97–100. [Google Scholar]
- Sun, Z.; Asghar, F.; Zhao, K.; Zhou, Y.; Li, G.; Xu, L. Review and prospect of uranium mining and metallurgy in China. Nonferrous Met. Extr. Metall. 2021, 8, 1–8. [Google Scholar]
- Tan, X. Brief analysis of China’s nuclear energy development status and prospects. China Plant Eng. 2021, 483, 235–236. [Google Scholar]
- Wang, G.; Zhang, F.; He, D.; Li, J. Analysis of in-situ leaching feasibility in northern belt of Shihongtan uranium deposits in Xinjiang Turpan. J. East China Inst. Technol. Nat. Sci. Ed. 2015, 38, 58–63. [Google Scholar]
- Wu, Q.; Jin, G.; Yang, B.; Cao, L. Characteristics of clay minerals in the northern ore-belt sandstone of Shihongtan uranium deposit and its relation with uranium mineralization. Coal Geol. China 2021, 33, 55–61. [Google Scholar]
- Xu, L.; Yang, H.; Zhou, Y.; Li, G.; Sun, Z.; Shi, W.; Zhou, Z. Neutral leaching of uranium ore from a sandstone-type deposit. Nonferrous Met. Extr. Metall. 2020, 3, 38–44. [Google Scholar]
- Yan, J.; Zhang, B.; Liu, J.; Cao, J. Study on leaching effect of in-situ leaching uranium mine by CO2 + O2. Uranium Min. Metall. 2020, 39, 185–190. [Google Scholar]
- Yang, B.; Qiao, H.; Liu, Z.; Wu, Q. Calcareous sandstone distribution features and its impact on in-situ leaching of uranium exploitation in north ore belt of Shihongtan uranium deposit, Turpan-Hami basin. Coal Geol. China 2022, 34, 16–21. [Google Scholar]
- Yu, S. Study on Migration Behavior of Key Nuclides in Cavern Disposal Repository. Master’s Thesis, Southwest University of Science and Technology, Mianyang, China, 2021. [Google Scholar]
- Yuan, X.; Liu, J.; Zhou, Y.; He, T.; Chen, X.; Zahng, Y. Effect of CO2 + O2 In-situ Leaching of Uranium on Permeability of Ore-bearing Layer. Nonferrous Met. Extr. Metall. 2021, 5, 50–57. [Google Scholar]
- Zhang, J.; Li, Z.; Su, X.; Tan, Y.; Li, S.; Su, Y.; Li, J.; Deng, P.; Xu, L.; Pan, Z. Development strategy of nuclear energy mineral resources. Eng. Sci. 2019, 21, 113–118. [Google Scholar]
- Zhang, Q.; Zhang, Y.; Fei, Z. CO2 + O2 Neutral in-situ leaching test of a uranium mineral deposit in Xinjiang. China Min. Mag. 2012, S1, 435–438. [Google Scholar]
- Zhang, X.; Nie, F.; Zhang, C.; Zhang, H.; Dong, F.; Dong, Y.; Lu, Y. Study on uranium occurrence state of sandstone-type uranium deposits in Mengqiguer deposit, Yili basin. Sci. Technol. Eng. 2015, 15, 18–23+47. [Google Scholar]
- Zhang, X.; Nie, F. Analysis of the provenance of the uranium-bearing target layer and its tectonic setting in the Shihongtan uranium deposit, Xinjiang: Evidence from the petrology and geochemistry. Sci. Technol. Eng. 2019, 19, 86–92. [Google Scholar]
- Zhao, K.; Zhang, Y.; Zhou, Y.; Li, G.; Sun, Z.; Liu, J.; Xu, L.; Yuan, X.; Hu, M. Interaction between gangue mineral and leaching agent in CO2 + O2 in-situ leaching. Nonferrous Met. Extr. Metall. 2023, 3, 68–87. [Google Scholar]
- Zhou, Y.; Li, G.; Xu, L.; Liu, J.; Sun, Z.; Shi, W. Uranium recovery from sandstone-type uranium deposit by acid in-situ leaching—An example from the Kujieertai. Hydrometallurgy 2020, 191, 105209. [Google Scholar] [CrossRef]
- Zhu, H.; Qiao, H.; Jia, H.; Xu, G. Discussion on distribution characteristics of calcareous sandstone in Shihongtan uranium deposit and its genesis. Uranium Geol. 2007, 5, 262–267+288. [Google Scholar]
- Liu, Y.; Luo, Y.; Li, X.; Wang, B.; Liu, C. Water rock reaction plugging mechanism of acid leaching uranium in Bayanwula uranium deposit. Nonferrous Met. Min. Sect. 2022, 5, 45–51. [Google Scholar]

Disclaimer/Publisher’s Note: The statements, opinions and data contained in all publications are solely those of the individual author(s) and contributor(s) and not of MDPI and/or the editor(s). MDPI and/or the editor(s) disclaim responsibility for any injury to people or property resulting from any ideas, methods, instructions or products referred to in the content. |
© 2023 by the authors. Licensee MDPI, Basel, Switzerland. This article is an open access article distributed under the terms and conditions of the Creative Commons Attribution (CC BY) license (https://creativecommons.org/licenses/by/4.0/).