Article

Enhanced Predictive Model for the Mechanical Response of Compression-Loaded Slender Structures

by
Cristiano Fragassa
and
Ana Pavlovic
*,†
Department of Industrial Engineering, University of Bologna, 40126 Bologna, Italy
*
Author to whom correspondence should be addressed.
These authors contributed equally to this work.
Metals 2023, 13(7), 1286; https://doi.org/10.3390/met13071286
Submission received: 22 June 2023 / Revised: 10 July 2023 / Accepted: 13 July 2023 / Published: 17 July 2023

Abstract

:
The study of the behavior of thin metal sheets subjected to external loads has always been a matter of great interest due to its numerous theoretical and practical implications. The present analysis aims to investigate how to improve the predictions offered by a numerical model based on the finite element method by considerations on the material properties. Specifically, different modeling alternatives are compared, assessing these choices both with the similar assumptions made by other researchers in the past and with measurements from our own experimentation. The case under consideration consists of a slender, aluminum crash-box structure (a bumper) with a truncated pyramid shape subjected to a concentrated load on the top (axial crushing) up to a 46% reduction in its height. The system is characterized by high deformations (>15%) and large displacements. This presents a complex situation with various nonlinear effects, where the chosen assumptions in material modeling can have significant implications for the results, both in terms of accuracy and computational time. Among the investigated aspects, of no less importance are those related to the appropriate modeling of the elasto-plastic-hardening behavior of the metallic material.

1. Introduction

Slender structures, such as columns or long beams, exhibit specific behavior when subjected to compression loads, experiencing a combination of compressive stress and bending [1]. As the load increases, the structure starts to deflect laterally due to the bending action and to be charged with strain energy [2]. If the compressive load is further increased, the structure undergoes a phenomenon of instability, resulting in sudden and uncontrollable lateral deflection [3]. This lateral deflection is usually in the form of a buckling mode shape, which can be a single wave, multiple waves, or a combination of different shapes depending on the structure’s geometry and boundary conditions [4].
The phenomenon is influenced by several factors, including the material properties, cross-sectional shape, dimensions of the structure, end conditions, and the presence of any imperfections or eccentricities. This structural behavior can be complex, and accurate analysis and design considerations are crucial to ensure their stability and structural integrity. For the scope, it is customary to use numerical methods to support the possible estimates through a more theoretical approach (often based on simplified formulas).
Numerical analyses allow offering an answer with respect to complex geometries, not easily simplified to bring them back to known cases [5]. Furthermore, simulations allow for relatively simple management of non-obvious load and constraint conditions, as well as material properties that are not only elastic. All of this, however, introduces a general complexity into the calculation, difficult to be properly managed at times. As will be seen, in fact, apparently minimal changes in the computational model can provide very different outputs as well as longer and divergent calculations.
Hence, the present article aims to discuss the development of a finite element method (FEM) for the study of the behavior of slender structures subjected to compressive loads. Many details are here provided to understand the effect of different alternatives used to simplify the numerical modeling. As an application case, a crash-box structure made of thin aluminum sheets and used as an automotive bumper was chosen.
Crash-box structures play a crucial role in automotive safety, specifically in absorbing and dissipating energy during collisions [6]. These sacrificial components are typically designed to protect the vehicle’s occupants by minimizing the impact forces transmitted to the main body structure during a crash. When a collision occurs, the crash-box structure absorbs a significant portion of the kinetic energy, deforming and crumpling in a controlled manner [7]. This deformation process helps to extend the time duration of the crash, thereby reducing the peak forces experienced by the vehicle and its occupants. By absorbing and dissipating energy by plastic deformation, crash-box structures contribute to enhancing occupant safety and reducing the potential for injuries [8].
This paper is structured on two levels. In the first, the numerical simulations were performed with respect to a representative model of the system used as a baseline. Starting from its assumptions, which were already able to offer convincing results, changes were discussed to achieve an enhanced model of simulation. The basis for comparison was the force/displacement curve as measured by dedicated experiments.
Main topics here concern (a) the modeling of metallic materials across the non-elastic regimes (plastic and hardening); (b) the presence of non-linearity conditions (related to large displacements, large deformations, and contact problems); (c) the uncertainty in the application of external conditions (loads and constraints); (d) opportunities and limits of the computational model (e.g., type of analysis or discretization). The scientific literature is mostly integrated in the discussion to have a direct correspondence between the considered assumptions and what was previously achieved by other authors.
The results, which add to other previous works by the authors on the study and modeling of thin sheet metal [9,10,11], intend to represent both a methodological basis for the study of slender structures and a practical guide to the simulations of slender structures made of metal alloys.

2. Materials and Methods

2.1. Samples and Experiments

Two samples were considered with the same shape but different thicknesses: 1.2 and 1.5 mm. The geometry consists of a truncated pyramid tube, 150 mm height, with four walls and inclined sides, also known as four tapered or ‘Frusta’. The top surface, smaller, was 180 × 100 mm, and the lower surface, larger, was approx. 206 × 126 mm (Figure 1a). Shape and dimensions were chosen considering similar investigations [12,13], where it was revealed how the structural response (obviously) depends on the geometric characteristics of the structure in a relevant way without however being able to propose the ‘best shape’ (as this response also depends on other factors [14]).
Two quasistatic compression tests (axial crushing) were performed using an Italsigma FPF100 universal testing machine. Force and displacements were recorded at 10 Hz, using a LVDT Messotron W50 displacement sensor and a HBM U2 100 kN load cell, respectively. The samples were positioned between two rigid plates, with the upper plate gradually being lowered in displacement control mode.
The testing procedure maintained a constant forward speed of 0.5 mm/s for 175 s until a displacement of 87.5 mm, which corresponded to more than half of the sample’s height. The experimental force vs. displacement curves were detected and used as a basis for comparison to study the impact of changes in the numerical model.

2.2. Explicit Solver

The numerical analysis was performed by Ansys Workbench 2023 Ver. R1, (as in [15,16,17]), powered by the AUTODYN explicit solver, not different from the LS-Dyna solver, which may represent the most selected explicit calculation algorithm.
An explicit analysis was preferred (as in [18,19,20]) due to the need of calculating highly complex and nonlinear problems where rapid changes are involved, such as large deformations or material failures. In general, explicit dynamics serves as a valuable time integration technique that prioritizes speed in dynamic simulations. It excels in capturing rapidly changing scenarios or abrupt events, including free falls, high-speed impacts, and applied loads. By seamlessly incorporating these nonlinear dynamics into the simulation, explicit dynamics becomes the preferred method for simulating extremely transient physical phenomena [21].

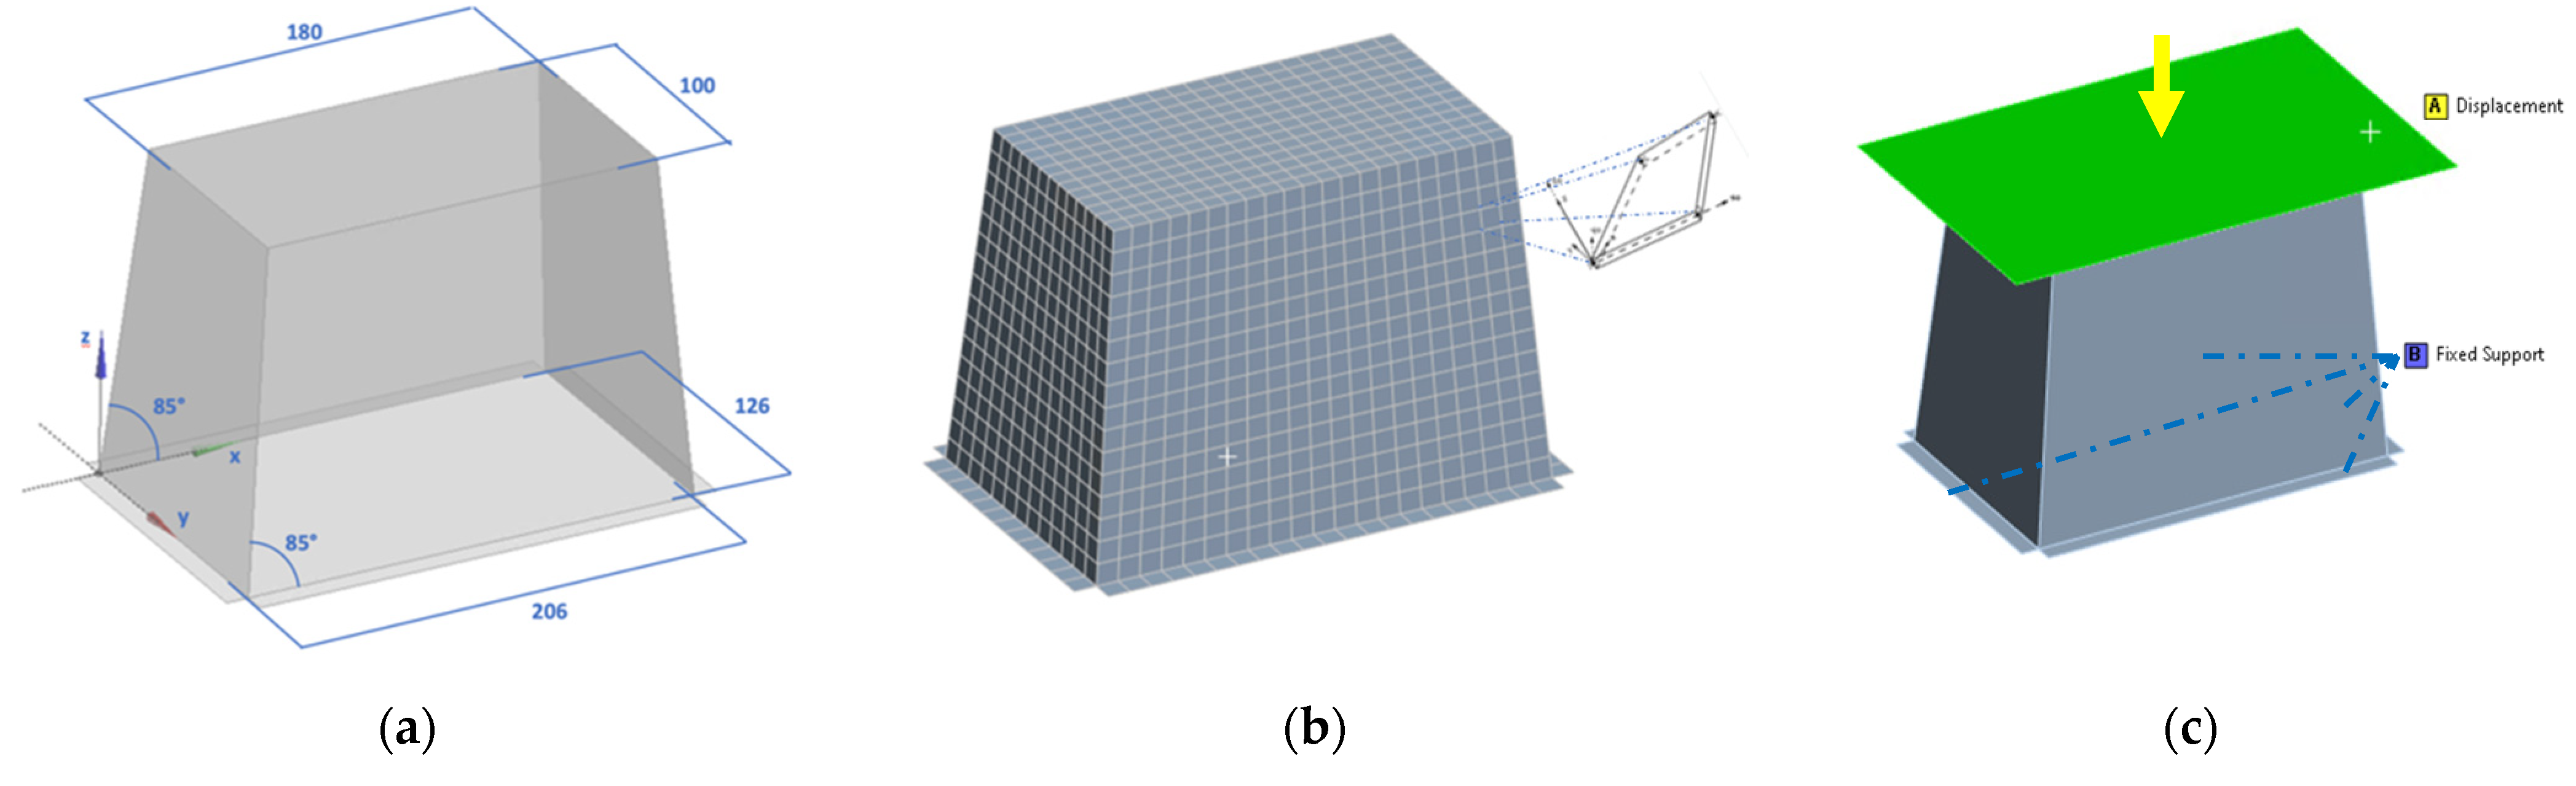
2.3. Geometrical Discretization Model

The 3D (Frusta) geometry was modeled and discretized by finite elements (FEs). An explicit mesh was generated by four-node quadratic shell elements (QUAD4), of the SHELL181 type (as in [22]), thickened at 1.2 or 1.5 mm. Globally, 1927 nodes and 1845 EFs, characterized by a (representative) size of 10 mm (Figure 1b).
SHELL181 is a computational tool specifically designed for analyzing shell structures, ranging from thin to moderately thick. It employs a four-node element with six degrees of freedom at each node, encompassing translations in the (local) x, y, and z directions as well as rotations about the x, y, and z-axes. This versatile tool is well-suited for a wide range of applications, including linear analysis, large rotation analysis, and large strain nonlinear analysis. Moreover, it excels at effectively handling variations in shell thickness during nonlinear analyses.
Different meshes were also considered and investigated. To ensure mesh uniformity and minimize energy errors, the Multizone Quadri/Tri method was employed. A check on the EFs’ deformation (by hourglass energy [23]) allowed for monitoring the discretization.
To accurately represent the tests, the system was constrained to the base through a fixed constraint on the bottom edge. Loading was applied via an infinitely rigid plane in initial contact (i.e., bonded contact) with the upper surface (Figure 1c).
This plane was gradually lowered by 87.5 mm at the same constant speed (0.5 mm/s) as in the experiment. Additional hypotheses in the modeling of the physical system were examined. The resulting load/displacement curve, as mentioned, served as the primary outcome for direct comparison between simulations and experimental data.

2.4. Constituent Material

Samples were made by bending and welding sheet metal in EN AW 6082 (or AA 6082), used as delivered (without pre-heat treated, no annealed). This is a direct extrusion aluminum (Al) alloy, typically used to produce medium-complexity extrusions with a structural function. Its chemical composition also includes silicon (Si), magnesium (Mg), and manganese (Mn) as main constituents (Table 1, Ref. [24]).
The AA 6082 is characterized by a density (ρ) of 2700 kg/m3, an elastic coefficient (E) = 69,000 MPa, yield tensile strength (Rp0.2) > 230 MPa, and ultimate tensile strength (Rm) > 270 MPa. These and other typical values are summarized in Table 2 and are representative of an open profile extrusion, made as hardened and artificially aged (T6), as reported in standards (EN 755-2 [25] and EN485-2 [26]) and here assumed.
The AA 6082-T6 is a high-strength alloy for highly loaded structural applications [27]. It finds common usage in various applications such as scaffolding elements, rail coach parts, offshore constructions, containers, machine building, and mobile cranes. Its fine-grained structure provides excellent resistance to dynamic loading conditions, while also allowing for easy workability through plastic deformation during bending and welding processes. For such reasons (i.e., strength, lightness, workability, etc.), AA 6082-T6 emerged as a valid material choice for the design of slender structures able to withstand high deformations (e.g., bumpers). This material was also part of similar investigations, as in [28], where shell elements were used to model welded beam-to-column joints in AA 6082-T6 and the results were compared with experimental data from the literature.

2.5. Material Model

Aluminum (Al) is an excellent material for engineering applications (and not only). In addition to being plentiful and easily recyclable, it is much lighter and more ductile than steel. This makes it particularly interesting for the construction of deformable protective structures (crashworthiness). The addition of specific chemical elements (such as Cu, Si, Mg, Zn, and Mn) as well as the use of specific processes and treatments (hardening) allow the alloy to have extremely advanced characteristics. There are more than 1000 aluminum alloys on the market, with mechanical properties ranging from Rp0.2 = 30 MPa and Rm = 80 MPa in the case of Al 1050, an alloy with Al ≥ 99%, to Rp0.2 = 80 MPa and Rm = 580 MPa in the case of Al 7075, a zinc alloy for typically aerospace uses.
This variability is extremely convenient, allowing for selecting the most appropriate alloy with respect to each specific use, but it often adds complexity in the phases of structural design and numerical verification. In fact, all the properties necessary to make an accurate simulation are not always known (nor is it always possible to know them).
In the given case of AA 6082, the literature describes an intermediate aluminum characterized by an elastic and plastic behavior, with an evident hardening regime at higher stresses (e.g., [29,30]).
Instead of oversimplifying the analysis by limiting it to the elastic zone (which does not make sense for functional elements relying on high plasticization), the material’s tensile stress (σ)–strain (ε) curve can often be effectively approximated by considering an elastic-to-plastic hardening behavior, described by the following equation:
ε = σ E , σ < σ 0 ε 1 ε 0 σ 1 σ 0 σ σ 0 ) + ε 0 , σ 0 σ σ 1 ε 0 + σ 01 E ( σ σ 01 ) 1 / N , σ > σ 1  
in terms of the yield strain ε0; initial hardening strain ε1; yield stress, σ0; initial hardening stress, σ1; initial stress at the beginning of the nonlinear part of the approximation curve, σ01; and strain-hardening exponent, N.
Such material behavior, shown in Figure 2a, can be embedded in the Ansys numerical model in terms of true stress/true strain by a user’s defined multilinear isotropic hardening (Figure 2b), using nine discretization points or simplified by the bilinear hardening model. In this second case, it is sufficient to introduce the four material parameters of yield strength (σ0), modulus of elasticity (E), tangential modulus (Et), and Poisson’s ratio (ν). Both material representations were here considered and compared.
The assumed AA 6082 stress–strain curve is shown in Figure 3, with data taken from [31], where experimental values were provided for different strain rates: both bilinear and multilinear trends are displayed, together with their relevant/discretization points.

3. Results

3.1. Experiments

Figure 4 illustrates the progressive deformation of the slender structure during the compression, including the start from an unloaded configuration (a), the yielding (b), the large plastic displacements (c,d), and the unexpected reoccurrence of stiffness (e) probably due to secondary contacts between deformed zones, with an effect that continues on and off (f,g). The characteristic buckling of the sheet metal boxes due to sheet instability to thin sheets can be observed in Figure 5 and Table 3, where the measured load vs. displacement curves in the cases of 1.2 and 1.5 mm sheets (by also highlighting the moments when the previous images were captured) are shown. As expected, the results confirmed the following:
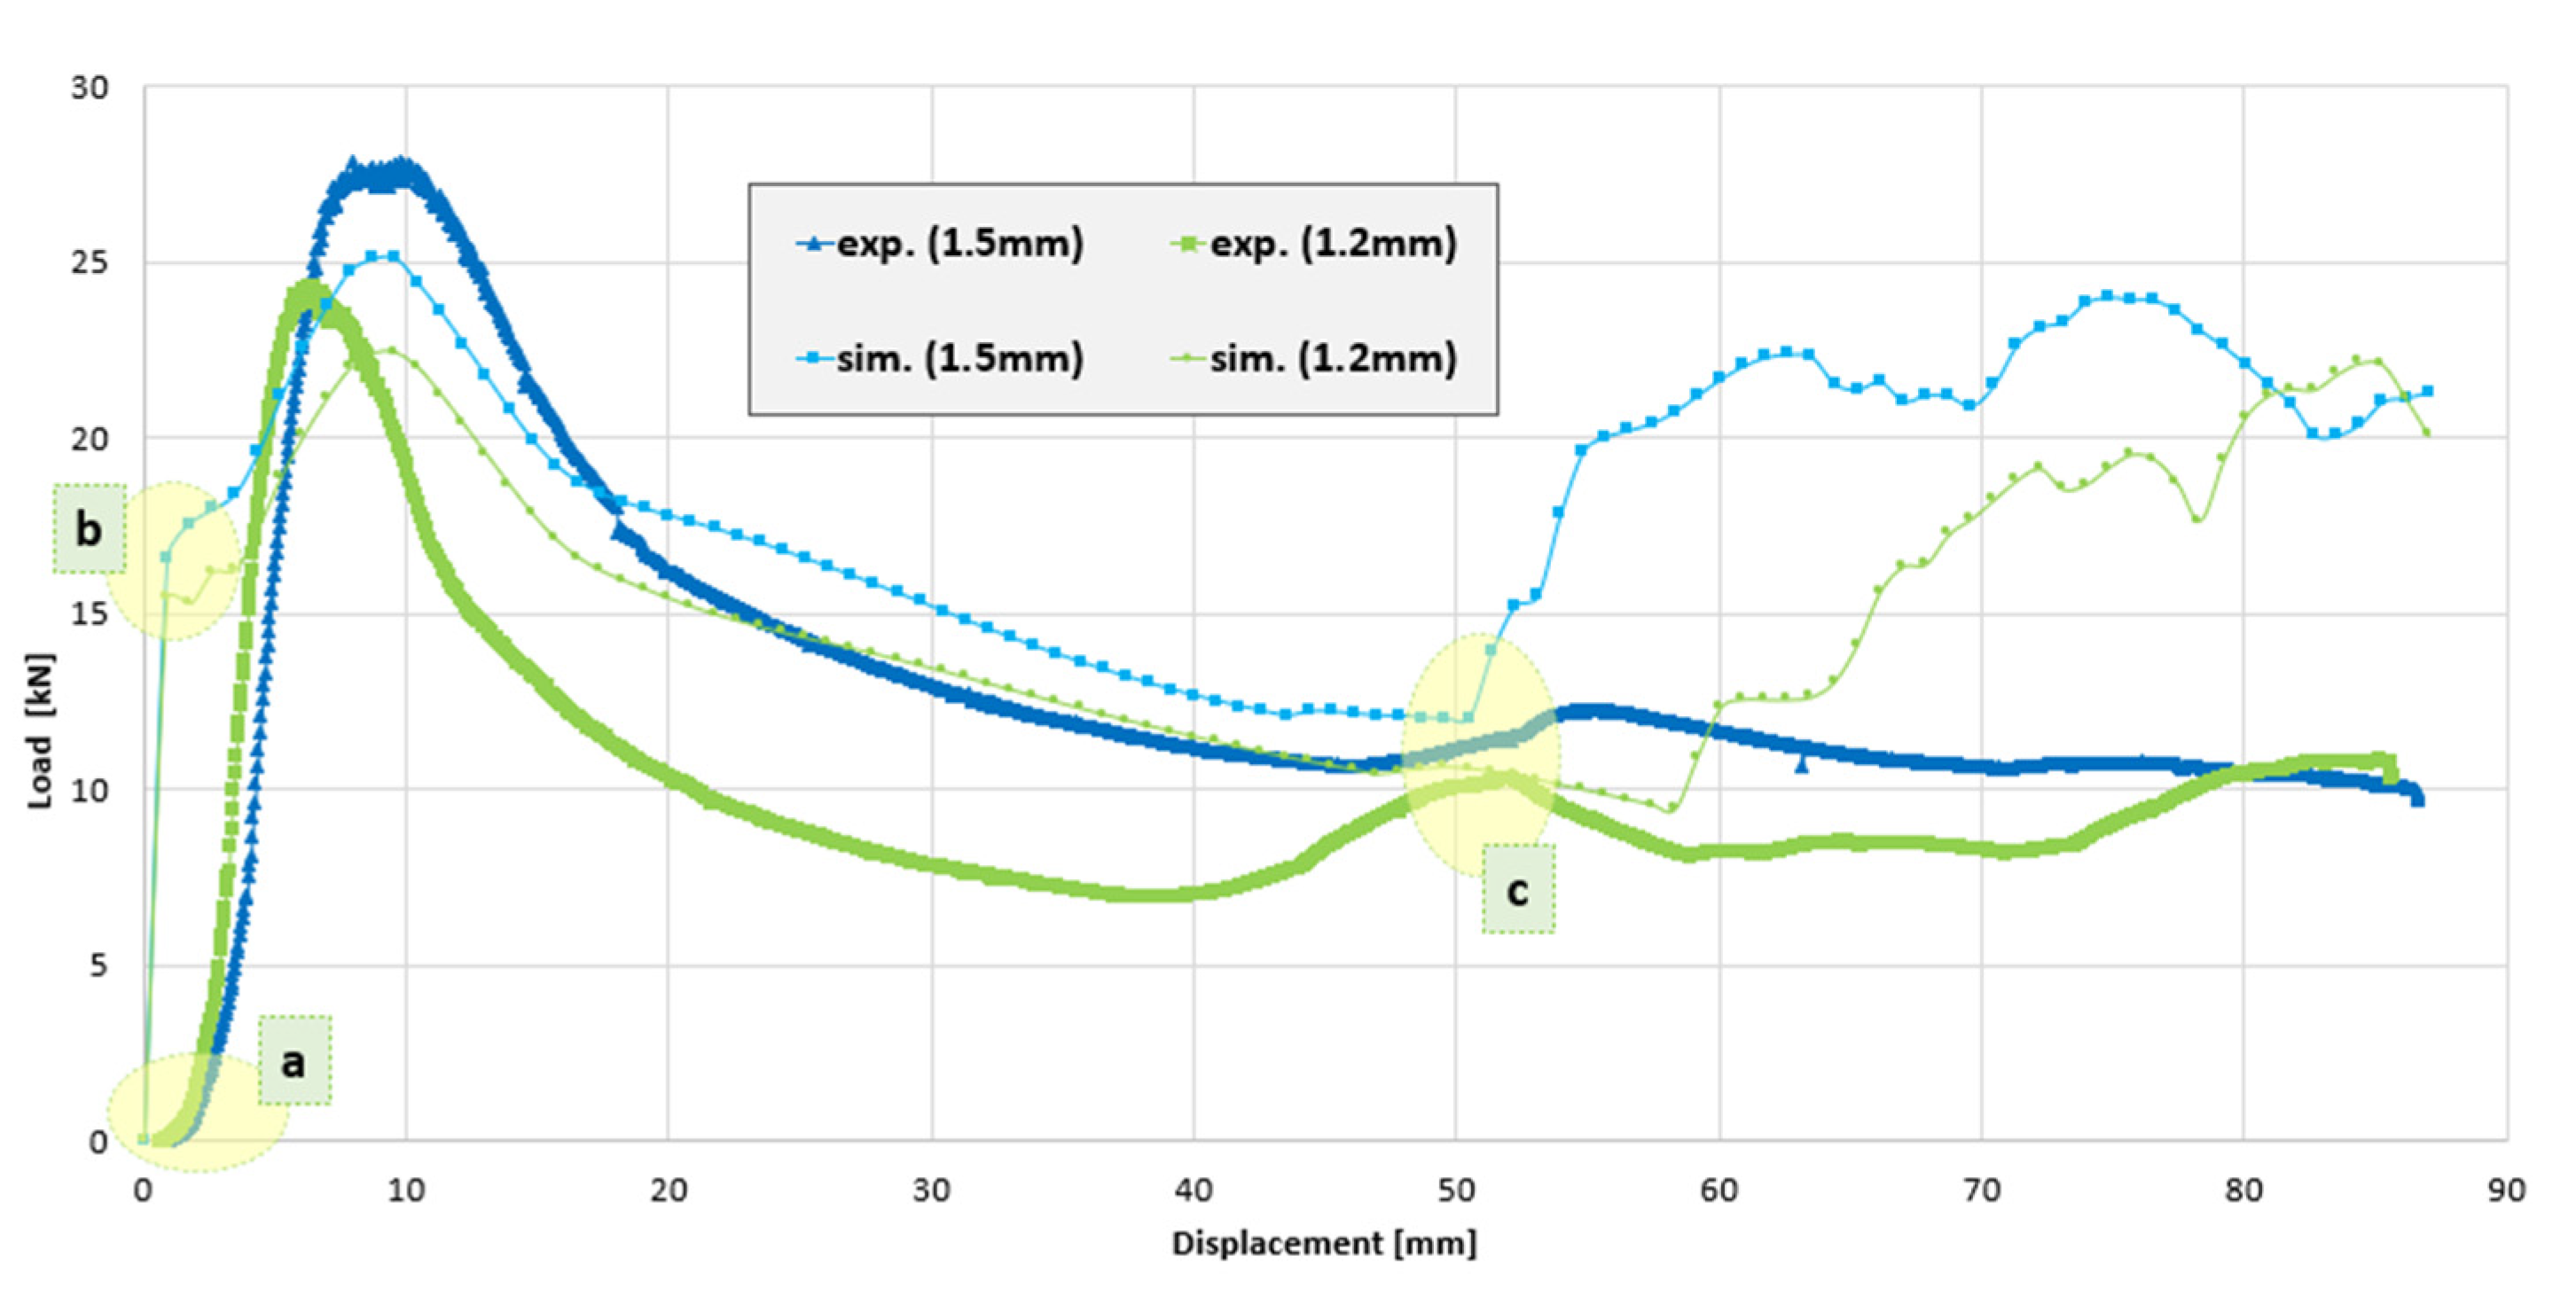
  • A structure made with thicker sheets (+20%) better resists compressive loads: increments in the maximum load (from 24.4 to 27.8 kN, +12.2%) and related displacement are evident (from 6.5 to 10.1 mm, +35.6%).
  • The initial structural response remains substantially unchanged, as closely linked to the material elasticity: the curves have a similar slope until the moment when conditions of plates’ instability/plasticity emerge.
The crashing structure, just as it was designed, is destined to present a high residual deformation. Figure 6 shows its deformed shape at the end of the compression test (in the case of 1.5 mm thickness). Specifically, from Figure 6c it is possible to observe a residual height of about 70 mm, higher than that present at the end of the compressive test, equal to 62.5 (i.e., 160 mm of height reduced by 87.5 mm for compression), which shows an elastic recovery of the deformed structure.

3.2. Simulations vs. Experiments

The numerical analysis considered different modeling hypotheses, starting from the mentioned baseline of conditions for the results of Figure 7. There, it is possible to see how the simulation was able to acceptably reconstruct the load vs. displacement curve in both cases (i.e., the structures made by 1.2 and 1.5 mm sheets), especially during the plastic deformation. For instance, in the case of 1.5 mm, the simulation allowed for identifying the maximum peak of load (25.1 vs. 27.5 kN) and the displacement at which this peak occurs (9.2 vs. 8.8 mm) with an accuracy of approx. 93% and 96%, respectively.
Moreover, the simulation seems to correctly identify the slope of the load ramp during in the elastic zone (with some limits described below) as well as when the load curve loses its downward trend (50–60 mm) in the hardening zone and starts going up suddenly.
Figure 8 provides a sequence of images that can be compared with those in Figure 4.

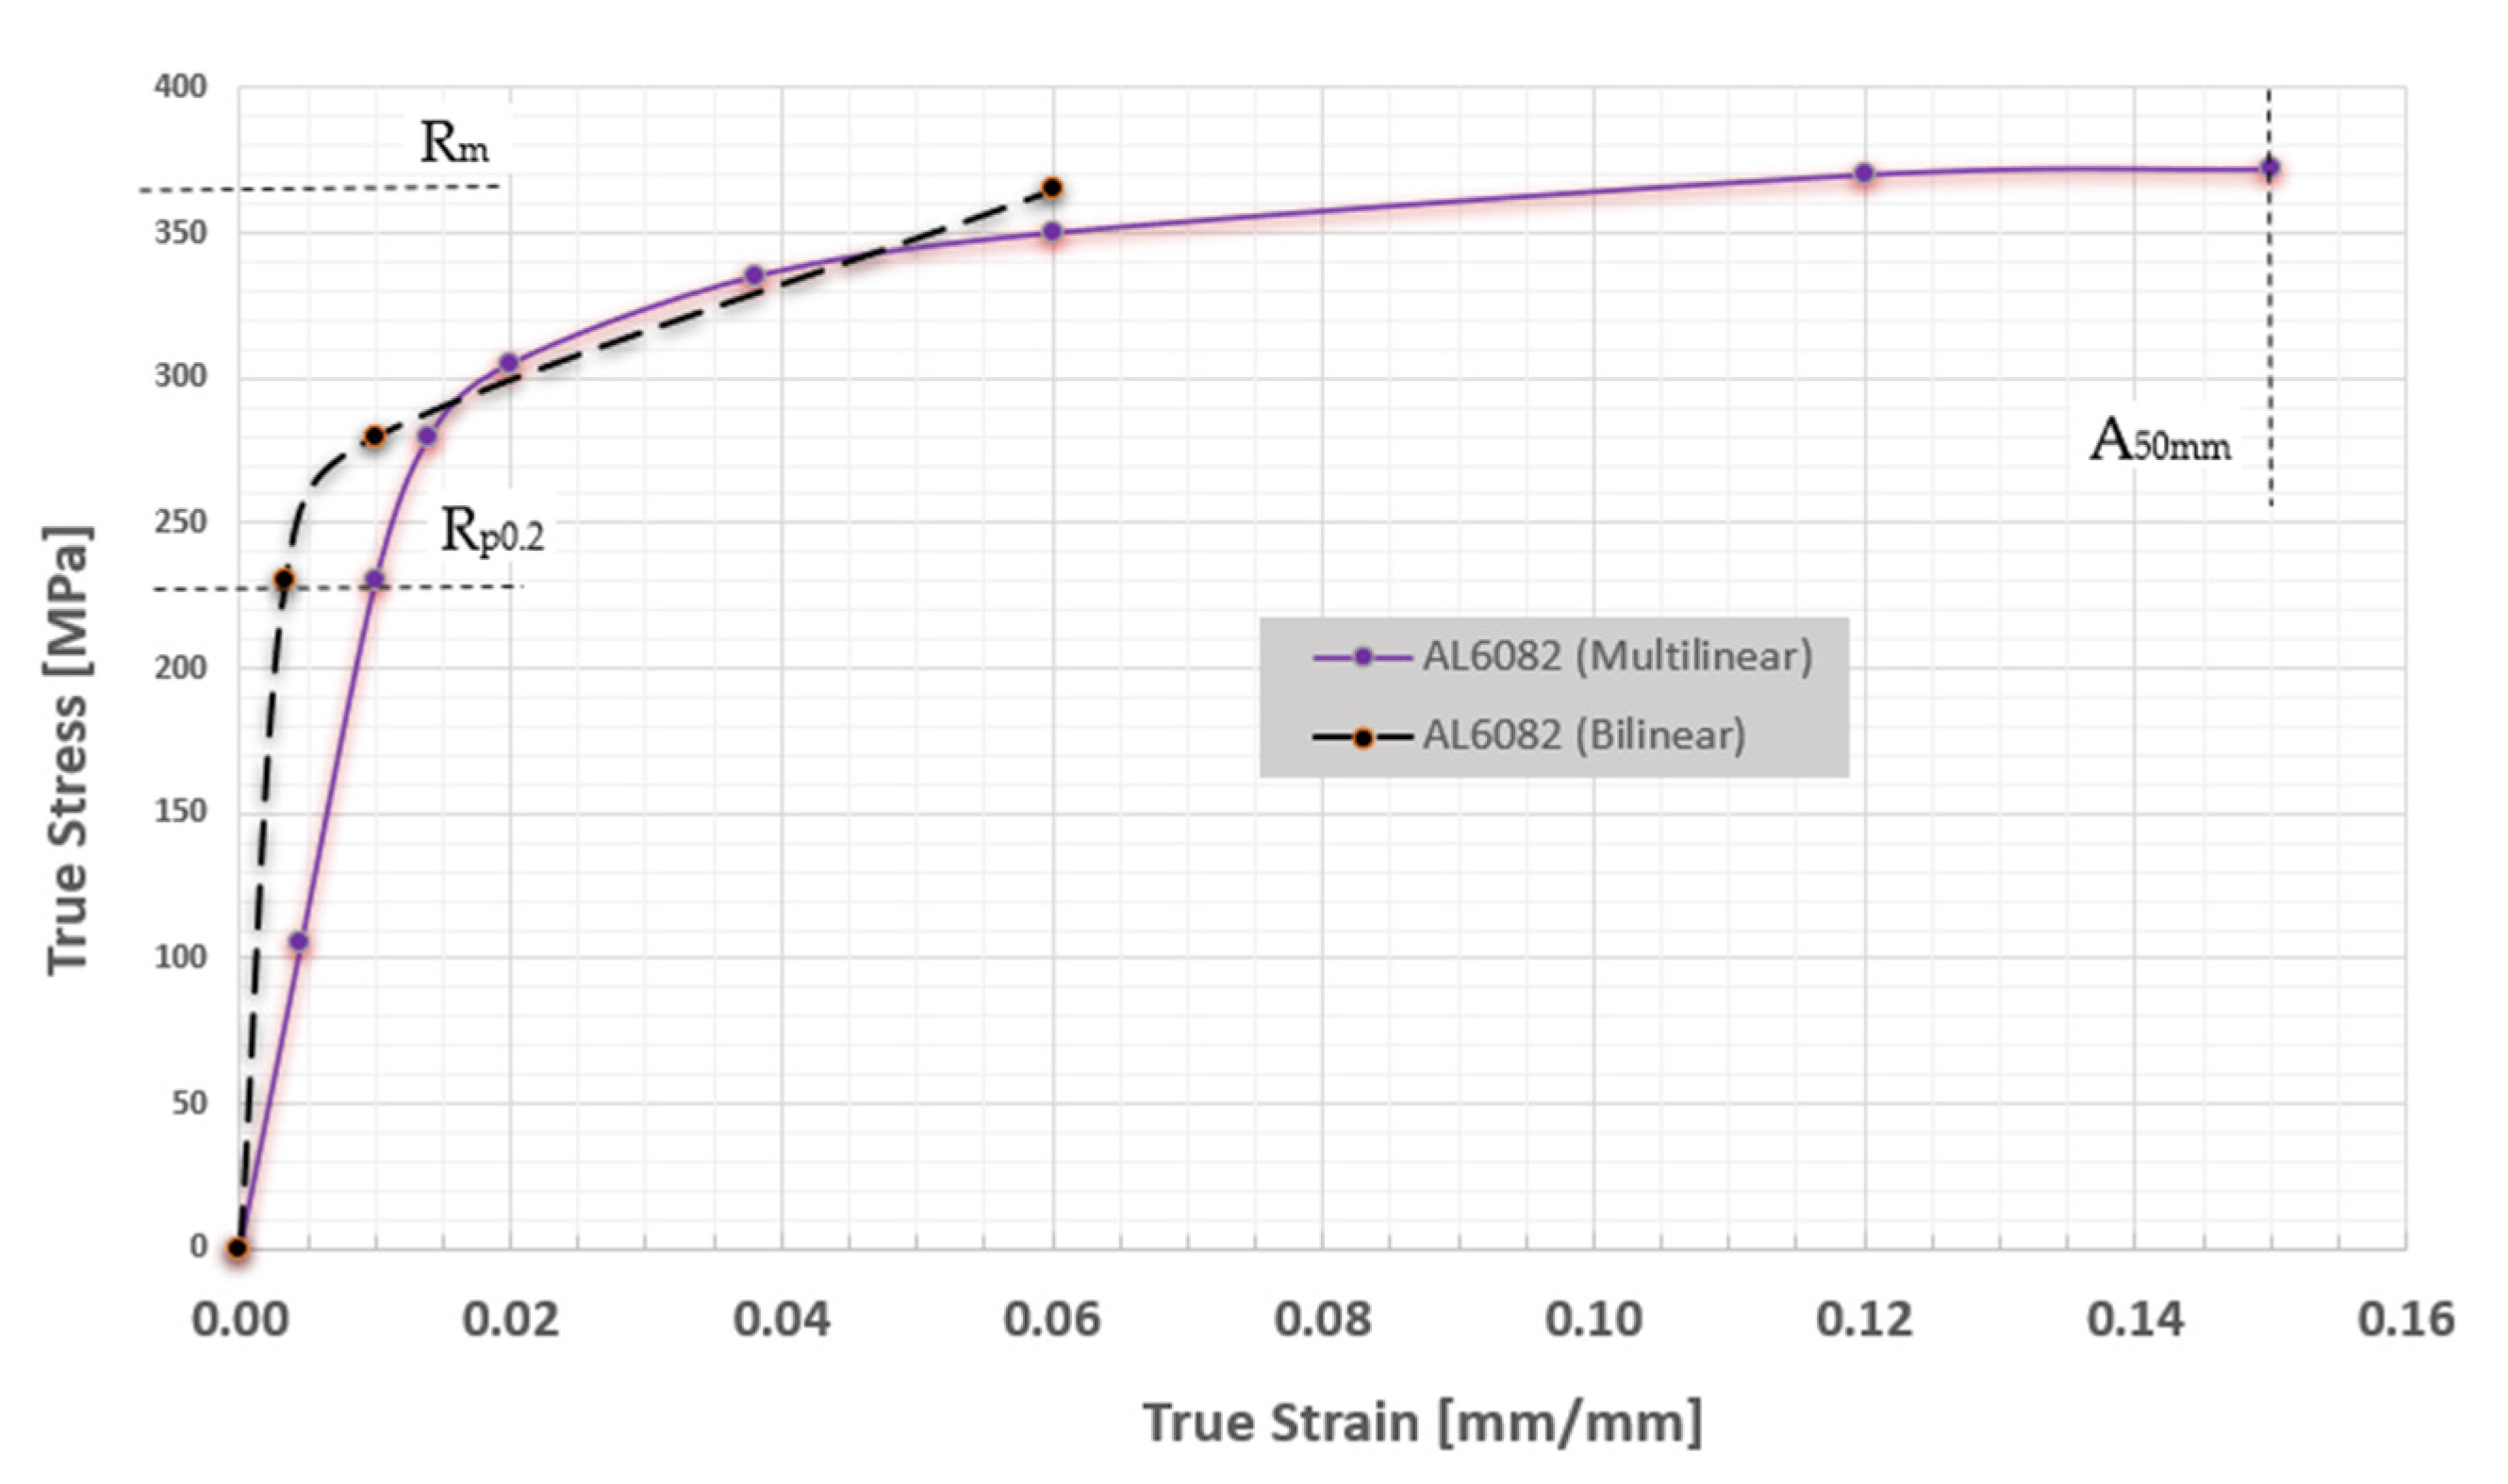
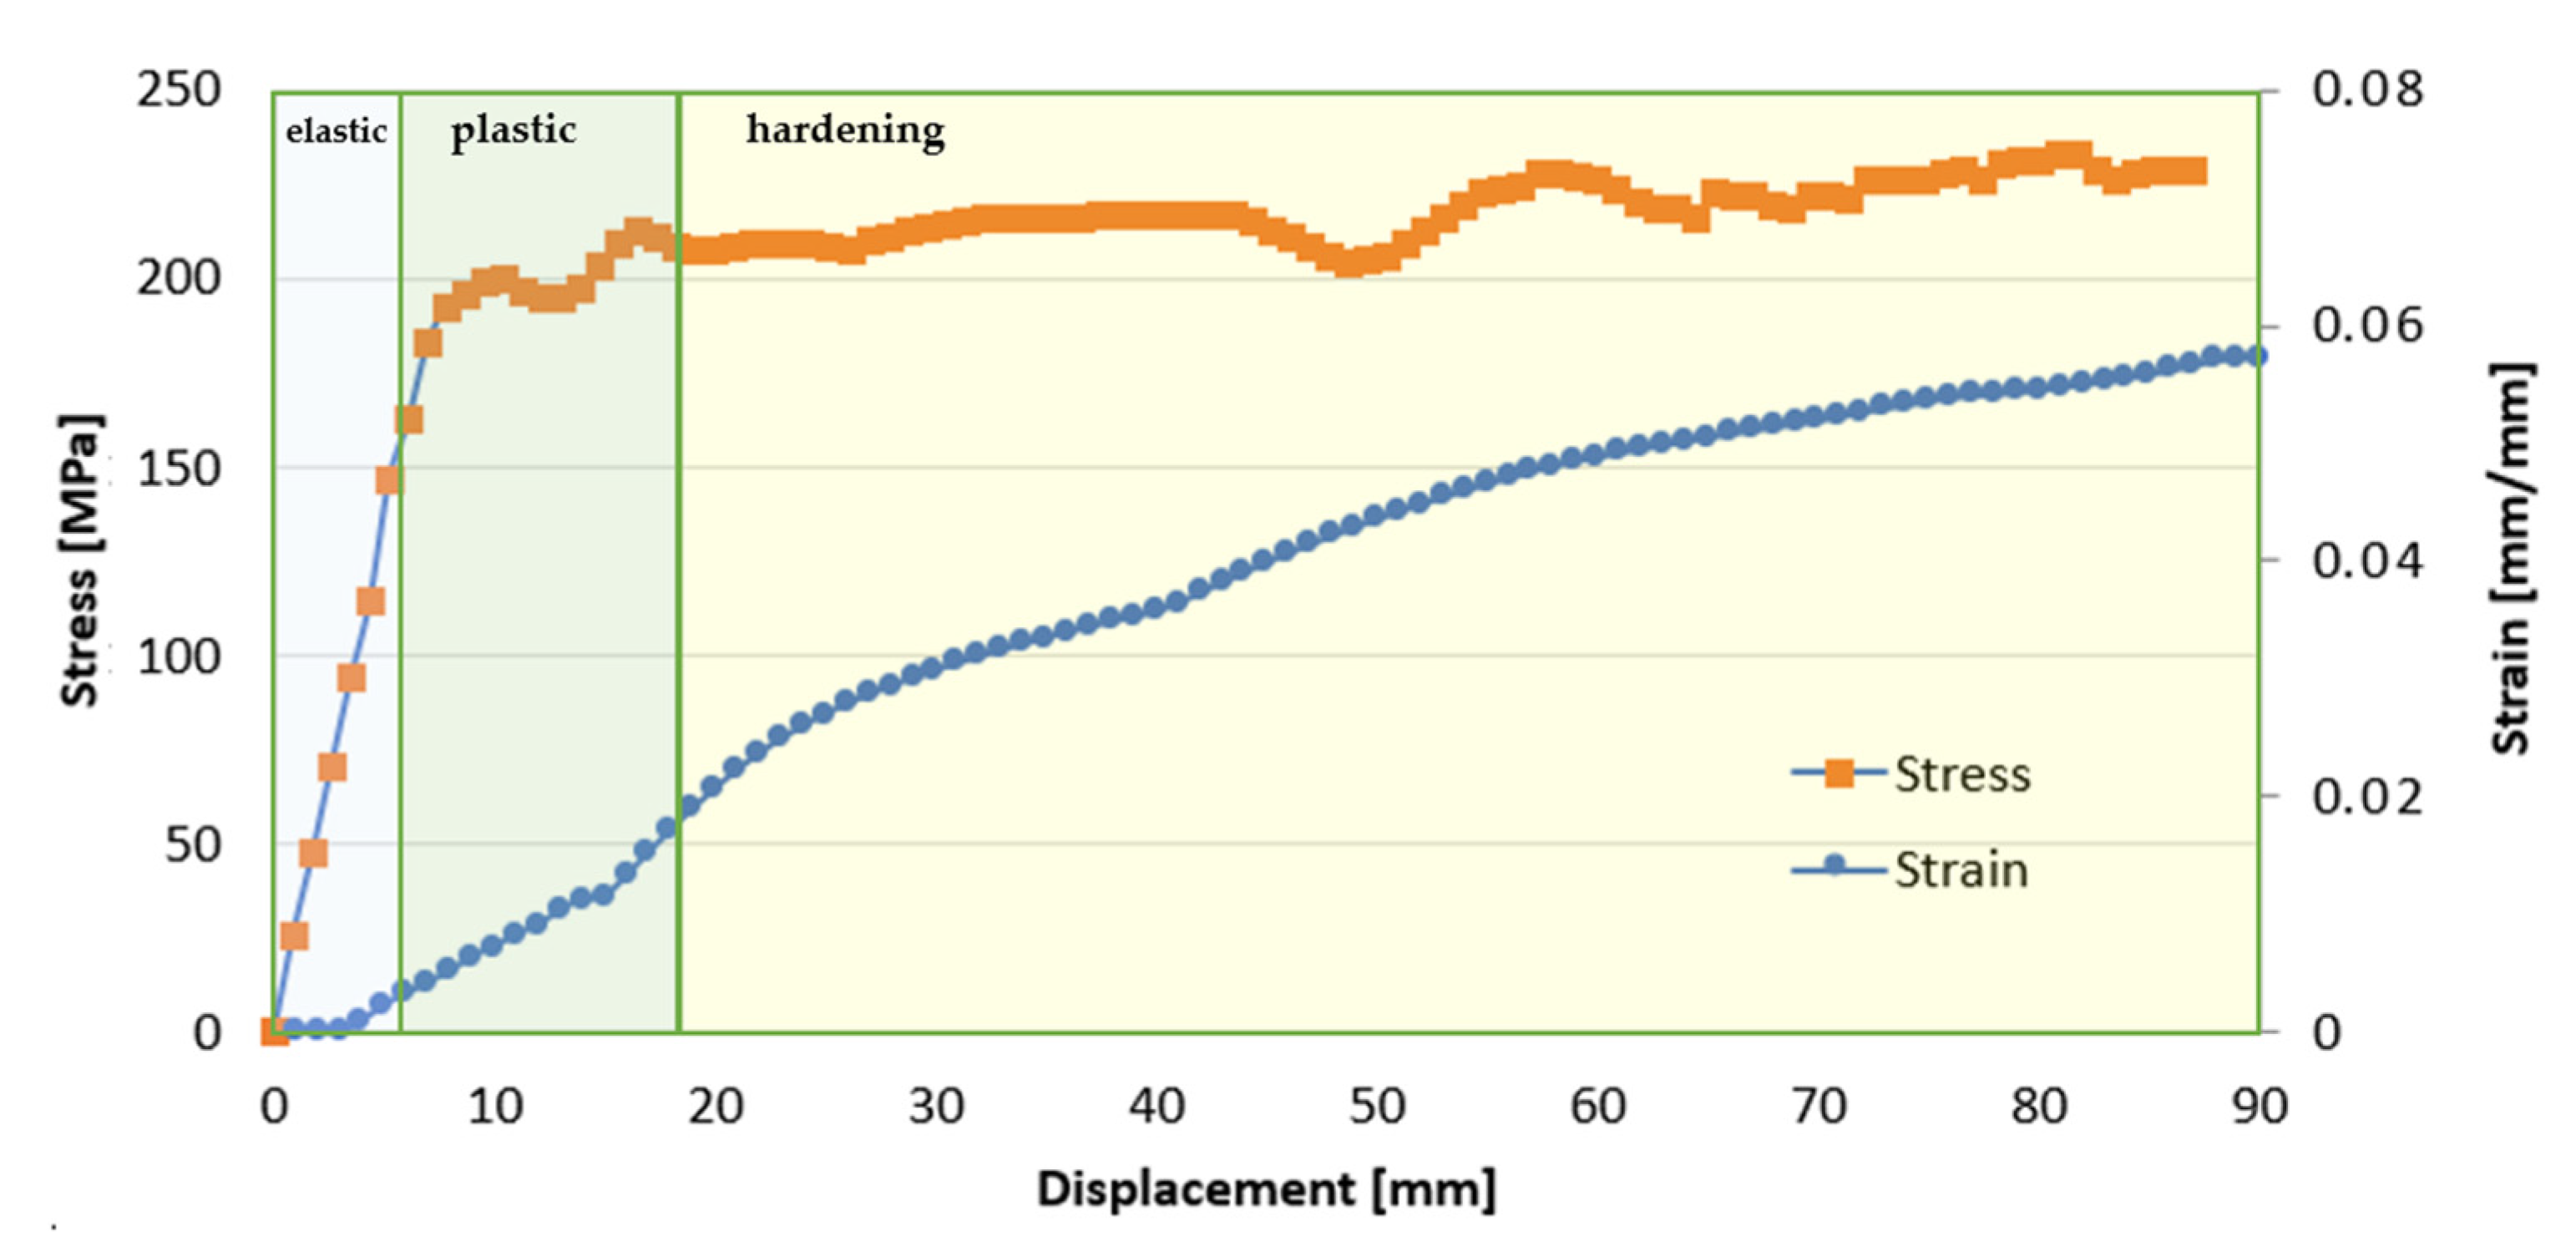
3.3. Stress vs. Strain

The numerical analysis also provided further insights, such as stress and strain states, as shown in Figure 9 and Figure 10, respectively.
Thanks to the simulation, it was possible to detect the zones entering plasticization where stresses exceeded the yield strength (Rp0.2 = 230 MPa) but also to verify that the ultimate tensile strength (Rm = 360 MPa), was never achieved. In Figure 11, the stress and strain curves (vs displacement) are visible for the different regimes (elastic, plastic, and hardening), while Figure 12 shows the related stress distributions (for displacements of 2, 15, and 40 mm, respectively).
It should be conveniently noted that the (von Mises) equivalent stress is shown (in Figure 9, Figure 11 and Figure 12) as a simplistic way for representing the stress increase. However, when a material surpasses the elastic regime and exhibits plastic behavior, this criterion is no longer applicable. Instead, more complex approaches are required to evaluate stress in a plastic material. There are several theories and models for modeling the plastic behavior of materials. One of the most common models is the associated plastic flow model, such as the Tresca or Coulomb–Mohr model (not here discussed). These models consider the effect of plastic deformation and the material’s resistance to yield. To calculate stress in a plastic material, it is necessary to consider the specific behavior of the material being used.

4. Discussion

4.1. Preliminary Considerations

There are evident differences between experimental and simulated trends, highlighting the need for comprehensive investigation and intervention in the numerical model.
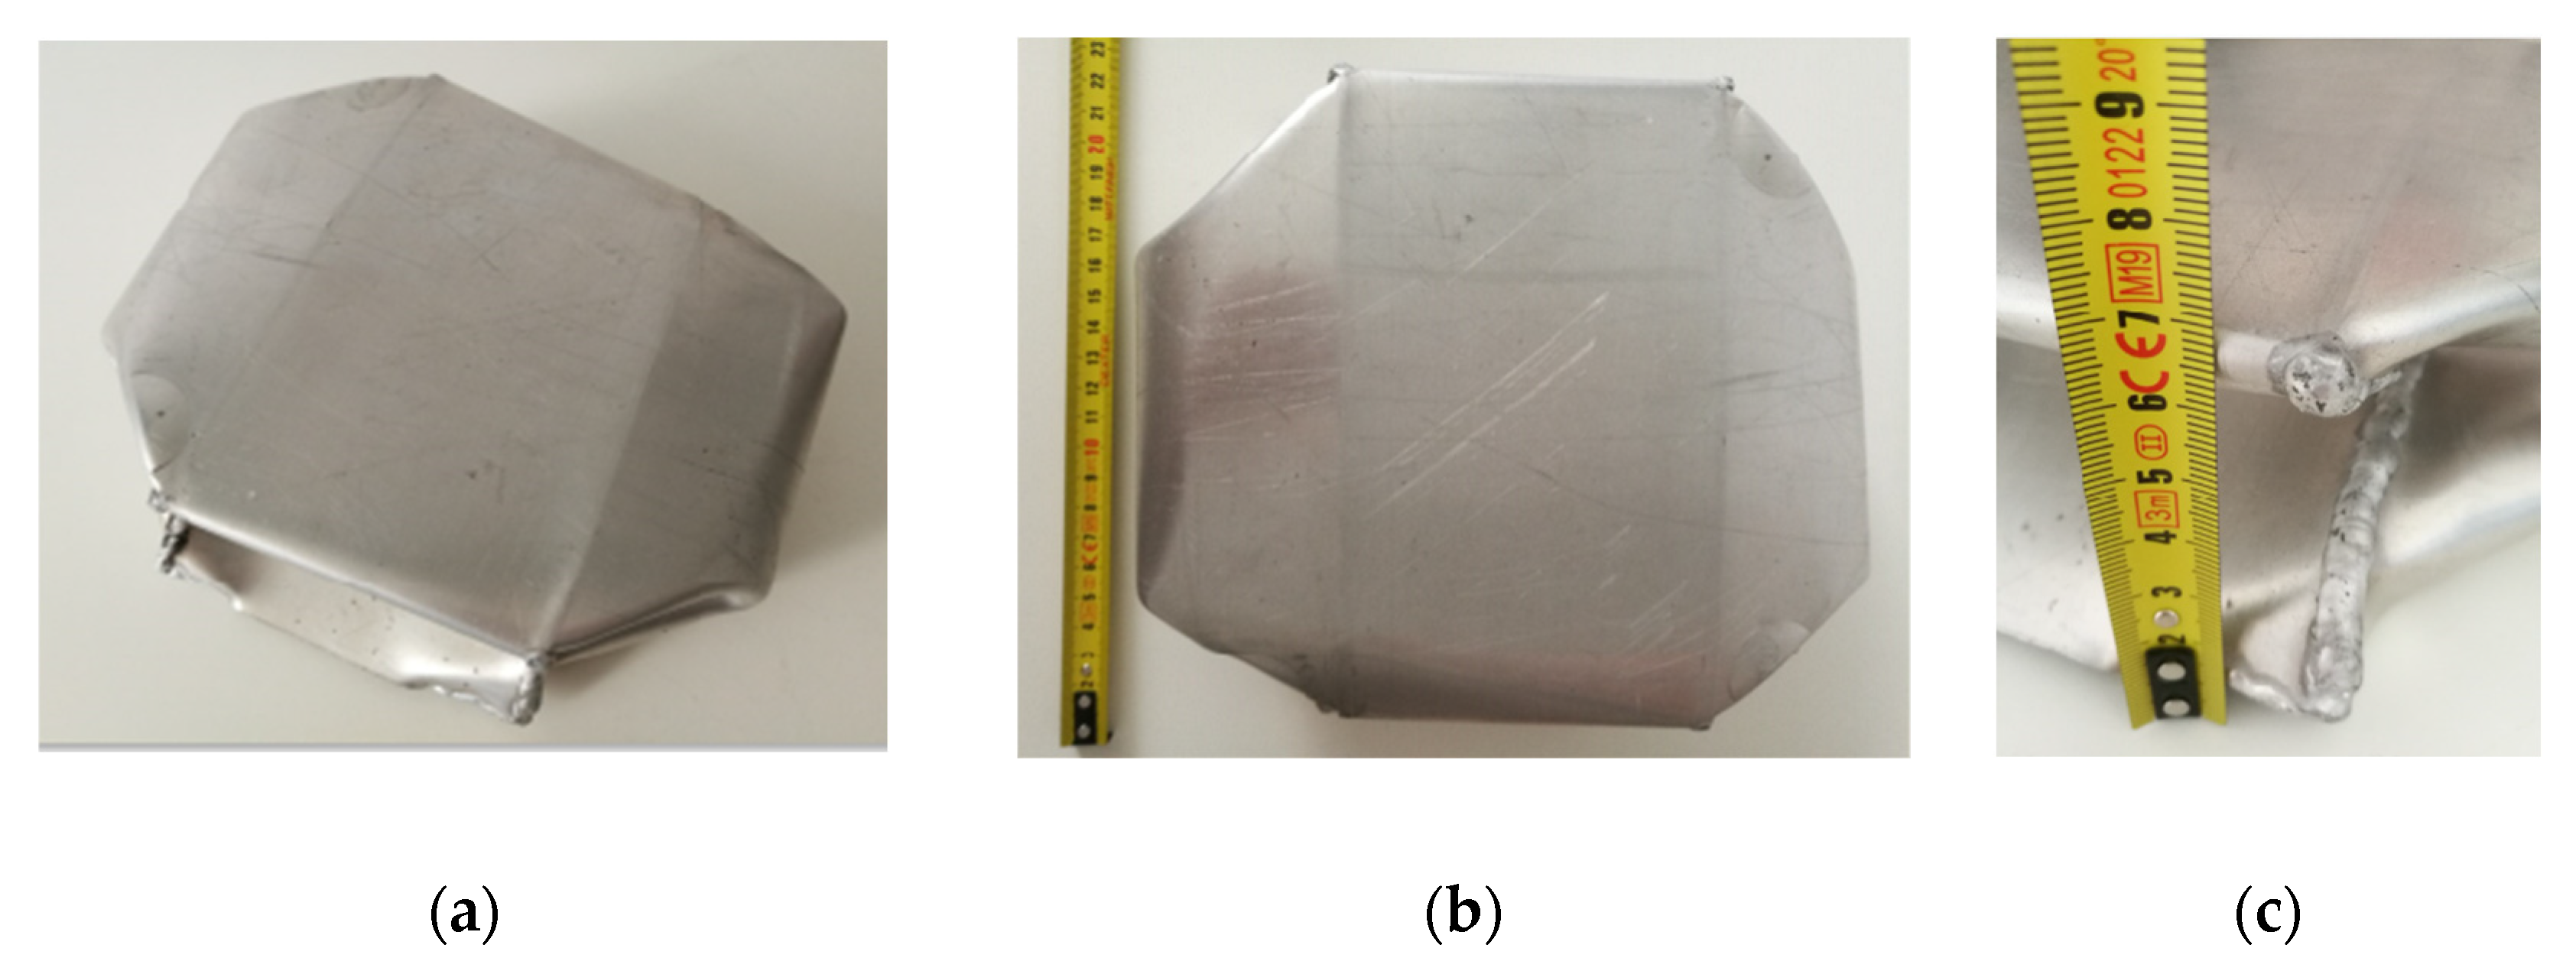
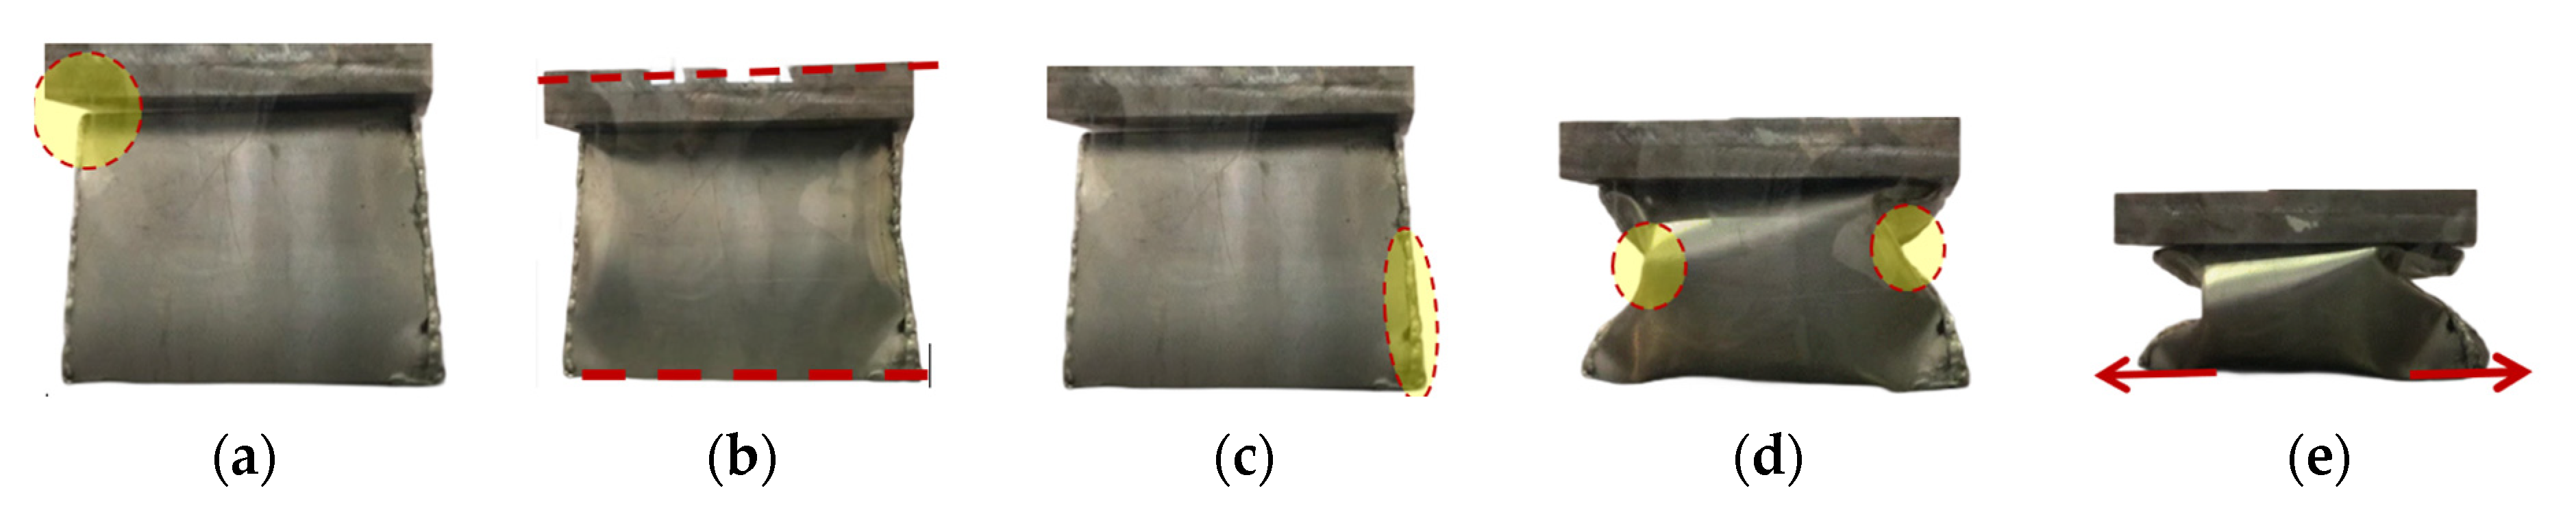
  • The experimental curves exhibit a slight offset (<2 mm), making it challenging to accurately replicate them through simulation (indicated as ‘a’ in Figure 7). This offset is likely attributed to the existence of small gaps, misalignments, or non-planarity in the samples and clamping systems (e.g., Figure 13a,b). Although the gradual recovery of this offset slightly alters the curve’s slope, leading to a slightly lower value compared to the simulation, it seems to be a minor concern.
  • In line with typical numerical investigations, the geometry in this study was simplified, disregarding the impact of sheet bends resulting from plastic deformation or welding (as depicted in Figure 13c). However, it is well established that these factors can considerably influence the system’s response to external loads. Such alterations arise not only from changes in the geometry [32,33], which encompass increased material thicknesses, but also from variations in the material properties [34].
  • A peculiar discontinuity in the simulated trends also appears (at 15–17 kN, indicated as ‘b’ in Figure 7). This is attributed to the sudden transition of material characteristics from the elastic to the plastic regime, occurring in the initial steps of the calculation. While such a discontinuity in material behavior does exist, as seen in Figure 2a and Figure 3, its effect is magnified due to the rapid traversal of the entire elastic increase ramp within a few time steps. This issue should be mitigated with a higher number of time discretization points, as that allows for a finer resolution. However, in explicit analyses, it is uncommon to directly control the discretization time, as it is determined algorithmically based on factors such as stress propagation (linked to the sound speed in the material) and finite element size. Although the literature provides interesting insights (e.g., [35]), it was decided not to change these auto-setting parameters but to indirectly optimize them by refining the mesh instead.
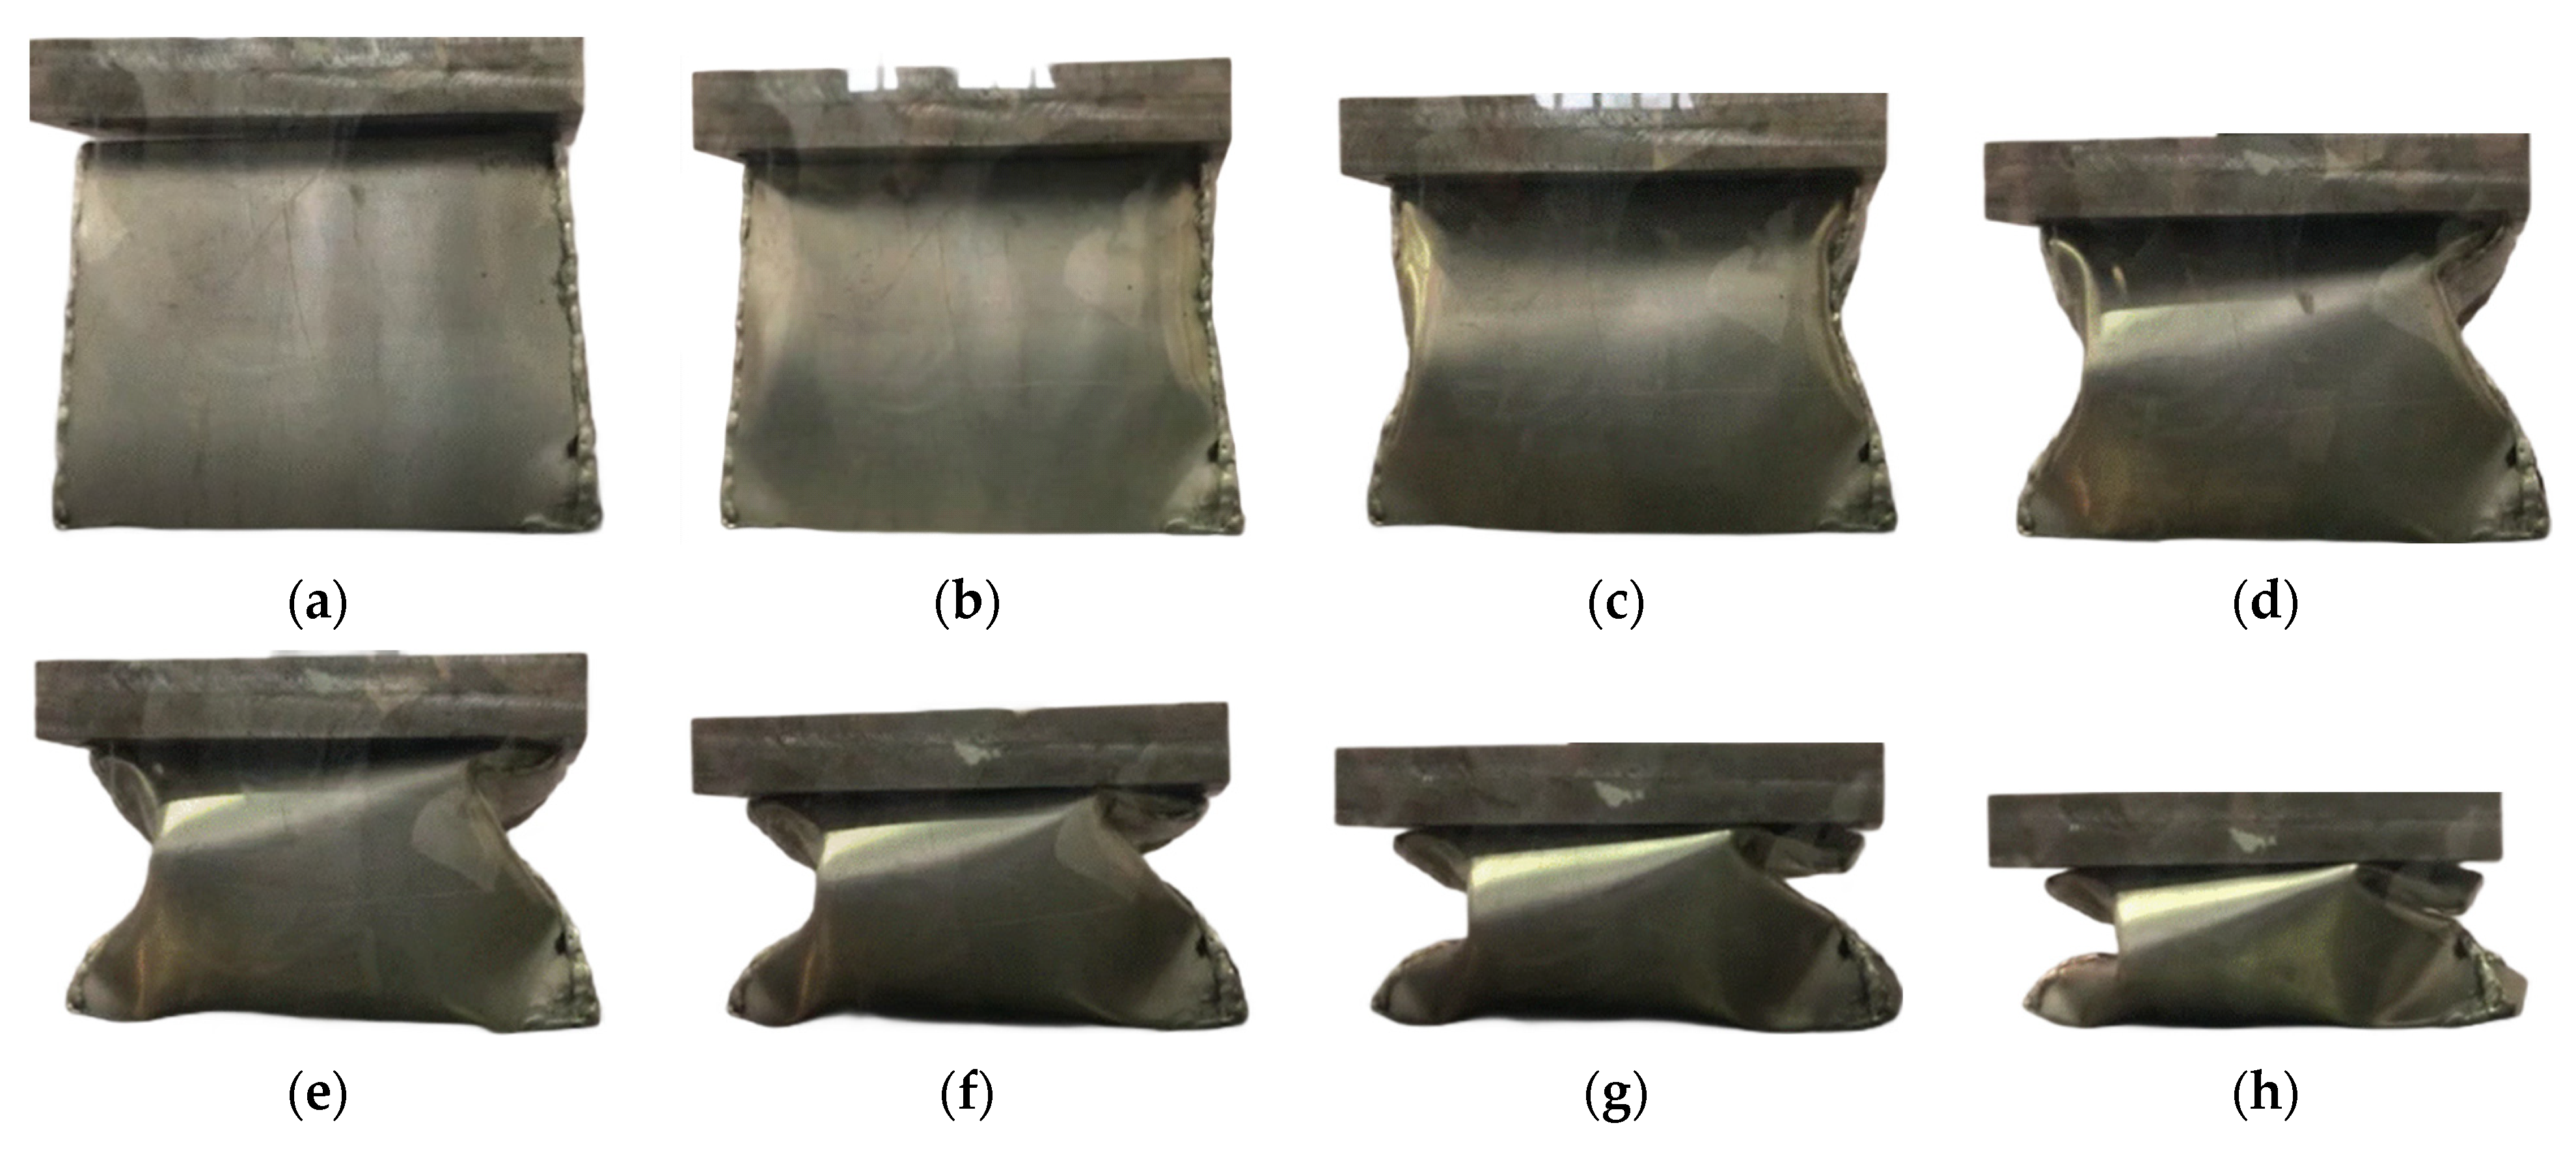
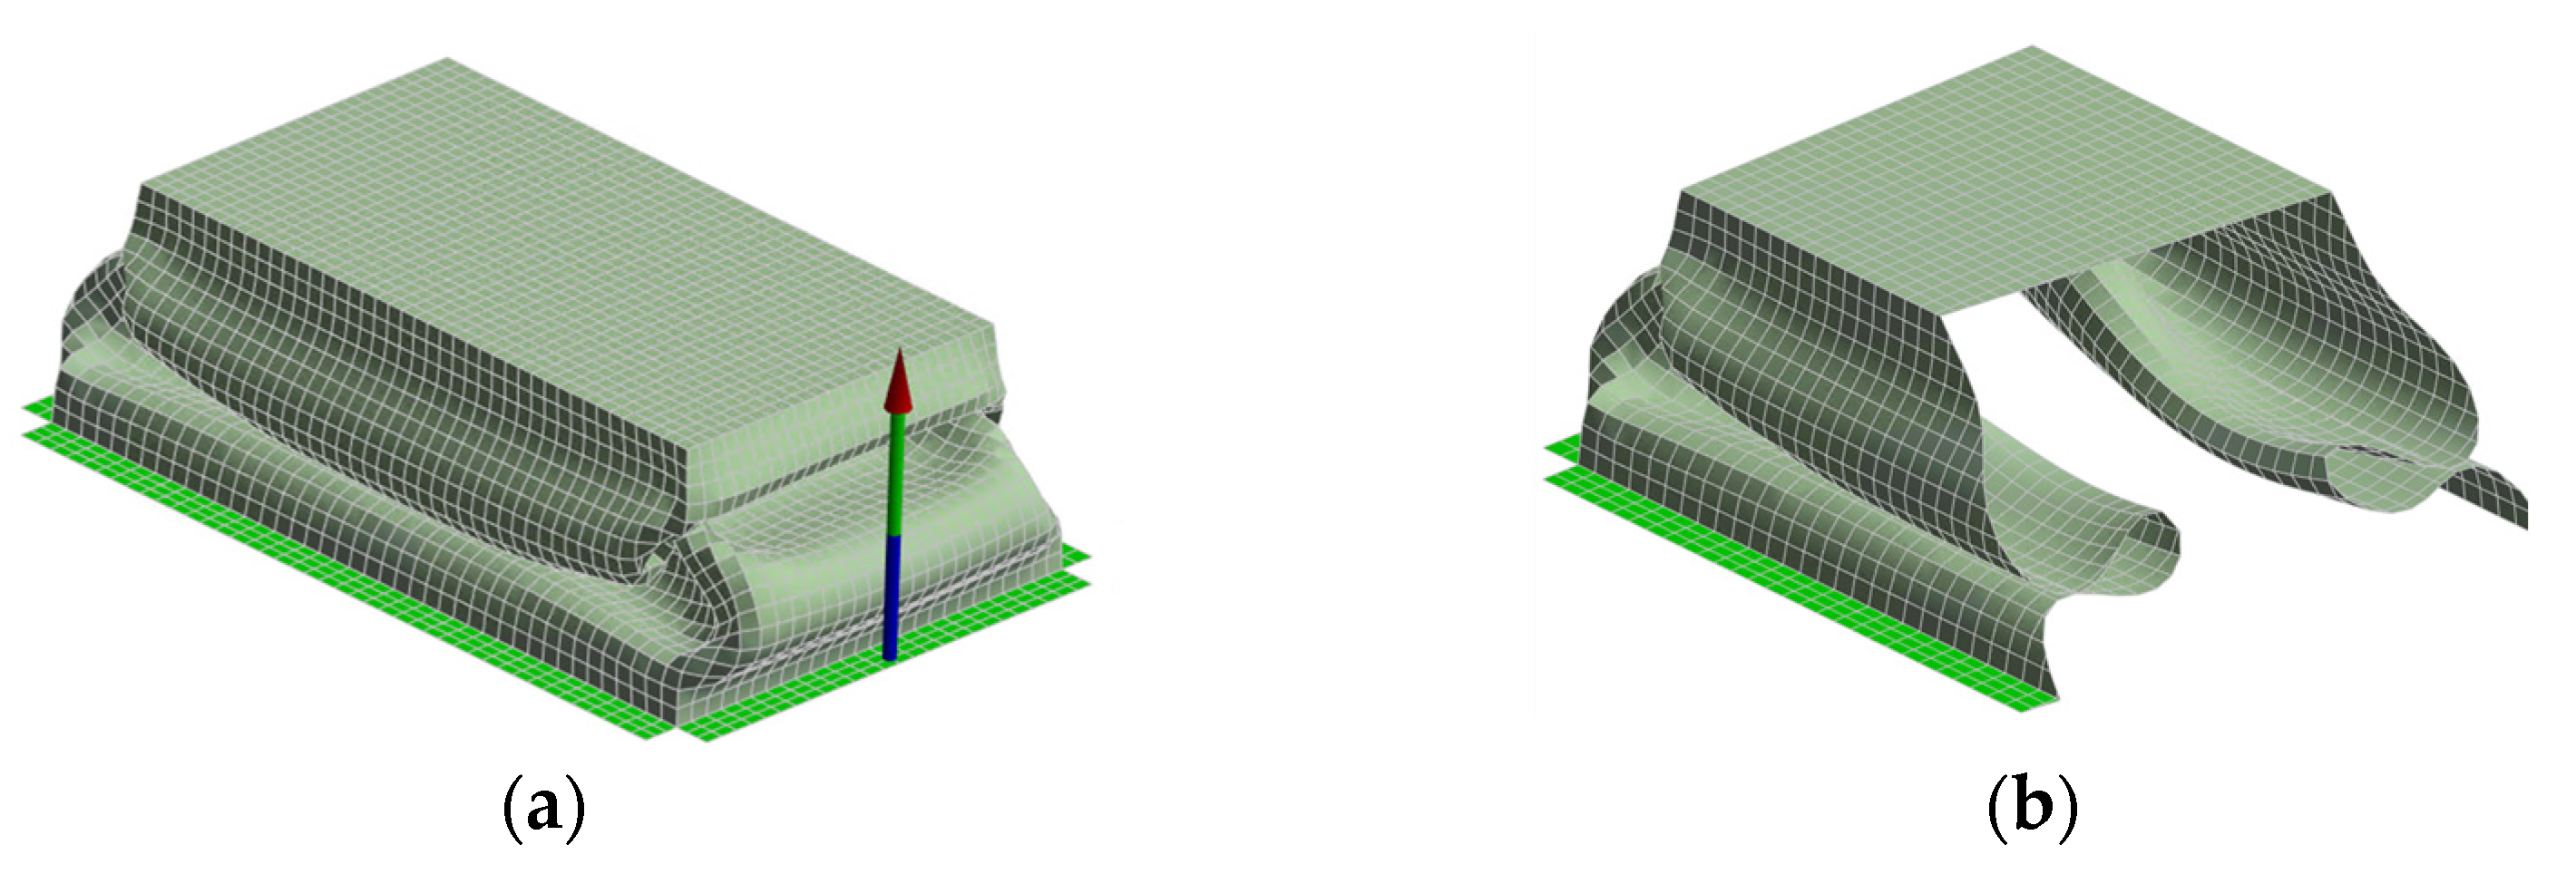
  • The simulation shows an expected increase in load slightly past the midpoint of the observed interval (‘c’ in Figure 7). This occurrence coincides with the moment when the folds encounter each other (as shown in Figure 4d and Figure 14), resulting in an apparent stiffening of the system. This behavior is likely attributed to an inaccurate interpretation of the contact conditions by the numerical model, which deserves to be investigated.
  • The assumption of confining the system between two plates serves as an initial approximation, significantly simplifying the analysis. However, it is important to recognize that this assumption deviates from reality. As depicted in Figure 10e, the bottom surface, in particular, is prone to slippage. Therefore, it becomes essential to consider other boundary conditions, even if it compromises efficiency, in order to accurately capture the system’s behavior.
Considering the combination of these phenomena, it may be advantageous to develop two separate numerical models. The first model would focus on providing a more accurate estimation of the elastic-plastic zone (0–15 kN). This initial phase is characterized by rapid changes, with the material transitioning to a plastic state in less than 1 s. Consequently, this phase resembles a crash analysis rather than a quasi-static analysis. On the other hand, the second phase involves slower changes, with the structure gradually deforming due to plasticization and hardening. In this case, the modeling complexity arises not from rapidly changing phenomena but rather from significant deformations and displacements, multiple contact points, and potential failures resulting from exceeding the ultimate strength, even though they may not be apparent in the specific scenario being studied. Additional details on the numerical model are provided below.

4.2. Material Data

It is evident that the behavior of the crash box structure is heavily influenced by the material properties. In the specific case at hand, the issue of material knowledge becomes even more significant due to a combination of factors:
  • Despite aluminum being a very well-studied metal, some of its mechanical properties are quite variable considering the alloys on the market. Once the alloy family and the treatment have been fixed, aspects such as density (ρ), Poisson’s ratio (ν), modulus of elasticity (E), and tangential modulus (Et) remain substantially constant. For instance, their values, as reported in Table 2, are truly representative of AA 6082-T6. However, it is not the same for tensile strength (Rm), yield strength (Rp0.2) and elongations, which are expressed only as minimum values assured by standards.
  • In the case of axial crushing, little changes in properties can have a strong influence. The ability to absorb energy, as well as to counteract an excessive force peak, is dependent on the yield strength, which identifies, essentially, when the stress/strain curve bends to enter the plastic regime. The plasticity permits absorbing great amounts of energy while also reducing the peaks of loads.
Figure 15 shows the relevance of material properties on the load vs. displacement curve comparing two materials that are very similar to each other: AA 6088 and AA 6061, both cases being T6. From Figure 15a, it is possible to observe the curves of (real) stress vs. (real) strain which confirm the similarity between the two alloys. Material data for AA 6061 were derived from [36], despite this material representing one of the most investigated aluminum alloys and very accurate information already available in the literature ([36,37,38,39,40]).
In particular, it can be noted that the behavior of the two materials practically corresponds in large part, starting from 300 MPa and 0.02 mm/mm, but this does not prevent doubling the maximum load (50 vs. 28 kN for AA 6088 and AA 6061, respectively).

4.3. True vs. Engineering Stress/Strain

As mentioned, the simulation has the need to incorporate material properties represented by true stress versus true strain curves. However, it is commonly observed in the literature that this critical information is not explicitly provided, indicating a tendency to overlook its significance. It is important to emphasize the importance of including accurate and comprehensive material property data in simulations, as it directly influences the reliability and validity of the results obtained. Properly accounting for the true stress–strain behavior of the material enhances the fidelity of the simulation and enables more accurate predictions and analyses. Equation (2) reports the well-known relationship existing (before necking) between true stress (σtr) and engineering stress (σE), and between true strain (εtr) and engineering strain (εE):
ε t r = ln 1 + ε E σ t r = σ E 1 + ε E
Minimal consequences are awaited within the elastic regime, as shown in Figure 15 where AA 6082 stress/strain curves for both true and engineering values are represented. The two trends are equal until the start of the plasticization zone (about 200 MPa and 0.02 mm/mm), but they then progressively differentiate themselves up to ~12–14%. This difference in values could be important in the physical problem investigated here since, as mentioned several times, the material exceeds its elastic limits almost immediately. In the specific case, however, it undergoes rather marginal changes (e.g., <5 KN on loads).

4.4. Exploring Modeling Assumptions

Alternative options of system modeling were investigated:
  • The physical system (i.e., the bumper) is subjected to a quasistatic load during testing. In a quasi-static analysis, the application of loads is time-dependent but occurs at a slow pace (i.e., mm/s), allowing for the neglect of inertial effects. In other words, the specific timing and inertial forces associated with the loading process are considered irrelevant. The focus is primarily on the equilibrium state and the progressive response of the system under gradually applied loads. The simulation of these situations should be carried out through an implicit analysis, more suitable for stationary problems or with loads gradually applied over time, offering greater numerical stability. At the same time, the explicit analysis was here preferred since it can offer several advantages such as (a) the accuracy in considering non-linearities (contacts, large displacements, and large deformations); (b) the possibility of splitting, paralleling, and speeding up the calculation (especially on multiprocessor systems). Preliminary attempts at implicit analysis were also made (using Ansys Workbench) without being convincing.
  • In a quasistatic simulation, as stated, its time duration (also called ‘end time’) is irrelevant since time should not exert any influence. However, an explicit analysis is specifically designed to capture the dynamic behavior of problems, making the application speed of loads relevant. Consequently, the selection of the simulation interval carries a certain level of significance. Matching it with the actual duration of the experimental test (175 s), even with a workstation equipped with 12 processors (i.e., Intel R, Xeon Gold 6240R, 2.4 GHz), the calculation times would span several weeks. Numerous attempts were made to strike a balance between calculation times and accuracy by scaling down the time duration to 10, 5, 1, and 0.1 s, resulting in corresponding calculation times of about 33, 11, 3, and 0.5 h, respectively.
  • Modifying the end time has notable consequences for both the initial and final regions of the load versus displacement curve (Figure 16). As expected, extending the calculation period reduces the visibility of discontinuities in the trends. However, the impact is more pronounced on deformed shapes that exhibit less closure, with larger and more pronounced deformed surfaces as the end time increases. At the same time, as the end time increases, the explicit analysis seems to lose the ability to recognize the initial sharp peak, flattening the response curve against incorrect shapes and values. All of this highlights the opportunity to optimize such a parameter on a case-by-case basis.
  • The conditions of application of loads and constraints deserve better attention due to the relevant (potential) impacts on the study. In the specific case, the lower base was fixed and the upper base with ‘bonded’ contact was here assumed; this was in line with several similar studies [22,41,42,43]. However, a ‘frictionless’ contact was also considered. As evident in Figure 17, despite minimal effect on the first part of the load/displacement response, a better correspondence emerges elsewhere (e.g., at 30–70 mm/mm).
Specifically, from Figure 18, where displacements are reported, it emerges that the upper surface, no longer bonded to the loading plate, can be swallowed (inwards) in the central part. This also changes the deflection on the lateral surfaces. Indeed, it is possible to observe how the side surfaces also appear to bend in a different way in the two contact cases (i.e., outward or inward for bonded or frictionless contacts, respectively, in the case of the larger lateral surfaces). This hypothesis (of frictionless contacts) is not correct in terms of outputs: during the test, in fact, the larger lateral surfaces bend outwards (as evident in Figure 4). For this reason, it was discarded with respect to a larger discussion. However, it was here introduced as an example of the aspects that could be differently considered within the scope of improving model accuracy.

5. Conclusions

The study of thin metal sheets subjected to external loads holds significant importance due to its wide-ranging theoretical and practical implications. This becomes even more interesting in the case of structures used for protective purposes, such as bumpers. The general focus of the present analysis was to enhance the predictive capabilities of a numerical model based on the finite element method through careful consideration of material properties and models. By comparing different modeling approaches, we evaluated these choices in relation to previous assumptions made by researchers and our own experimental measurements. The specific case investigated involved a slender crash-box structure, resembling a truncated pyramid, made of Al6082 aluminum alloy in 1.2 and 1.5 mm welded sheets and subjected to a concentrated load at the top (axial crushing), resulting in a significant (>45%) height reduction. This system exhibited high deformations (>15%) and displacements, presenting a complex scenario with various nonlinear effects. The research confirms that the chosen assumptions in material modeling play a vital role in determining the accuracy of results as well as computational efficiency. Among the investigated aspects, the appropriate modeling of the behavior of the metallic material emerged as a crucial factor. Considerations on the type of analysis (explicit and implicit), on the natural variability of alloy properties, and on the calculation times were also discussed.
In conclusion, this study emphasizes the importance of carefully considering material properties and appropriate modeling techniques in order to improve the predictions of numerical models for analyzing the behavior of thin metal sheets under external loads. Specifically, by proper considerations, it was possible to predict the peak loads with a significant accuracy (>95%), but also to investigate the structural behavior both during the initial elastic deformation and with respect to high plasticity.
The findings contribute to the broader understanding of complex structural systems and pave the way for more accurate simulations in the crash-box structure’s design [44].

Author Contributions

The authors C.F. and A.P. equally contributed to the design and implementation of the research, to the analysis of the results and to the writing of the manuscript. All authors have read and agreed to the published version of the manuscript.

Funding

This research received no external funding.

Data Availability Statement

Data available on request.

Acknowledgments

Special thanks to Giangiacomo Minak (University of Bologna, Italy) for his support during the experiments.

Conflicts of Interest

The authors declare no conflict of interest.

References

  1. Gross, D.; Ehlers, W.; Wriggers, P.; Schröder, J.; Müller, R. Mechanics of Materials—Formulas and Problems; Springer: Berlin/Heidelberg, Germany, 2017. [Google Scholar]
  2. Lu, G.; Yu, T.X. Energy Absorption of Structures and Materials; Elsevier: Amsterdam, The Netherlands, 2003. [Google Scholar]
  3. Jones, R.M. Buckling of Bars, Plates, and Shells; Bull Ridge Corporation: Blacksburg, VA, USA, 2006. [Google Scholar]
  4. Budiansky, B. Theory of buckling and post-buckling behaviour of elastic structures. Adv. Appl. Mech. 1974, 14, 1–65. [Google Scholar]
  5. Allaire, G. Numerical Analysis and Optimization: An Introduction to Mathematical Modelling and Numerical Simulation; OUP Oxford: Oxford, UK, 2007. [Google Scholar]
  6. Abdullah, N.A.Z.; Sani, M.S.M.; Salwani, M.S.; Husain, N.A. A review on crashworthiness studies of crash box structure. Thin-Walled Struct. 2020, 153, 106795. [Google Scholar]
  7. Xu, F.; Zhang, X.; Zhang, H. A review on functionally graded structures and materials for energy absorption. Eng. Struct. 2018, 171, 309–325. [Google Scholar]
  8. Sharpe, N.; Vendrig, R.; Houtzager, K. Improved design for frontal protection. SAE Tech. Pap. 2001, 6, 137. [Google Scholar]
  9. Pavlovic, A.; Fragassa, C.; Minak, G. Buckling Analysis of Telescopic Boom: Theoretical and Numerical Verification of Sliding Pads. Teh. Vjesn. 2017, 24, 729–735. [Google Scholar]
  10. Fragassa, C.; Minak, G.; Pavlovic, A. Measuring Deformations in a Telescopic Boom under Static and Dynamic Load Conditions. Facta Univ. Ser. Mech. Eng. 2020, 18, 315–328. [Google Scholar] [CrossRef]
  11. Baumgardt, G.R.; Fragassa, C.; dos Santos, E.D.; Rocha, L.A.O.; da Silveira, T.; Isoldi, L.A. Computational model verification and validation for the numerical analysis of elasto-plastic buckling due to combined loads of thin steel plates. Metals 2023, 13, 731. [Google Scholar] [CrossRef]
  12. Othman, A.; Fikri, M.; Jailani, A.; Ahmad, M.N. Finite Element Simulation of Off-Axis Crushing Performance of Polyurethane Foam Aluminium Alloy Tubes. In Proceedings of the 3rd International Conference on Engineering and ICT (iCEi2012), Melaka, Malaysia, 4–6 April 2012. [Google Scholar]
  13. Othman, A.; Iailani, A. Off-axis crushes simulation of thin-walled tapered tubes inserted with foam-filled structures. APCBEE Procedia 2014, 9, 395–400. [Google Scholar] [CrossRef]
  14. Kotelko, M.; Ferdynus, M.; Jankowski, J. Energy absorbing effectiveness–different approaches. Acta Mech. Autom. 2018, 12, 54–59. [Google Scholar]
  15. Muhammad, N.S.; Hambali, A.; Rosidah, J.; Widodo, W.S.; Ahmad, M.N. A review of energy absorption of automotive bumper beam. Int. J. Appl. Eng. Res. 2017, 12, 238–245. [Google Scholar]
  16. Su, J.; Lou, J.; Jiang, X. Optimized design of aluminium bumper by impact test and computer simulation analysis. J. Phys. Conf. Ser. 2021, 1952, 032067. [Google Scholar] [CrossRef]
  17. Hosseinzadeh, R.; Shokrieh, M.M.; Lessard, L.B. Parametric Study of Automotive Composite Bumper Beams Subjected to Low-Velocity Impacts. Compos. Struct. 2005, 68, 419–427. [Google Scholar] [CrossRef]
  18. Zahran, M.S.; Xue, P.; Esa, M.S.; Abdelwahab, M.M. A novel tailor-made technique for enhancing the crashworthiness by multi-stage tubular square tubes. Thin-Walled Struct. 2018, 122, 64–82. [Google Scholar]
  19. Jadhav, S.; Pawar, A.R. Investigate optimum shape of crash box analysis experimentally and numerically on geometry aspect. J. Anal. Comput. 2020, 16, 8. [Google Scholar]
  20. Shaikh, A.S.; Borkar, B.R.; Shinde, V.B. Vehicle crash box analysis of different shapes subjected to impact loading for minimum deflection using ANSYS. In Proceedings of the 2nd International Conference on Manufacturing Excellence (ICMAX-2019), Nashik, India, 15–16 February 2019. [Google Scholar]
  21. Du, B.; Li, Q.; Zheng, C.; Wang, S.; Gao, C.; Chen, L. Application of lightweight structure in automobile bumper beam: A review. Materials 2023, 16, 967. [Google Scholar] [CrossRef]
  22. Abdullah, N.A.Z.; Sani, M.S.M.; Salwani, M.S. Study of modal properties and crashworthiness performance of crash box numerical model with different joining modelling strategies. IOP Conf. Ser. Mater. Sci. Eng. 2021, 1062, 012008. [Google Scholar]
  23. Belytschko, T.; Ong, J.S.J.; Liu, W.K.; Kennedy, J.M. Hourglass control in linear and nonlinear problems. Comput. Methods Appl. Mech. Eng. 1984, 43, 251–276. [Google Scholar] [CrossRef] [Green Version]
  24. CEN EN573-3:2007; Aluminium and Aluminium Alloys—Chemical Composition and Form of Wrought Products—Part 3: Chemical Composition and Form of Products. European Committee for Standardization: Bruxelles, Belgium.
  25. CEN EN 755-2:2016; Aluminium and Aluminium Alloys—Extruded Rod/Bar, Tube and Profiles—Part 2: Mechanical Properties. European Committee for Standardization: Bruxelles, Belgium.
  26. CEN EN 485-2:2016; Aluminium and Aluminium Alloys—Sheet, Strip and Plate—Part 2: Mechanical Properties. European Committee for Standardization: Bruxelles, Belgium.
  27. Günzel, J.; Hauß, J.; Groche, P. Opportunities, challenges and influencing factors in the forming of preconditioned semi-finished products made of EN AW-6082 and-7075. Adv. Eng. Mater. 2023, 2201799. [Google Scholar] [CrossRef]
  28. Wang, T.; Hopperstad, O.S.; Lademo, O.G.; Larsen, P.K. Finite element analysis of welded beam-to-column joints in aluminium alloy EN AW 6082 T6. Finite Elem. Anal. Des. 2007, 44, 1–16. [Google Scholar] [CrossRef]
  29. Benson, S.; Downes, J.; Dow, R.S. Ultimate strength characteristics of aluminium plates for high-speed vessels. Ships Offshore Struct. 2011, 6, 67–80. [Google Scholar] [CrossRef]
  30. El-Rayes, M.M.; El-Danaf, E.A. The influence of multi-pass friction stir processing on the microstructural and mechanical properties of Aluminum Alloy 6082. J. Mater. Process. Technol. 2012, 212, 1157–1168. [Google Scholar] [CrossRef]
  31. Yibo, P.; Gang, W.; Tianxing, Z.; Shangfeng, P.; Yiming, R. Dynamic mechanical behaviors of 6082-T6 aluminum alloy. Adv. Mech. Eng. 2013, 5, 878016. [Google Scholar] [CrossRef] [Green Version]
  32. Kim, J.K.; Thomson, P.F. Forming behaviour of sheet steel laminate. J. Mater. Process. Technol. 1990, 22, 45–64. [Google Scholar] [CrossRef]
  33. Tsai, C.L.; Park, S.C.; Cheng, W.T. Welding distortion of a thin-plate panel structure. Weld. J. 1999, 78, 156-s. [Google Scholar]
  34. Leggatt, R.H. Residual stresses in welded structures. Int. J. Press. Vessel. Pip. 2008, 85, 144–151. [Google Scholar] [CrossRef]
  35. Kim, W.; Reddy, J.N. A comparative study of implicit and explicit composite time integration schemes. Int. J. Struct. Stab. Dyn. 2020, 20, 2041003. [Google Scholar] [CrossRef]
  36. Rui, Y.; Subic, A.; Takla, M.; Wang, C.H.; Niehoff, A.; Hamann, N.; Brueggemann, G.P. Biomimetic design of lightweight vehicle structures based on animal bone properties. Adv. Mater. Res. 2013, 633, 3–14. [Google Scholar] [CrossRef]
  37. Christy, T.V.; Murugan, N.; Kumar, S. A comparative study on the microstructures and mechanical properties of Al 6061 alloy and the MMC Al 6061/TiB2/12p. J. Miner. Mater. Charact. Eng. 2010, 9, 57–65. [Google Scholar]
  38. Sabry, I.; Ghafaar, M.A.; Mourad, A.H.I.; Idrisi, A.H. Stir casted SiC-Gr/Al6061 hybrid composite tribological and mechanical properties. SN Appl. Sci. 2020, 2, 943. [Google Scholar] [CrossRef] [Green Version]
  39. Teferi, F.T.; Kolhe, K.P.; Tsegaw, A.A.; Borena, T.G.; Avvari, M. The Advancement of Aluminium Metal Matrix Composite Reinforced with Silicon Carbide Particles (Al-6061/SiC p): A Review. In Advances of Science and Technology, Proceedings of the 9th EAI International Conference, ICAST 2021, Hybrid Event, Bahir Dar, Ethiopia, 27–29 August 2021; Proceedings, Part II; Springer International Publishing: Berlin/Heidelberg, Germany, 2021; pp. 326–336. [Google Scholar]
  40. NIST National Institute of Standards and Technology. 6061 Aluminium Alloys: Mechanical Properties. Available online: https://materialsdata.nist.gov/handle/11256/422 (accessed on 15 September 2022).
  41. Hussain, N.N.; Regalla, S.P.; Rao, Y.V.D. Comparative study of trigger configuration for enhancement of crashworthiness of automobile crash box subjected to axial impact loading. Procedia Eng. 2017, 173, 1390–1398. [Google Scholar] [CrossRef]
  42. Zarei, H.R.; Kröger, M. Crashworthiness optimization of empty and filled aluminum crash boxes. Int. J. Crashworthiness 2007, 12, 255–264. [Google Scholar] [CrossRef]
  43. Davoudi, M.; Kim, K. Energy Absorption Capability of Thin-Walled Structures with Various Cross Sections under Oblique Crash. Int. J. Steel Struct. 2022, 22, 1786–1797. [Google Scholar] [CrossRef]
  44. Pavlovic, A.; Fragassa, C. Investigating the crash-box-structure’s ability to absorb energy. Int. J. Crashworthiness, 2023; accepted. [Google Scholar]
Figure 1. Numerical model definition: (a) shape and dimensions (four tapered sides); (b) discretization by shell Fes (2D QUAD4); (c) imposed displacements and constraints.
Metals 13 01286 g001
Figure 2. Material model definition: (a) theoretical behavior; (b) discretization by multilinearity.
Metals 13 01286 g002
Figure 3. True stress vs. true strain for AA 6082, both for bilinear and multilinear approximations.
Metals 13 01286 g003
Figure 4. Structure deformation sequence in steps of 25 s/12.5 mm, at (a) 0; (b) 25; (c) 50; (d) 75; (e) 100; (f) 125; (g) 150 and (h) 175.
Metals 13 01286 g004
Figure 5. Load vs. displacement curve (in the case of structures made by 1.2 and 1.5 mm sheets) at (a) 0; (b) 25; (c) 50; (d) 75; (e) 100; (f) 125; (g) 150 and (h) 175.
Metals 13 01286 g005
Figure 6. Residual deformation (in the case of 1.5 mm sheets): (a) perspective; (b) top and (c) lateral views.
Metals 13 01286 g006
Figure 7. Comparing measures and simulations through the load vs. displacement curves with (ac) representing zones in which the curves diverge from each other.
Metals 13 01286 g007
Figure 8. Predicted deformation sequence at (a) 0; (b) 25; (c) 50; (d) 75; (e) 100; (f) 125; (g) 150 and (h) 175.
Metals 13 01286 g008
Figure 9. Predicted (equivalent) stress sequence at (a) 0; (b) 25; (c) 50; (d) 75; (e) 100; (f) 125; (g) 150 and (h) 175.
Metals 13 01286 g009
Figure 10. Predicted (transversal) strain sequence at (a) 0; (b) 25; (c) 50; (d) 75; (e) 100; (f) 125; (g) 150 and (h) 175.
Metals 13 01286 g010
Figure 11. (Equivalent) Stress and (total) strain trends vs. displacement.
Metals 13 01286 g011
Figure 12. Equivalent stress distribution in elastic (a), plastic (b), and hardening (c) regimes for displacements of 2, 15, and 40 mm, respectively.
Metals 13 01286 g012
Figure 13. Aspects which can affect the model’s accuracy: (a) geometrical gaps; (b) misalignments or non-planarity; (c) sheet bending and welding; (d) secondary contacts; (e) slips.
Metals 13 01286 g013
Figure 14. Large secondary contacts between the surfaces begin to emerge: (a) whole and (b) cutaway geometry.
Metals 13 01286 g014
Figure 15. Effects of changes in the (a) stress/strain behavior and (b) load/displacement response.
Metals 13 01286 g015
Figure 16. Effects of changes in the end time of the explicit simulation.
Metals 13 01286 g016
Figure 17. Effects of changes in the contact conditions.
Metals 13 01286 g017
Figure 18. Effects of changes in contact conditions (displacements): (a) bonded; (b) frictionless.
Metals 13 01286 g018
Table 1. EN AW 6082 chemical composition in % by weight (Ref. EN 573-3 [24]).
SiFeCuMnMgCrZnTiOthersAl
0.70–1.300.50 max0.10 max0.40–1.000.60–1.200.25 max0.20 max0.10 max0.05 totbalanced
Table 2. AA 6082-T6 main mechanical characteristics (Ref. EN 755-2 [25] and EN485-2 [26]).
Characteristics UnitEN755-2EN485-2Used
Density ρkm/m3270027002700
Poisson’s ratio ν---0.330.330.33
Modulus of elasticityEMpa69,00069,00069,000
Tangential modulus EtMpa26,00026,00026,000
Tensile strength (min)RmMpa270310360
Yield strength (min)Rp0.2Mpa230260230
Elongation at break (min)A50mm%6615
Table 3. Notable points detected during the experiments.
ThicknessParameterOffsetMaxbcdefghResidual
1.5 mmDisplacementmm1.28.612.525.037.550.062.575.087.57.0
LoadkN1.627.624.914.311.511.211.310.89.90.0
1.2 mmDisplacementmm1.66.412.525.037.550.062.575.087.56.6
LoadkN0.924.114.88.87.010.18.38.910.40.0
Disclaimer/Publisher’s Note: The statements, opinions and data contained in all publications are solely those of the individual author(s) and contributor(s) and not of MDPI and/or the editor(s). MDPI and/or the editor(s) disclaim responsibility for any injury to people or property resulting from any ideas, methods, instructions or products referred to in the content.

