Article

Effect of Brazing Fillet on the Microstructure and Mechanical Properties of Vacuum Brazing Stainless Steel Joints

1
School of Mechanical and Power Engineering, Nanjing Tech University, Nanjing 211816, China
2
College of Mechanical Engineering, Yangzhou University, Yangzhou 225127, China
*
Authors to whom correspondence should be addressed.
Metals 2023, 13(8), 1369; https://doi.org/10.3390/met13081369
Submission received: 16 June 2023 / Revised: 22 July 2023 / Accepted: 25 July 2023 / Published: 30 July 2023
(This article belongs to the Section Welding and Joining)

Abstract

:
The enhancement mechanism of the fillet on brazing joints is of great significance for vacuum brazing technology. Although a lot of research on the enhancement mechanism of the fillet has been carried out, some key components of a comprehensive systematic enhancement mechanism for brazing fillets have yet to be established. In this paper, the enhancement mechanism for brazing fillets of SS304/pure copper brazing joints was studied by both experimental and numerical simulations. The SEM and tensile experiments were used to characterize the microstructure and shear strength of the brazing joints. The results show that the brazing joints, using 60 µm thick pure copper filler metal, exhibit a good microstructure in the brazing seam; however, its mechanical properties are lower than those found in specimens with a thickness of 90 µm. The fracture behaviors of brazing joints were also investigated, the fracture of the brazing seam was a fracture of mode II due to shear stress, while the fracture of the brazing fillet was caused by a combination of tensile stress and shear stress (mode I and mode II).

1. Introduction

AISI 304 is a widely utilized austenitic steel [1], owing to its exceptional properties, and has found applications in heat exchangers, cooling systems, and generators [2]. Nevertheless, with the high demand for large-scale applications, geometry complexity inevitably introduces discontinuous assembly interfaces, which restrict the use of high-strength structural components to reliable joining technologies. In comparison to other common joining methods, such as laser welding, argon-arc welding, and resistance welding, vacuum brazing offers the advantage of being contamination-free [3]. Additionally, using vacuum brazing 304, removing surface oxides becomes easy, resulting in a more reliable metallurgical bond between the contact surface and brazing alloy [4,5]. These benefits make vacuum brazing an attractive option for joining high-strength complex structural components.
In recent years, significant efforts have been made by researchers to investigate the strength mechanism of brazing joints. To address the issue of residual stresses generated during solidification, caused by the difference in thermal expansion coefficients and plastic deformation capacity between the base material and the filler metal, various approaches have been proposed. For example, Wang et al. [6] employed an additive manufacturing process to add three thermal expansion coefficient transition layers between TC4 and ZRC-SIC, resulting in a flat thermal expansion coefficient gradient between the two materials. Another technique involves the use of an interlayer to introduce thermal expansion coefficient transition layers. Wei et al. [7] utilized a Cu foam interlayer placed in the middle of the filler metal to form a new solder structure. This approach significantly improved the shear strength by approximately 70%, compared to brazed joints without a Cu-foam interlayer. These innovative strategies enhanced the strength of brazing structural components and reduced the occurrence of residual stresses during the solidification process. Surface microstructure fabrication has been used to extend the size of the brazing surface area, while reducing residual stresses, thereby significantly improving the overall strength of brazing structural components. Jiang et al. [8] employed a micro-pit structure, which increased tensile strength by 153% and shear strength by 317%, compared to the original smooth surface. This approach was based on the principle of creating a surface microstructure on the brazing interface, which increased the contact area and enhanced the bonding strength between the brazing material and the base material. In another study, Zhang et al. [9] utilized femtosecond laser patterning with different power densities to process the surface of base metal, while the finite element simulations were used to analyze the residual stress distribution. The results revealed that the residual stresses in the patterned areas were transformed into compressive stresses, which helped to improve the mechanical properties. Moreover, the surface treatment of base materials has gained significant attention from researchers in recent years. In a study by Gao et al. [10], the effect of various surface pretreatments on the brazing joints of ALASI50 alloy was investigated. Four surface treatments, namely nickel plating, 120# sandpaper polishing, H2SO4 etching, and sandblasting, were applied to the base material surface. The results indicated that the use of nickel plating could significantly improve the wettability of the brazing material. Similarly, Venkateswaran et al. [11] employed Cu–Ag–Mn–Zn filler metal to braze stainless steel with a nickel-based coating and found that the joint with nickel-based coatings could prevent fractures at the interface between the brazing filler and base material. In recent years, the development and optimization of filler materials have also attracted a significant number of scholars. Liu et al. [12] studied the addition of graphene to the BNi-2 brazing material during the brazing of GH99 high-temperature alloy and found that graphene could mitigate atomic diffusion and precipitation of brittle borides. Jing et al. [13] developed a new high-strength vacuum brazing intermetallic compound technique and validated the optimized brazing material through EET simulation. This technique could predict the width and strength of the brazing seam at different temperatures. Finally, an improvement in the brazing process has also maintained a certain degree of attention. Here, Zhang et al. [14] investigated the effect of brazing temperature on the organization and mechanical properties of Ni–Cr–P-brazed high-nitrogen austenitic stainless-steel joints. The study demonstrated that increasing the brazing temperature can reduce the production of Cr2N. Similarly, Tillman et al. [15] investigated the effect of holding time on vacuum brazing tool steel with BNi-2 brazing material and found that changing the holding time from 25 to 90 min increased the Fe/Ni value in the brazing seam, resulting in a significant increase in the tensile strength of the brazed structure from 815 to 1351 MPa.
There also have been a number of innovations in recent years to improve the quality of bonding, such as impulse pressure [16], nanoparticles [17], and pulsed-electric current [18]. AlHazaa et al. [19] used the Preferred Reporting Items for Systematic Reviews and Meta-Analyses (PRISMA) methodology to study impulse pressure-assisted diffusion bonding and found that varying the pressure can, indeed, reduce bonding times in diffusion bonding and reduce the requirements for pre-bond surface preparation. Li et al. [20] used a novel Cu/W nano-multilayer film and impulse pressure-assisted diffusion bonding to improve the tensile strength of the joint by reducing the formation of brittle compounds during the bonding process. Akhtar et al. [21] employed the addition of nanoparticles, which changed the mechanism of the bonding and shortened the period of the process. Saltık et al. [22] incorporated the SiC particle and studied the influence of the size and content on the wetting behavior and brazing performance, discovering that adding the 2 wt.% nano-sized SiC produced greater overall mechanical performance. Nakao et al. [23] investigated the bonding characteristics between the solid-state bonding of oxygen-free copper (OFC) and SUS304 austenitic stainless steel. The research indicated that increasing the bonding temperature and pulse pressure would enhance the overall structural strength. Lin et al. [24] utilized the pulsed electric current to achieve a reliable full-ceramic interface of ZrC–SiC composite at low temperatures.
In addition to the above-mentioned recent studies on the strengthening mechanism of brazing structural parts, some scholars have also noticed the overall strengthening effect of fillets on brazed structural parts. Eustathopoulos, N [25] proposed that when the contact angle between the base material and the solder is less than 45° and the assembly is in the form of sandwich brazing, a meniscus fillet may spontaneously form outside the brazing gap and reduce the thickness of the brazing seam. Jiang et al. [26] found that increasing the thickness of the filler metal would improve the fillet of the plate-fin structure and the strength of the structure. However, when the thickness of the filler metal continued to enlarge, the generation of more brittle phases would result in a decrease in the tensile strength of the plate-fin structure. Meanwhile, Luo et al. [27] optimized the brazing parameters by increasing the thickness of the filler metal to 200 μm, which allowed the brazing fillet to reach the maximum height, while the tensile strength of the thin-walled structure could reach 620 MPa. Nassiraei et al. [28] studied the stress concentration factors in tubular T-joints with an external ring under the in-plane bending moment and found that the ring weld could substantially reduce the SCF; however, more importantly, the authors found that employing a large number of finite element calculations could determine an accurate formula, which accurately evaluates the stress concentration factors in joints with an external ring. Tsutsumi et al. [29] discovered that decreasing the weld toe stress concentration could maximally increase the low-cycle fatigue life of welded joints. Baek et al. [30] investigated the structural integrity of weld joints and demonstrated that the structural reliability on the tensile load in weld joints would decrease when the wall thickness ratio exceeded 1.5. Ragavendran, M et al. [31] suggested that narrow welds could prevent the occurrence of hot cracking. Finally, Han et al. [32] utilized particle-reinforced composite brazing material and vacuum brazing to optimize the microstructure and mechanical properties of the fillet, which led to a significant increase in the overall strength of the component. To the author′s knowledge, some key components of a comprehensive systematic enhancement mechanism for brazing fillets have yet to be established, even though the enhancement mechanism of brazing fillets on brazing specimens has been studied previously.
In this paper, AISI 304 was used as the base material, and pure copper foil was employed as the brazing material. In the prepared pure copper filler metal, two different thicknesses were used. Then, a series of standard experimental methods were used to investigate the microstructure, elements distribution, tensile strength, and fracture morphology of the brazing specimens. Additionally, the crack propagation and the stress distribution in the specimens were also explored by numerical simulations.

2. Experimental Materials and Methods

2.1. Specimen Preparation

In this study, the chosen base material was AISI 304 stainless steel, while commercially available pure copper foil was selected as the brazing filler. The chemical composition of materials is presented in Table 1. It can be seen from Table 1 that commercially available pure copper has only trace amounts of S, Fe, P, Ni, and Si elements, and the rest are Cu and Ag elements. Specimens were cut of 304 stainless steel plates. As shown in Figure 1, the sheer strength of the brazing joint was used in the experiment with a nominal overlapped length of 3 mm. Pure copper foil with two different thicknesses was placed between substrate materials. A 60 µm thick copper foil was used, denoted as specimen THN, alongside a 90 µm thick copper foil, denoted as specimen THK. All specimens were carefully sanded with 2000# sandpaper, in parallel with the width direction of the base material. Additionally, the solder was precisely cut to size and thoroughly cleaned with alcohol, using ultrasonic techniques before being sealed with an acetone wipe.
The VHB-6612 vacuum brazing furnace and brazing joint clamp are shown in Figure 2a. The vacuum brazing furnace mainly consisted of a heating system, a vacuum system, a cooling system, and a control system. The vacuum level in the furnace was kept below 0.01 Pa during the whole brazing process. Figure 2b shows the brazing process. The specimen was subjected to furnace heating until a temperature of 1000 °C was reached, following which, a 30 min insulation period was observed to ensure uniform temperature distribution across all regions of the joint. Subsequently, the temperature was raised to a brazing temperature of 1150 °C, and the specimen was held at this temperature for 25 min. The furnace was allowed to cool naturally when the heating cycle is completed, which brought the specimen temperature down to 900 °C. After this stage, the vacuum was released, and a substantial quantity of nitrogen gas was introduced into the furnace chamber, while the fan was activated to facilitate forced cooling. The process was continued until the specimen temperature was reduced to 80 °C.

2.2. Test Setup

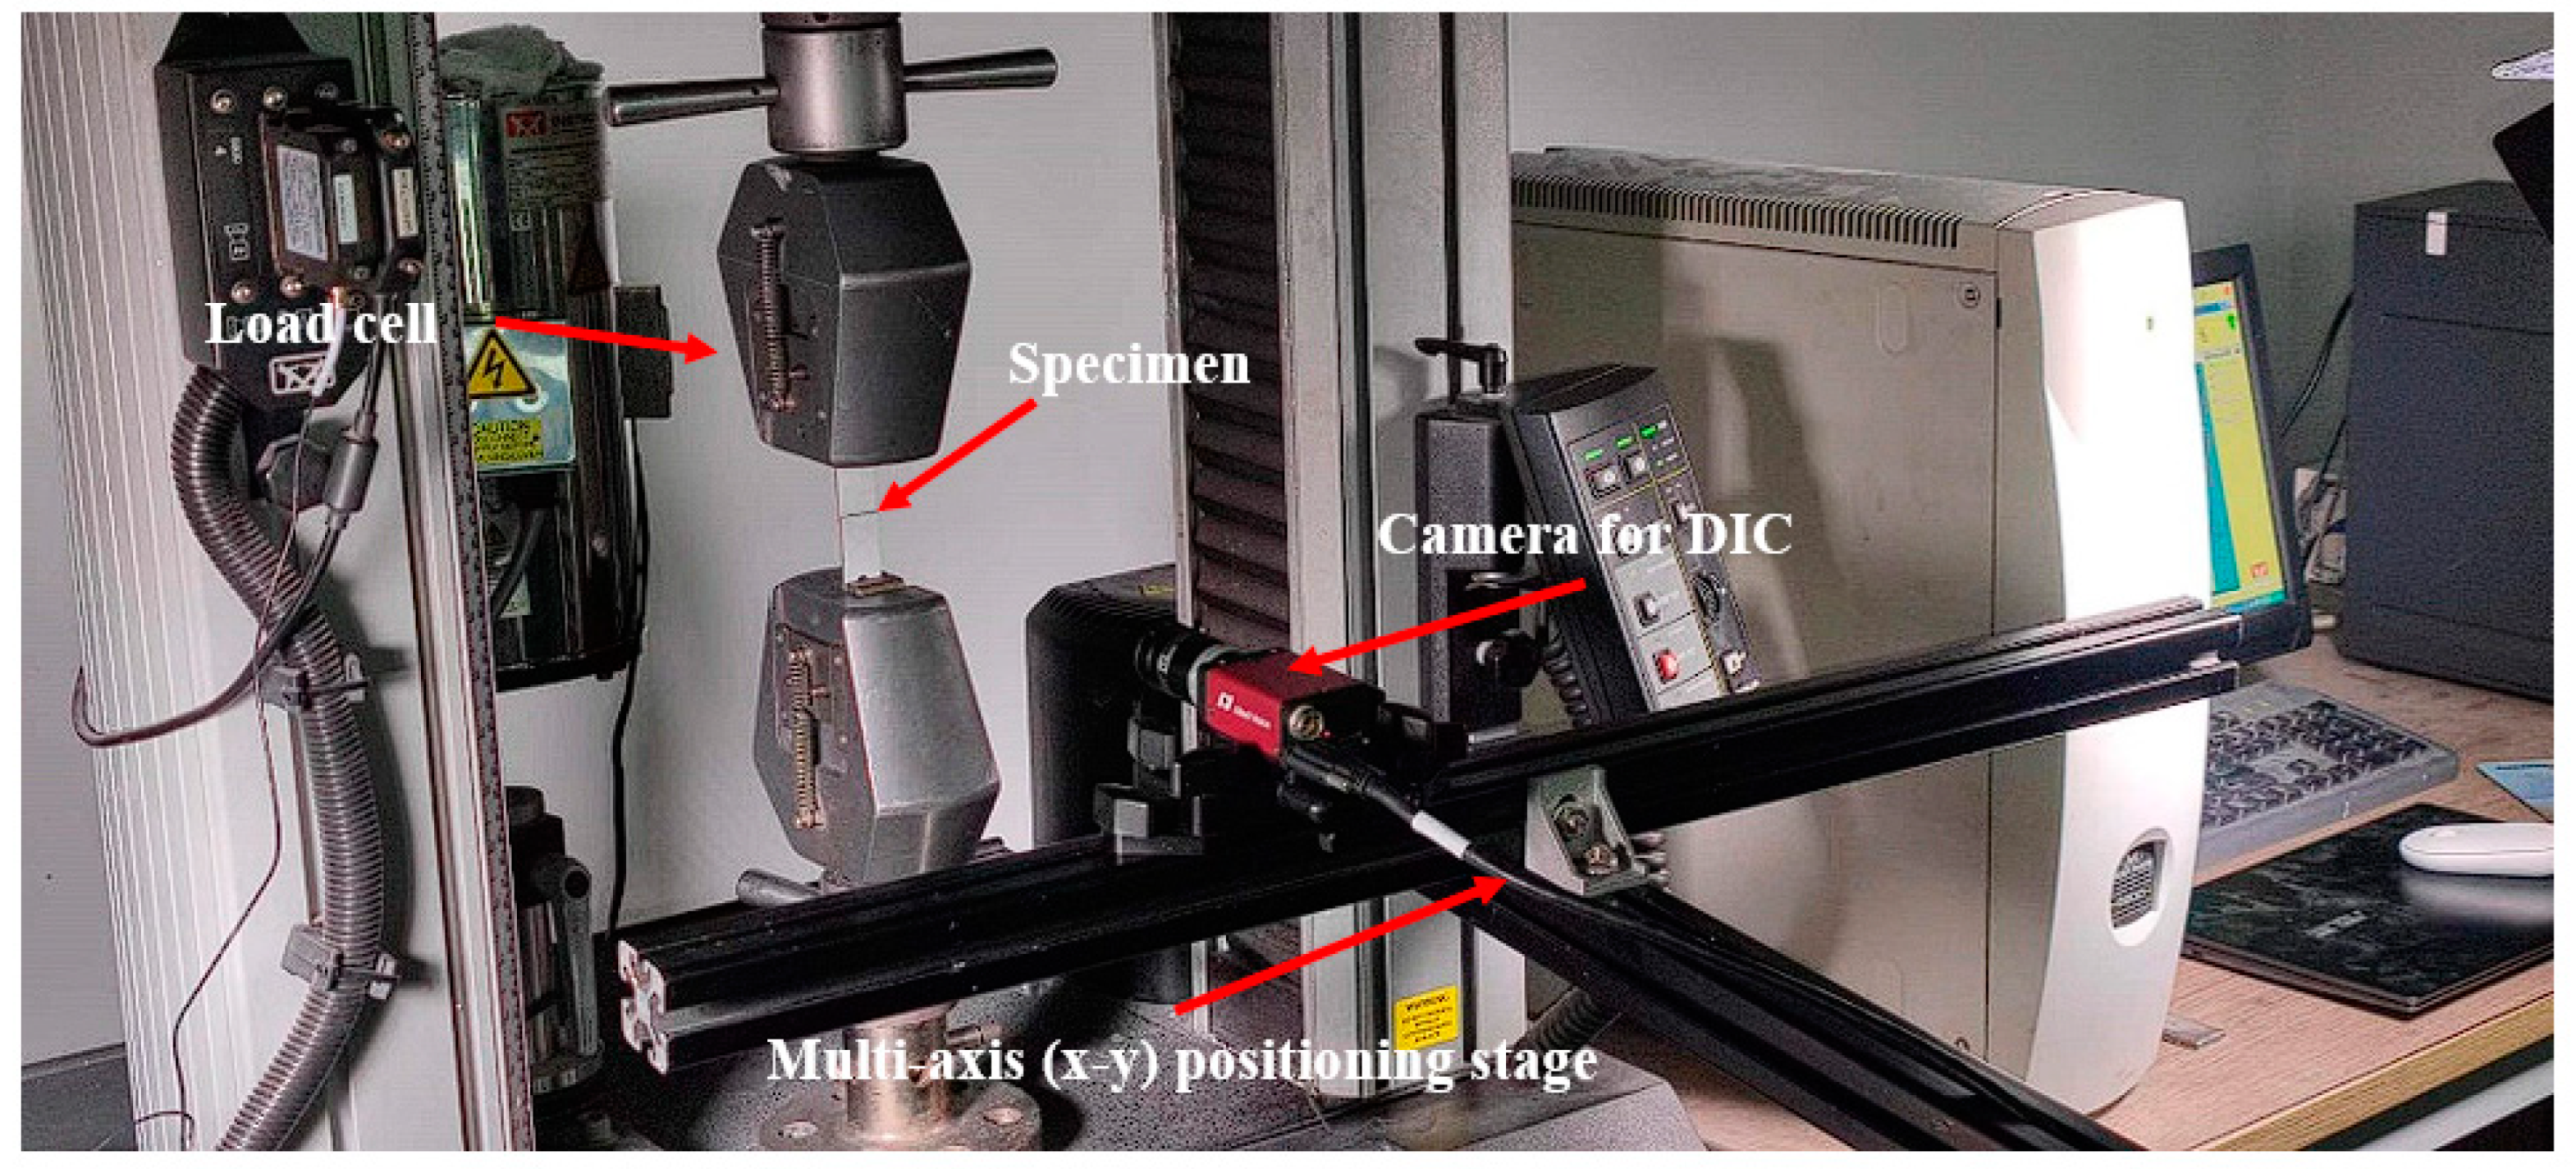
The experimental setup is shown in Figure 3. It consisted of the load cell, tested specimen, and the digital image correlation (DIC) system. With respect to the load cell, the test specimen was carried out using an INSTRON 5869 material testing machine. To conduct the tensile test, the test specimen was initially secured to the designated position of the testing machine with a bolt. Then, a slight pretension was applied to the specimen through pre-tensioning operations to ensure proper alignment with the collet. The lap specimen was subsequently clamped. Subsequently, the testing machine was loaded at a continuous rate of 0.2 mm/min until the specimen sustained damage.
Part of the specimens were painted, to create speckle patterns that performed strain field measurements, via DIC. The optical system was equipped with a single CCD camera, with a resolution of 2452 × 2056 pixels2. Additionally, a subset size of 21 × 21 pixels2 was used, and ZNSSD was adopted in postprocessing as the calculation criterion. Gaussian prefiltering was used to reduce the error. Then, the affine shape function and bilinear quadrilateral polynomial interpolation were used to analyze the thickly filtered image set. For mobility and adaptability, the optical system was mounted on a multi-axis (xy) positioning stage (for fine adjustments) in a tripod facing the testing machine.
The microstructure of the brazed joints was characterized using optical microscopy and scanning electron microscopy by energy disperse spectroscopy (SEM, JSM-6360LV).

3. Experimental Results

3.1. External Morphological Characteristics near the Brazed Region

3.1.1. Visual Inspection of Brazed Joints

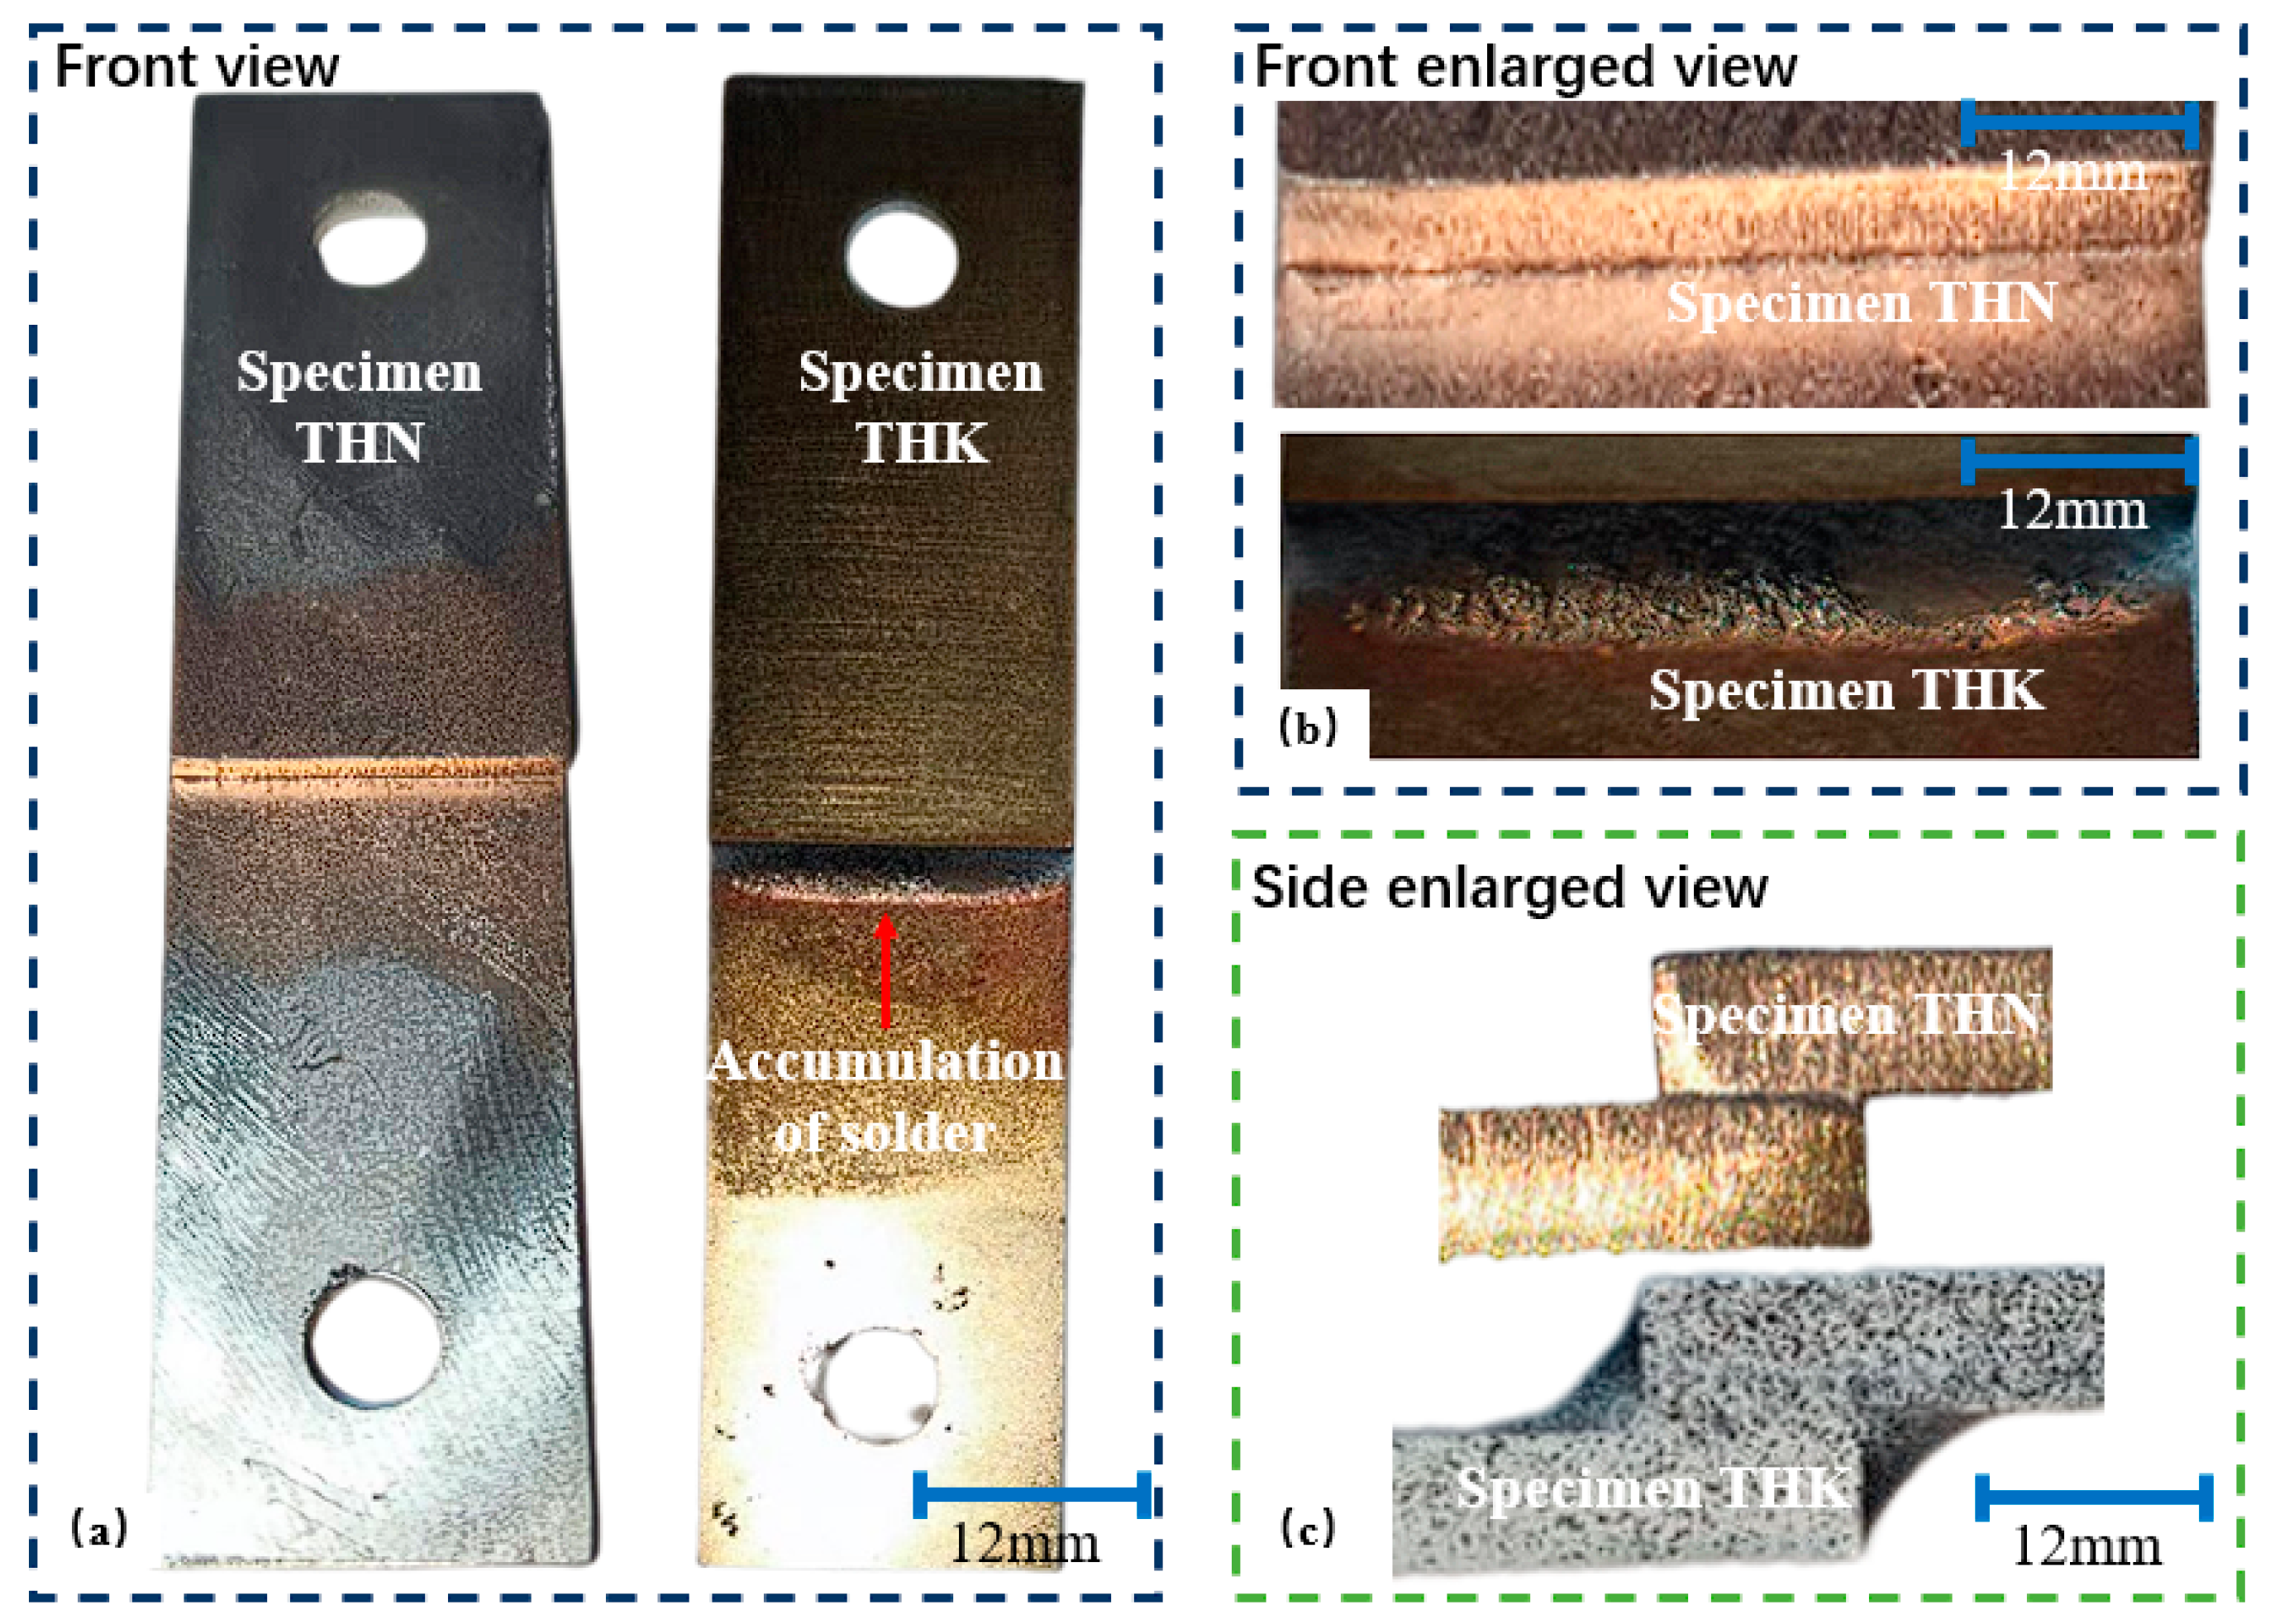
Figure 4 presents the visual inspection of the typically tested joints after brazing, including the specimens THK and THN. It can be clearly seen from Figure 4a,b that a large amount of copper solder accumulated near the free edges of the THK specimens due to their larger quantity of copper brazing filler, even though perfect bonding, namely intact brazing seams, could be found in the overlap area of the tested specimens, with both thick and thin filler thicknesses. Additionally, the side enlarged view, as shown in Figure 4c, more clearly demonstrates the accumulation of copper solder in THK specimens.
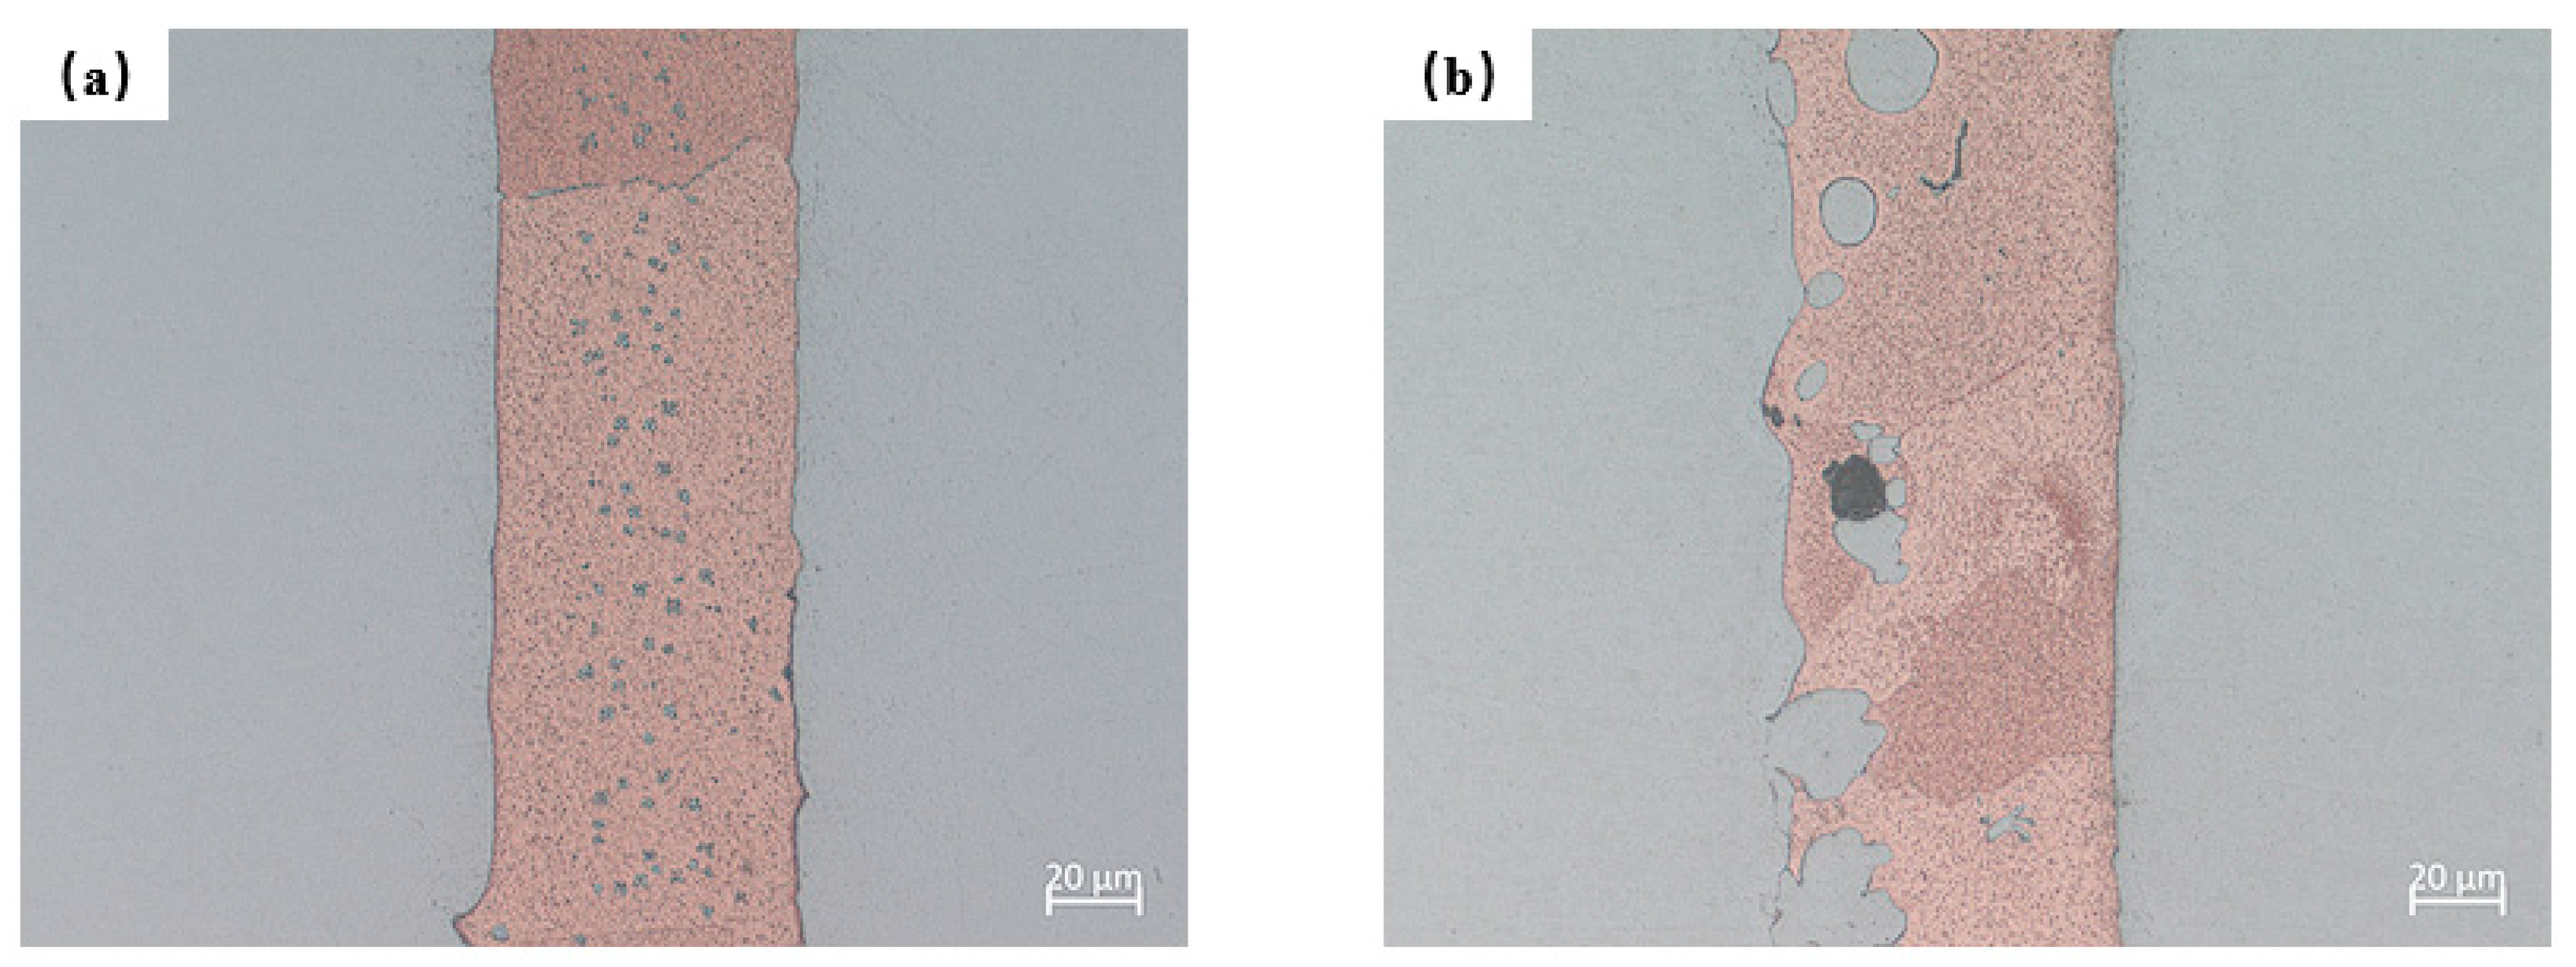
The metallographic structures of the THN brazing seam are depicted in Figure 5a. The interface between the copper brazing material and the stainless steel appears flat, while, more importantly, there were no defects in the brazing seam, such as cavities, impurities, cracks, or regions that were not brazed. Brazing the seam of the THN specimen also depicts a lot of dots and some lineaments, which appear to match the base material′s color, and will be characterized in the following Section 3.2.1.
Figure 5b shows the brazing seam of specimen THK. In contrast to specimen THN, the brazing interface of specimen THK appears more uneven with more large islands formed in the brazing seam. Additionally, gaps, cavities, and cracks are present in the seam, which indicates that the bonding between the filler metal and base metal of the specimen THK is poor.

3.1.2. Metallographic Structures of the Brazing Fillet

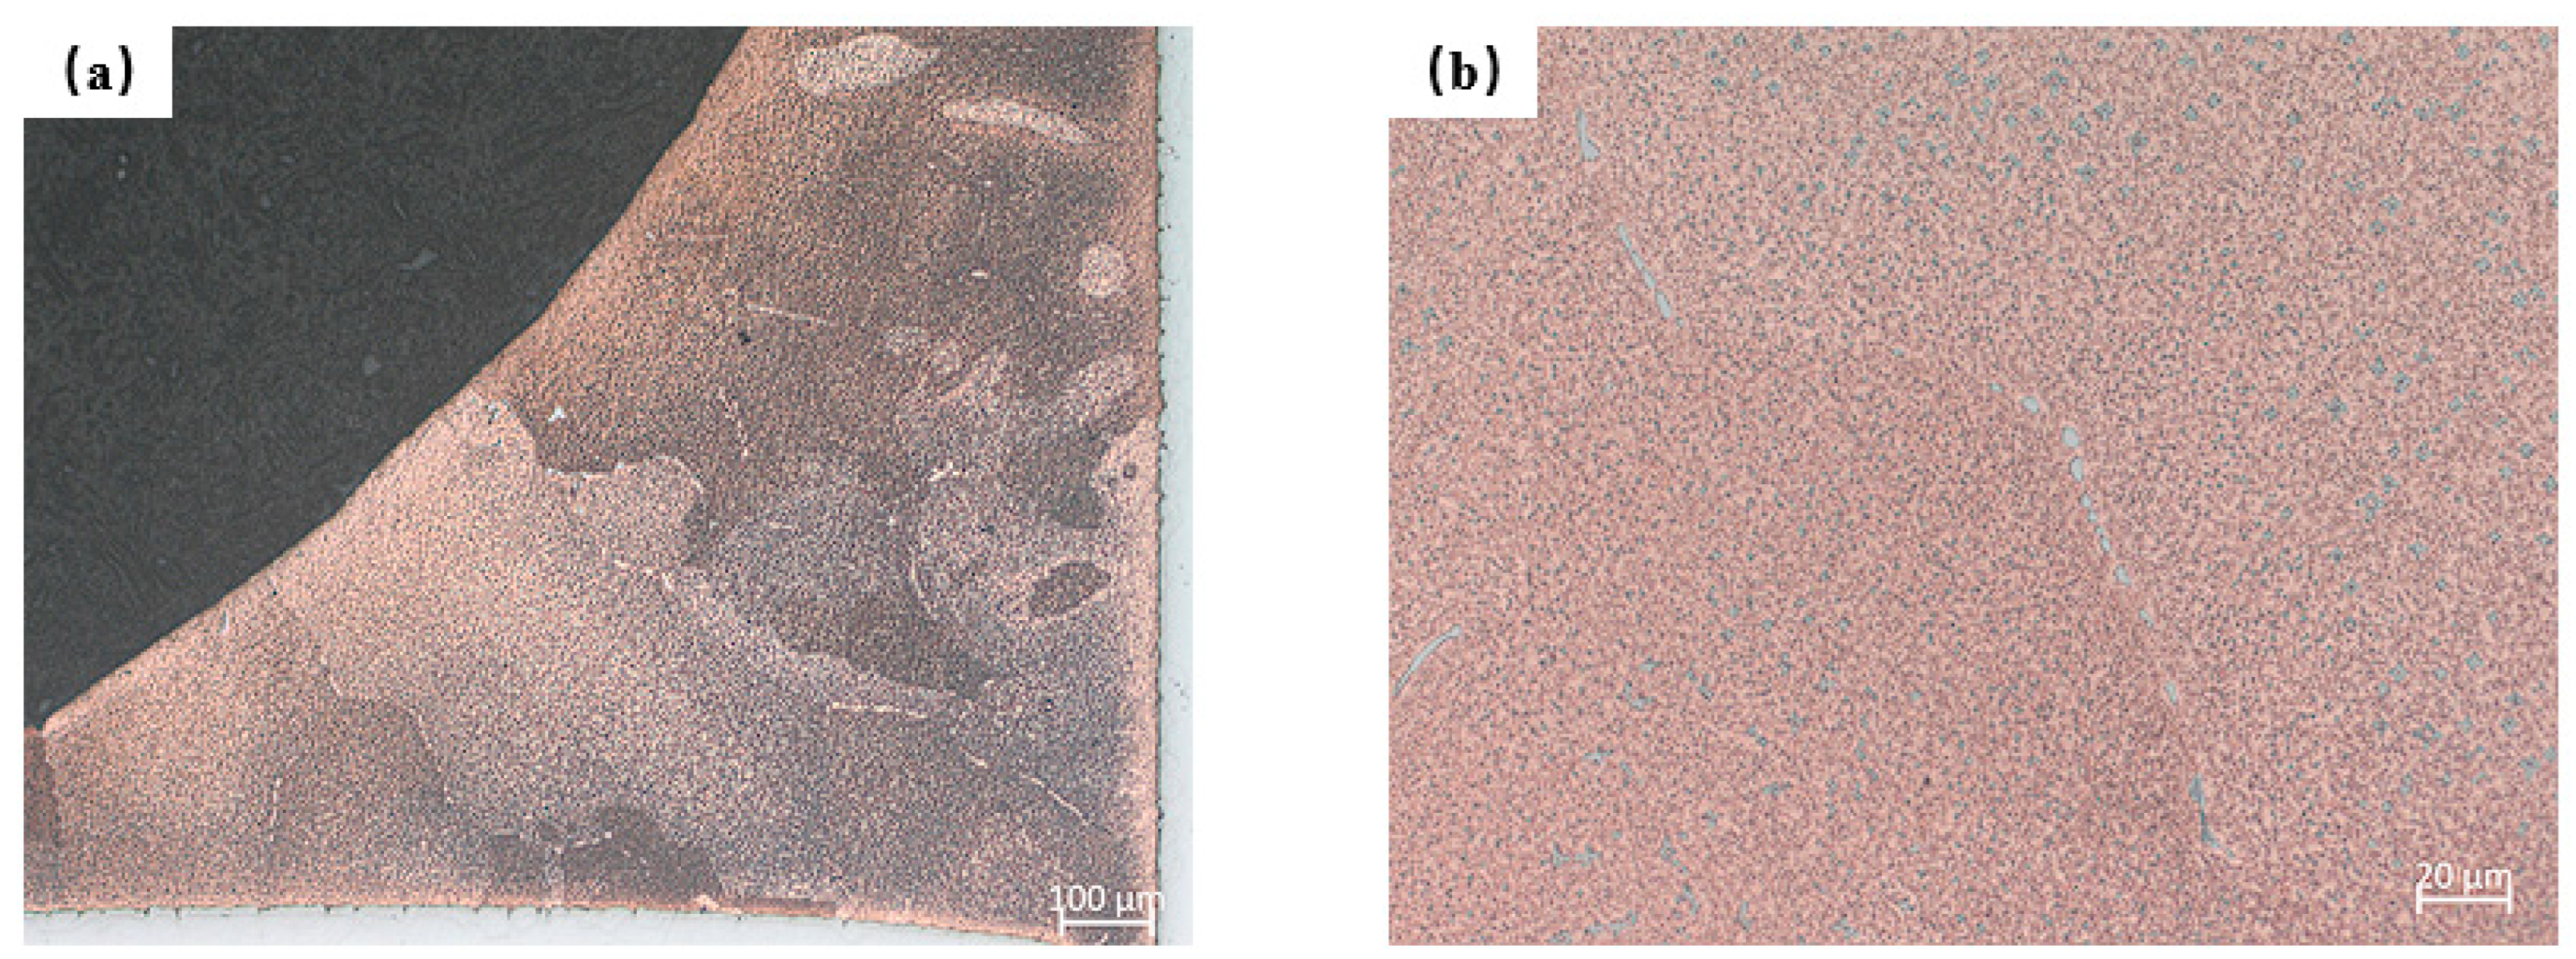
The metallographic structures of the meniscus fillet are shown in Figure 6. Combining Figure 6a,b, it can be observed that the entire fillet area displays a good morphology without any defects. Similarly, the brazing seam of the specimen THN also presents a lot of dots and some lineaments, which could be inferred as the element being enriched with Fe, according to the chemical characterization, presented in the following Section 3.2.1.

3.2. Content and Distribution of Major Elements

3.2.1. In the Brazing Seam

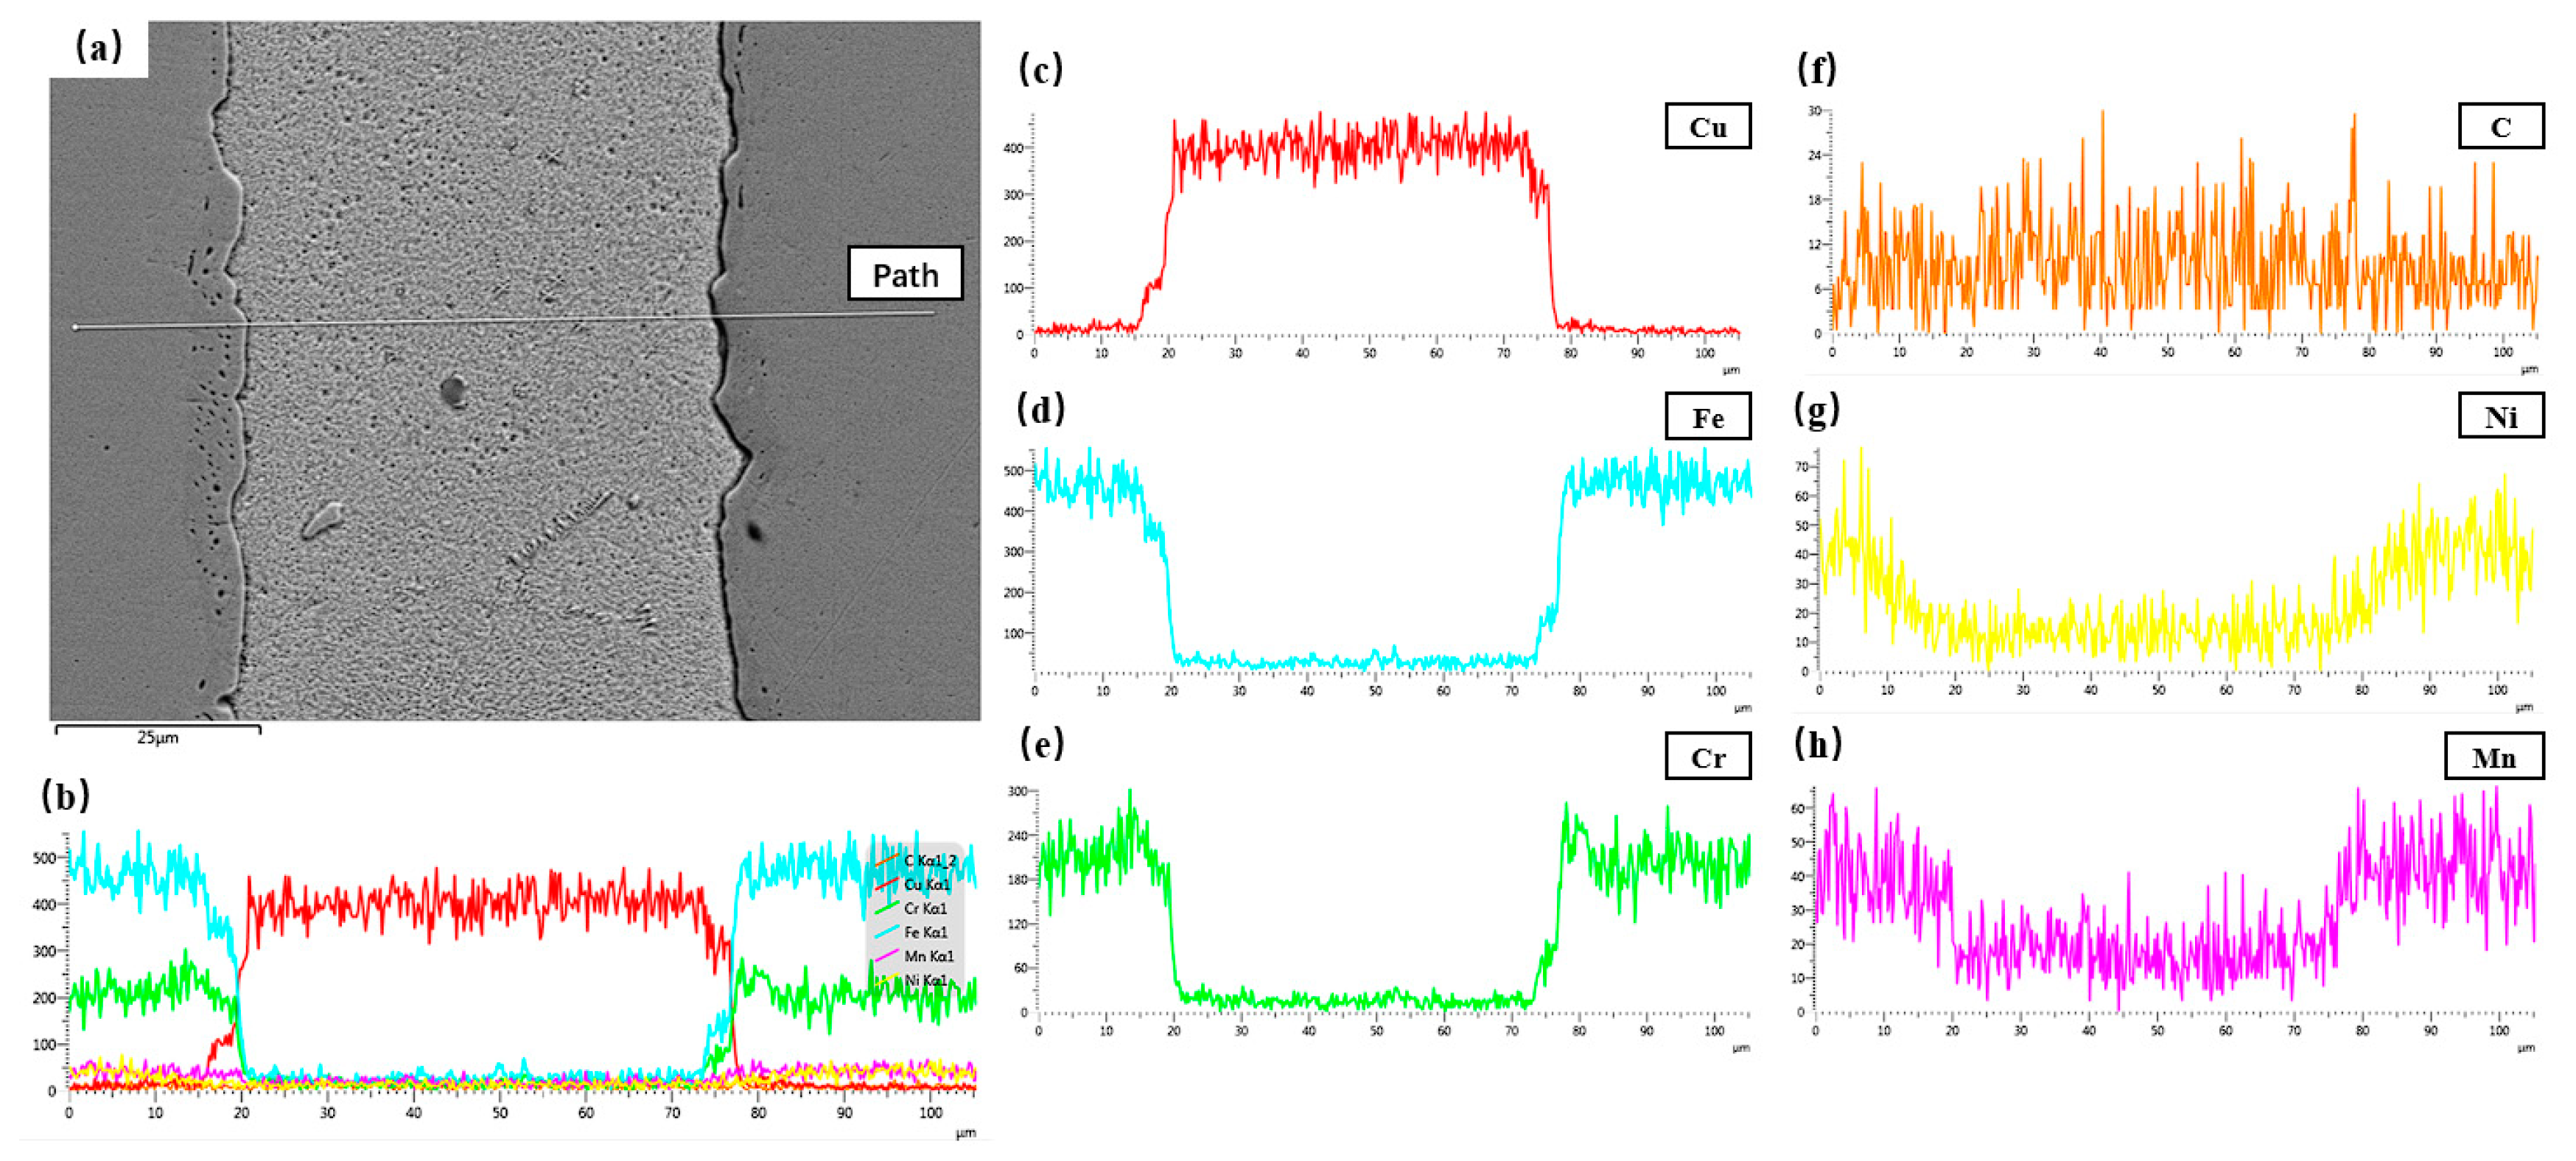
The conducted experiments have revealed that, upon avoiding islands and lineaments, the element distribution in the EDS line scan in the brazing seam of both specimen THN and specimen THK is nearly identical. Therefore, only the result of the EDS line scan in specimen THN is presented in this paper. As displayed in Figure 7d, the Fe element content experienced a significant drop at the interface between the brazing seam and the base material, before rapidly reaching a steady state. Small peaks in the Fe element, enriched within the brazing seam, correspond to the diffuse distribution of dots and small islands in the metallographic photograph. Additionally, the Fe diffusion in the brazing seam is uniformly distributed and extends far away. The Cu element diffusion behavior is presented in Figure 7c, where the copper content at the interface drops rapidly. However, it diffuses through the interface into the base material to a width of about 10 µm, after which, it decreases rapidly and remains stable over a long distance. The waveform of the Cr element is almost identical to that of the Fe element, except for the difference in content. This indicates that the diffusion dissolution of the Fe element is often accompanied by the Cr element. The median value of the Ni and Mn content in the brazing seam is about 1/2 and 1/3 lower than in the base material, indicating that Ni and Mn have also undergone sufficient diffusion.
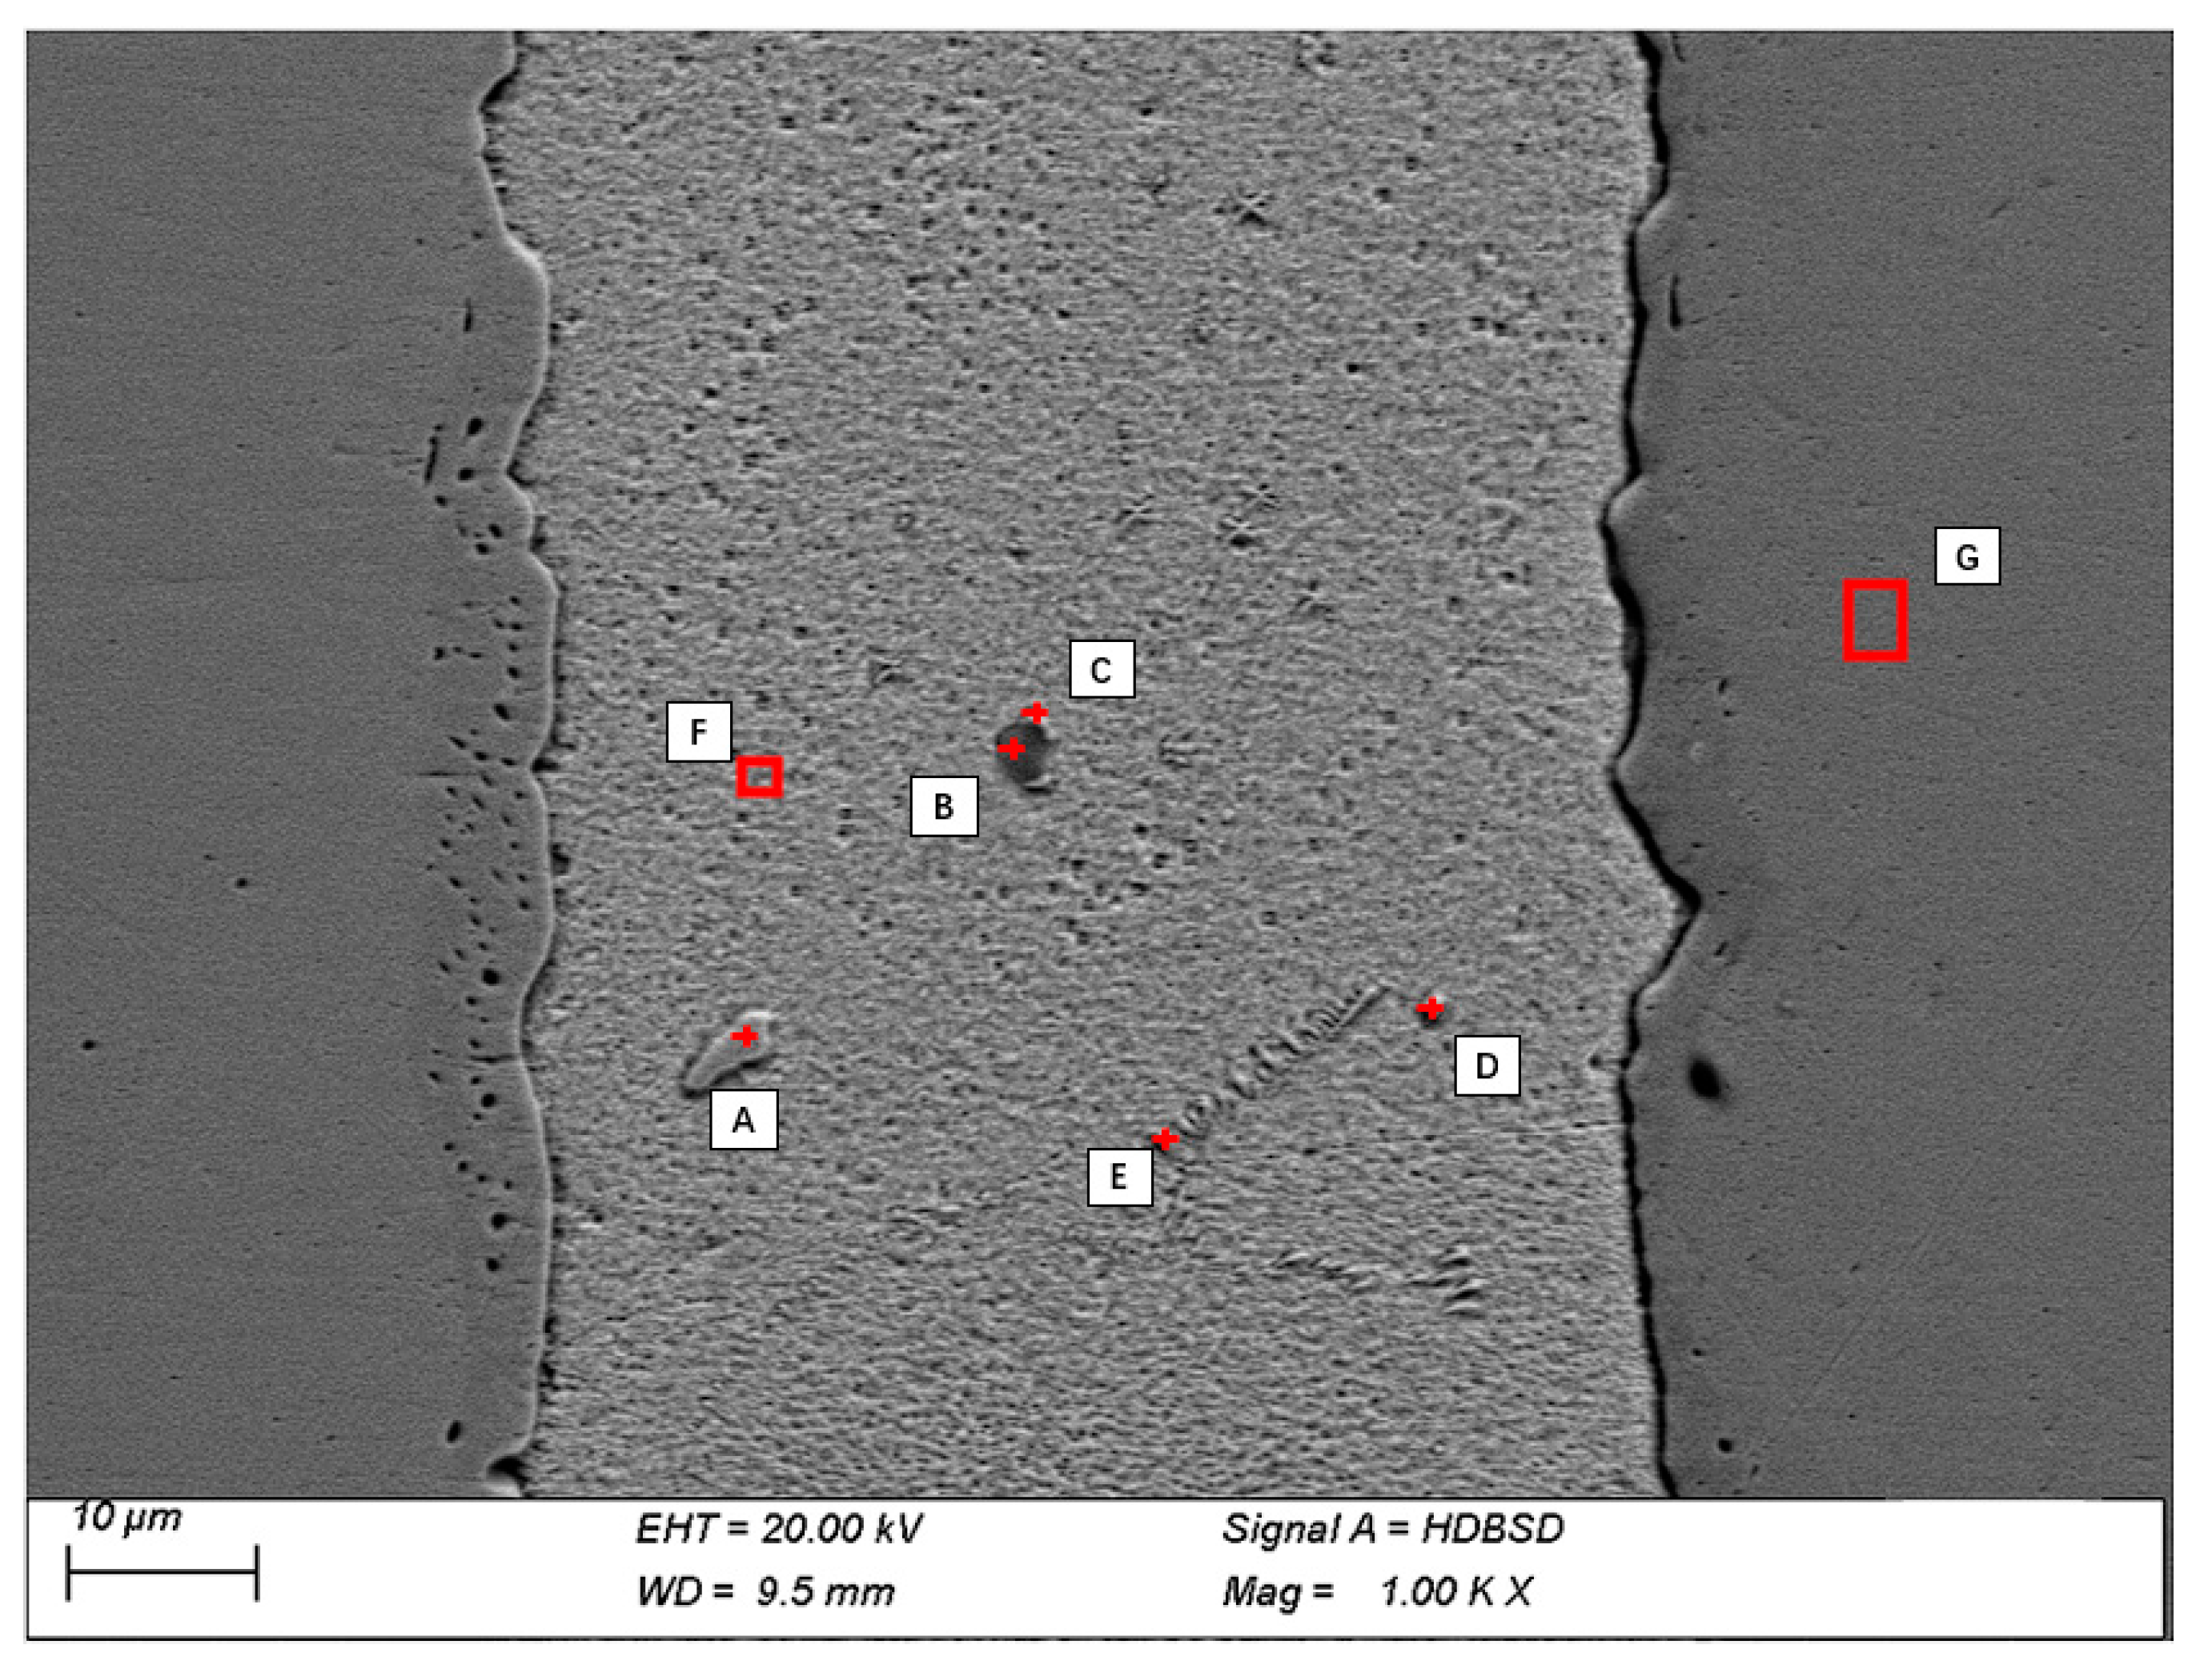
The EDS measurement position and results of the micro-zone in the specimen THN are shown in Figure 8 and Table 2, respectively. Firstly, a comparison of Table 1 and Point F, indicates a change in the pure copper composition in the brazing seam. Specifically, the pure copper in the brazing seam of specimen THN increased by 7.08% C, as well as by 1.17% Fe, 0.19% Cr, 0.61% Mn, and 0.8 Ni compared to the values presented in Table 1. It can also be observed that all the elements in the base material have diffused into the weld, except for Si. Point A, which is located on an island, consists of Fe, Cr, C, and Cu, and its Fe element content exceeded that of the other characteristic points in the brazing seam. Points D and E are located on a lineament and have a C element aggregation. Additionally, points B and C are located at smaller islands, appear as dark shadows, and have 0.6% of the S element. The elemental content of G at the point far from the brazing seam of specimen THN was found to be almost identical to that in AISI 304 prior to vacuum brazing. The Mn point scan and line scan results are consistent, whereas the Ni element point scan results are much lower than the line scan results. This could be due to the Ni content being less and unevenly distributed in the brazing, and the Ni content being lower at the hit point locations.
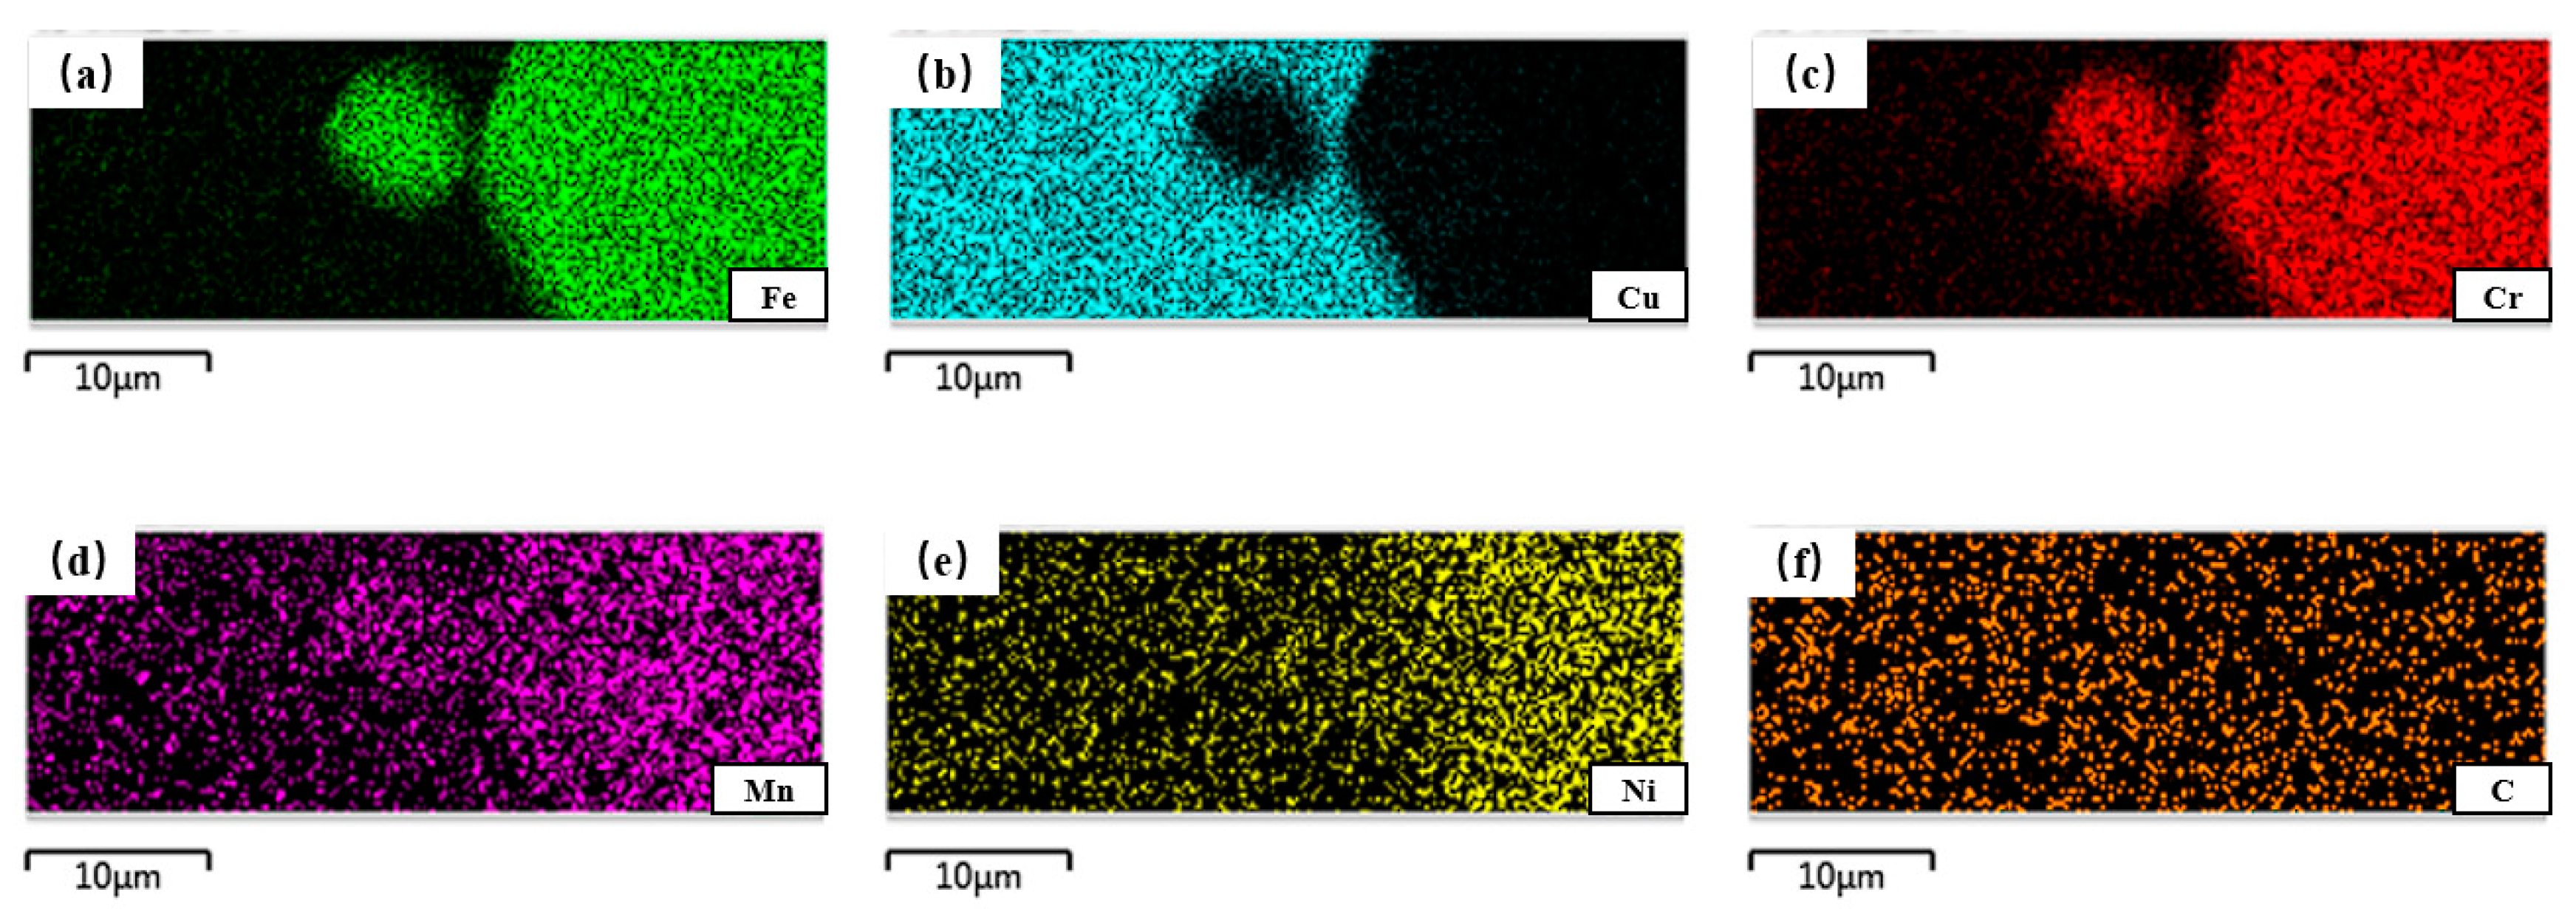
The EDS map analyses of the THN brazing seam are shown in Figure 9 and depict the distribution and diffusion of the Fe elements over a relatively long distance within the brazing seam of specimen THN. Multiple locations within the seam exhibited a greater concentration of Fe elements, which roughly corresponds to the small islands, lineaments, and dots, which are evident in Figure 7a. The Cu element, in contrast, penetrates along the grain boundary of the base material and gradually diffuses into it, thereby decaying with distance. The diffusion of Cu in the base material is lighter in color compared to the Fe element in the brazing seam, which means that the diffusion of Cu into the base material was lower than the diffusion of the Fe element into the seam; this aligns with the results of the point scan and line scan on both sides of the interface between the brazing seam and the base material. As for the Cr element, it was more abundant in the base material. The distribution of Mn, Ni, and C in the Figure 9 is more uniform than for Fe, Cu, and Cr.
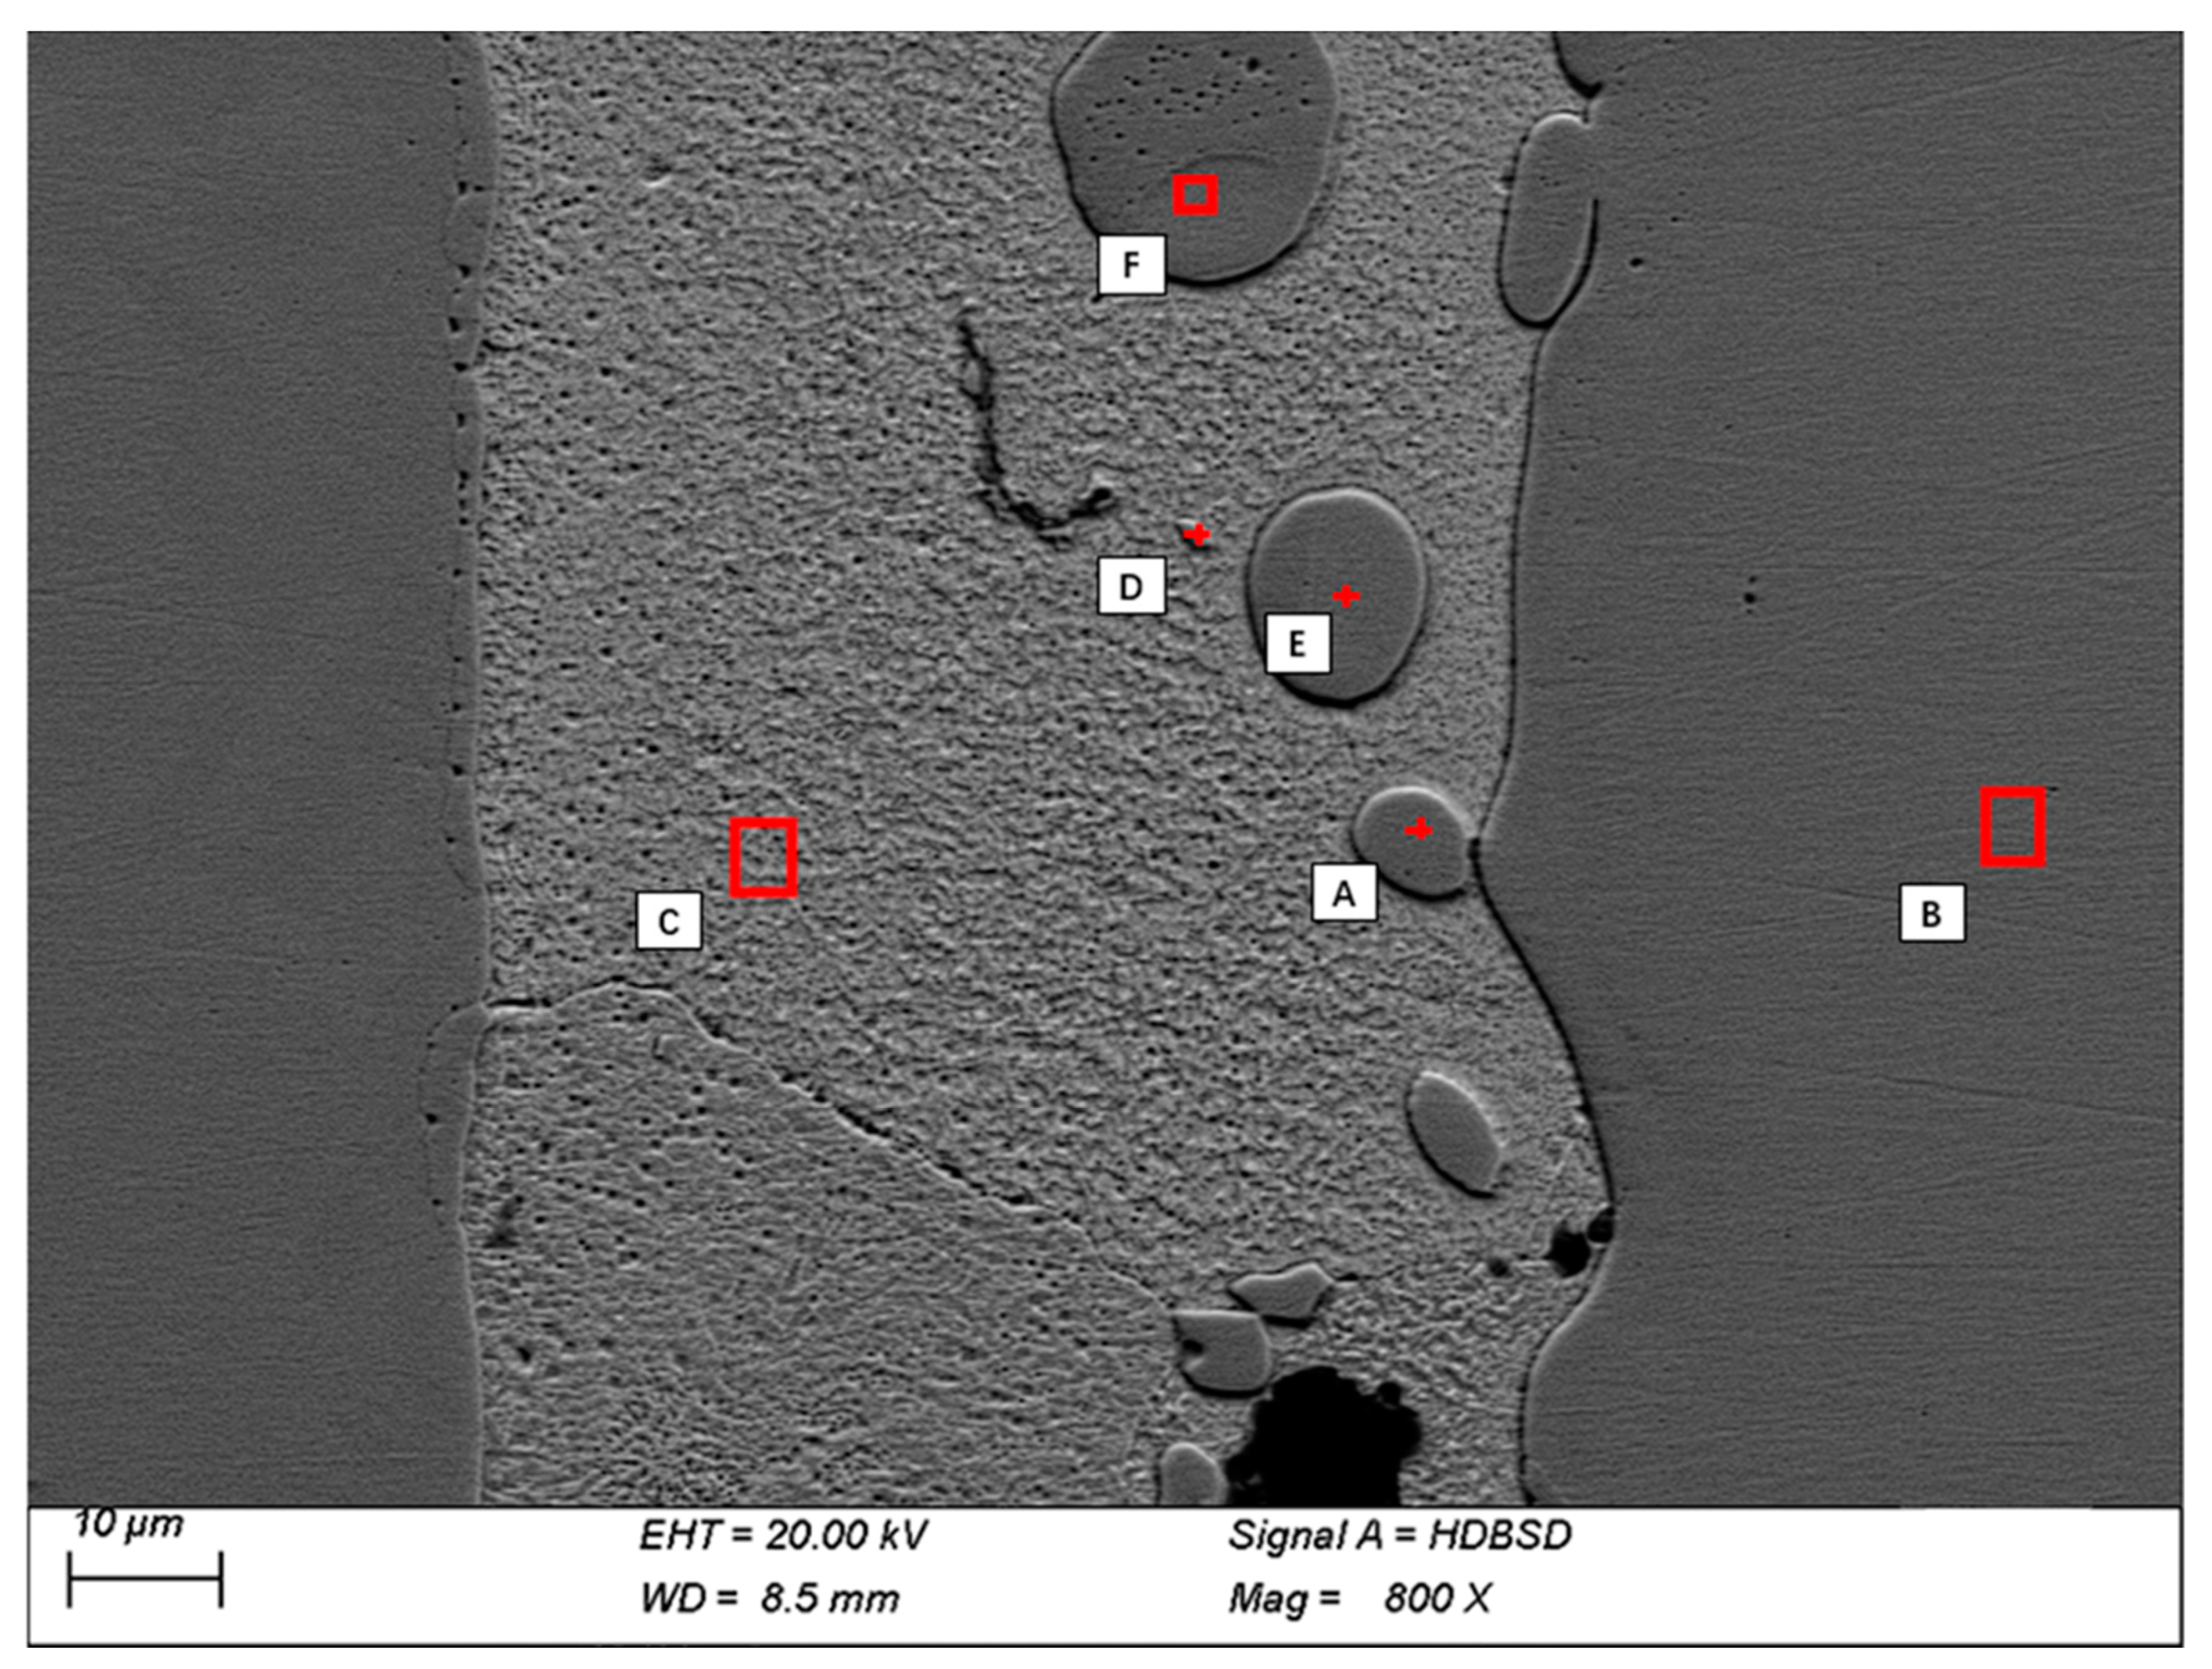
The EDS measurement position and results of the micro-zone in specimen THK are also exhibited in Figure 10 and Table 3, respectively. Firstly, a comparison of point F in Table 2 to point C in Table 3 provides evidence that the copper-based solid solution organization remains almost the same between the THN specimen and the THK specimen. Points A, E, and F, located on the large island, display the Fe element percentage, which reached nearly 70%, with the Cr element accounting for approximately 17%. Therefore, it can be inferred that the presence of the large islands is due to the direct dissolution of the base metals. Point D, located on a lineament, has a C element aggregation of 8.18%.
The EDS map analysis of the large island of specimen THK is shown in Figure 11. It can be observed that there is a distinct enrichment of the Fe and Cr elements in the large island, yet only a small quantity of the Fe and Cr elements in the brazing material, while the density and dispersion of the Fe and Cr elements in the copper brazing material are almost the same. It can be inferred that as the thickness of the brazing material increases, some of the parent material is directly incorporated into the brazing material, while most of the rest of the parent material is incorporated into the brazing material by elemental diffusion. Additionally, the Mn element content on the large islands demonstrates a heightened concentration compared to the surrounding Mn element. The contents of the Ni and C elements in the base material and brazing material were similar, and relatively evenly distributed throughout the brazing seam, with no areas of agglomeration.

3.2.2. Near the Brazing Angle

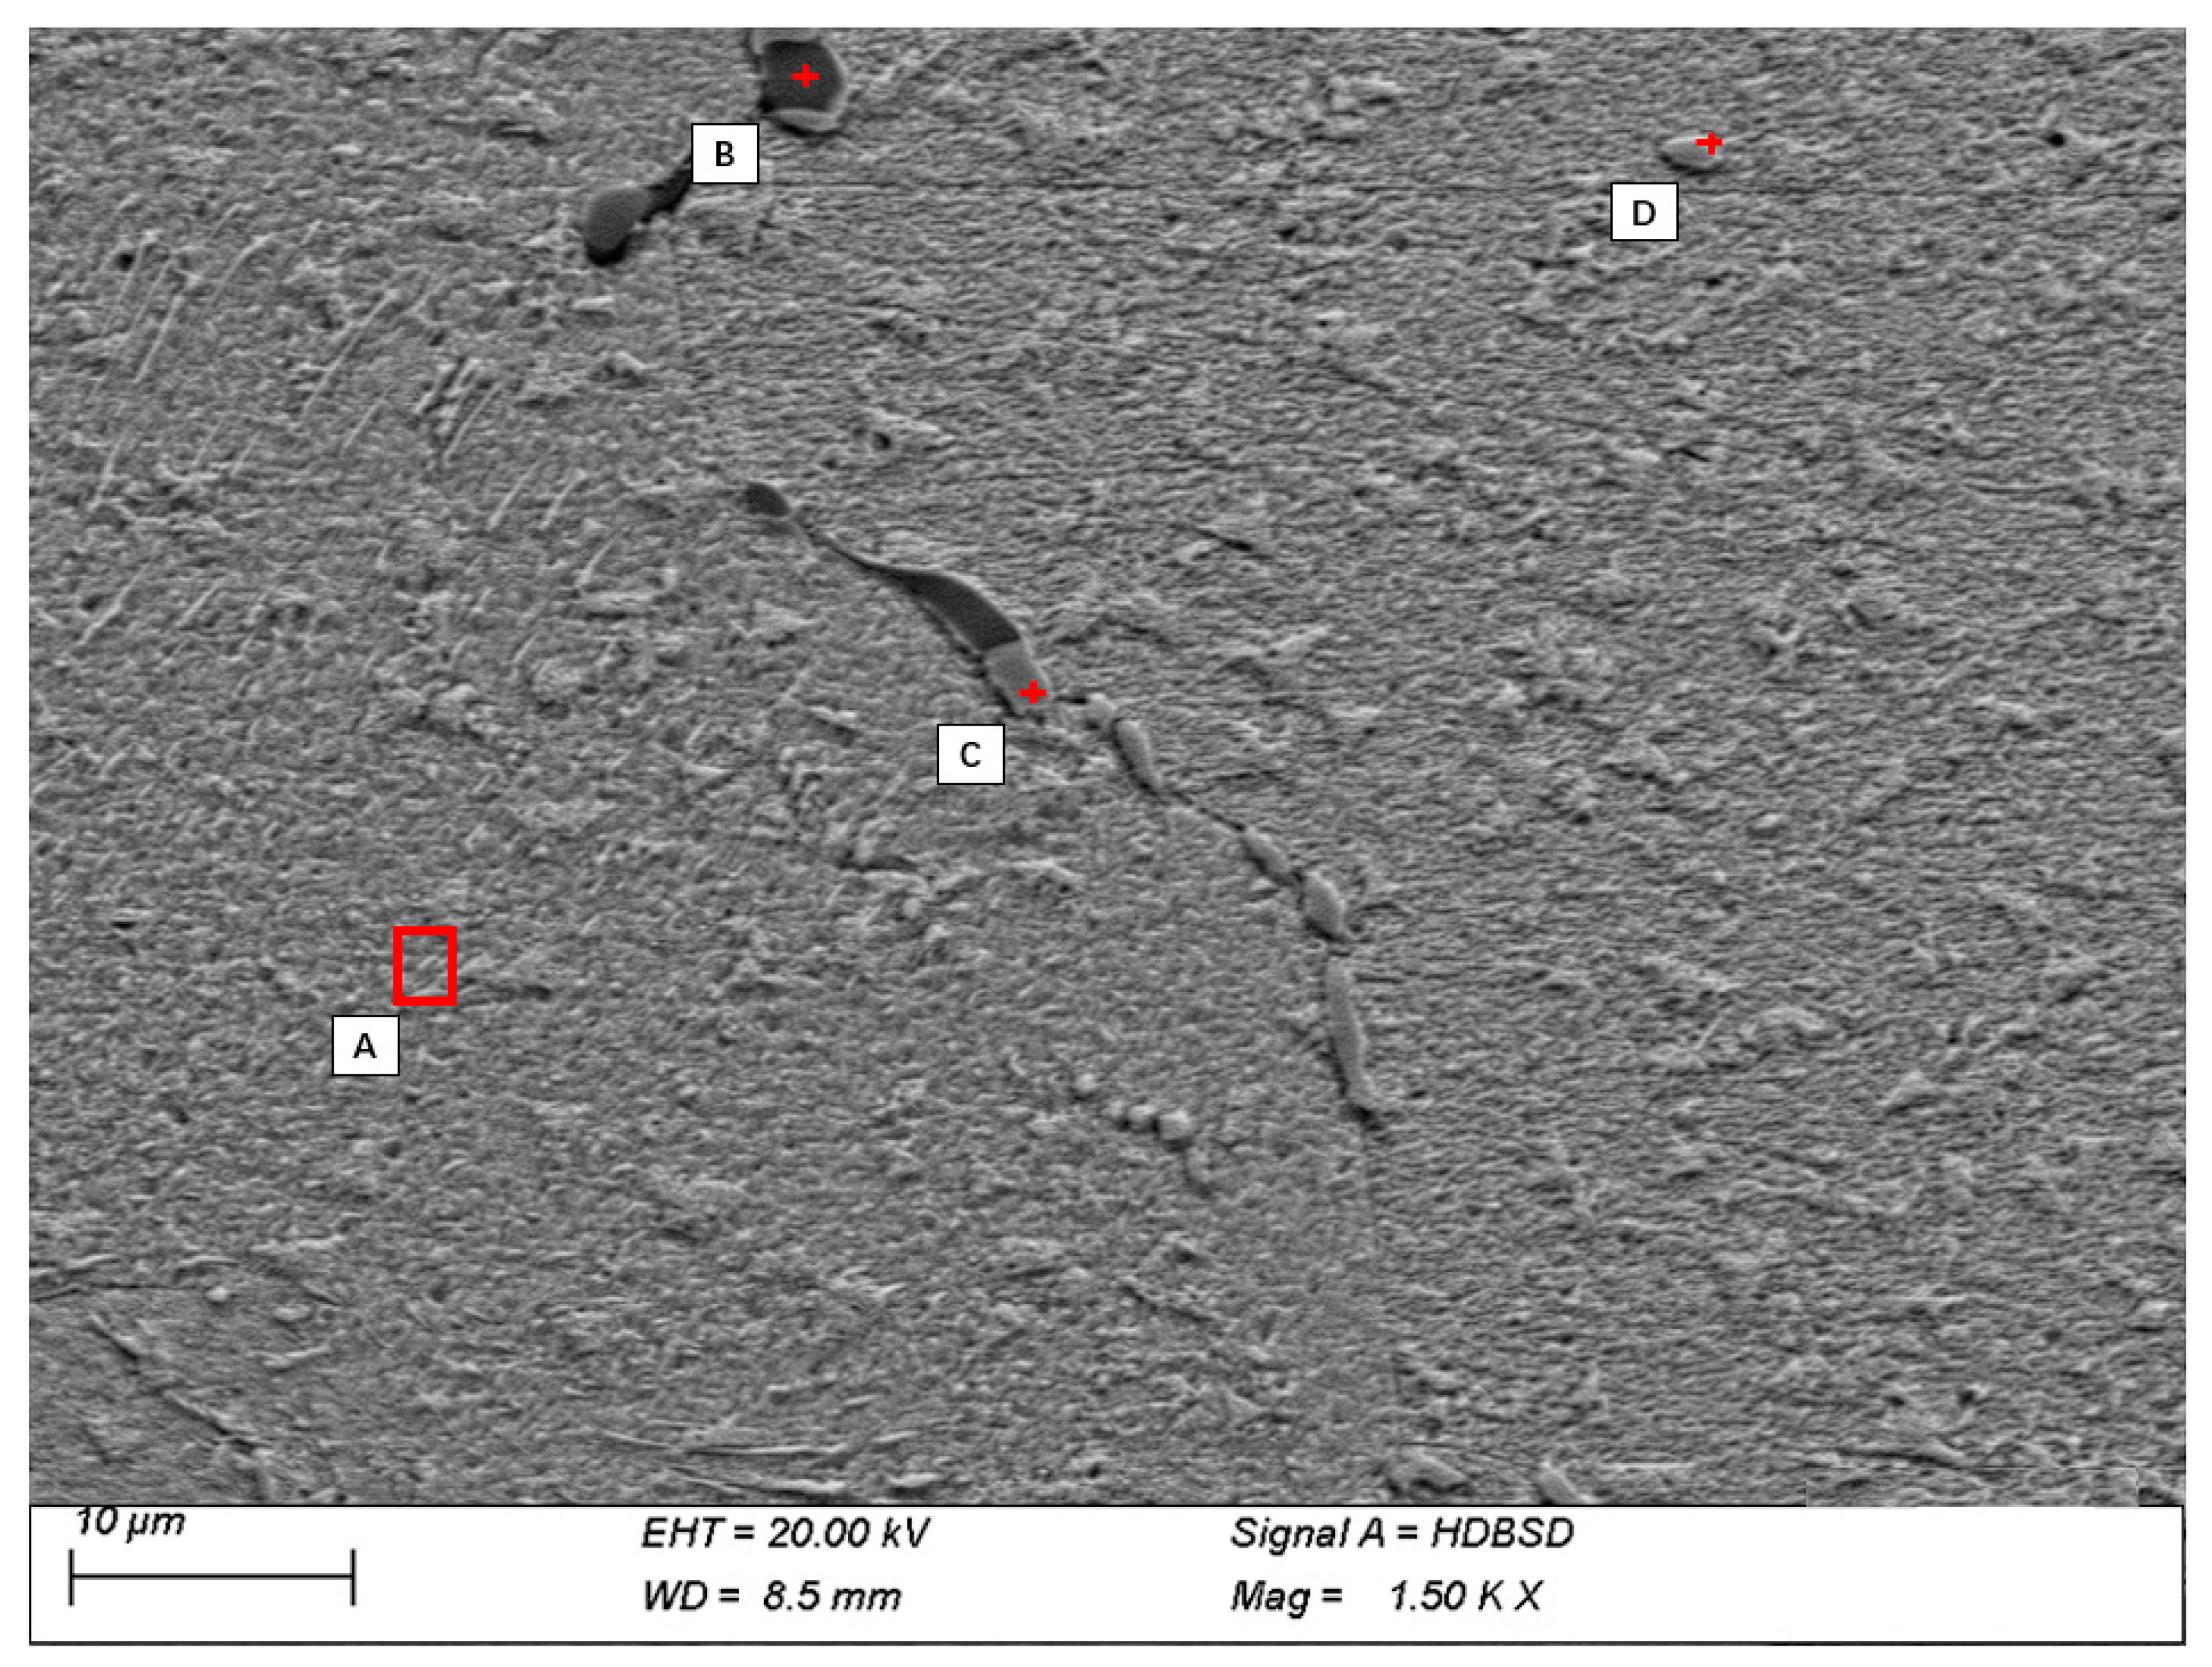
As shown in Figure 12 and listed in Table 4, the EDS measurement position of the micro-zone in the meniscus fillet of specimen THK was used to identify the specific composition of the islands and lineaments that are dispersed in the fillet. Point A contains 91.57% of the Cu elements, which is accompanied by small amounts of C, Fe, and trace amounts of Mn and Ni. Point C is located on the lineament and is composed of 69.35% Fe, 16.6% Cr, and 7.64% Cu. Point B, appears to favor S elements, while point D displays an aggregation of C elements.

3.3. Experimental Results of Brazed Joints Subjected to Tensile Loading

3.3.1. Tensile Strength of Brazed Joints

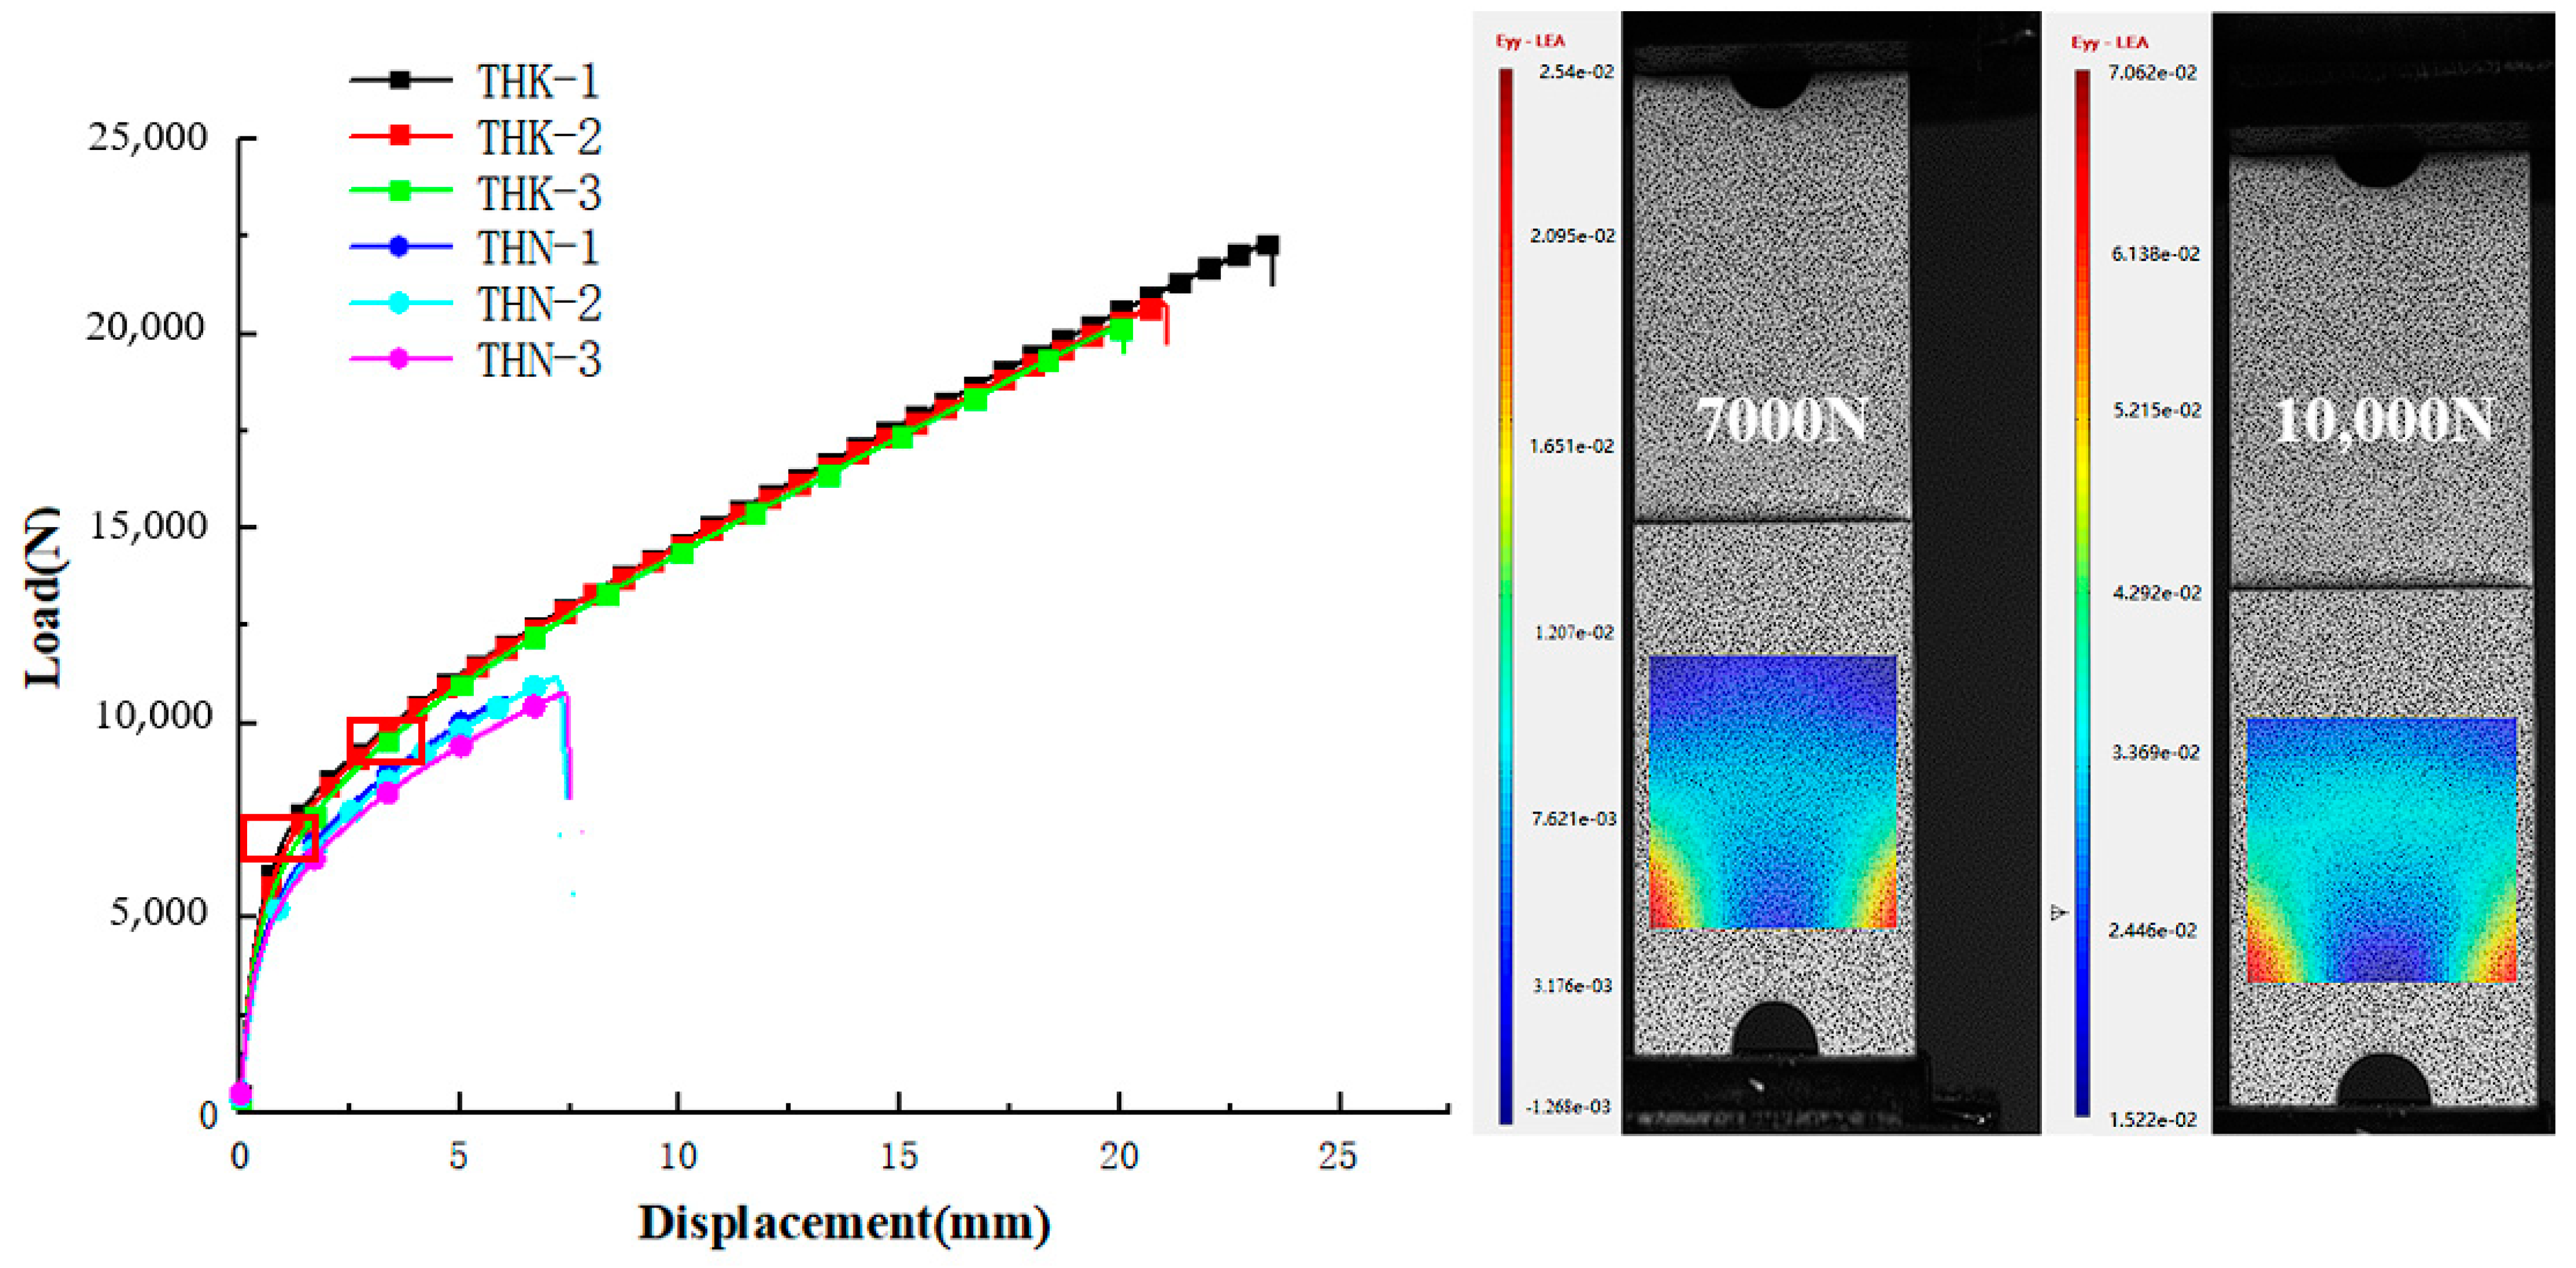
Figure 13 presents the load-displacement curves of the brazing specimen, whereby three replicates were taken for each specimen THK and specimen THN. Specimen THN, without a meniscus fillet, presents an average ultimate load of only 10.83 kN, whereas the ultimate load of specimen THK, which featured a meniscus fillet, was higher at 21.06 kN, which is about 1.94 times higher than specimen THN. The strain field of the brazing specimen THN and specimen THK are also illustrated in Figure 13. The strain fields of the two specimens are almost indistinguishable in the measurable range. The maximum strain along the loading direction is 0.025% and 0.070% for loads of 7 kN and 10 kN, respectively.

3.3.2. Post-Tension Damage Characteristics

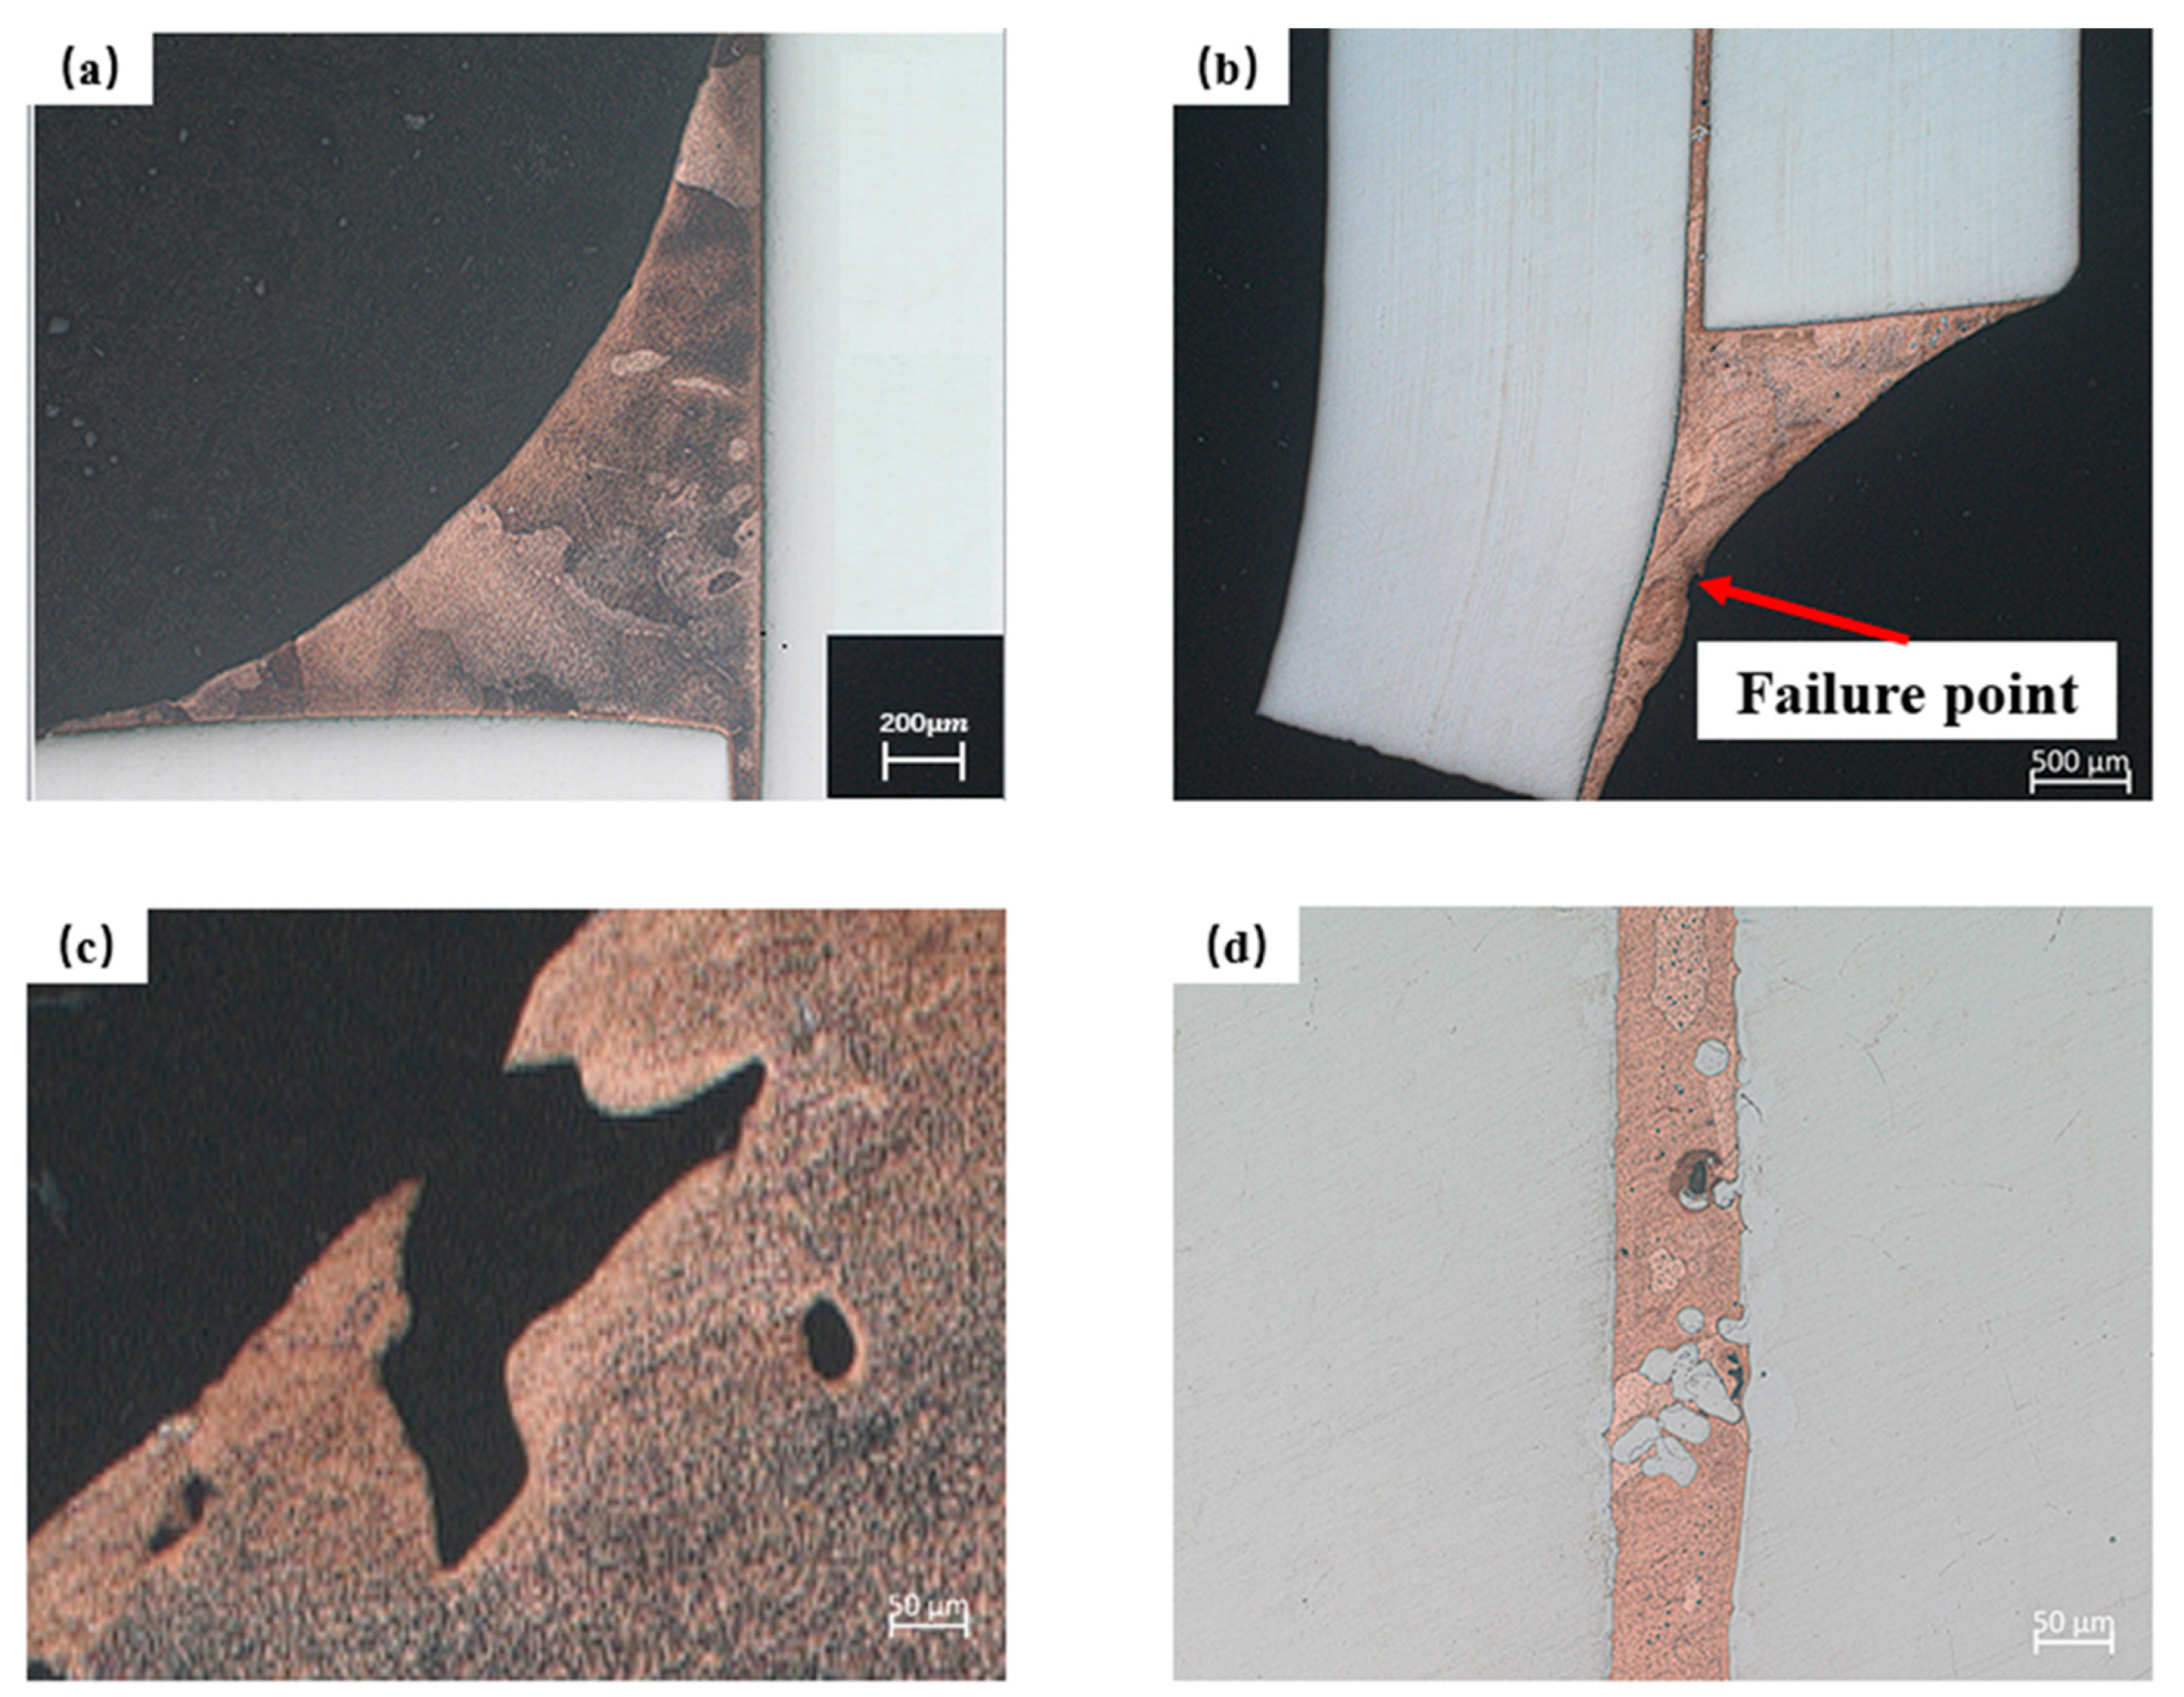
When the tensile loading reached nearly 20 kN (close to the ultimate failure load), significant plastic deformation could be observed in the meniscus fillets of the specimen THK, as shown in Figure 14a,b. The occurrence of microcracking is seen at the edge of the copper brazing fillets, in the enlarged view presented in Figure 14c, thereby indicating the initiation of fractures in the fillets. Meanwhile, as illustrated in Figure 14d, the microstructure of the THK brazing seam does not change greatly, with no plastic deformation (narrow and elongated cavity) or fracturing (microcrack), even when the load was about to reach its ultimate load.
The diagram of the SEM fracture surface is displayed in Figure 15. For specimen THN, it was only necessary to examine the brazing seam fracture surface A, while for specimen THK, owing to its meniscus fillet, it was also necessary to examine fillet fracture surfaces B and C.
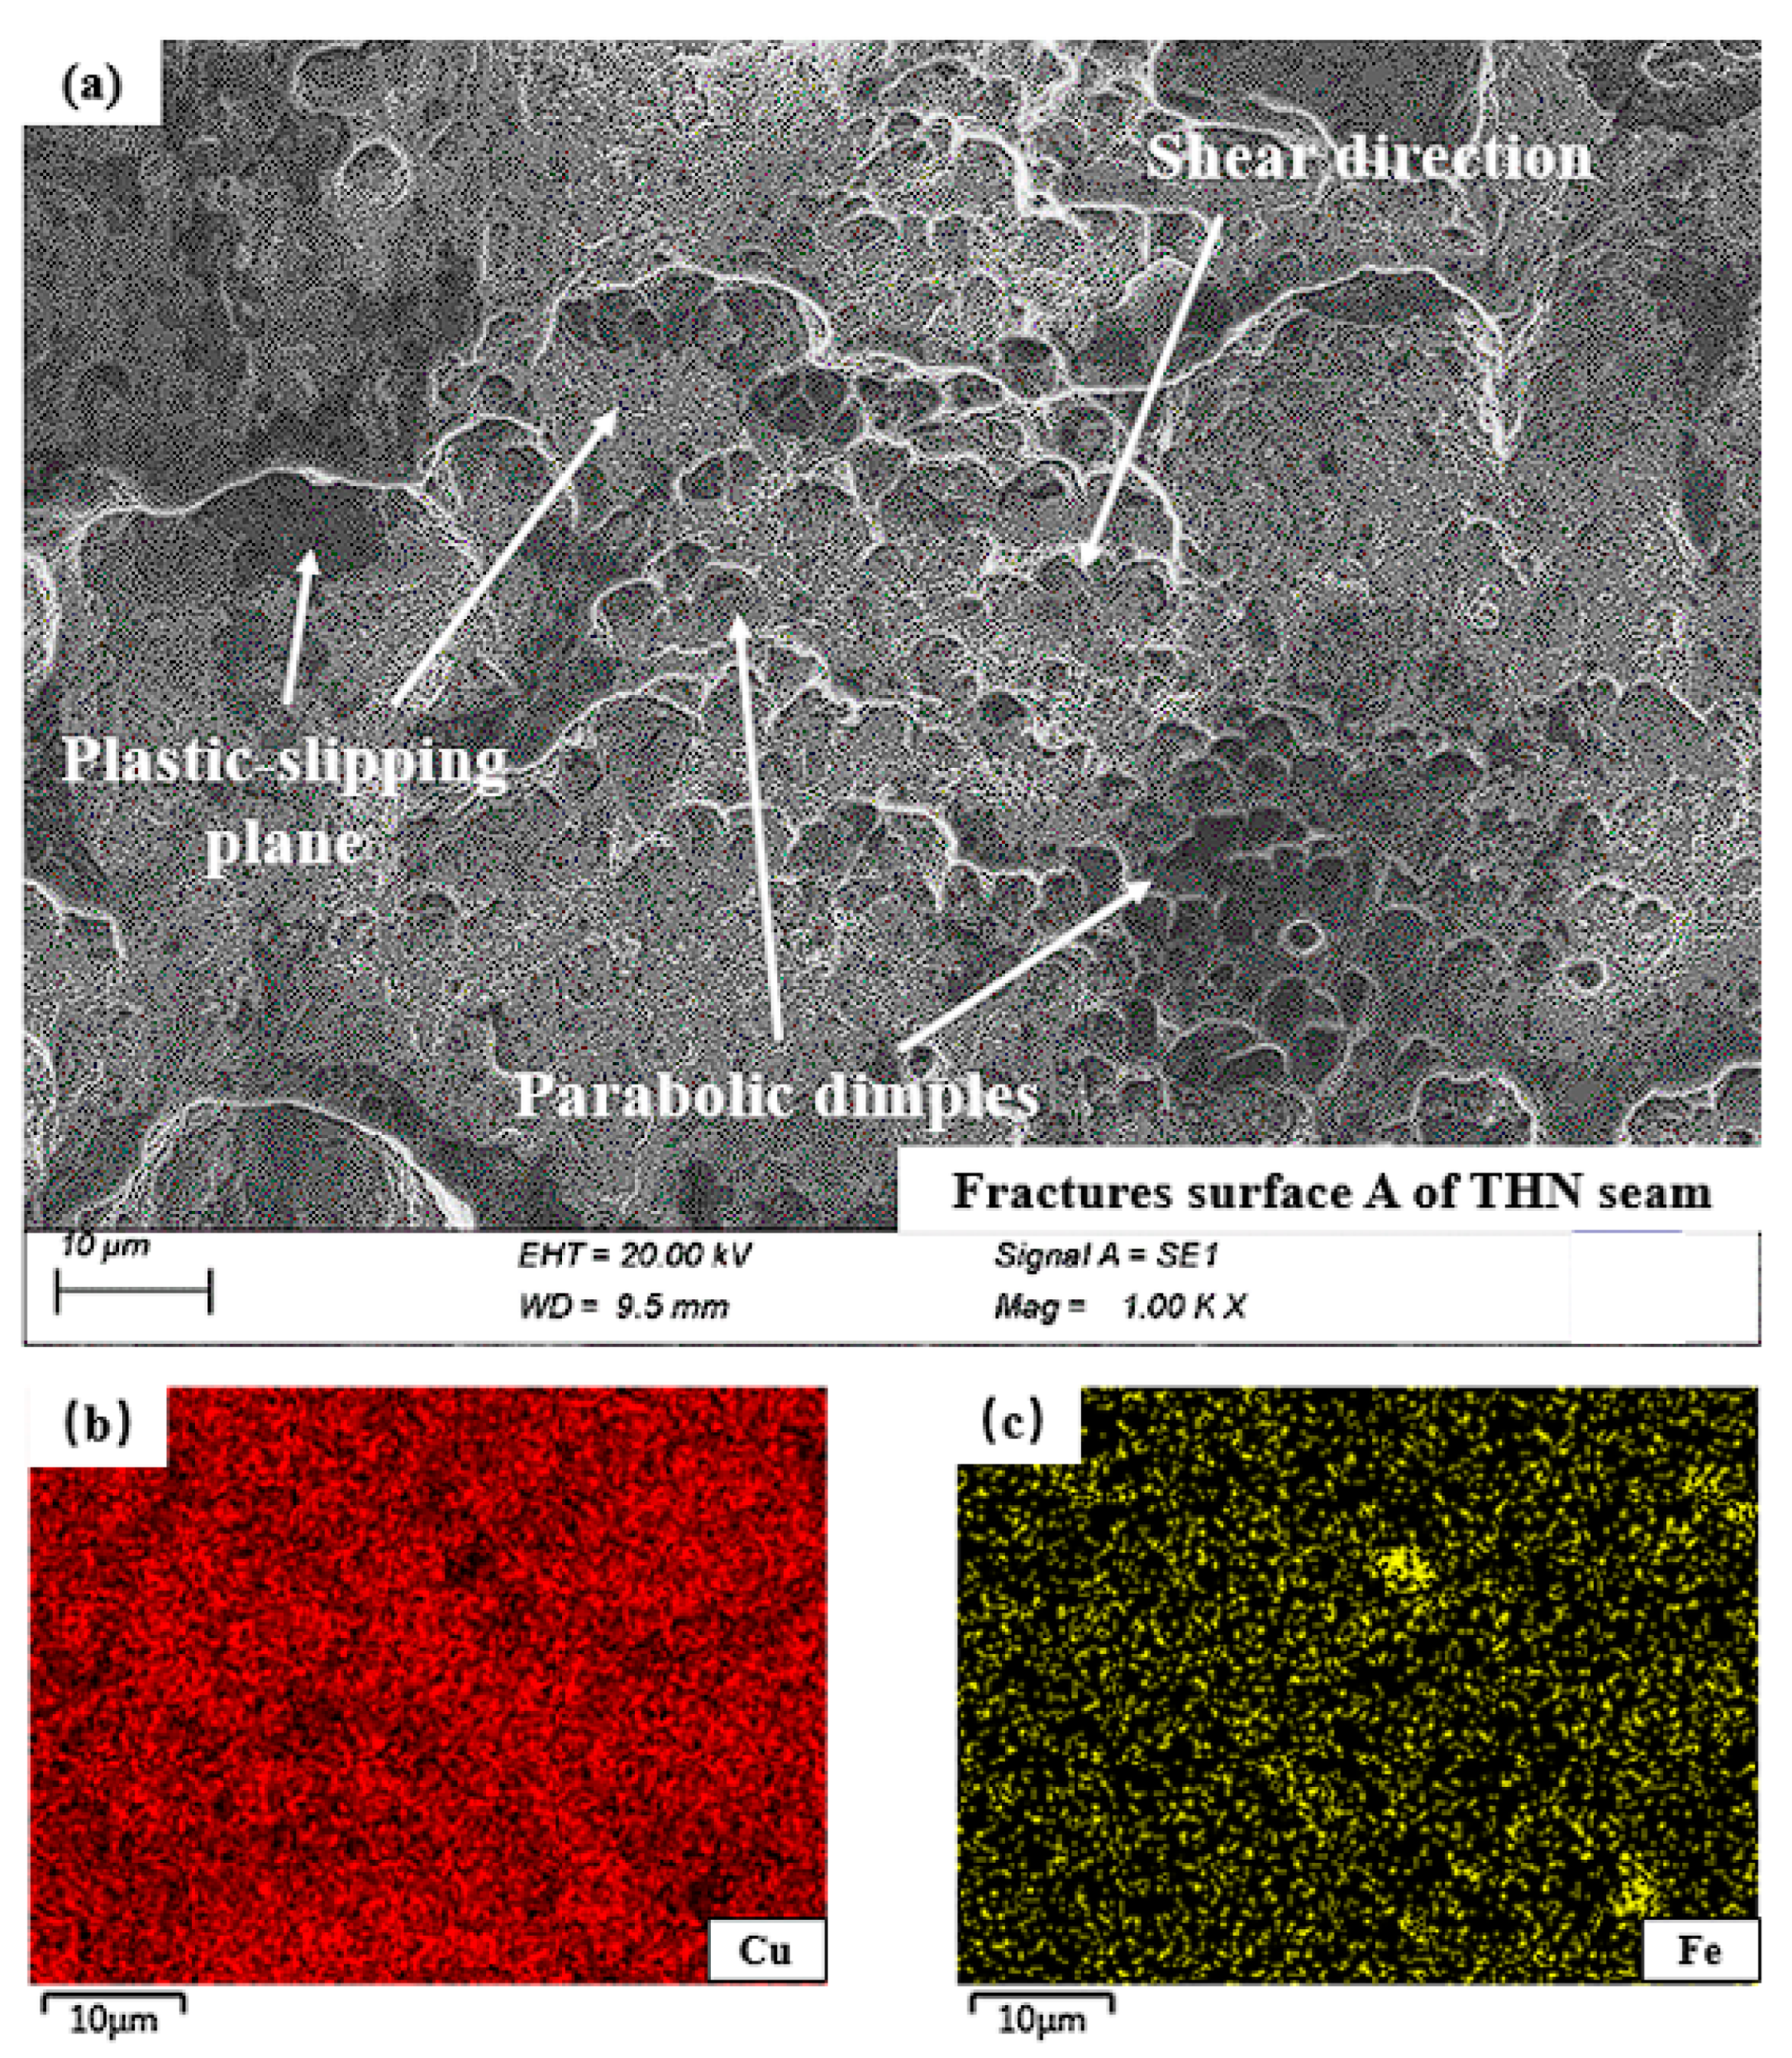
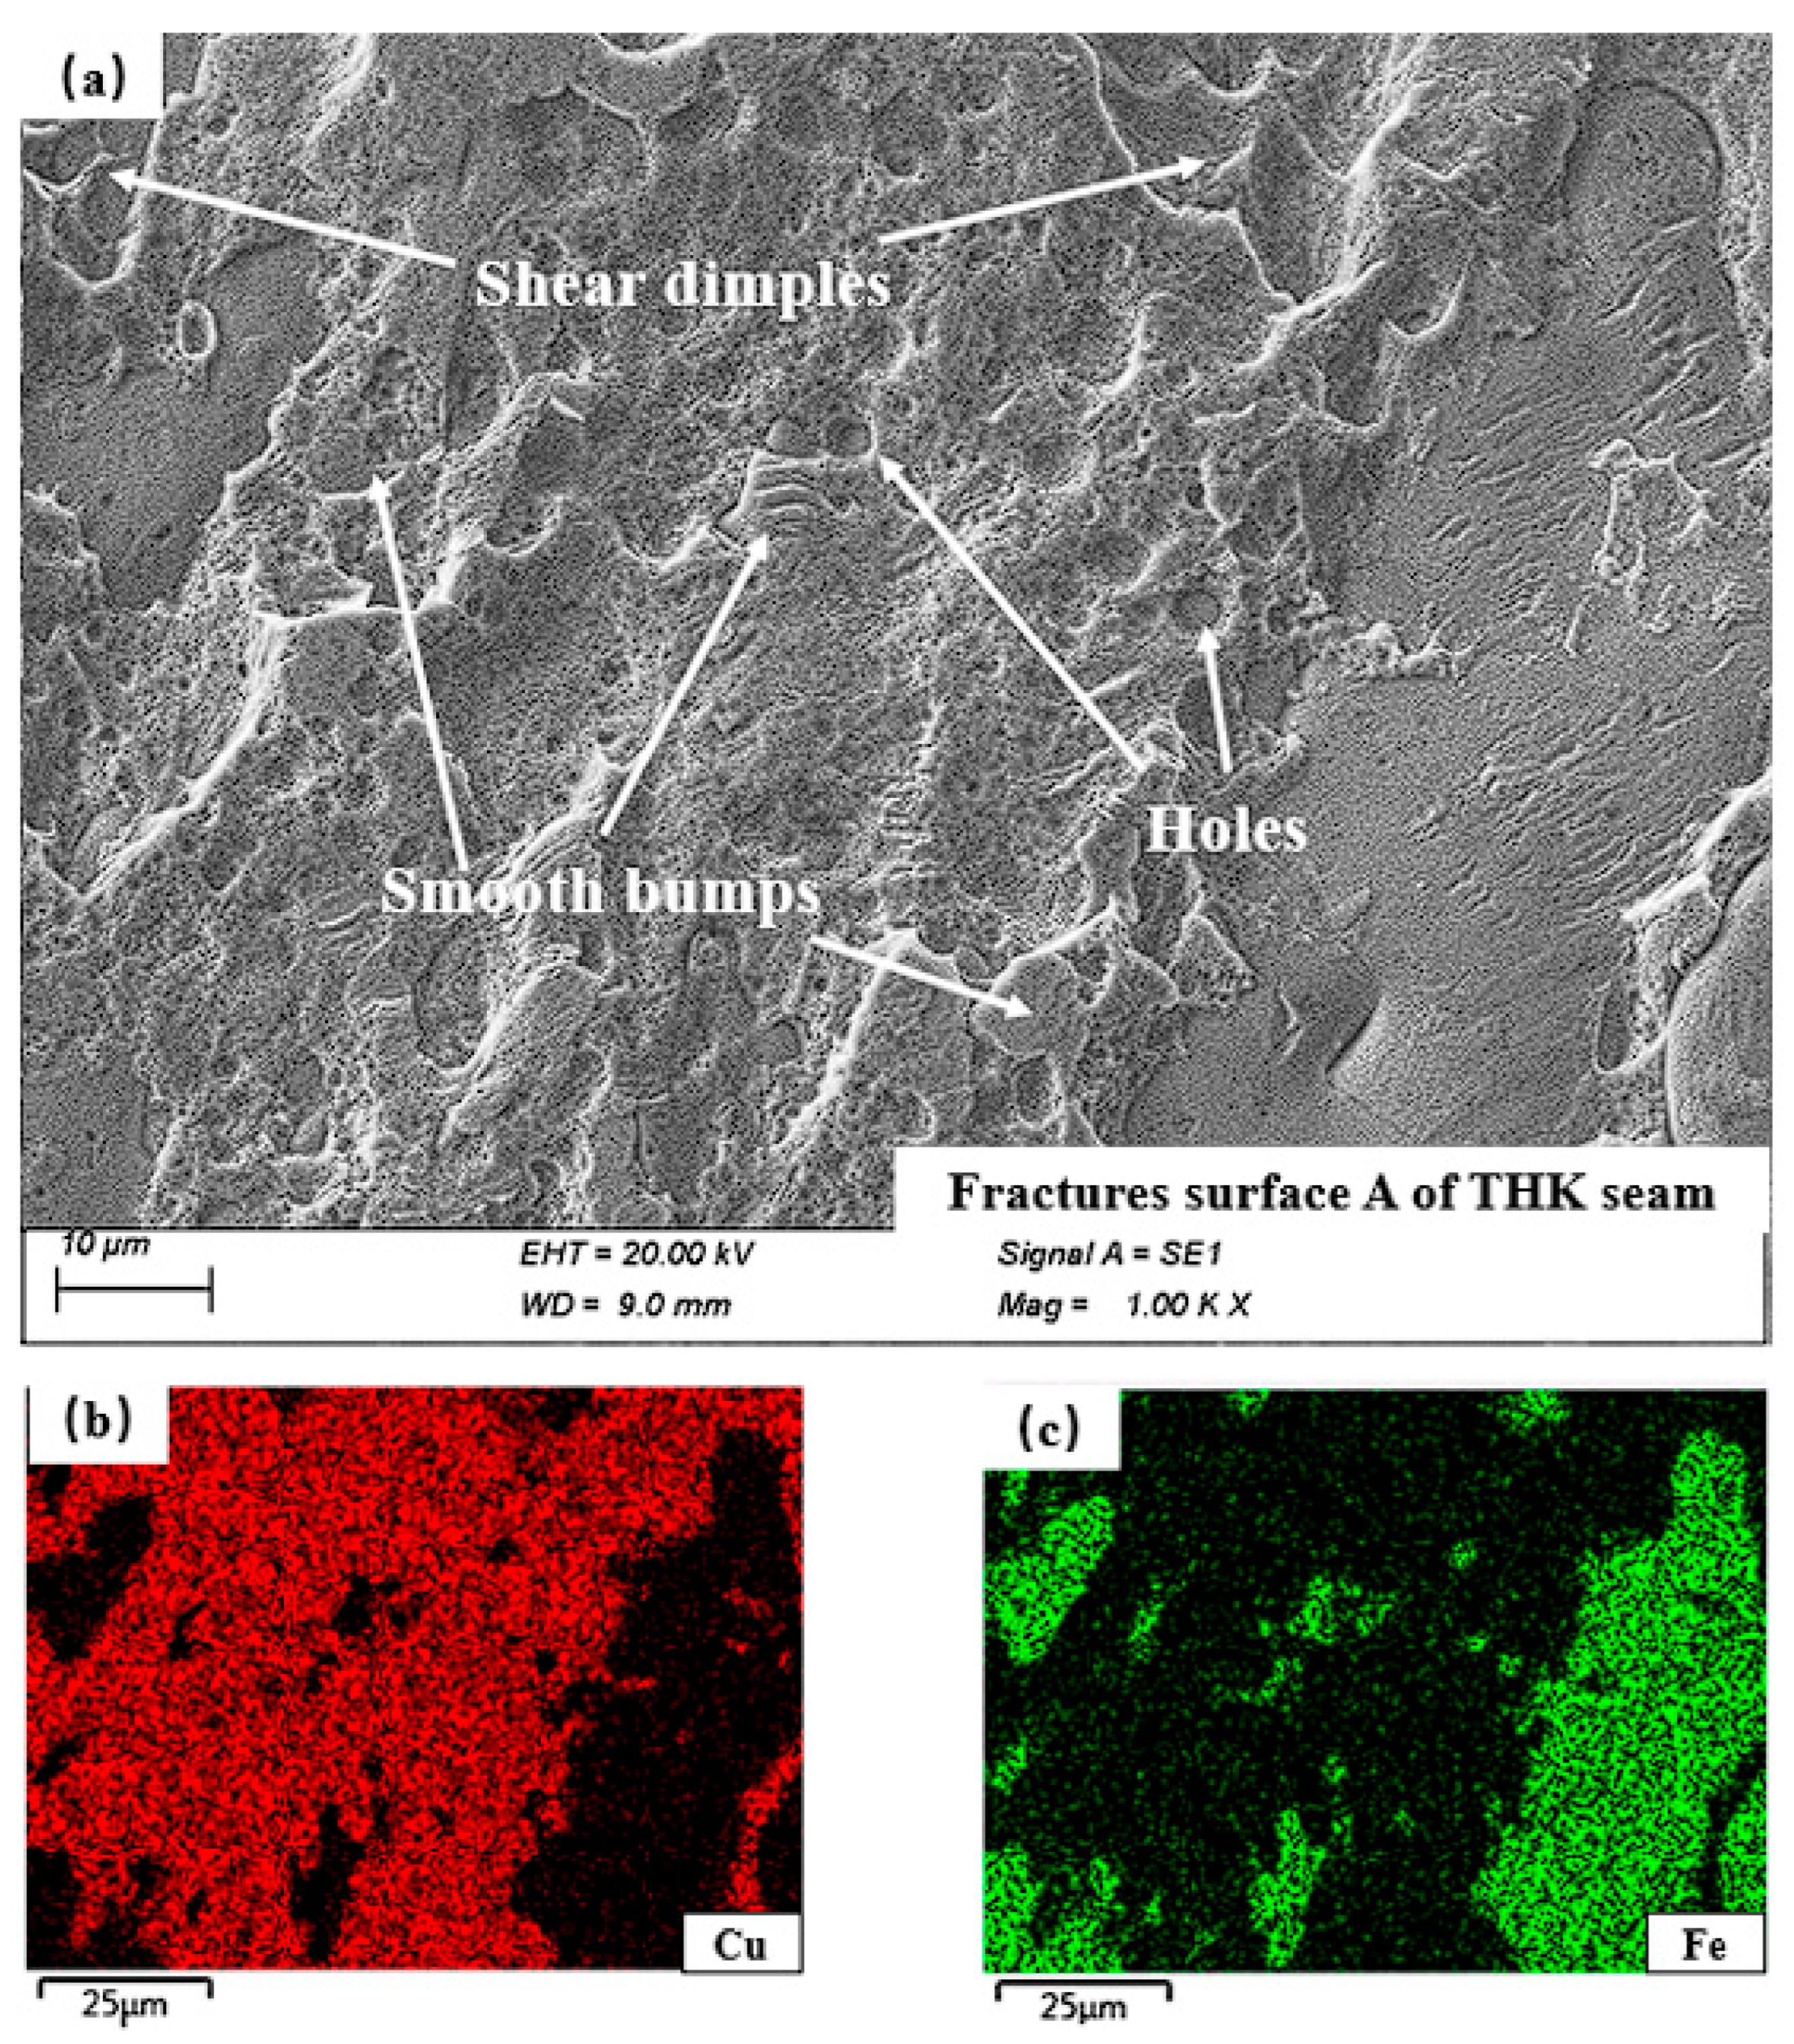
Fracture surface A of the specimen THN, which failed under the tensile load, was examined by SEM and EDS, as depicted in Figure 16. As can be seen from Figure 16b,c, a distinct enrichment of Cu elements in the fracture surface with some Fe, reveal that failure has occurred at the filler metal region. The fracture microfracture morphology of specimen THN has also been shown in Figure 16a, where a large number of parabolic dimples are seen to have been elongated along the shear direction, thereby indicating that large plastic deformation has occurred. Additionally, a plastic-slipping plane can also be observed on the fracture surface. Overall, for the specimen THN, its fracture mechanism in the brazing seam is a fracture mode, which is mainly attributed to shear stress (mode II).
The fracture behavior of surface A in specimen THK was also characterized by SEM and EDS. Notably, in Figure 17b and c, it is observed that only Fe is present in many of the regions, which reveals that a failure in the brazing seam of the specimen THK has occurred at the interface between the filler metal and the base metal. In Figure 17a, it should be noted that there are a large number of holes and smooth bumps, which do not exist in the fracture surface of the THN brazing seam. Furthermore, only the Fe element exists in most of the holes and smooth bumps; thus, it can be inferred that the generation of the holes and smooth bumps is due to the breaking of the large islands in the brazing seam of the THK specimen. In fact, these phenomena are in accordance with previous observations of morphology for the brazing seam at the microscale. Evident islands with large sizes, e.g., points A, E, and F, could be found in the specimen THK (see Figure 10), compared to the EDS results of the specimen THN presented in Figure 8. These results indicate that poor metallurgical bonding has occurred between the brazing alloy and the base metal in the brazing seam of specimen THK. Additionally, shear dimples can be observed in Figure 17a, meaning that the fracturing in the brazing seam was also caused by the interfacial shear stress.
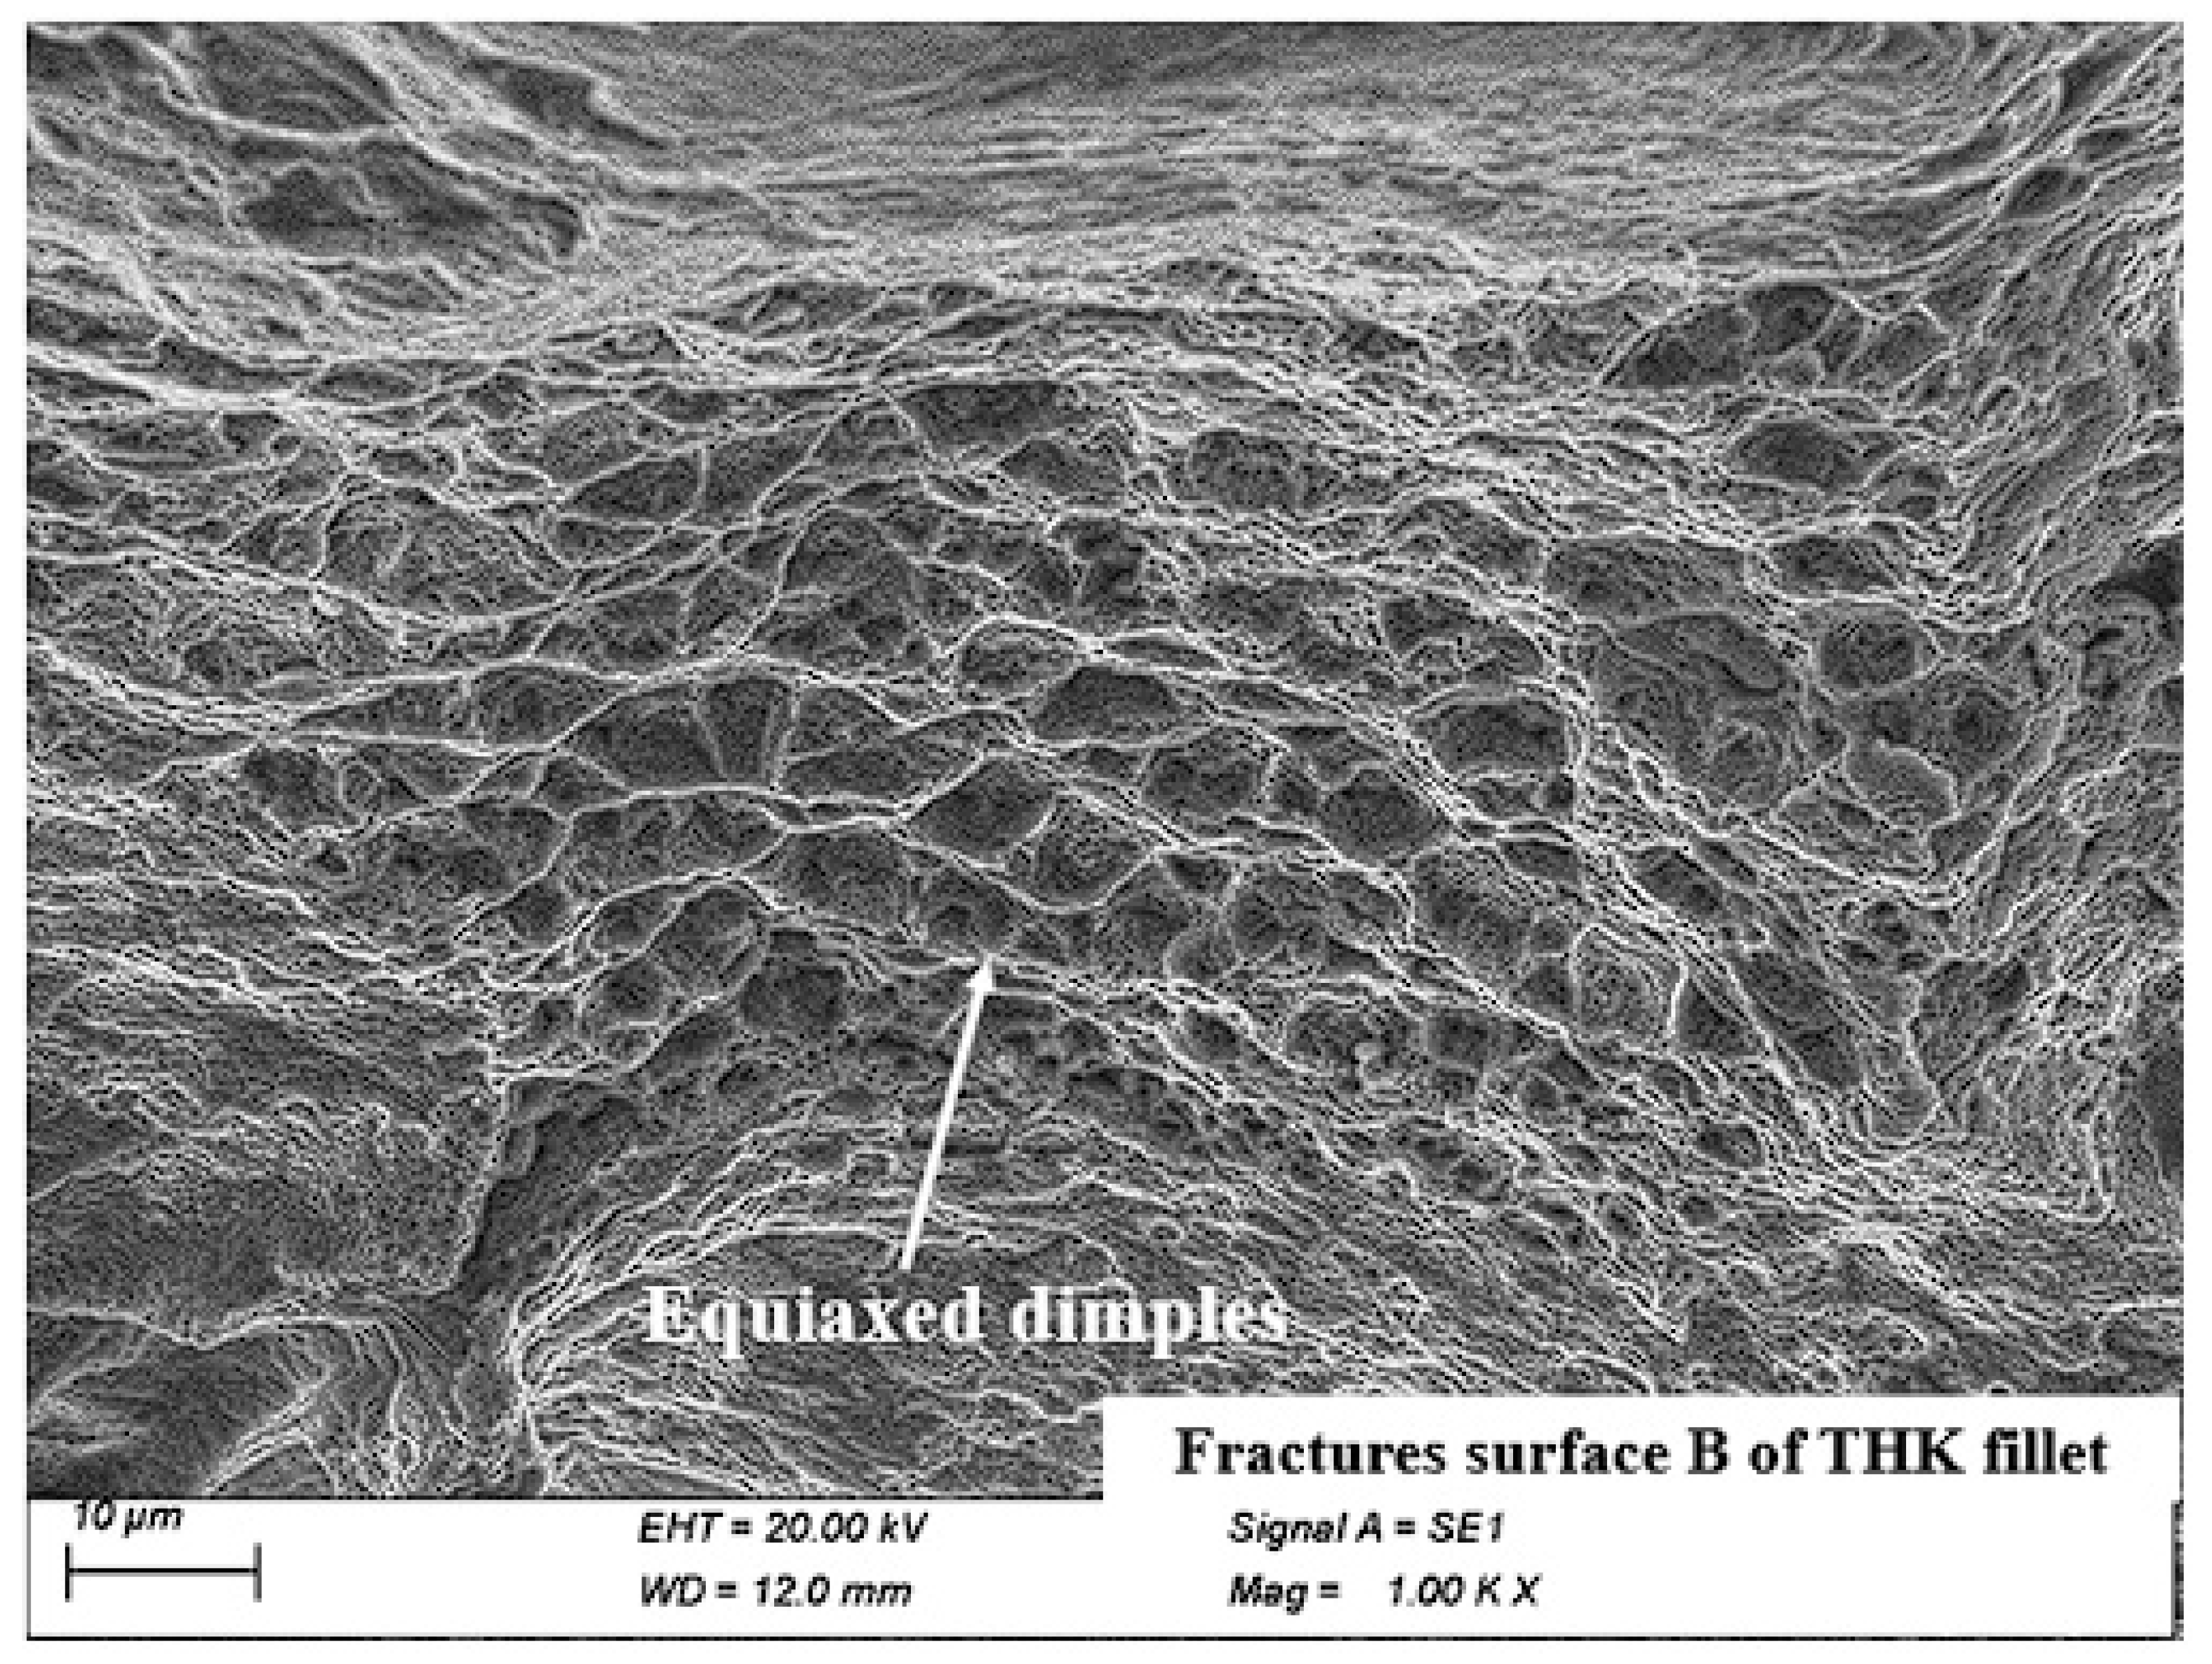
The morphology of fracture surface B for specimen THK is illustrated in Figure 18. A number of equiaxed dimples, which are spherical depressions, were formed in fracture surface B. Compared to the elongated dimples (i.e., parabolic depressions) observed in facture surface A, the appearance of the equiaxed dimples suggest an opening fracture mechanism (mode I) rather than a shear fracture mechanism (mode II).
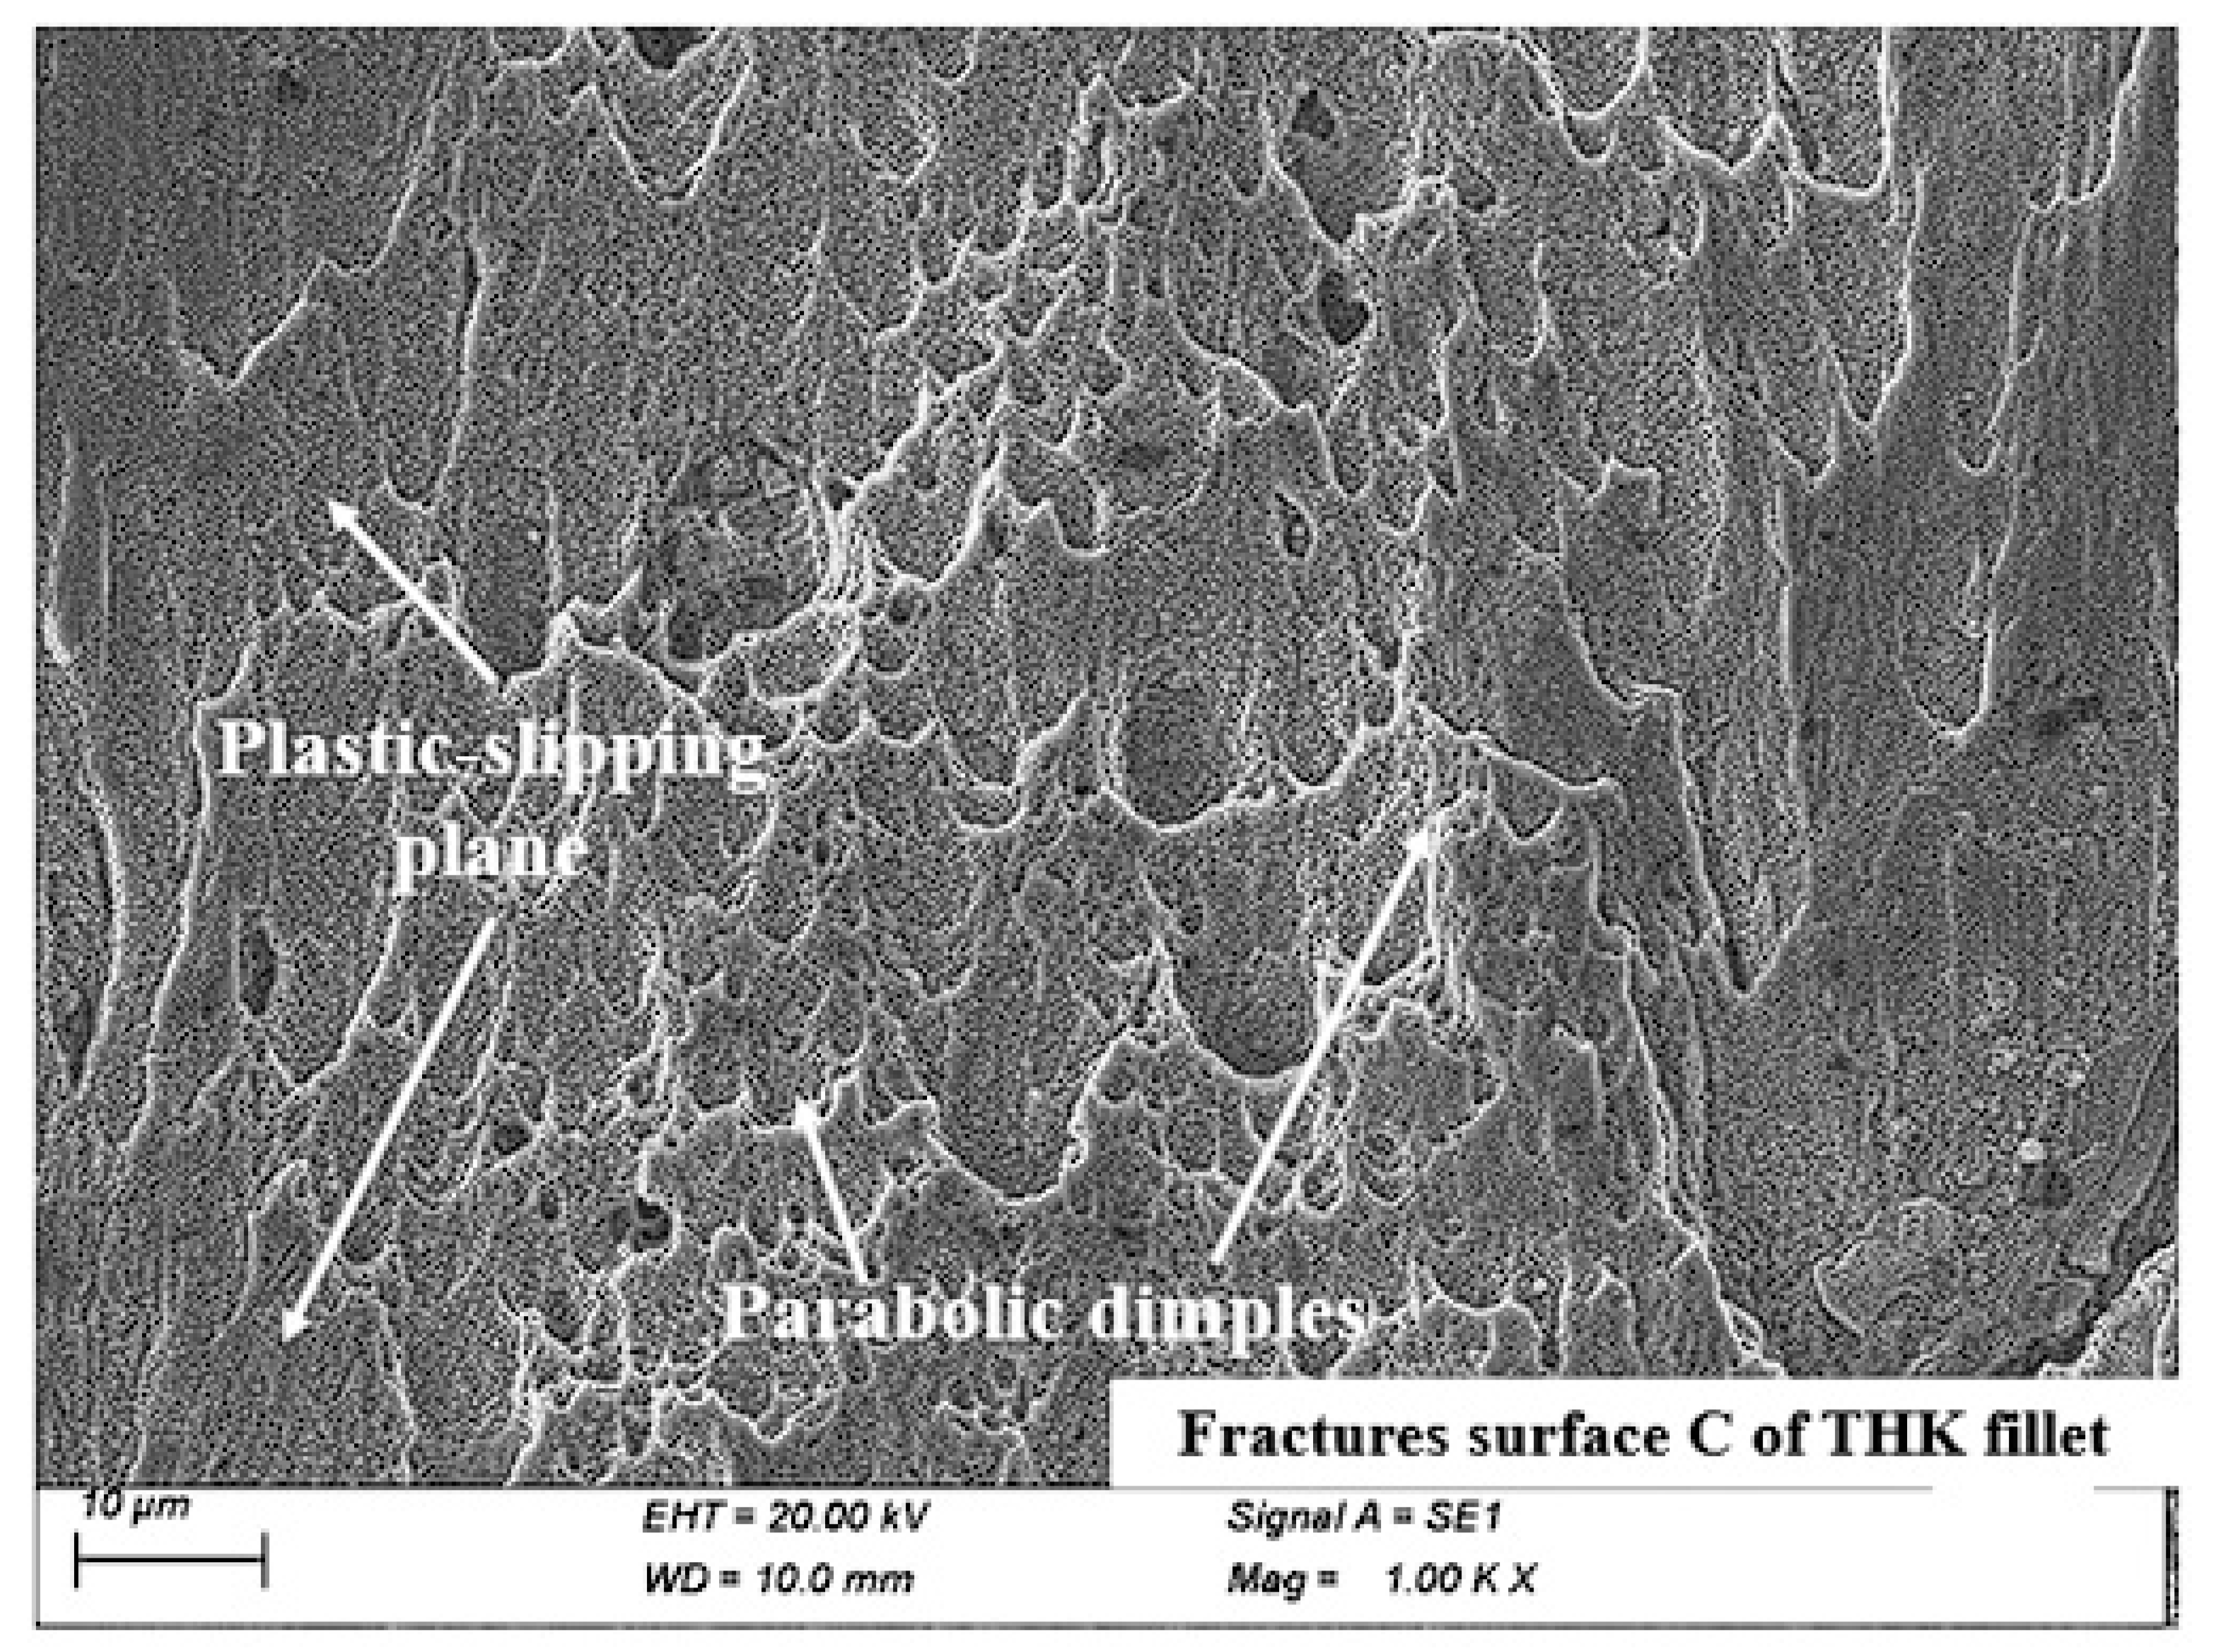
Fracture surface C of the specimen THK was also examined and is shown in Figure 19. From Figure 19, it is obvious that a large number of parabolic dimples and plastic-slipping planes were also formed in fracture surface C, similar to that in the THN brazing seam. Therefore, it can be inferred that large plastic deformation has occurred at fracture surface C and that the failure has occurred via fracture mode II due to shear stress.
In conclusion, owing to the existence of the meniscus fillet, the specimen THK has better plasticity. Moreover, and more significantly, the external loading could be partially transferred to the meniscus fillet in both normal stress and shear stress and would result in an improvement in load-carrying ability under tension by the specimen THK, in spite of the better microstructures observed in the brazing seam of specimen THN.

4. Enhancement Mechanism of Brazing Fillet Based on FEM

4.1. Numerical Modeling

To better understand the enhancement mechanism in the meniscus fillet, the tensile tests for the THN and THK specimens were simulated using ABAQUS software. Additionally, due to the complexity of the brazing process, the following assumptions were made to ensure the accuracy of the simulation and to simplify the model:
(1)
It is considered that the materials are ideal elastic–plastic bodies, isotropic and without any defects, and their behavior of yielding follows the Mises stress criterion.
(2)
Defects, such as weld cracks, at the microscale are not considered in the brazing process.
(3)
The existence of metal compounds and the diffusion between elements at high temperatures are not considered.
(4)
The fluidity of the solder after melting is not considered.
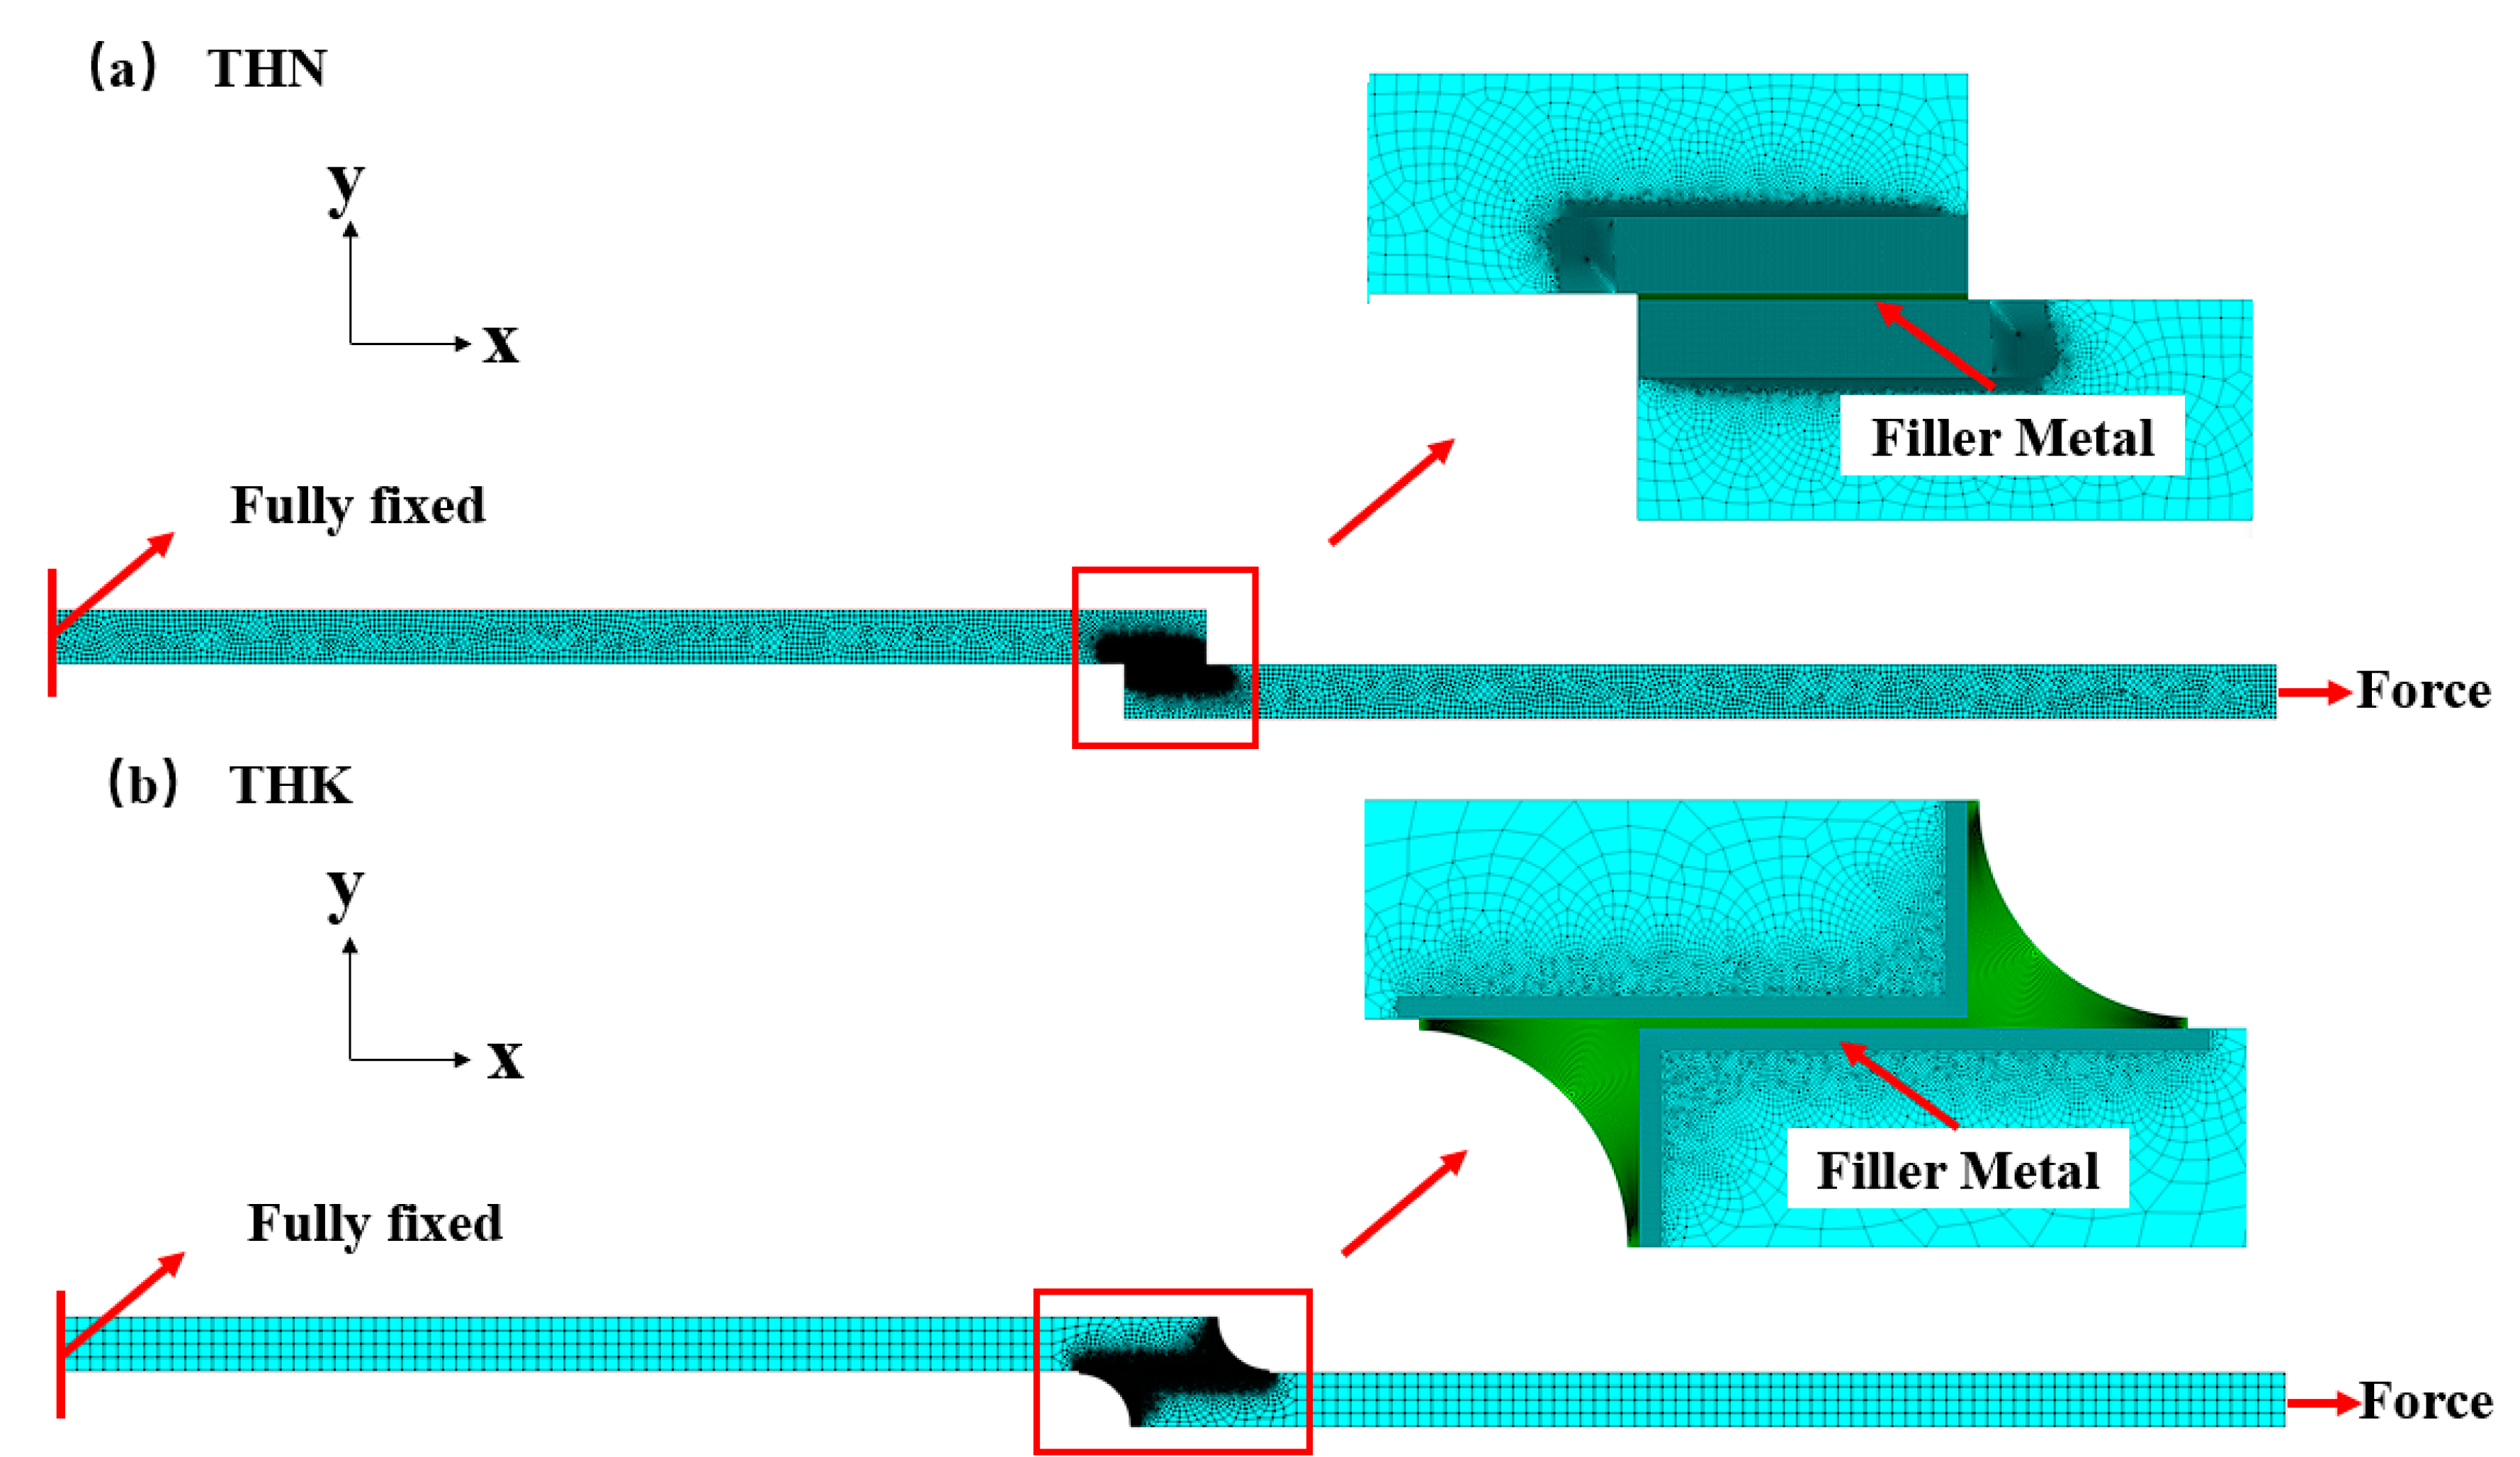
Figure 20 shows the two-dimensional plane stress model. The dimensions of the FEM model are based on the actual specimen dimensions (Figure 4). The model was meshed with the plane stress element. A non-uniform meshing method was employed, and the mesh size close to the interlayer was refined, as can be seen in the partially enlarged view. The node displacements on the one end of the lap joint were rigidly clamped in all directions and the other end was subjected to tensile force. The properties of the substrate metal and filler metal, used in the numerical simulation, are listed in Table 5.

4.2. Numerical Results and Discussion

4.2.1. Experimental Verification

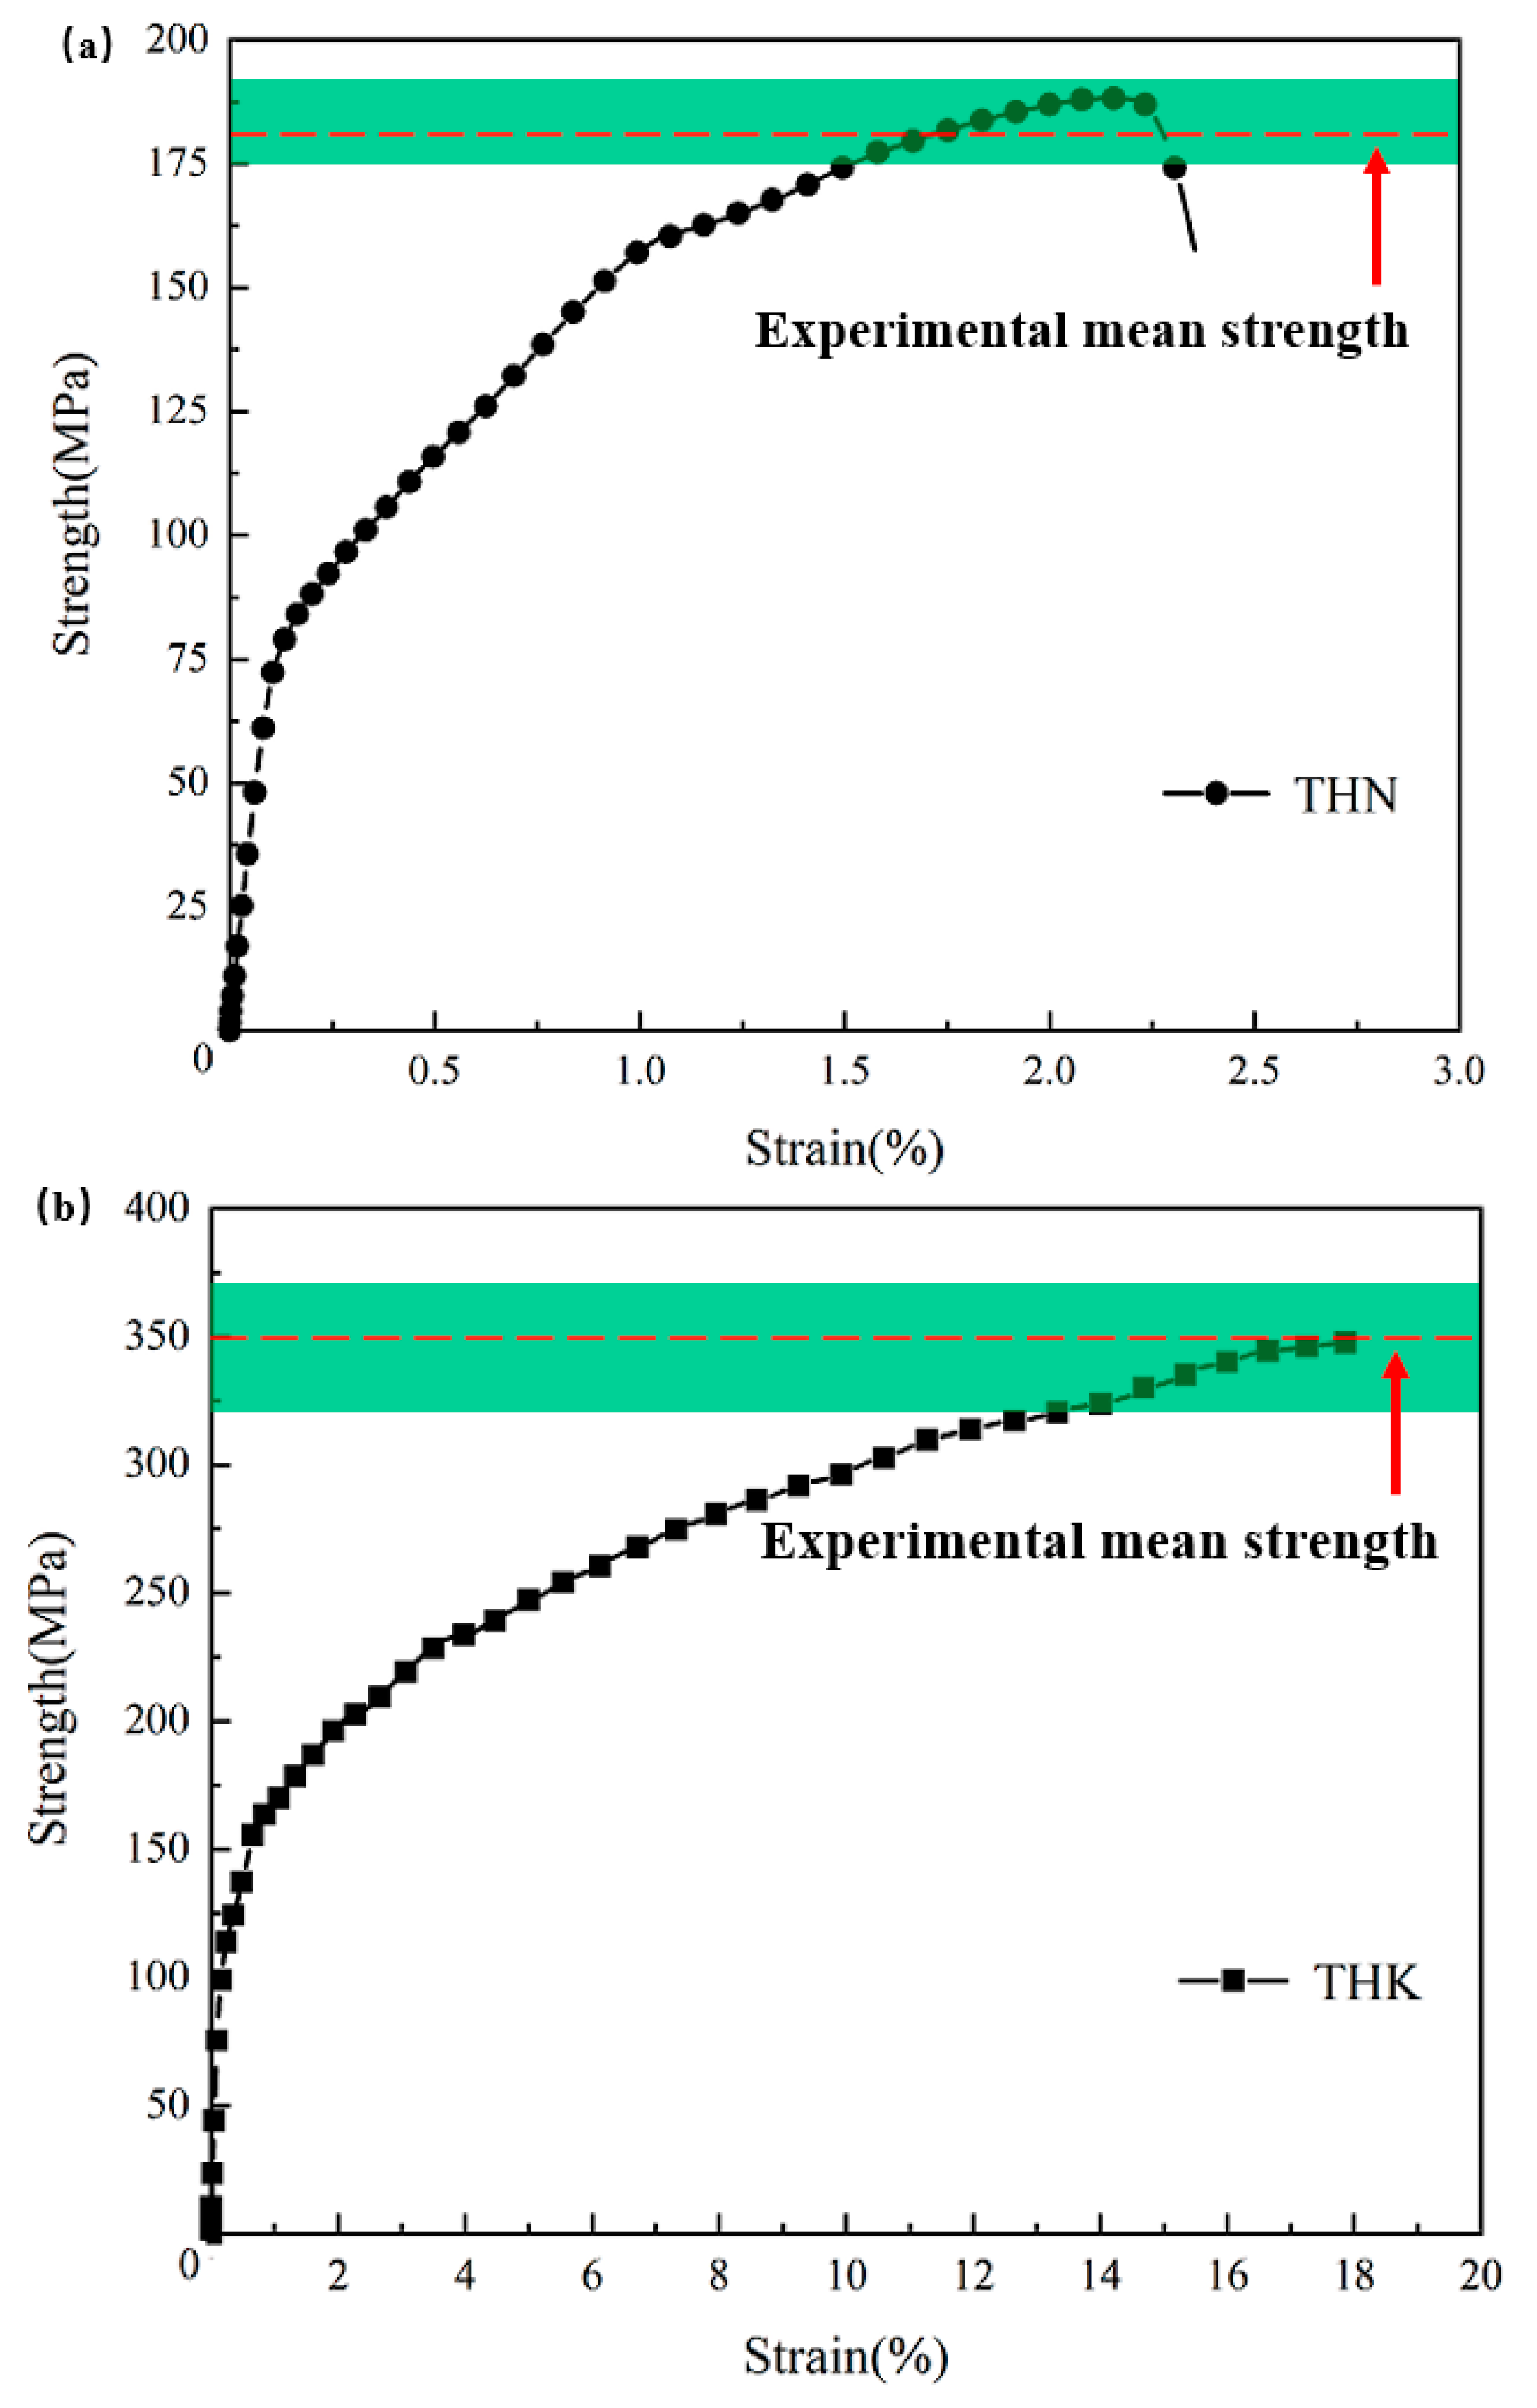
The extraction method for the reaction force and the displacement from the end of the FEM model is shown in Figure 21a,b. The experimental mean strength is also shown. Compared to Figure 13, it can be suggested that the predicted macroscopic mechanical behavior, in relation to the experiment, was quite accurate, including the accurate peak stress predictions, which were all within the experimental data range (green area). The absolute discrepancies between the prediction and experimental values were only 4.2% and 0.93% for the THN specimen and THK specimen, respectively.

4.2.2. Damage Scenarios for Specimens THN and THK

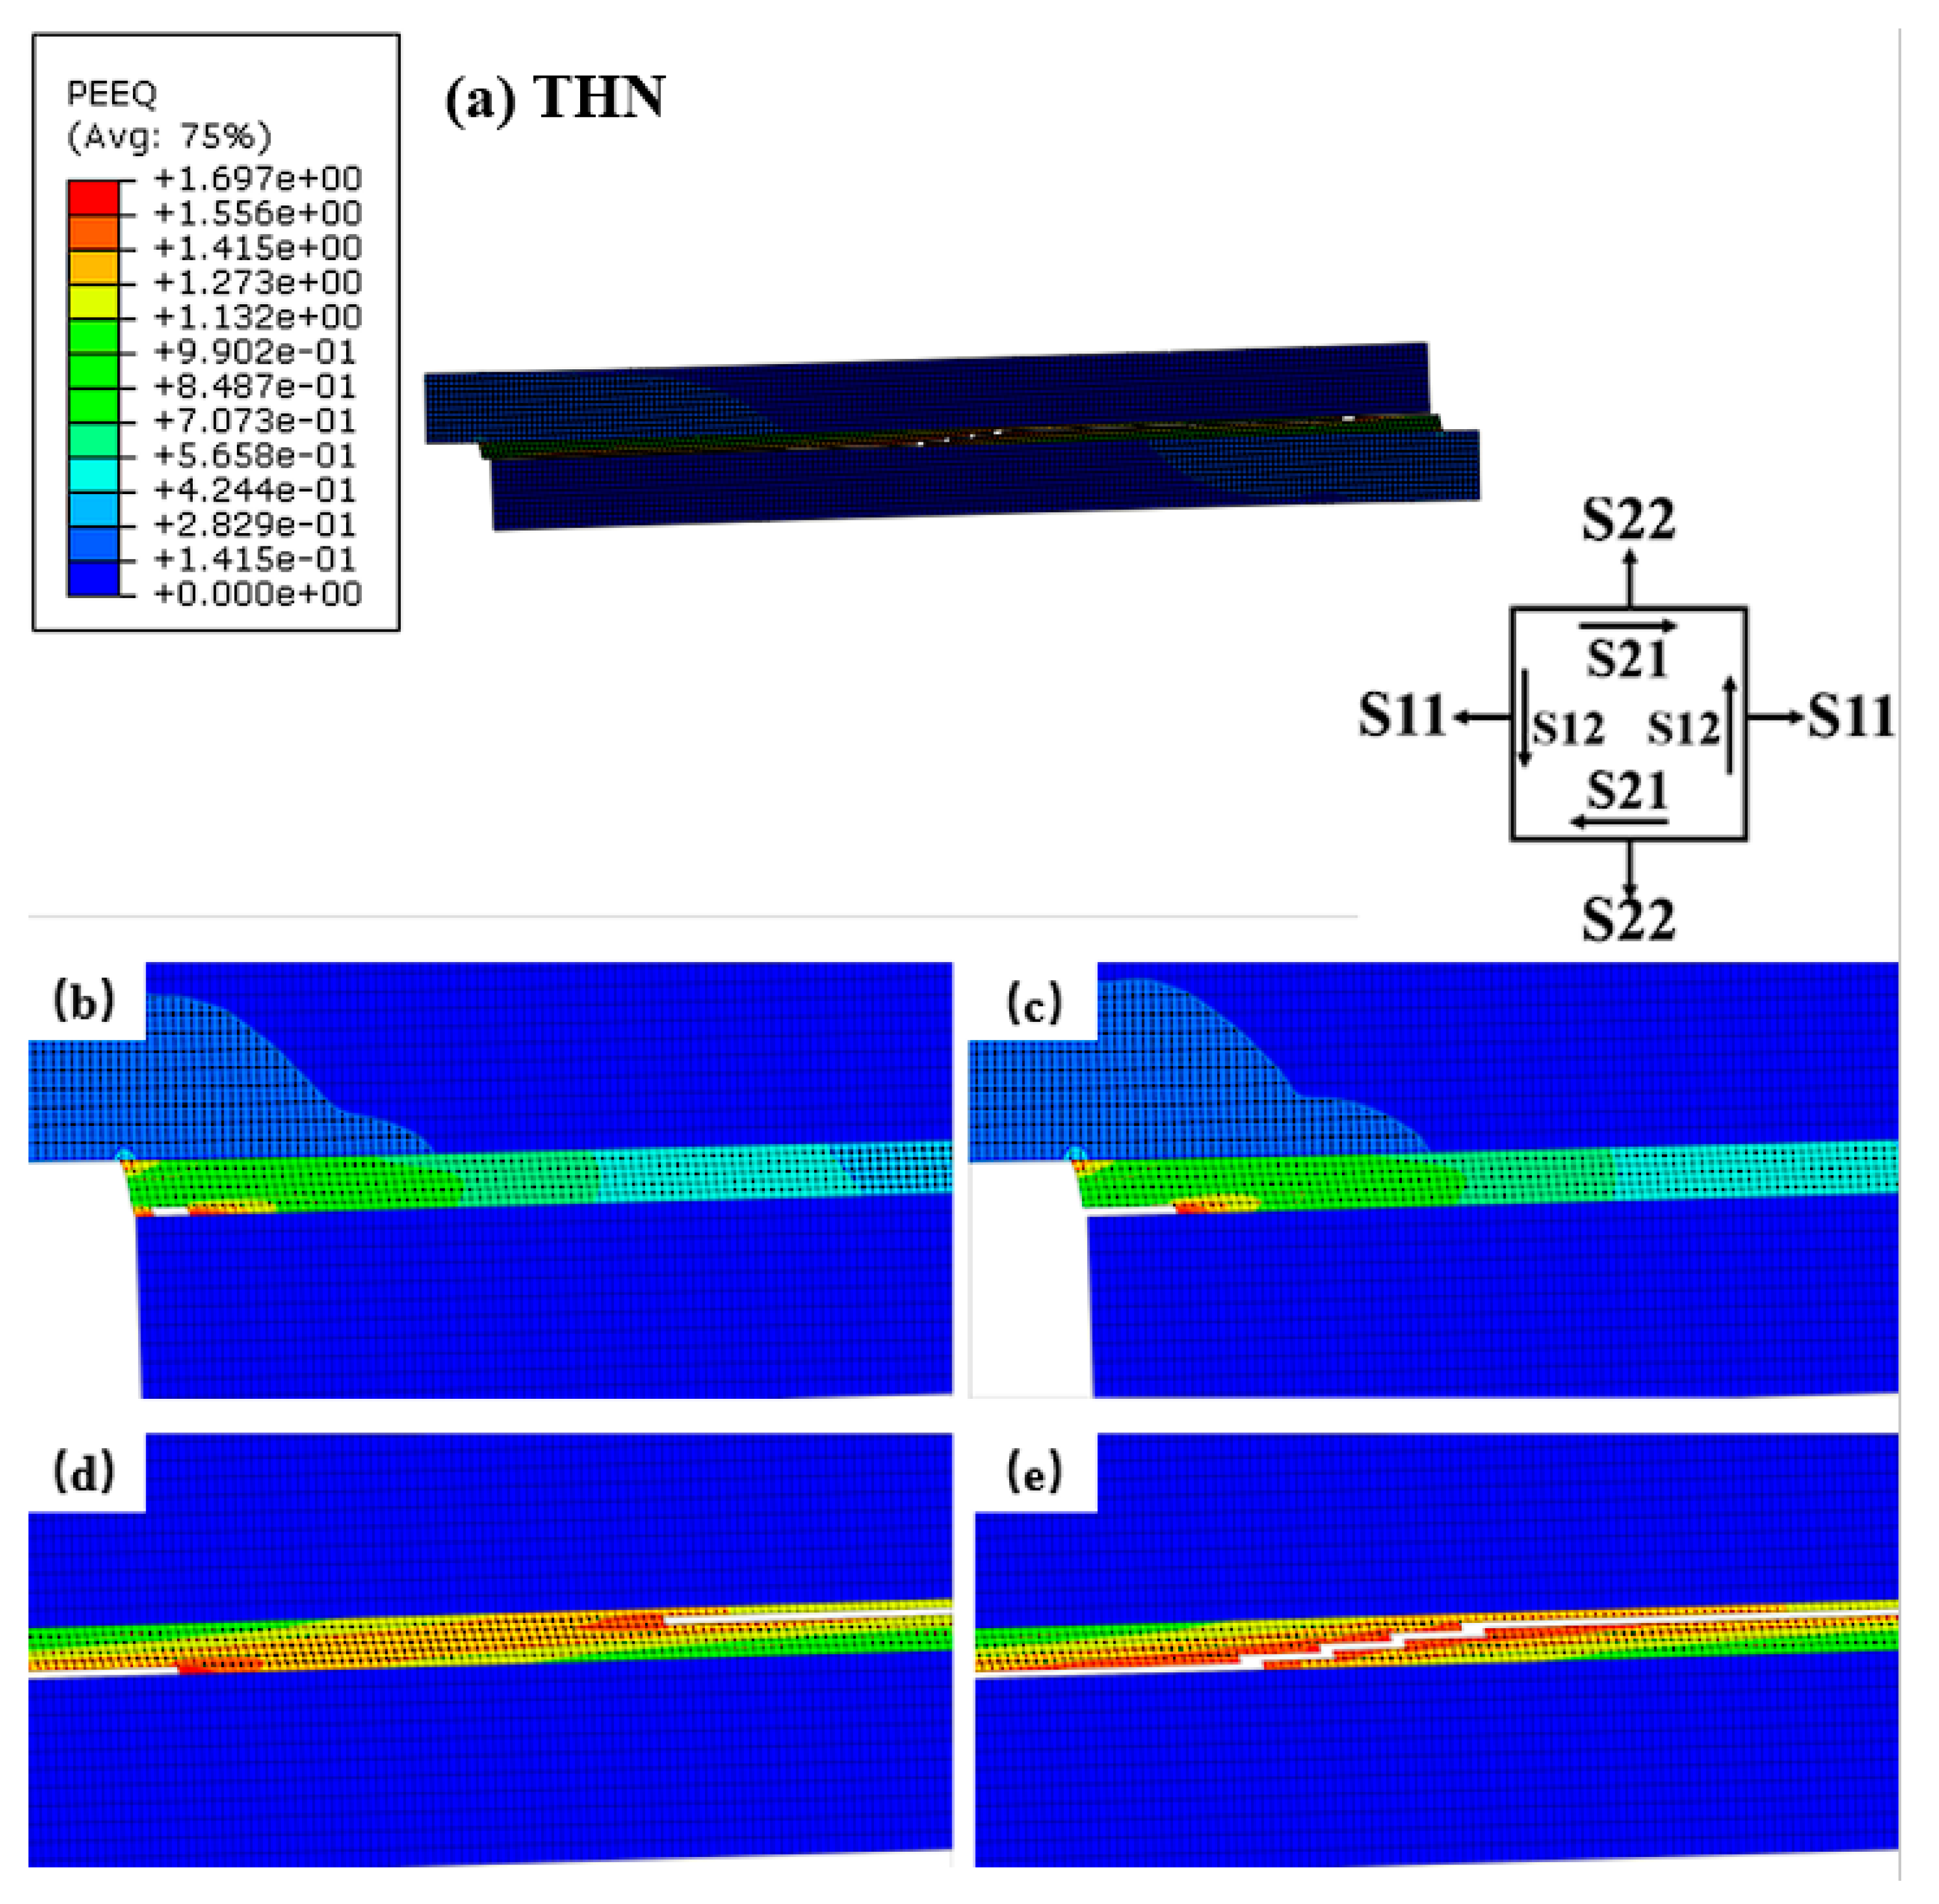
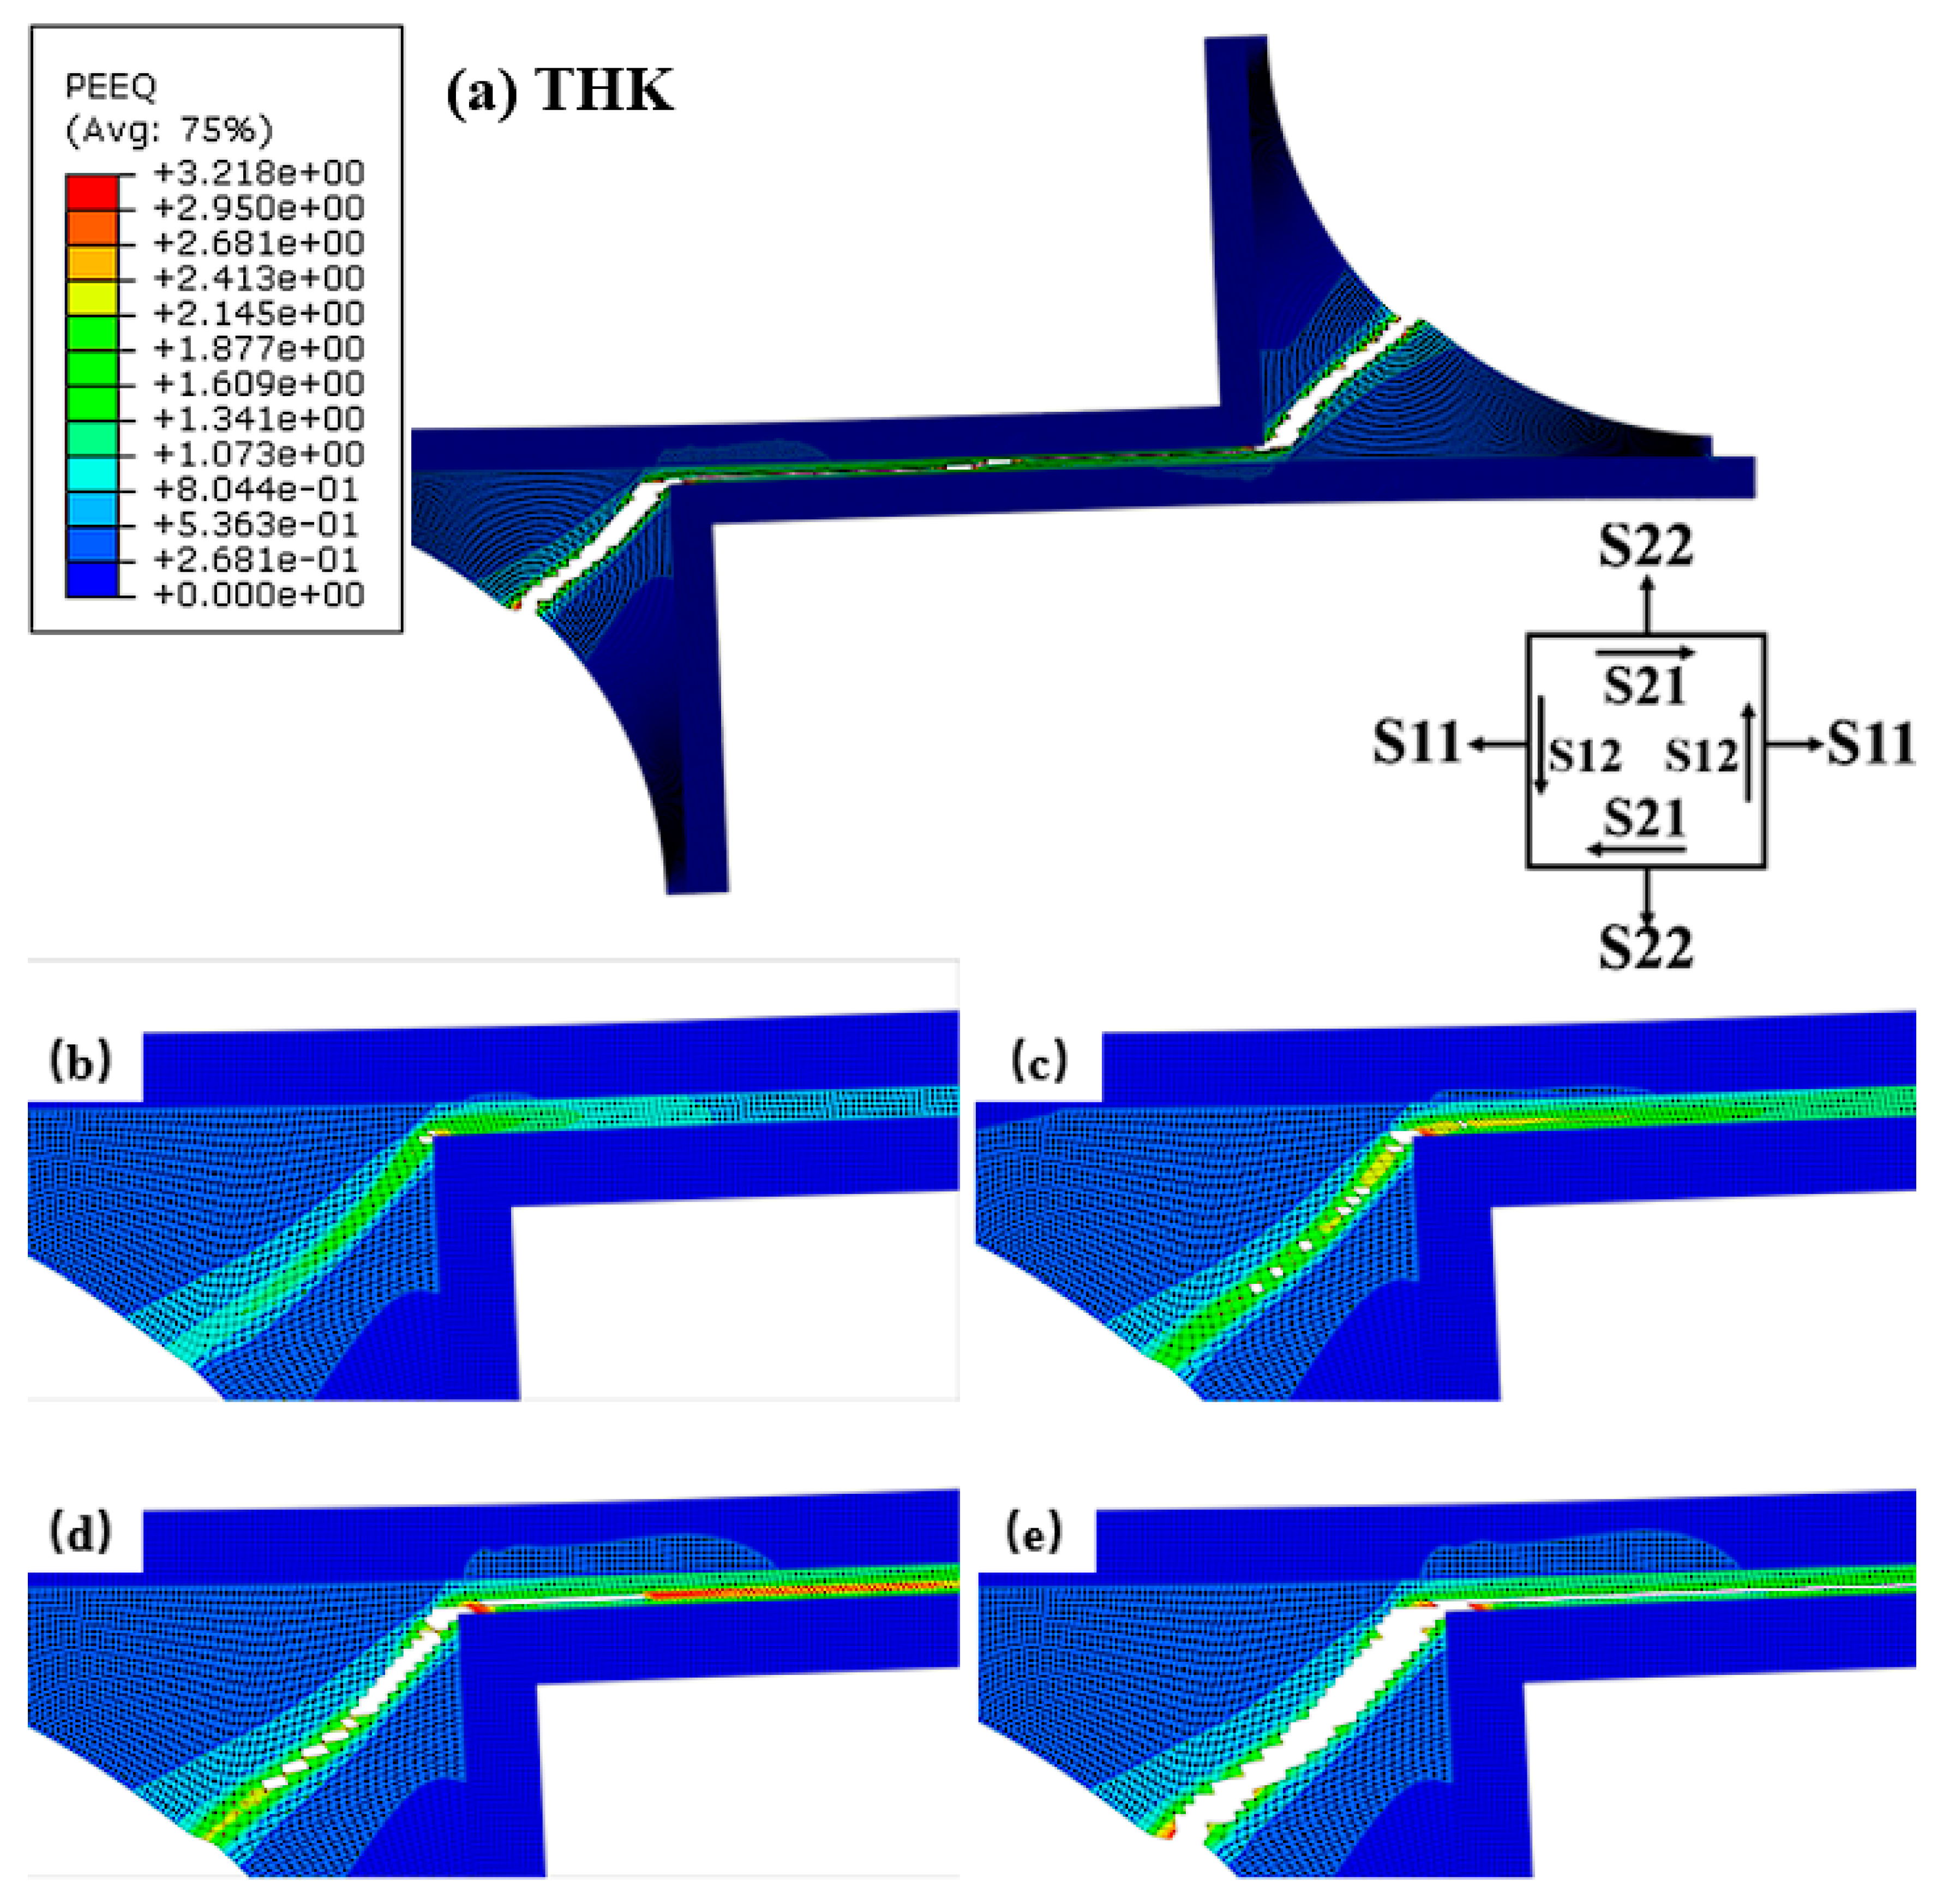
The predicted damage scenarios for specimens THN and THK during the whole loading process are shown in Figure 22 and Figure 23, respectively. The obvious difference in the final fracture morphology between the specimens THN and THK was observed and can be compared in Figure 22e and Figure 23e. The fracturing of the meniscus brazing fillets also occurred, in addition to the failure of the seam in the specimen THK. The specific region of the fillet fracture was located at the center of the arc-like free edge, which is similar to the experimental results in the metallographic examination (see Figure 14b). For specimen THN, as illustrated in Figure 22b, the initiation of the failure was located at both corners of the brazing seam and occurred due to the significant stress concentration induced by the stiffness mismatch. After that, the two interfacial cracks propagate together into the middle of the brazing seam (Figure 22c,d), and finally coalesce into one through crack, resulting in the macro destruction of the specimen THN (Figure 22e). In comparison, and in spite of the similar fracture initiation location (i.e., at the corners of the brazing seam in Figure 23b), the cracks prefer to propagate into the meniscus brazing fillets rather than the middle of the brazing seam, as shown in Figure 23c,d. In other words, due to the existence of the brazing fillets, the fracture path of specimen THK is longer and more tortuous than specimen THN, thereby leading to a portion of energies being released similar to the failure in the brazing fillet. Thus, the failure in the brazing seam of specimen THK was postponed. Meanwhile, the plastic deformation and the ultimate failure strength of specimen THK were far higher than for specimen THN.

4.2.3. Stress Analyses of Specimens THN and THK

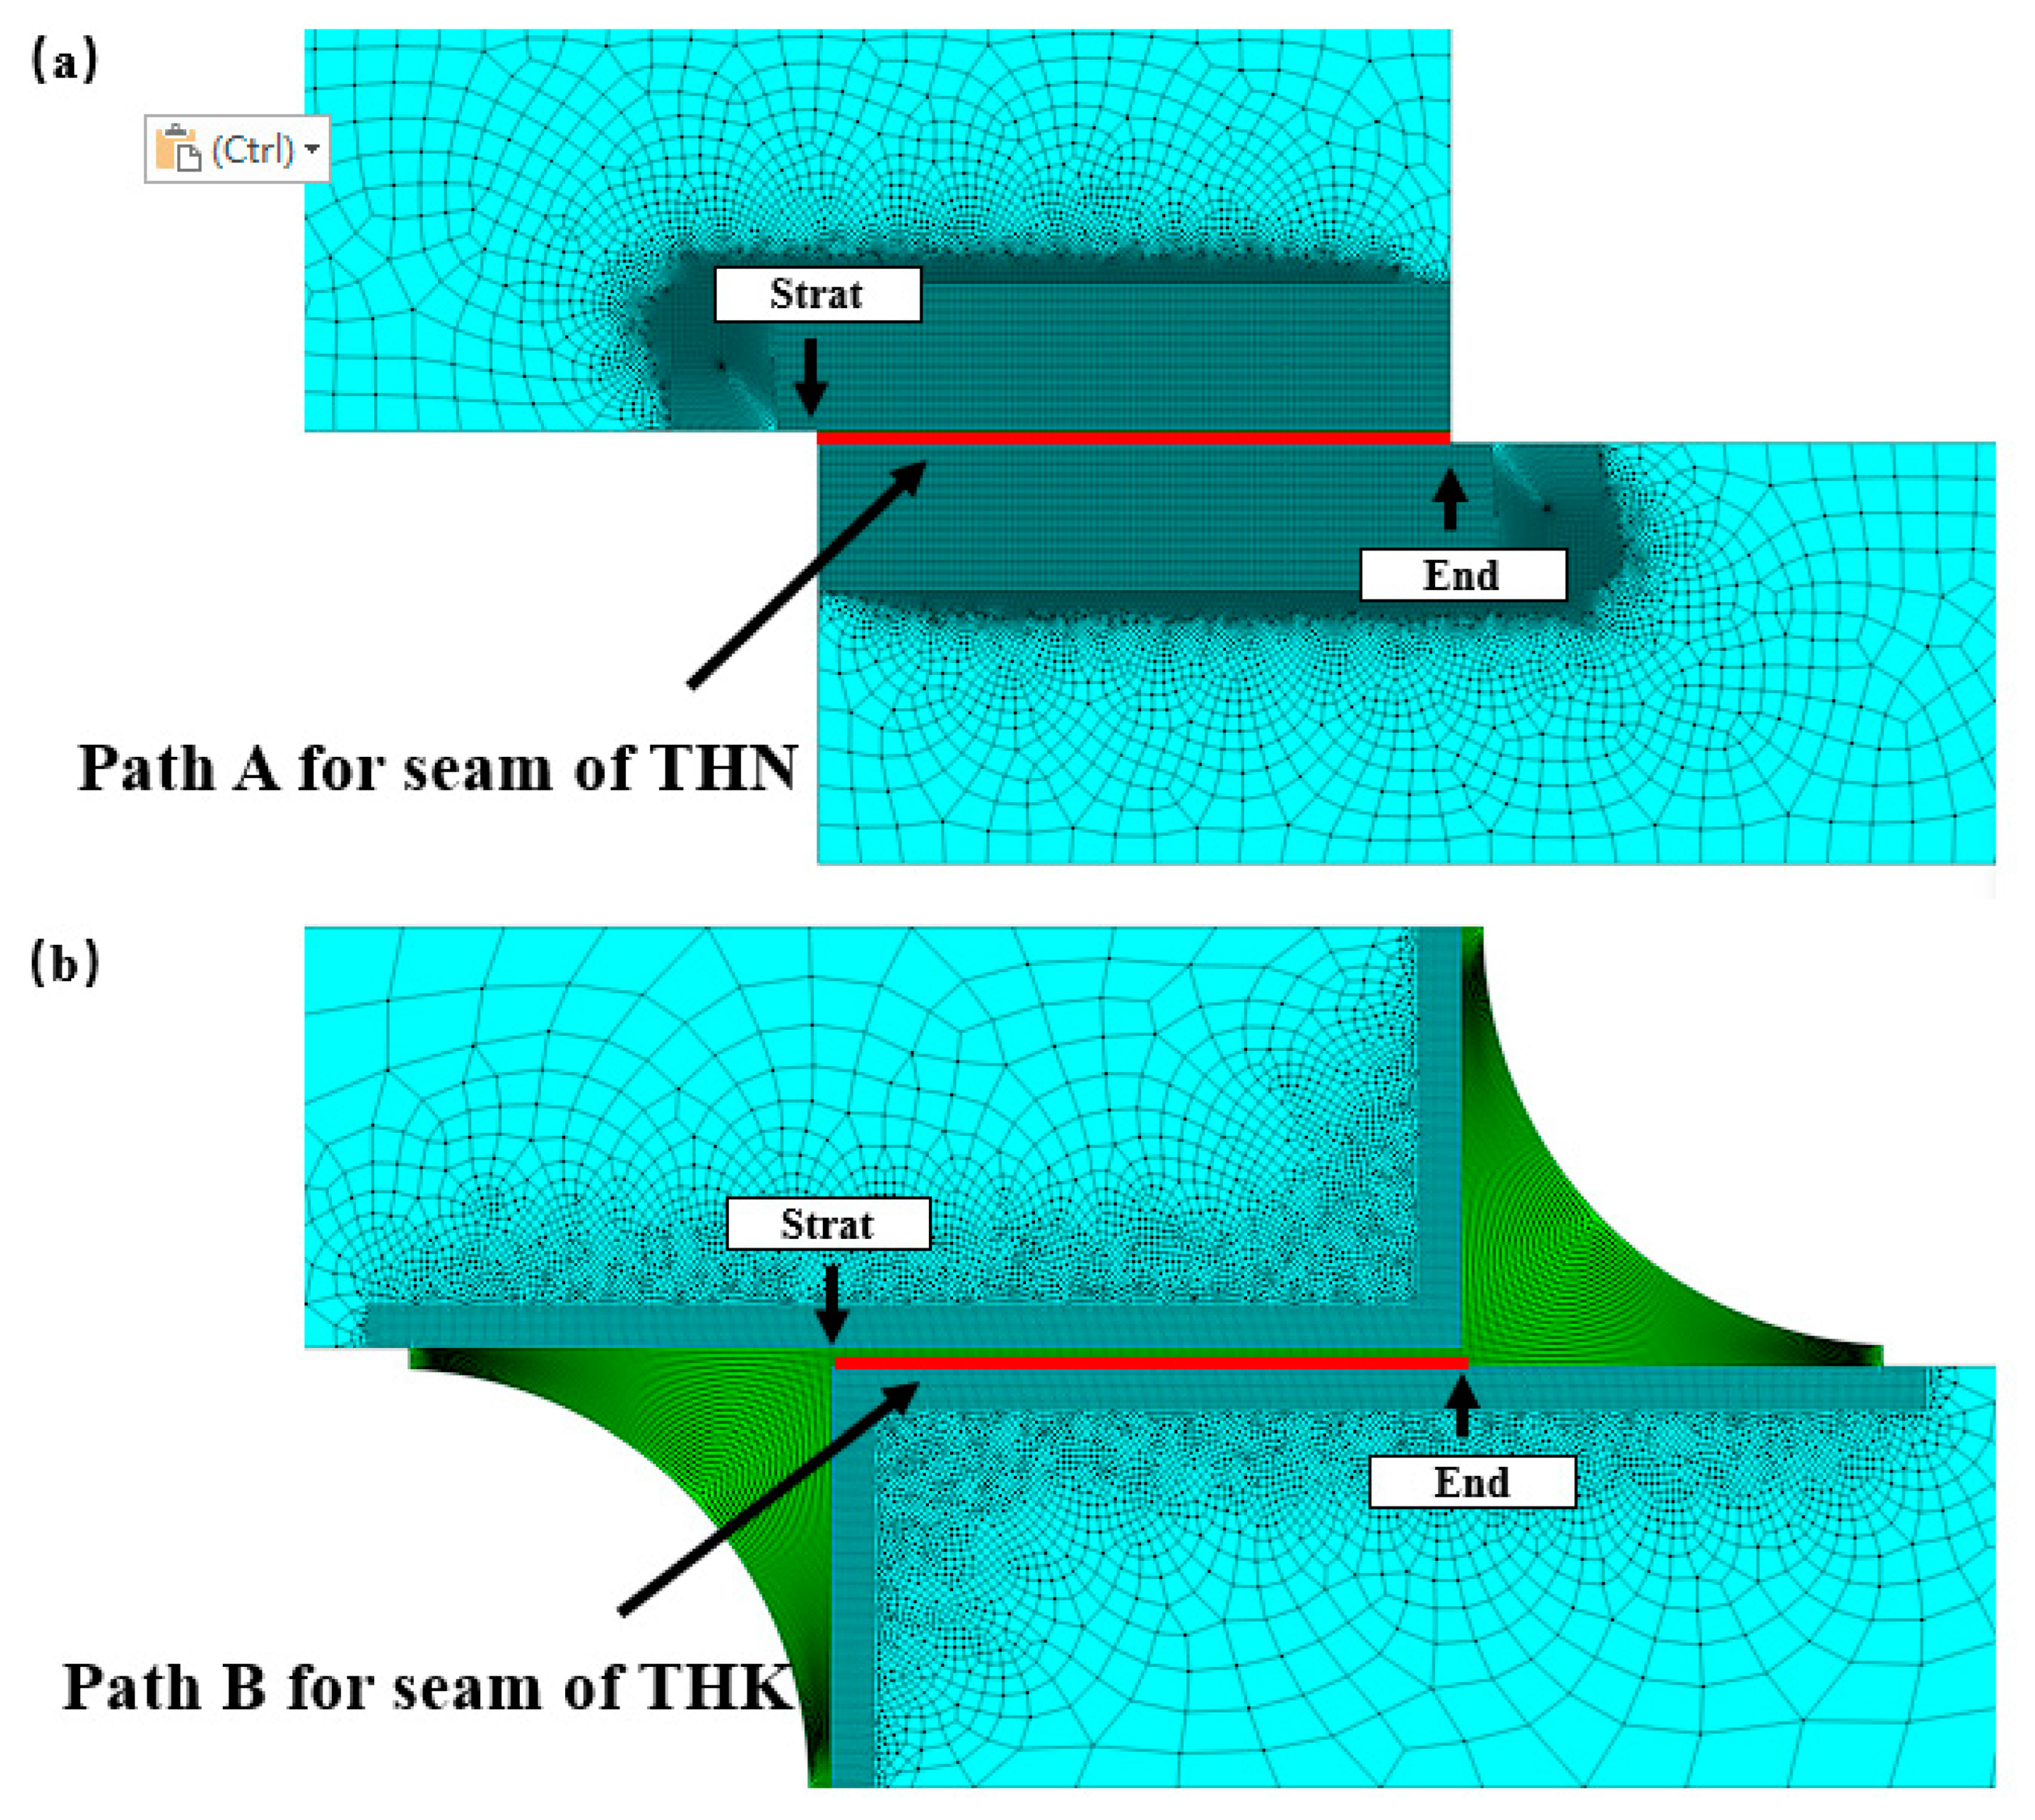
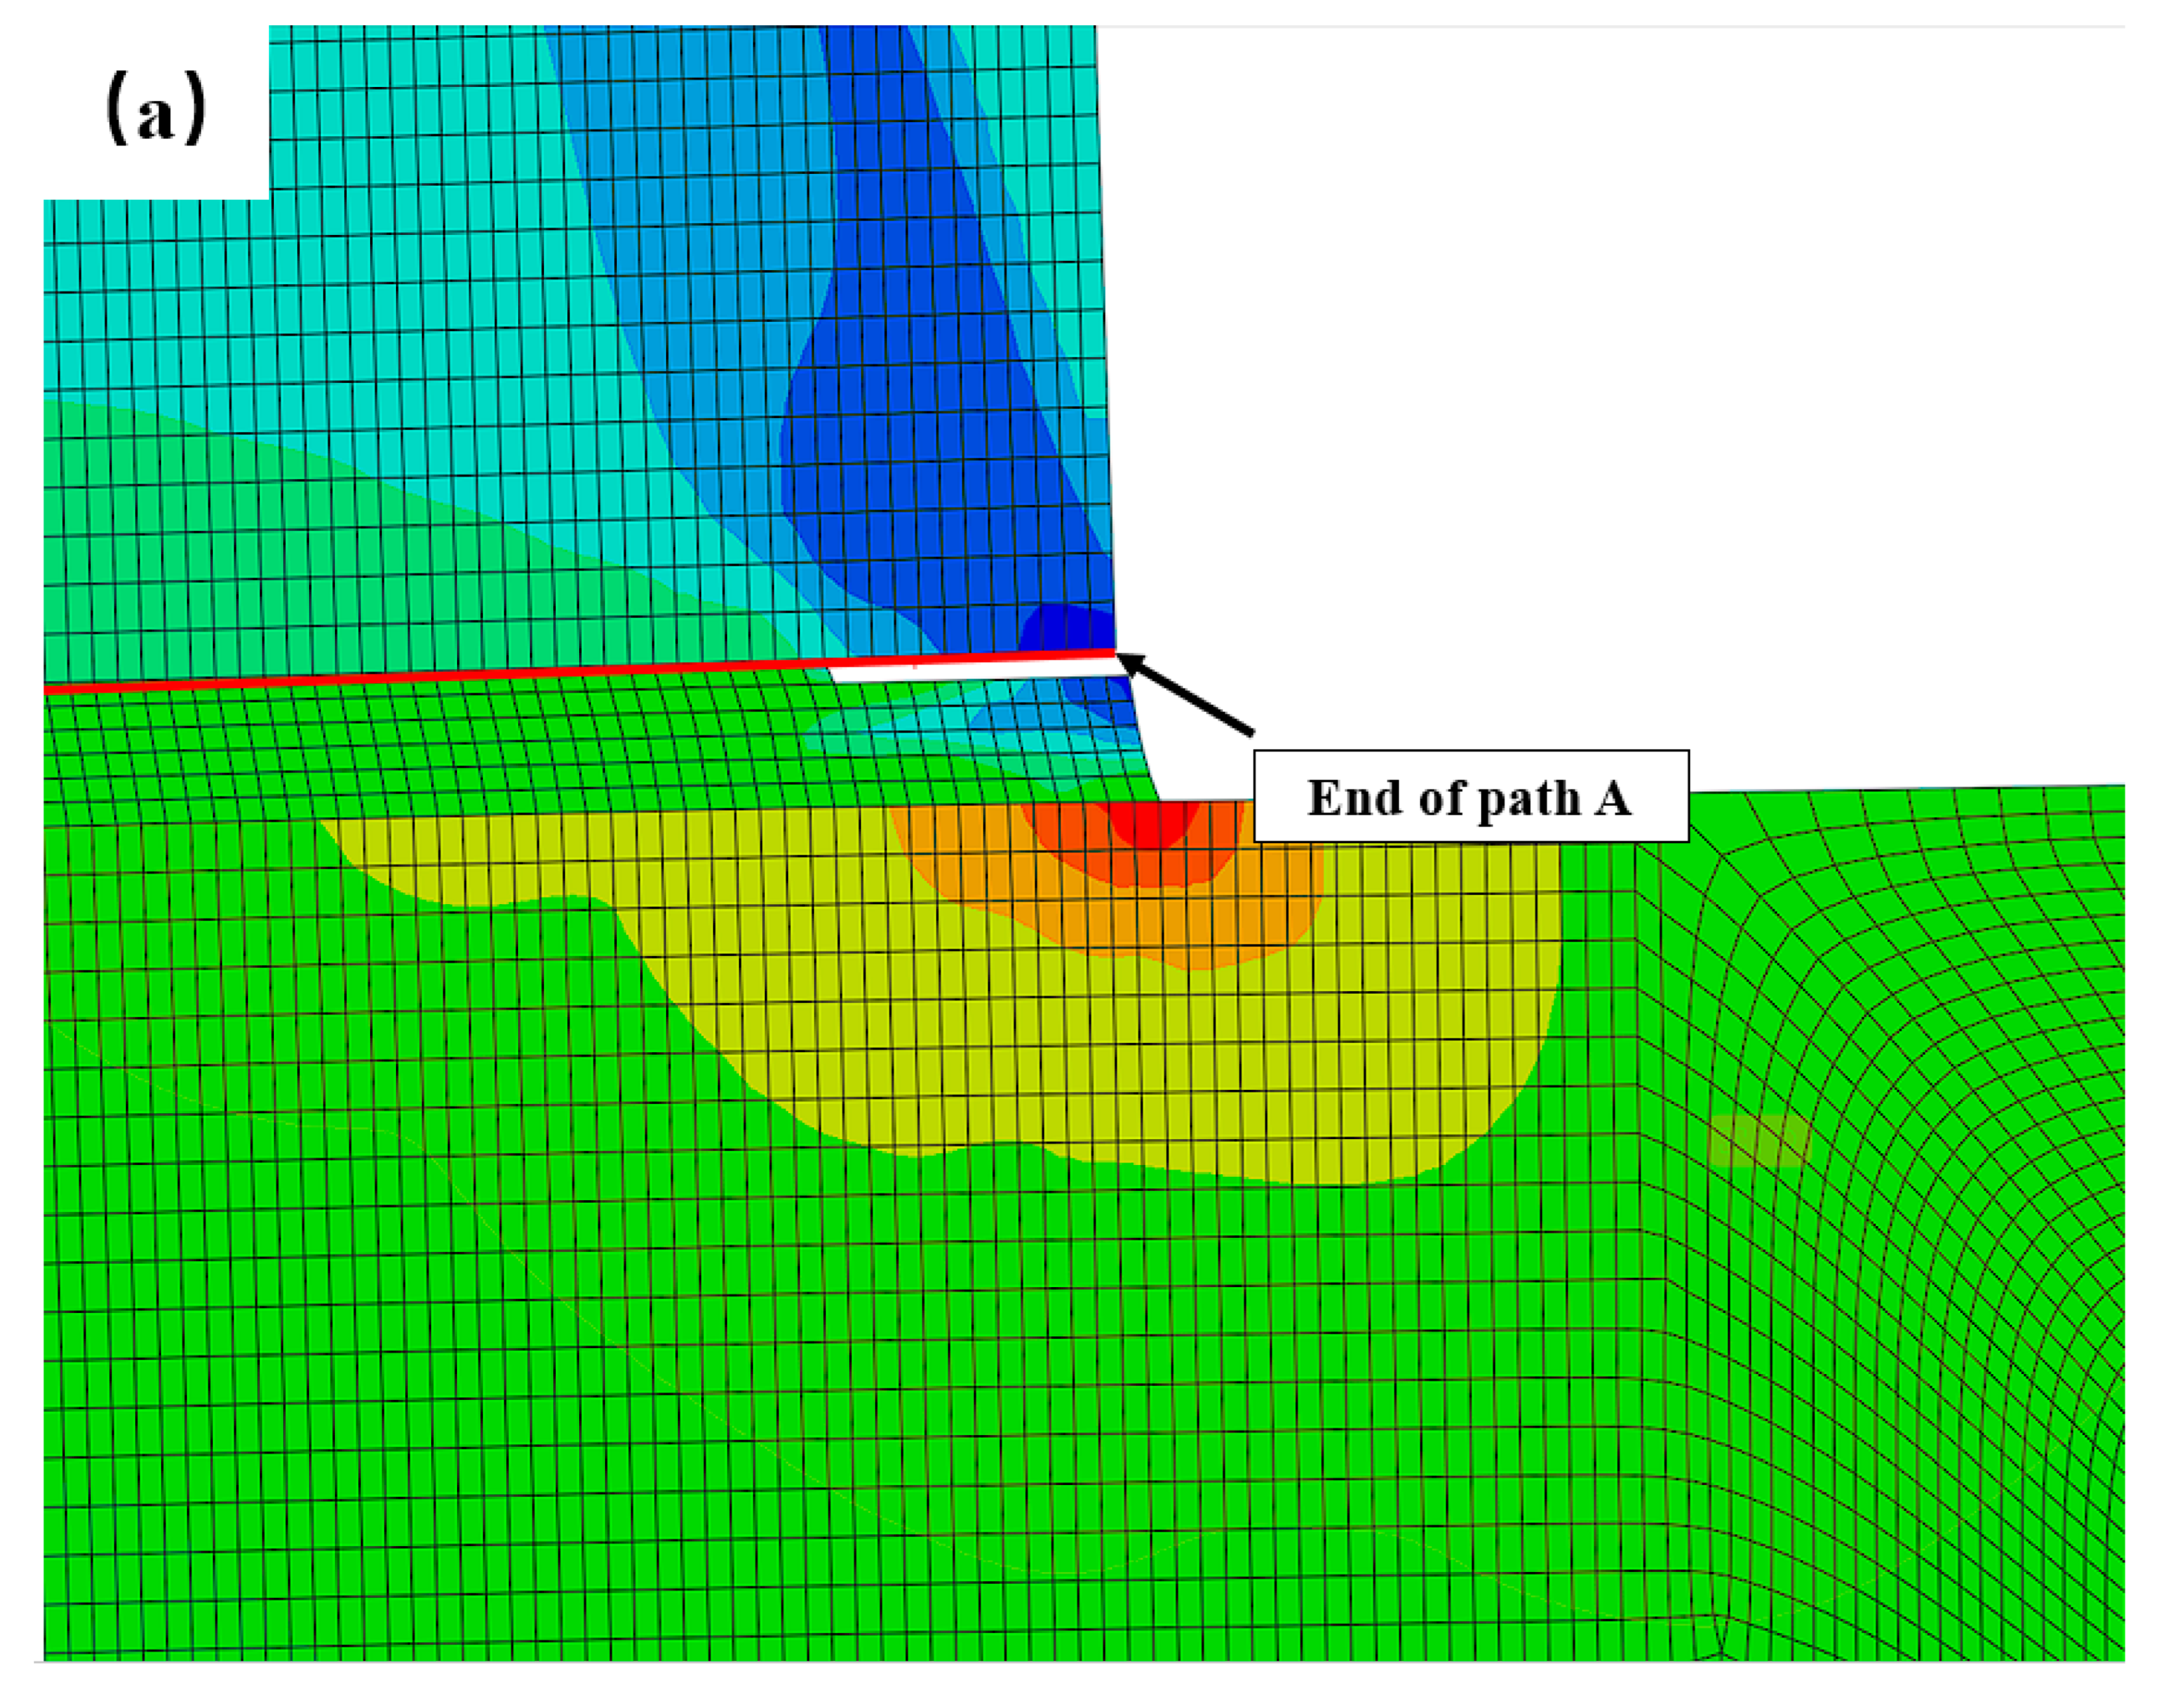
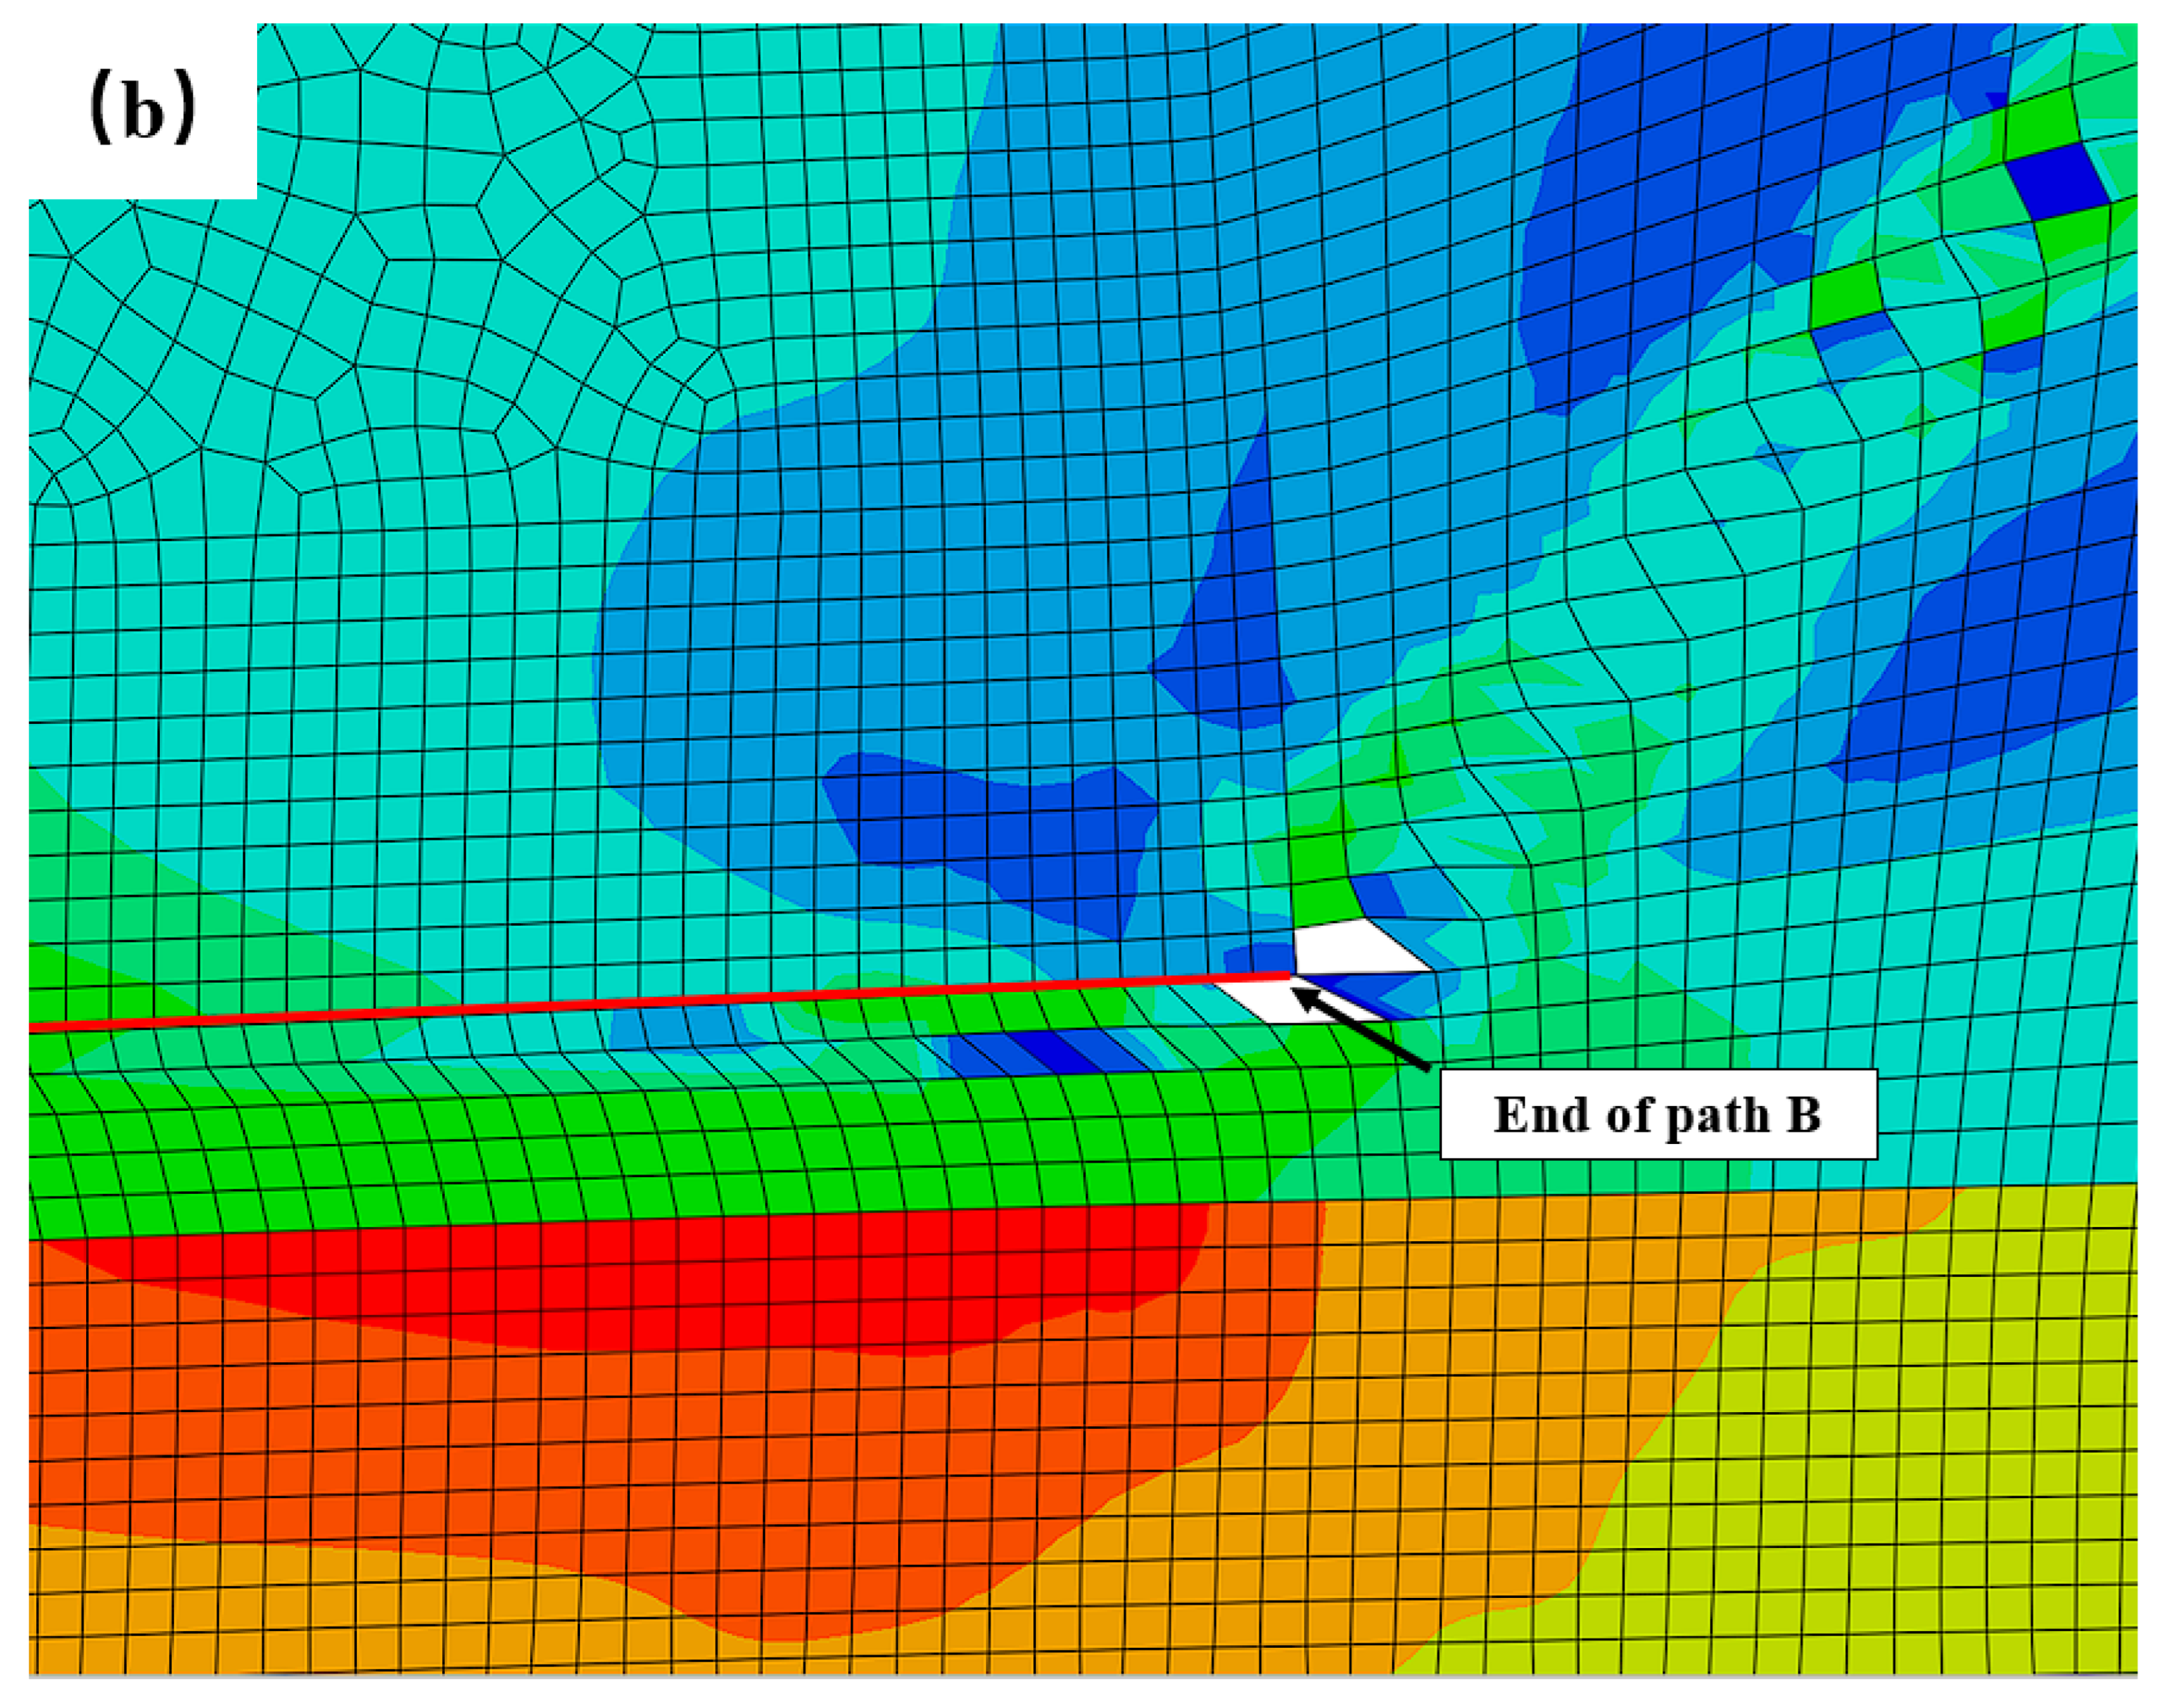
In order to further analyze the stress distribution in the brazing seam of specimens THN and THK, both path A and path B were selected in the brazing seam, as shown in Figure 24a,b.
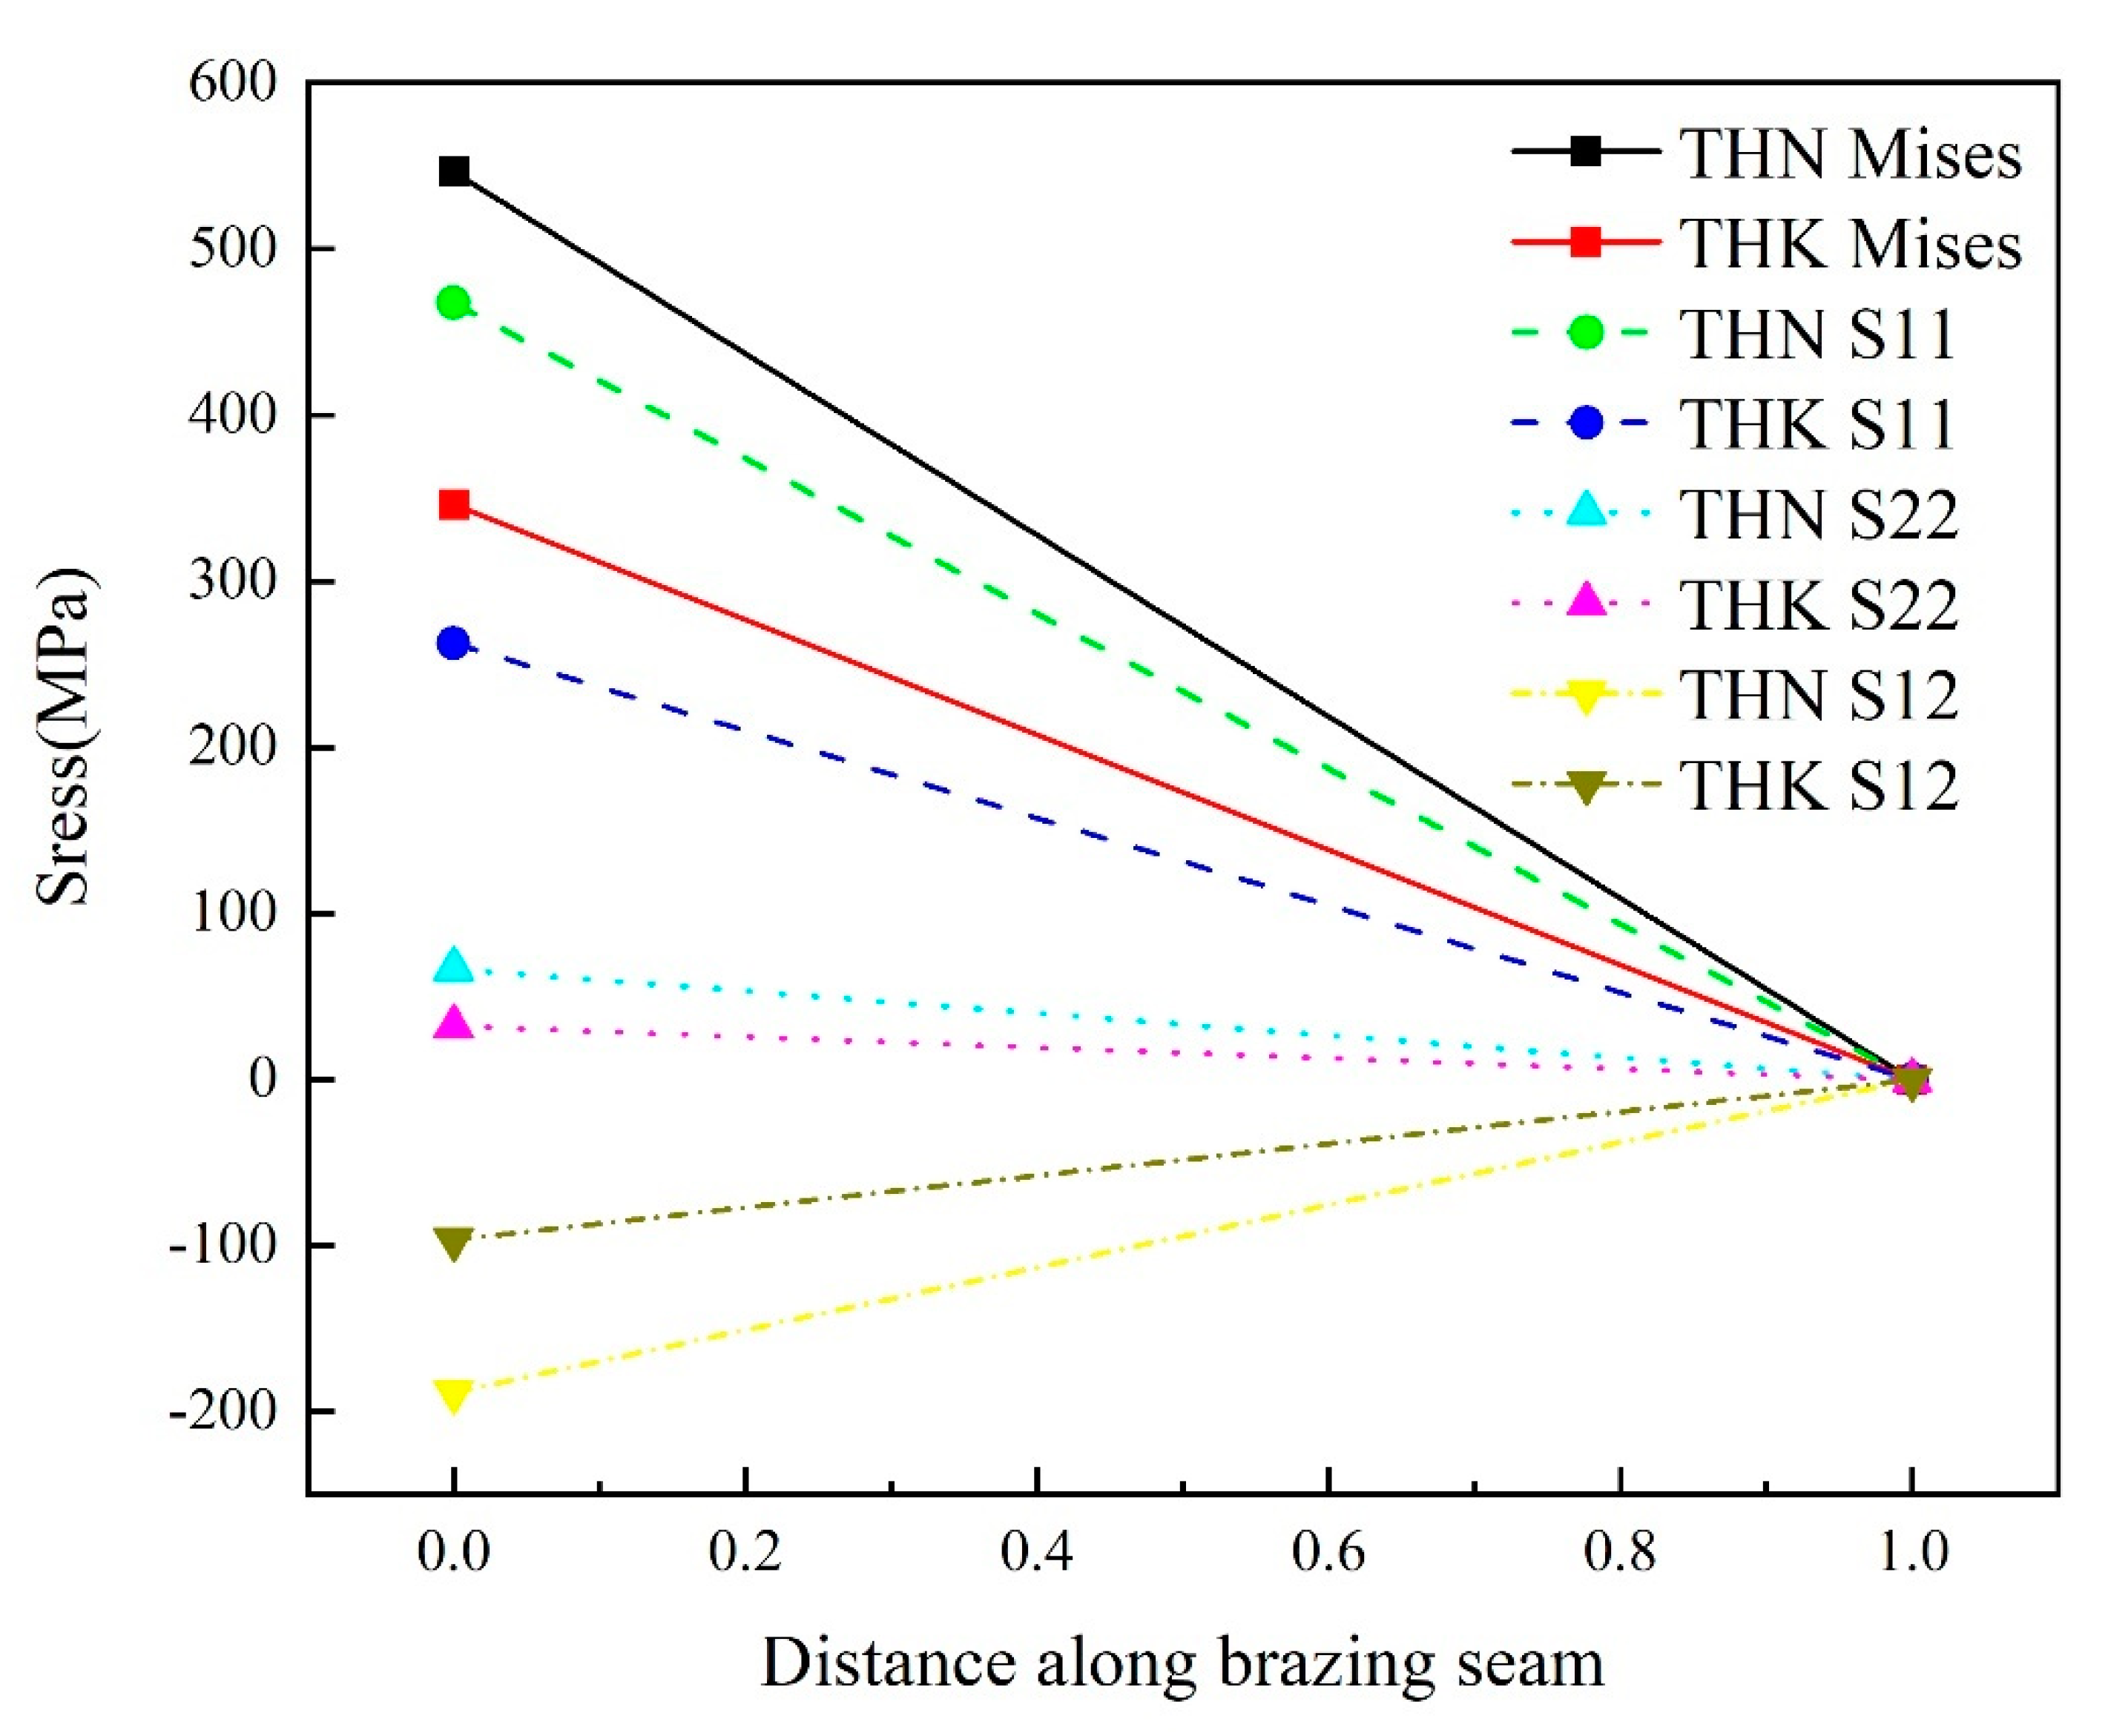
Figure 25 presents the stress distribution in the brazing seam of specimen THN and specimen THK at the peak strength, including normal stresses S11 and S22, shear stress S12, and the Von-Mises stress. The value of the aforementioned stresses at the end of the path is zero, since this is where the failure has occurred, meaning the corresponding meshes have been deleted (Figure 26). The normal stress S11 and shear stress S12 values are much higher than the value of S22 in both THK and THN. This indicates that regardless of the copper foil thickness, the fracture of the brazing seam was caused by a combination of S11 and S12, which act in parallel to the plane of the interfacial crack. Therefore, the dominant failure mechanism in the brazing seam is the fracture by mode II, which is perfectly consistent with the SEM fractography shown in Figure 16 and Figure 17. In addition, by comparing the stresses in the brazing seam, it can be seen that even though THK is subjected to a higher peak load, which is about twice that in the THN specimen, the THK specimen is still subjected to lower stress at the brazing seam, with a Von-Mises stress of only 342 MPa, whereas the THN specimen was subjected to a stress of 556 MPa, thereby suggesting that the meniscus fillet can substantially reduce the stress concentration at the brazing seam, and thus, promote a more even distribution of stresses across the whole specimen.
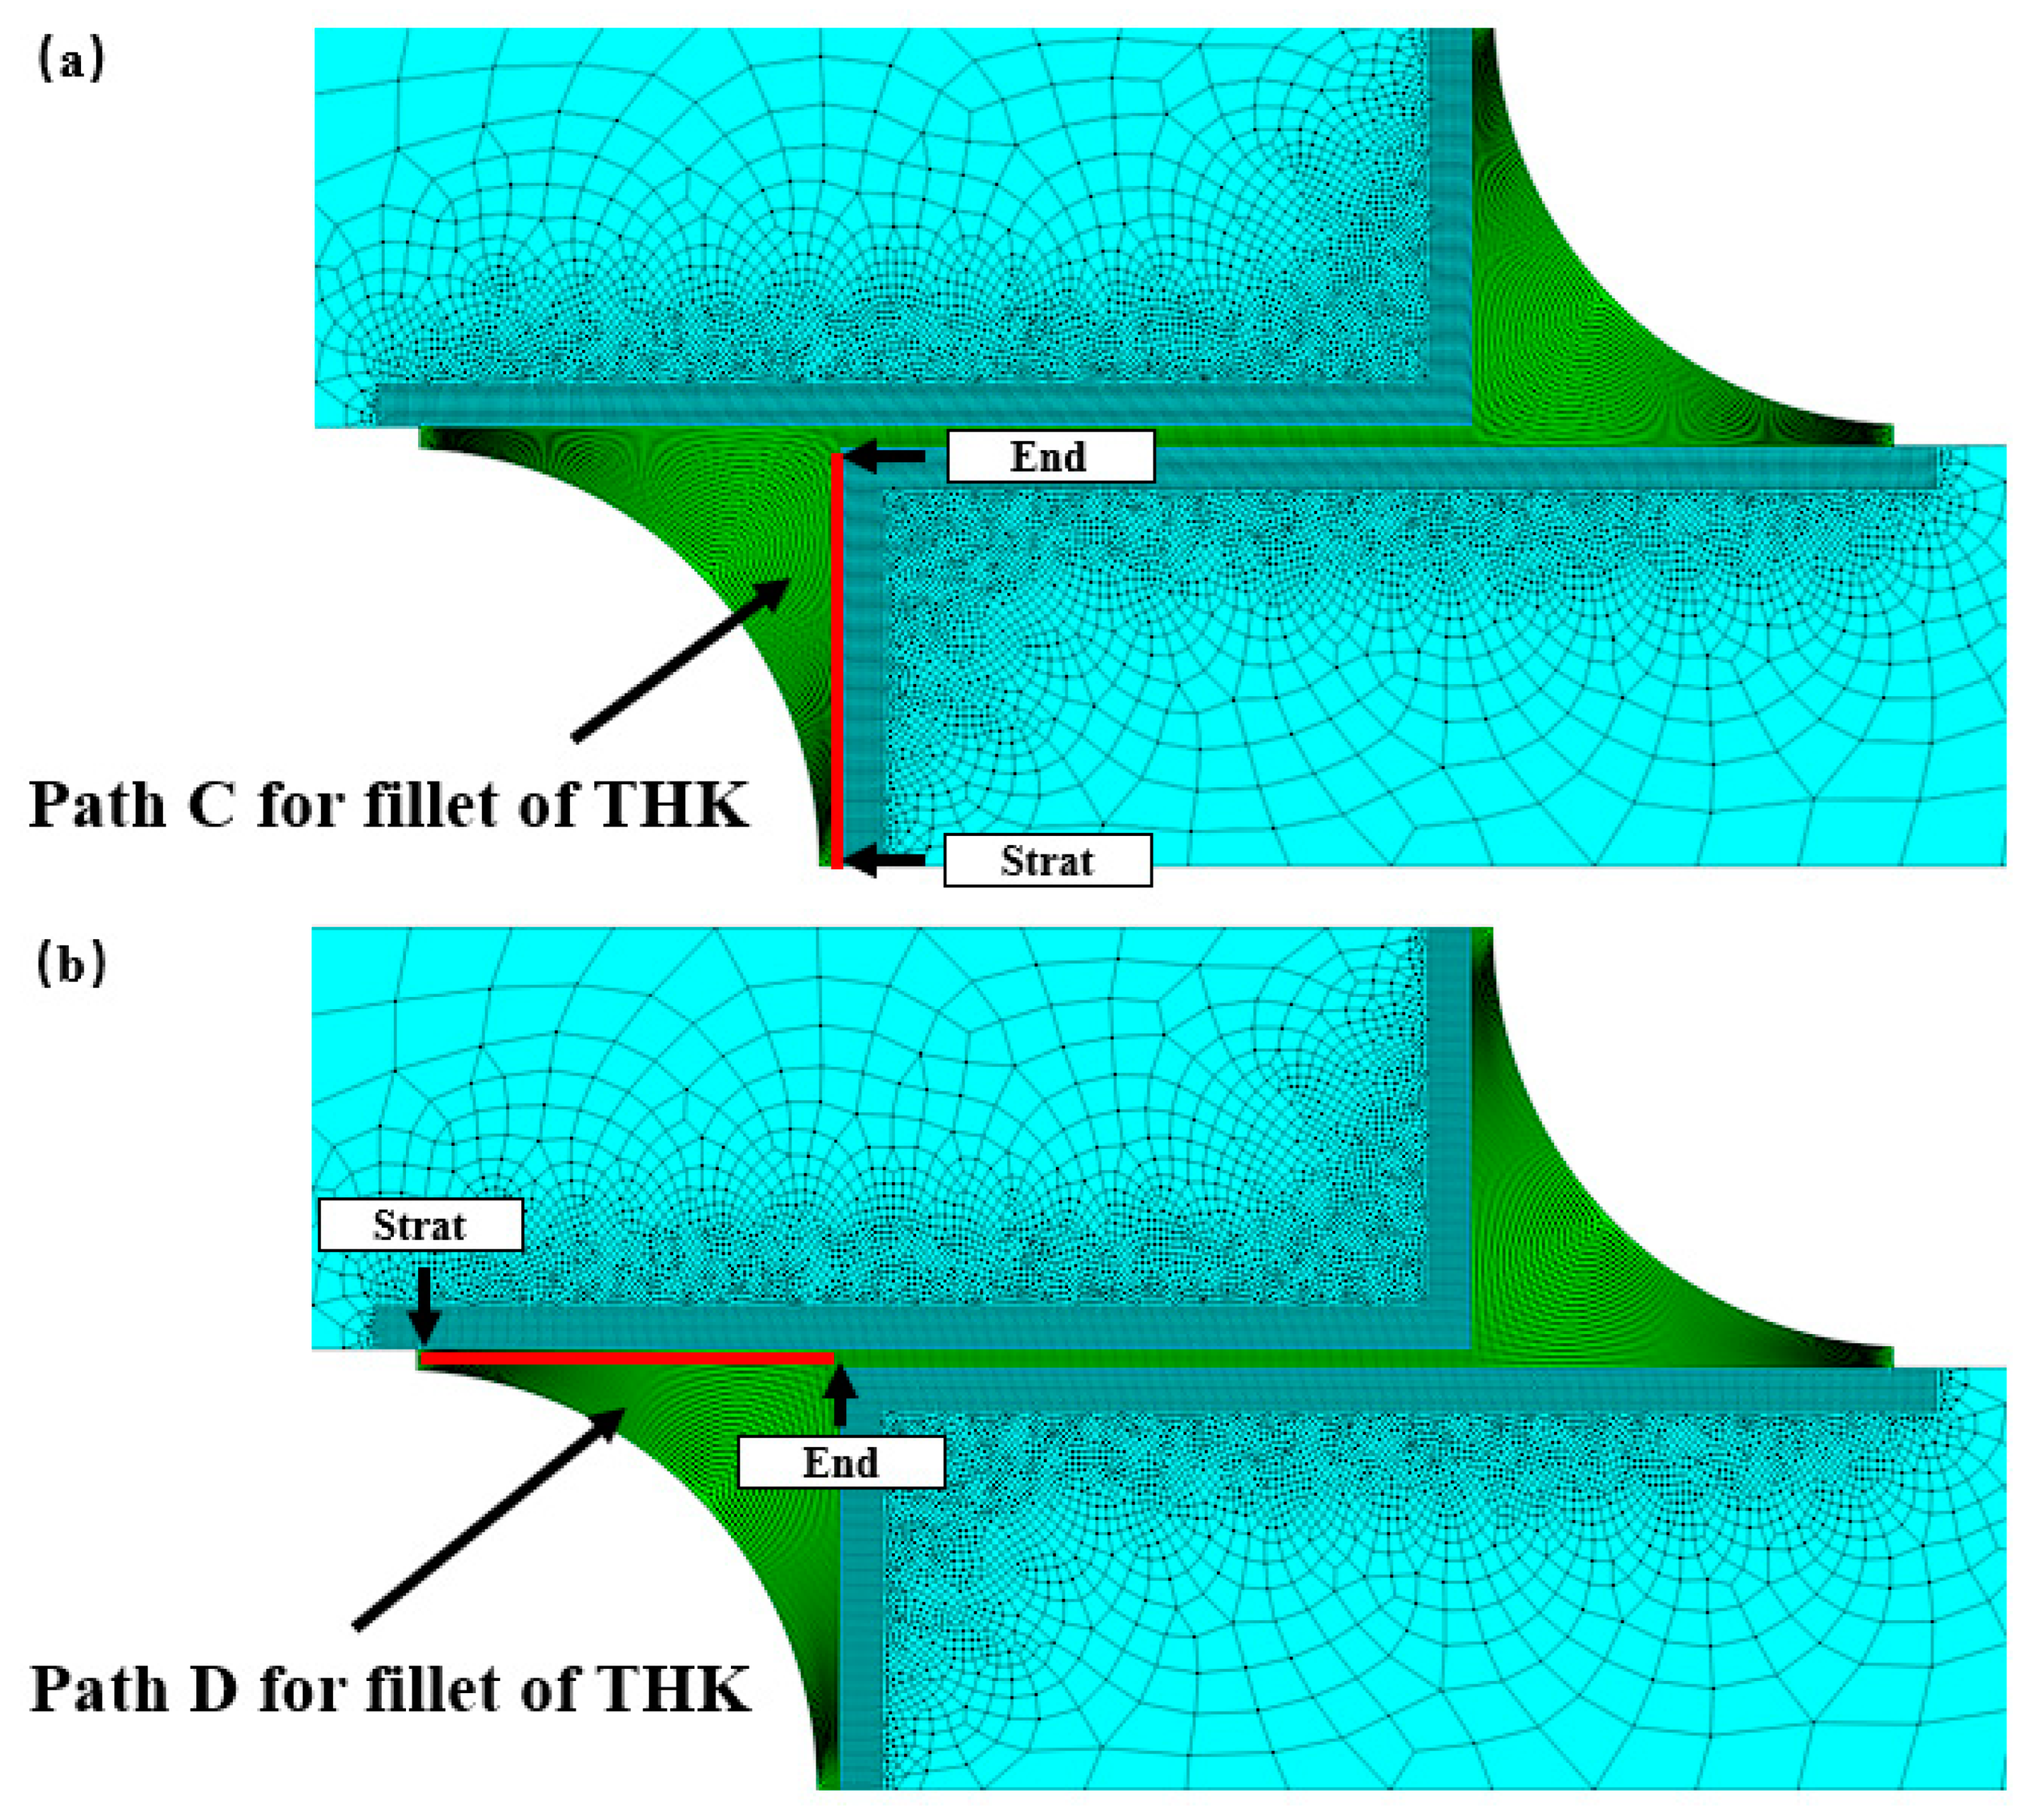
To better acquire the enhancement mechanism of the meniscus fillet, the distribution of stress at the fillet of the specimen THK has also been extracted, as shown in Figure 27.
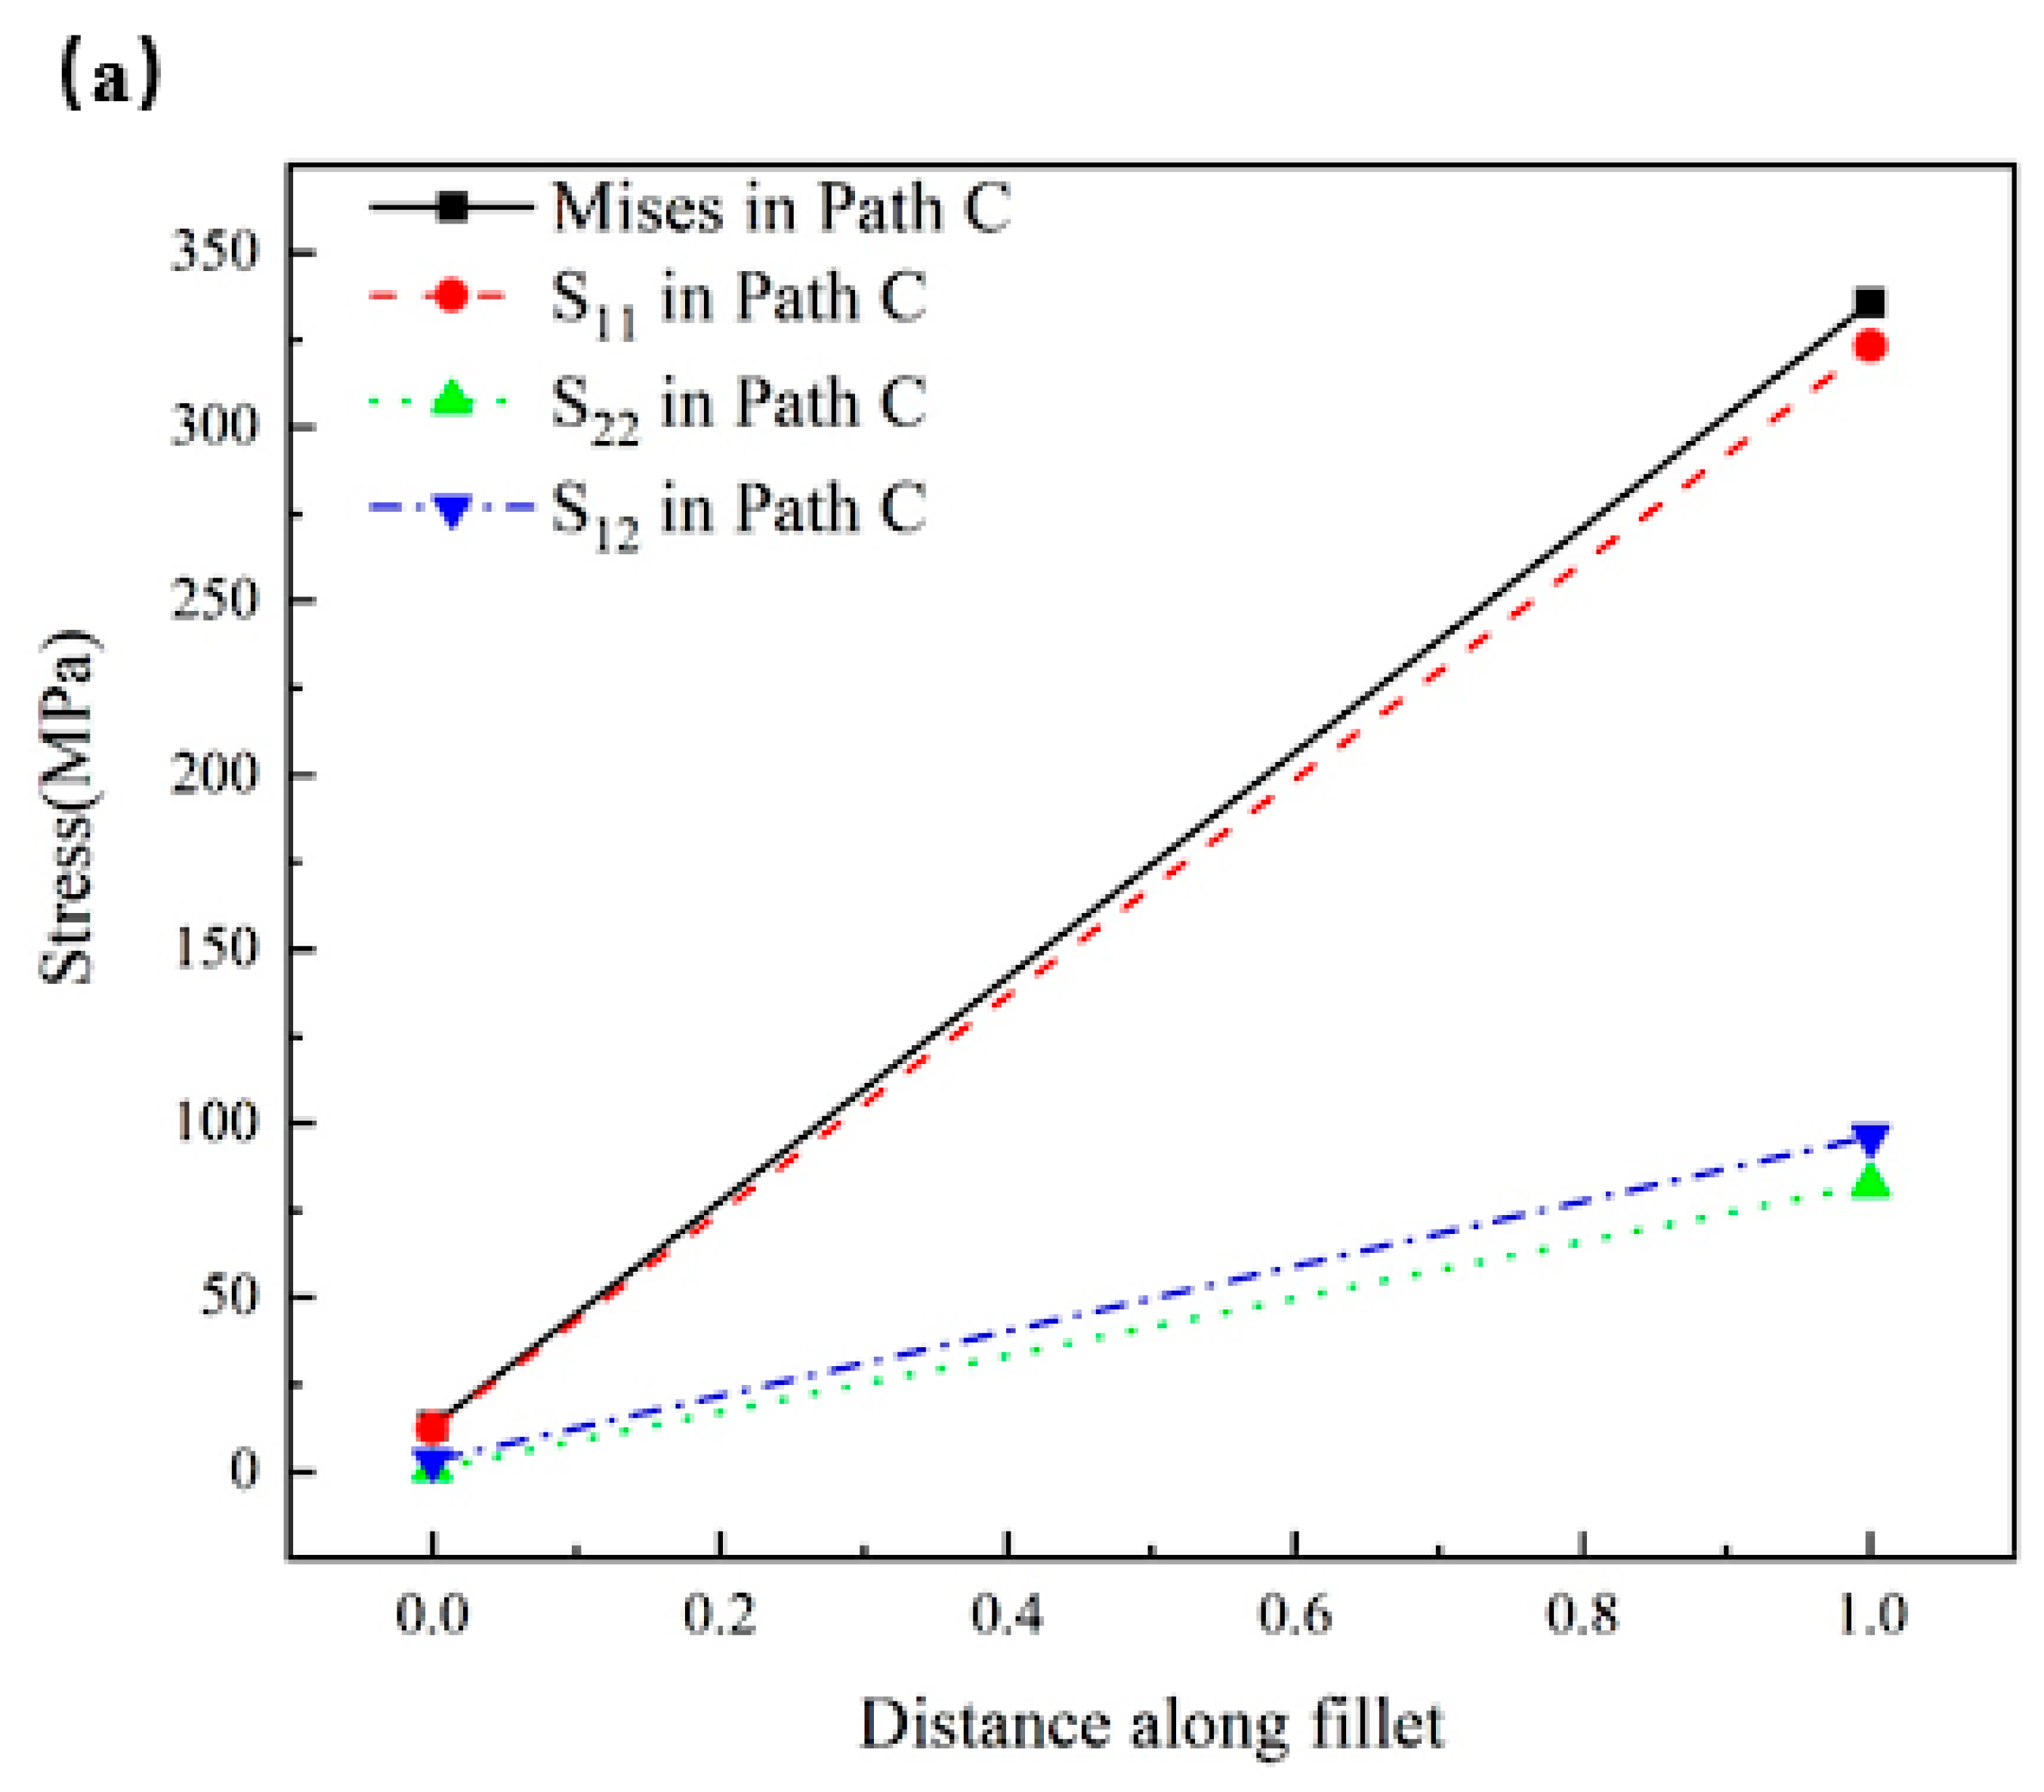
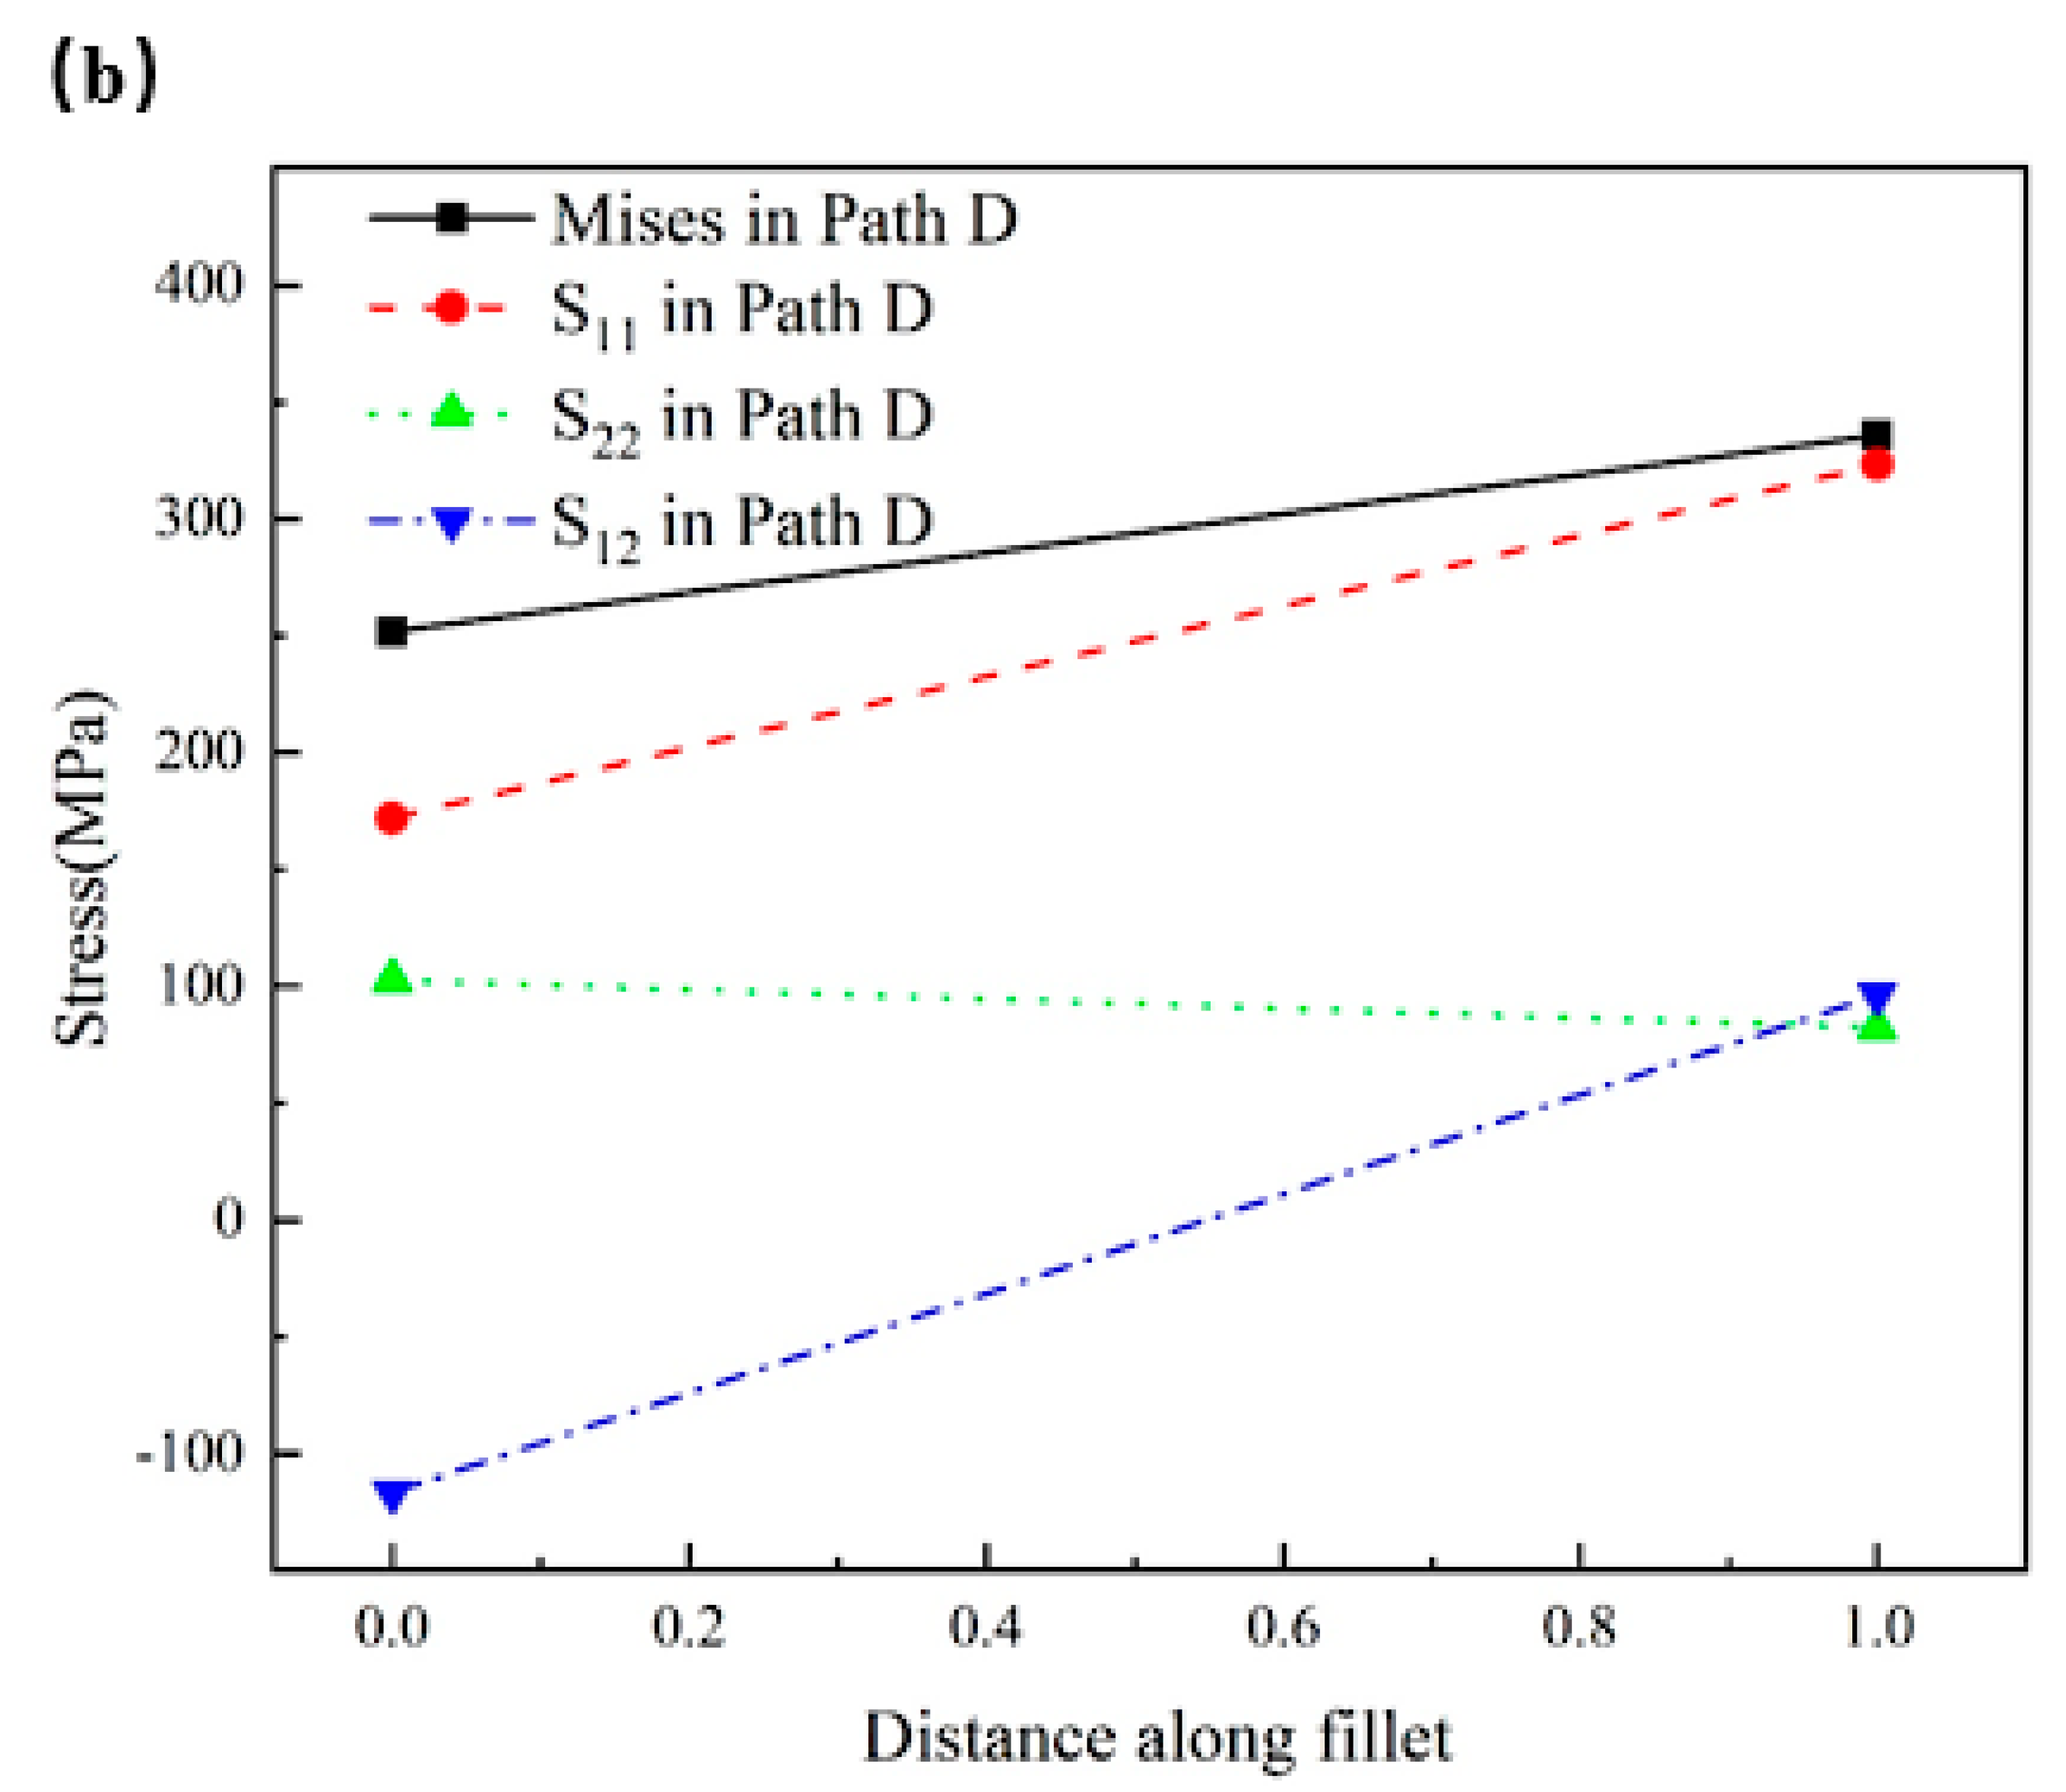
The distribution of stress in paths C and D is illustrated in Figure 28 for when the tensile load reaches its peak value. In path C, it is obvious that the normal stress S11 values are much higher than for S22 and S21 (see Figure 27a). This means that the fracture of the fillet in path C was caused by tensile stress S11, which is normal for the plane of the crack. In addition, this also implies that the fracture of the fillet in path C occurs through the opening fracture mechanism (mode I), which better aligns with the SEM fractography in Figure 18. It is notable from Figure 28b that, with respect to the stress distribution in path D, the S11 value is much higher than S22, especially at the end of the path that is near the brazing seam. Apart from path C, S11 in path D is acting parallel to the plane of the crack; therefore, it can be inferred that the fracture in path D of the THK fillet was caused by interfacial shear stress, which is also in agreement with the SEM fractography observed in Figure 19.

5. Conclusions

This paper studies the shear strength, microstructure, and element distribution of lap joints, which use AISI 304 steel as a substrate metal and pure cropper as the filler metal, with vacuum brazing as the technique. The effect of the thickness of the filler metal on the quality of the lap joints was investigated, and the properties that deal with the brazing joints were compared to a lap joint with a meniscus fillet, and a lap joint without a meniscus fillet. Then, the enhancement mechanism in the meniscus fillet on the brazing joints was explored using the ABAQUS finite element analysis. The following conclusions can be drawn:
(1)
A copper filler metal with a thickness of 60 µm exhibited good wettability to the base metal, resulting in good metallurgical bonding between the filler metal and base metal at the brazing seam. An increase in the thickness of the copper filler metal to 90 µm resulted in poor metallurgical bonding at the brazing seam and caused a lot of large islands, gaps, cavities, and cracks; however, it would generate a meniscus fillet at the end of the base plate.
(2)
The shear strength of the specimen THN is 180.5 MPa, while the shear strength of the specimen THK is 351 Mpa. Compared to the THN specimen, the strength of the THK specimen with poor bonding at the brazing seam was about 1.94 times higher than for specimen THN. Additionally, the main fracture in the brazing seam of specimen THN and specimen THK occurred via mode II, while the meniscus fillet of THK occurred through a mixed fracture mode (mode I and mode II).
(3)
The FEM results show that the meniscus fillet of specimen THK would postpone the failure in the brazing seam. Additionally, the simulation also displayed that the fillet could reduce the uniform stress distribution in the brazing seam, whereby the side of the meniscus fillet at the end of the base plate was mainly subjected to tensile stress, while the other side of the base plate (the face) was mainly subjected to shear stress.

Author Contributions

Conceptualization, N.L.; methodology, H.C.; software, H.C.; validation, H.C.; formal analysis, X.W.; investigation, H.C.; resources, N.L. and X.L.; data curation, H.C.; writing—original draft preparation, H.C.; writing—review and editing, H.C., N.L., X.W., S.L. and X.L.; visualization, H.C.; supervision, N.L., X.W., S.L. and X.L.; project administration, N.L.; funding acquisition, X.L. All authors have read and agreed to the published version of the manuscript.

Funding

The authors gratefully acknowledge the financial support of the National Key Research and Development Program of China (Grant No. 2018YFA0704604).

Data Availability Statement

The data that support the findings of this study are available from the corresponding author, [Li Nian], upon reasonable request.

Conflicts of Interest

The authors declare no competing interests.

References

  1. AlHazaa, A.; Haneklaus, N. Diffusion bonding and transient liquid phase (TLP) bonding of type 304 and 316 austenitic stainless steel—A review of similar and dissimilar material joints. Metals 2020, 10, 613. [Google Scholar] [CrossRef]
  2. Pra, F.; Tochon, P.; Mauget, C.; Fokkens, J.; Willemsen, S. Promising designs of compact heat exchangers for modular HTRs using the Brayton cycle. Nucl. Eng. Des. 2008, 238, 3160–3173. [Google Scholar] [CrossRef]
  3. Gu, X.L.; Yang, C.J.; Chen, Z.J.; Wu, C.D.; Feng, L.L. Effect of temperature on microstructure and mechanical properties of 316L stainless steel brazed joints. Adv. Mater. Res. 2012, 418–420, 1494–1497. [Google Scholar]
  4. Strauß, C.; Wegewitz, L.; Schöler, S.; Holländer, U.; Möhwald, K.; Maus-Friedrichs, W. Surface deoxidation mechanism during vacuum heat treatment of stainless steels AISI 304 and 446. Steel Res. Int. 2020, 91, 1900568. [Google Scholar] [CrossRef] [Green Version]
  5. Pritchard, D.; Soldering, B. Welding; Crowood Press: Marlborough, UK, 2001. [Google Scholar]
  6. Wang, Q.; Shi, J.; Zhang, L.; Xiong, J.; Li, J.; Ma, N.; Feng, J. Additive manufacturing of a high-strength ZrC-SiC and TC4 gradient structure based on a combination of laser deposition technique and brazing. J. Mater. 2021, 7, 766–779. [Google Scholar] [CrossRef]
  7. Guo, W.; Li, K.; Zhang, H.; Zhu, Y.; Shen, X.; Zhang, L.; Sun, H.; Zhong, S.; Long, W. Low residual stress C/C composite-titanium alloy joints brazed by foam interlayer. Ceram. Int. 2021, 48, 5260–5266. [Google Scholar] [CrossRef]
  8. Jiang, D.; Long, J.; Han, J.; Cai, M.; Lin, Y.; Fan, P.; Zhang, H.; Zhong, M. Comprehensive enhancement of the mechanical and thermo-mechanical properties of W/Cu joints via femtosecond laser fabricated micro/nano interface structures. Mater. Sci. Eng. A 2017, 696, 429–436. [Google Scholar] [CrossRef]
  9. Zhang, Y.; Zou, G.; Liu, L.; Wu, A.; Sun, Z.; Zhou, Y. Vacuum brazing of alumina to stainless steel using femtosecond laser patterned periodic surface structure. Mater. Sci. Eng. A 2016, 662, 178–184. [Google Scholar] [CrossRef]
  10. Gao, Z.; Feng, J.; Tao, X.; Ma, F.; Niu, J. Effect of different surface pretreatment method on vacuum brazing joint properties of AlSi50 alloy. Eng. Rev. Međunarodni Časopis Namijenjen Publ. Orig. Istraživanja S Aspekta Anal. Konstr. Mater. I Novih Tehnol. U Području Stroj. Brodogr. Temelj. Teh. Znan. Elektrotehnike Računarstva I Građevinarstva 2020, 40, 90–95. [Google Scholar] [CrossRef]
  11. Venkateswaran, T.; Xavier, V.; Sivakumar, D.; Pant, B.; Janaki Ram, G.D. Brazing of stainless steels using Cu-Ag-Mn-Zn braze filler: Studies on wettability, mechanical properties, and microstructural aspects. Mater. Des. 2017, 121, 213–228. [Google Scholar]
  12. Liu, D.; Song, Y.; Shi, B.; Zhang, Q.; Song, X.; Niu, H.; Feng, J. Vacuum brazing of GH99 superalloy using graphene reinforced BNi-2 composite filler. J. Mater. Sci. Technol. 2018, 34, 1843–1850. [Google Scholar] [CrossRef]
  13. Jing, Y.; Ren, X.; Shang, Y.; Xiong, H.; Jiang, J. Develop a novel high-strength vacuum brazing technique for γ-TiAl intermetallic. Int. J. Lightweight Mater. Manuf. 2021, 4, 237–245. [Google Scholar] [CrossRef]
  14. Zhang, H.; Zhu, W.; Zhang, T.; Guo, C.; Ran, X. Effect of Brazing Temperature on Microstructure and Mechanical Property of High Nitrogen Austenitic Stainless Steel Joints Brazed with Ni–Cr–P Filler. ISIJ Int. 2019, 59, 300–304. [Google Scholar] [CrossRef] [Green Version]
  15. Tillmann, W.; Henning, T.; Boretius, M. Boretius. Effect of the dwell time on the microstructure and tensile strength of vacuum-brazed tool steels using BNi-2 filler metal. Weld. World 2019, 63, 1477–1488. [Google Scholar] [CrossRef]
  16. Sharma, G.; Dwivedi, D.K. Diffusion bonding of 304 austenitic stainless-steel using pressure pulses. Mater. Today: Proc. 2021, 44, 2135–2141. [Google Scholar] [CrossRef]
  17. Li, Y.; Tang, X.; Lu, F.; Xu, L.; Cui, H.; Shao, C. Dual beam laser fusion-brazed Ti6Al4V/AA7075 dissimilar lap joint: Crack inhibition via inoculation with TiC nanoparticles. Mater. Charact. 2022, 191, 112127. [Google Scholar] [CrossRef]
  18. Vidyuk, T.M.; Dudina, D.V. Electric current-assisted joining of similar/dissimilar materials. Join. Process. Dissimilar Adv. Mater. 2022, 7, 151–176. [Google Scholar]
  19. AlHazaa, A.; Haneklaus, N.; Almutairi, Z. Impulse pressure-assisted diffusion bonding (IPADB): Review and outlook. Metals 2021, 11, 323. [Google Scholar] [CrossRef]
  20. Li, H.; Li, B.-J.; Xing, Z.-C.; Hodúlová, E.; Wang, Y.-P.; Lehmert, B.; Li, Z.-X.; Tillmann, W. Pulse-pressure diffusion bonding of Ti-6Al-4 V alloy with nanostructured Cu-W multilayer film as interlayer. Weld. World 2023, 67, 1337–1345. [Google Scholar] [CrossRef]
  21. Akhtar, T.S.; Cooke, K.O.; Khan, T.I.; Shar, M.A. Nanoparticle enhanced eutectic reaction during diffusion brazing of aluminium to magnesium. Nanomaterials 2019, 9, 370. [Google Scholar] [CrossRef] [Green Version]
  22. Saltık, S.; Esen, Z.; Dericioglu, A.F. A Comparative Study of Effects of Additive Particle Size and Content on Wetting Behavior and Brazing Performance of C/SiC Composite. J. Mater. Eng. Perform. 2022, 32, 5946–5955. [Google Scholar] [CrossRef]
  23. Nakao, H.; Nishimoto, A. Pulsed-Electric-Current Bonding of Oxygen-Free Copper and Austenitic Stainless Steel. Mater. Trans. 2021, 62, 448–452. [Google Scholar] [CrossRef]
  24. Lin, J.; Zhou, J.; Zhang, S.; Lu, F.; Zhao, J.; Pan, Y.; Huang, Y.; Lin, P.; He, P.; Lin, T.; et al. Rapidly achieving a reliable full-ceramic interface of ZrC-SiC composite using Ti interlayer via pulsed electric current joining. J. Eur. Ceram. Soc. 2023, 43, 1777–1789. [Google Scholar] [CrossRef]
  25. Eustathopoulos, N.; Hodaj, F.; Kozlova, O. The wetting process in brazing. In Advances in Brazing; Woodhead Publishing: Cambridge, UK, 2013; pp. 3–30. [Google Scholar]
  26. Jiang, W.; Gong, J.; Tu, S. A study of the effect of filler metal thickness on tensile strength for a stainless steel plate-fin structure by experiment and finite element method. Mater. Des. 2010, 31, 2387–2396. [Google Scholar] [CrossRef]
  27. Luo, Y.; Li, Z.; Liu, Y.; Song, X.; Hu, S.; Fu, W.; Cao, J. Vacuum brazing effect on the interlayer failure behavior of TiAl/GH3536 hetero-thin-walled structure with BNi-2 interlayer. Thin-Walled Struct. 2023, 184, 110492. [Google Scholar] [CrossRef]
  28. Nassiraei, H.; Rezadoost, P. Stress concentration factors in tubular T-joints reinforced with external ring under in-plane bending moment. Ocean Eng. 2022, 266, 112551. [Google Scholar] [CrossRef]
  29. Tsutsumi, S.; Fincato, R.; Luo, P.; Sano, M.; Umeda, T.; Kinoshita, T.; Tagawa, T. Effects of weld geometry and HAZ property on low-cycle fatigue behavior of welded joint. Int. J. Fatigue 2022, 156, 106683. [Google Scholar] [CrossRef]
  30. Baek, J.-H.; Jang, Y.-C.; Kim, I.-J.; Yoo, J.-S.; Kim, C.-M.; Kim, Y.-P. Influence of weld joint geometry and strength mismatch on load bearing capacity of API pipeline. Int. J. Press. Vessel. Pip. 2022, 199, 104737. [Google Scholar] [CrossRef]
  31. Ragavendran, M.; Vasudevan, M.; Hussain, N. Study of the Microstructure, Mechanical Properties, Residual Stresses, and Distortion in Type 316LN Stainless Steel Medium Thickness Plate Weld Joints. J. Mater. Eng. Perform. 2022, 31, 5013–5025. [Google Scholar] [CrossRef]
  32. Han, W.P.; Wan, M.; Zhao, R.; Kang, H. Vacuum brazing of the ultrathin-walled structure using particulate-reinforced composite filler metal: Microstructural evolution and mechanical properties. J. Alloys Compd. 2019, 805, 638–647. [Google Scholar] [CrossRef]
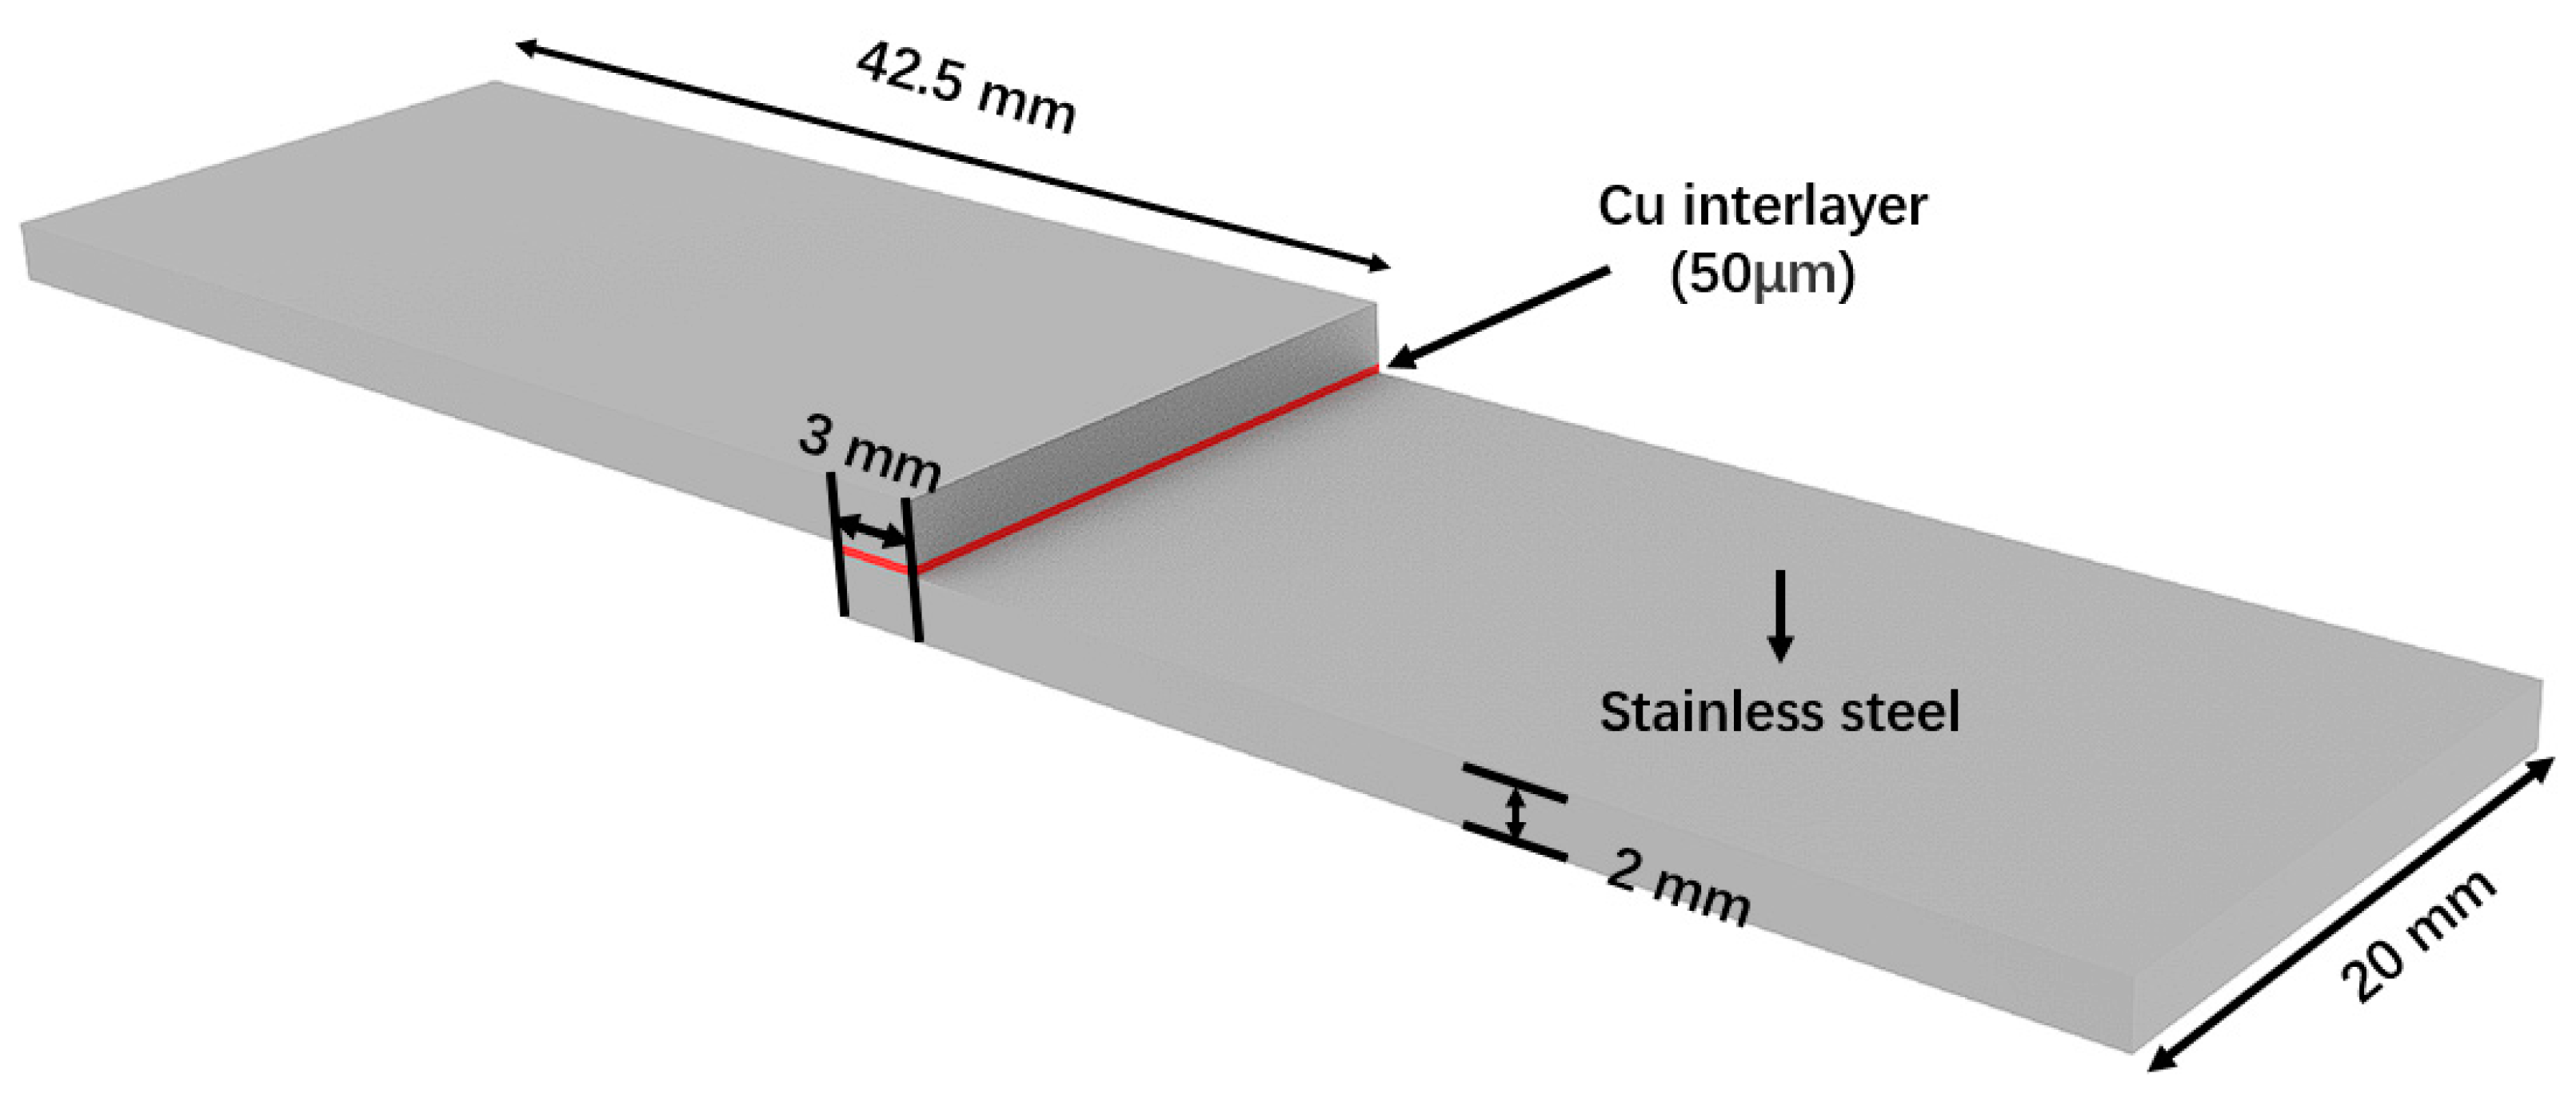
Figure 1. Schematic diagram of shear specimens.
Metals 13 01369 g001
Figure 2. (a) Vacuum brazing furnace and (b) brazing process curve.
Metals 13 01369 g002
Figure 3. Optical system setup.
Metals 13 01369 g003
Figure 4. Visual inspection of brazed joints: (a) front view, (b) front enlarged view, and (c) side enlarged view.
Metals 13 01369 g004
Figure 5. Metallographic structures of the brazing seam: (a) specimen THN and (b) specimen THK.
Metals 13 01369 g005
Figure 6. Metallographic structures of brazing fillet: (a) overall view and (b) part view.
Metals 13 01369 g006
Figure 7. EDS line scan in specimen THN: (a) scan path, (b) all elements, (c) Cu element, (d) Fe element, (e) Cr element, (f) C element, (g) Ni element, and (h) Mn element.
Metals 13 01369 g007
Figure 8. EDS measurement position of the micro-zone in the brazing seam of specimen THN.
Metals 13 01369 g008
Figure 9. EDS map analysis of the brazing seam of specimen THN: (a) Fe element, (b) Cu element, (c) Cr element, (d) Mn element, (e) Ni element, and (f) C element.
Metals 13 01369 g009
Figure 10. EDS measurement position of the micro-zone in the brazing seam of specimen THK.
Metals 13 01369 g010
Figure 11. EDS map analysis of the large island of specimen 2: (a) Fe element, (b) Cu element, (c) Cr element, (d) Mn element, (e) Ni element, and (f) C element.
Metals 13 01369 g011
Figure 12. EDS measurement position of the micro-zone in meniscus fillet of specimen THK.
Metals 13 01369 g012
Figure 13. Load displacement curve and strain field of replicates.
Metals 13 01369 g013
Figure 14. Metallographic structures of specimen THK: (a) fillet of untested specimen THK, (b) fillet of specimen THK at a load of 20 kN, (c) enlarged view of micro crack, and (d) brazing seam of specimen THK at a load of 20 kN.
Metals 13 01369 g014
Figure 15. Diagram of the SEM fracture surface.
Metals 13 01369 g015
Figure 16. The SEM fractography of the THN brazing seam after a tensile test and the EDS map analysis of the fracture surface: (a) Fractures surface A of THN seam, (b) Cu element and (c) Fe element.
Metals 13 01369 g016
Figure 17. The SEM fractography of THK brazing seam after tensile test and the EDS map analysis of the fracture surface: (a) Fractures surface A of THK seam, (b) Cu element and (c) Fe element.
Metals 13 01369 g017
Figure 18. The SEM fractography of THK meniscus fillet fracture surface B after tensile test.
Metals 13 01369 g018
Figure 19. The SEM fractography of THK meniscus fillet fracture surface C after tensile test.
Metals 13 01369 g019
Figure 20. Two-dimension FE geometry, boundary conditions, and mesh of the brazed joint: (a) THN specimen and (b) THK specimen.
Metals 13 01369 g020
Figure 21. Predicted strength vs. strain and comparison with the experimental results (the green area presents the range of experimental strengths.): (a) THN specimen and (b) THK specimen.
Metals 13 01369 g021
Figure 22. Predicted failure path for the specimen THN: (a) whole view of the complete filler metal failure, (b) enlarged view of the initiation of the failure, (c) enlarged view for the extension of the failure, (d) enlarged view for the further extension of the failure, and (e) enlarged view for the complete failure.
Metals 13 01369 g022
Figure 23. Predicted failure path for specimen THK: (a) whole view of the complete filler metal failure, (b) enlarged view of the initiation of the failure, (c) enlarged view of the extension of the failure, (d) enlarged view of the further extension of the failure, and (e) enlarged view of the complete failure.
Metals 13 01369 g023
Figure 24. Path diagram: (a) path A in the brazing seam of THN and (b) path B in the brazing seam of THK.
Metals 13 01369 g024
Figure 25. Stress distributions in path A and path B, when THN and THK are at peak strength (Von−Mises stress, S11, S22, and S12).
Metals 13 01369 g025
Figure 26. Diagrams of paths A and B with the tensile load drop: (a) THN and (b) THK.
Metals 13 01369 g026aMetals 13 01369 g026b
Figure 27. Path diagram: (a) path C for the fillet in THN and (b) path D for the fillet in THN.
Metals 13 01369 g027
Figure 28. Stress distribution in path C and path D when THK is at peak strength: (a) path C and (b) path D (Von−Mises stress, S11, S22, and S12).
Metals 13 01369 g028aMetals 13 01369 g028b
Table 1. Chemical composition of the parent material and filler material (wt.%).
MaterialsCSiMnSPCrNiFeCu + Ag
304≤0.03≤1.00≤2.00≤0.03≤0.0517.0–19.08.00–11.0Balance-
Cu-0.0004-0.00090.0007-0.0050.00599.9
Table 2. EDS results of the micro-zone in the brazing seam of specimen THN (wt.%).
LocationCCrFeCuMnSNiSi
A6.164.4911.1678.19----
B6.750.672.488.531.050.6--
C7.251.073.0985.741.64---
D8.7-1.7588.930.62---
E9.02-1.0989.220.67---
F7.080.191.1790.150.61-0.8-
G3.7718.2768.38-1.95-7.161.95
Table 3. EDS results of the micro-zone in the brazing seam of specimen THK (wt.%).
LocationCCrFeCuMnSNiSi
A6.0816.669.357.640.470.4--
B3.618.7968.4301.25-7.520.41
C6.060.291.3491.370.11-0.82-
D8.180.261.9288.79--0.68-
E5.8515.9563.2711.30.5-2.680.36
F3.5816.4570.356.87--2.370.37
Table 4. EDS results of the micro-zone in meniscus fillet of specimen THK (wt.%).
LocationCCrFeCuMnSNi
A5.71 1.8291.570.27 0.64
B14.4125.596.295.0923.6824.90.04
C8.8734.7245.95.931.971.778.87
D12.030.21.1485.770.11 0.75
Table 5. Material properties of AISI 304 and Cu.
MaterialElastic Modulus (GPa)Yield Stress (MPa)Poisson’s Ratio
AISI304198.52650.294
Cu125690.35
Disclaimer/Publisher’s Note: The statements, opinions and data contained in all publications are solely those of the individual author(s) and contributor(s) and not of MDPI and/or the editor(s). MDPI and/or the editor(s) disclaim responsibility for any injury to people or property resulting from any ideas, methods, instructions or products referred to in the content.