Article

Multi-Objective Optimization of Micro-Milling Titanium Alloy Ti-3Al-2.5V (Grade 9) Using Taguchi-Grey Relation Integrated Approach

by
Muhammad Ayyaz Khan
1,
Syed Husain Imran Jaffery
1,*,
Muhammad Ali Khan
1,2,
Muhammad Iftikhar Faraz
3,* and
Sachhal Mufti
1
1
School of Mechanical and Manufacturing Engineering (SMME), National University of Sciences and Technology (NUST), Islamabad 44000, Pakistan
2
Department of Mechanical Engineering, College of Electrical and Mechanical Engineering (CEME), National University of Sciences and Technology (NUST), Islamabad 44000, Pakistan
3
Department of Mechanical Engineering, College of Engineering, King Faisal University, Al-Ahsa 31982, Saudi Arabia
*
Authors to whom correspondence should be addressed.
Metals 2023, 13(8), 1373; https://doi.org/10.3390/met13081373
Submission received: 16 June 2023 / Revised: 8 July 2023 / Accepted: 11 July 2023 / Published: 31 July 2023
(This article belongs to the Special Issue Tool Wear and Surface Roughness in Machining of Metallic Materials)

Abstract

:
This study aims to optimize the cutting parameters for the micro-milling of titanium grade 9 (Ti-3Al-2.5V). The research employs Grey Relational Analysis (GRA) and Response Surface Methodology (RSM) techniques to find the optimal combination of cutting parameters to simultaneously minimize surface roughness, burr width, burr length, and tool wear, which are selected process outcomes. The findings from Grey Relational Analysis (GRA) identify experiment number 6, with cutting conditions of f (µm/tooth) = 0.45, Vc (m/min) = 25, and ap (µm) = 60, as the most productive experiment. Analysis of variance (ANOVA) is conducted to assess the significance and influence of the process cutting parameters on different process outcomes. ANOVA reveals that the feed rate and cutting speed are the most influential input parameters, with a contribution ratio (CR) of 24.08% and 14.62%, respectively. Furthermore, ANOVA indicates that the interaction among the process parameters also significantly influences the process outcomes alongside the individual cutting parameters. The optimized combination of cutting parameters obtained through the RSM technique produces superior results in terms of reducing the process outcomes. Compared to the best run identified by Grey Relational Analysis, there is a remarkable 36.25% reduction in burr width and an 18.41% reduction in burr length, almost half of the reduction achieved in burr width. Additionally, there is a 16.11% and 14.60% reduction in surface roughness and tool wear, respectively.

1. Introduction

In the manufacturing industry, optimizing machining parameters is crucial for financial reasons. To remain competitive in the market, machining operations must be economically efficient. It has long been recognized that the economics of machining operations, including productivity and the total manufacturing cost per component can be improved by selecting appropriate cutting parameter conditions such as depth of cut, feed per tooth, and cutting speed. The modern aerospace, defense, and medical industries heavily rely on advanced engineering materials, and titanium and its alloys stand out as cutting-edge materials with superior behavior and mechanical characteristics. Their demand spans across various industries.
In many cases, the parameters selected for machining operations are conservative and fall short of the optimal conditions. Experimenting with different process parameters to discover the best combination is not only costly but also time-consuming and tedious. These factors have driven researchers to employ numerical and heuristic-based optimization techniques in order to optimize machining process parameters. Numerous researchers [1,2,3,4] have presented a wide range of optimization techniques and strategies to maximize both productivity and quality in modern manufacturing industries. Optimization modules such as Genetic Algorithms, Evolutionary Algorithms, gray relational analysis, multiple regression analysis and Fuzzy Systems can effectively and reliably exploit manufacturing data to provide the best possible sets of solutions for machining processes. In earlier works, the optimization of a single objective function was the focus. However, several multi-objective optimization techniques for enhancing machining parameters have been put forth in recent years.
The manufacturing sector’s main challenge today is to meet economic objectives by increasing production rates, improving product quality, and reducing production costs while at the same time minimizing its environmental impact through energy conservation, effective material utilization, and waste reduction. The production economics of metal-cutting processes are directly impacted by the choice of effective machining parameters, such as machining speed, feed rate, and depth of cut. Utilizing the capabilities of the machine tools to the fullest extent is essential to achieving these goals and ensuring the best performance. Input variables such as toolpath and parameters, workpiece material and cutting fluid, as with any manufacturing process, have an effect on tool wear, surface quality, cutting force and other process outputs. When considering the microstructure of the tool and workpiece, the influence and multifactor effect of process inputs are even more significant at the microscale and are a major cause for concern for the performance of the micro-milling process [5]. The objective of all significant research in micro-milling is to enhance productivity and efficiency, thereby broadening the potential applications of the process. A quantitative approach to analyze efficiency during experimentation is essential to assess the advancement of micro-milling [6,7]. Despite the rapidly evolving global industrial information landscape, the manufacturing sector still faces challenges such as a scarcity of data in the machining process and a low energy utilization rate, among others. The optimization results, manifested as reduced energy consumption, decreased processing time, and improved surface roughness, provide a clear advantage to the milling process [8]. Any machining process’s performance is significantly influenced by its process parameters. The success of the machining process depends on choosing the best set of these process parameters. A thorough understanding of the process, empirical equations to create realistic constraints, machine tool capability specifications, the creation of useful optimization criteria, and familiarity with mathematical and numerical optimization techniques are all necessary for determining the best optimal combination of process input parameters for any machining process.
In the research study conducted by Suresh et al. [9], a TiN-coated tungsten carbide cutting tool was utilized to turn mild steel and the Response Surface Methodology (RSM) was employed to create a prediction model for surface roughness. The results obtained through RSM were then compared to those obtained using the Genetic Algorithm (GA). In a separate study, Prajina et al. [10] applied the RSM in CNC end milling operations with the aim of maximizing material removal rate, minimizing surface roughness, and reducing cutting forces. A central composite design was used to develop quadratic equations for cutting forces, surface roughness, and machining time, considering various cutting parameters such as spindle speed, feed rate, depth of cut, and immersion angle. Routara et al. [11] examined the impact of machining parameters on the surface quality generated through CNC end milling by conducting experiments with three different workpiece materials. The results showed that the response surface models for roughness parameters were specific to the material used. In another research, Ratnam et al. [12] utilized TiCN-Al3O2-TiN coated tools and the RSM approach to optimize the cutting parameters in the dry boring process of Inconel 718. The optimal combination of cutting force, surface roughness, and vibration was determined using a desirability function. In yet another research study, Sriramoju et al. [13] employed the GRA for a research study to optimize the welding process of Monel 400 and 304. Moreover, the literature highlights a few notable studies concerning the machining of aerospace alloys [14,15,16,17,18,19,20,21]. Peng et al. [22] evaluated the machining quality of Ni-based superalloys, specifically Inconel 718. The authors investigate the surface integrity and its impact on functional performance, particularly wear resistance, using high-speed ultrasonic vibration cutting (HUVC) compared to conventional cutting (CC) processes. The wear rate of the machined surface processed by HUVC is reduced by up to 24.01%, indicating the potential of HUVC for enhancing wear resistance. Another study explores high-speed ultrasonic vibration cutting (HUVC) and finds that it achieves a thicker plastic deformation layer, lower surface roughness, higher micro-hardness, and compressive residual stress compared to conventional cutting (CC). HUVC also reduces friction coefficient and worn volume loss, ultimately improving wear resistance, with hardness being the most influential factor [23]; Zhang et al. [24] compared the effects of dry hard turning (DHT) and grinding on the surface integrity and fatigue performance of 18CrNiMo7-6 steel. DHT, using a polycrystalline cubic boron nitride tool, achieves larger surface compressive residual stress and lower surface roughness compared to grinding with a corundum wheel. Additionally, Carburizing heat treatment’s impact on the microstructure and hardening mechanism of 18CrNiMo7-6 steel was studied by Wang et al. [25]. Carburizing resulted in a heterogeneous microstructure, with 56.2% residual austenite on the surface and 0.1% in the core. Parameters like misorientation, grain size, low-angle grain boundaries, and dislocation density increased with depth. Grain refinement occurred, with a minimum size of 3.19 μm.

2. Research Motivation

The research motivation for this research study stemmed from the need to analyze the impact of machining parameters on vital output responses. The aim is to determine the key machining inputs that significantly affect the overall productivity of the system represented as manufacturing output. Furthermore, the motivation was reinforced by the fact that milling is a widely used machining process extensively employed in various industries. In order to enhance sustainability and productivity, Grey Relational Analysis is utilized to collectively optimize the manufacturing output. Moreover, the milling of materials with high strength, corrosive resistance, and wear resistance (such as titanium, Inconel, and other super alloys) pose significant challenges. However, these issues can be addressed by utilizing optimized cutting parameters. Therefore, multi-response optimization plays a critical role in industrial manufacturing processes. As a result, the recent focus of research in micro-level machining has been on the multi-objective optimization of process parameters.

3. Methodology

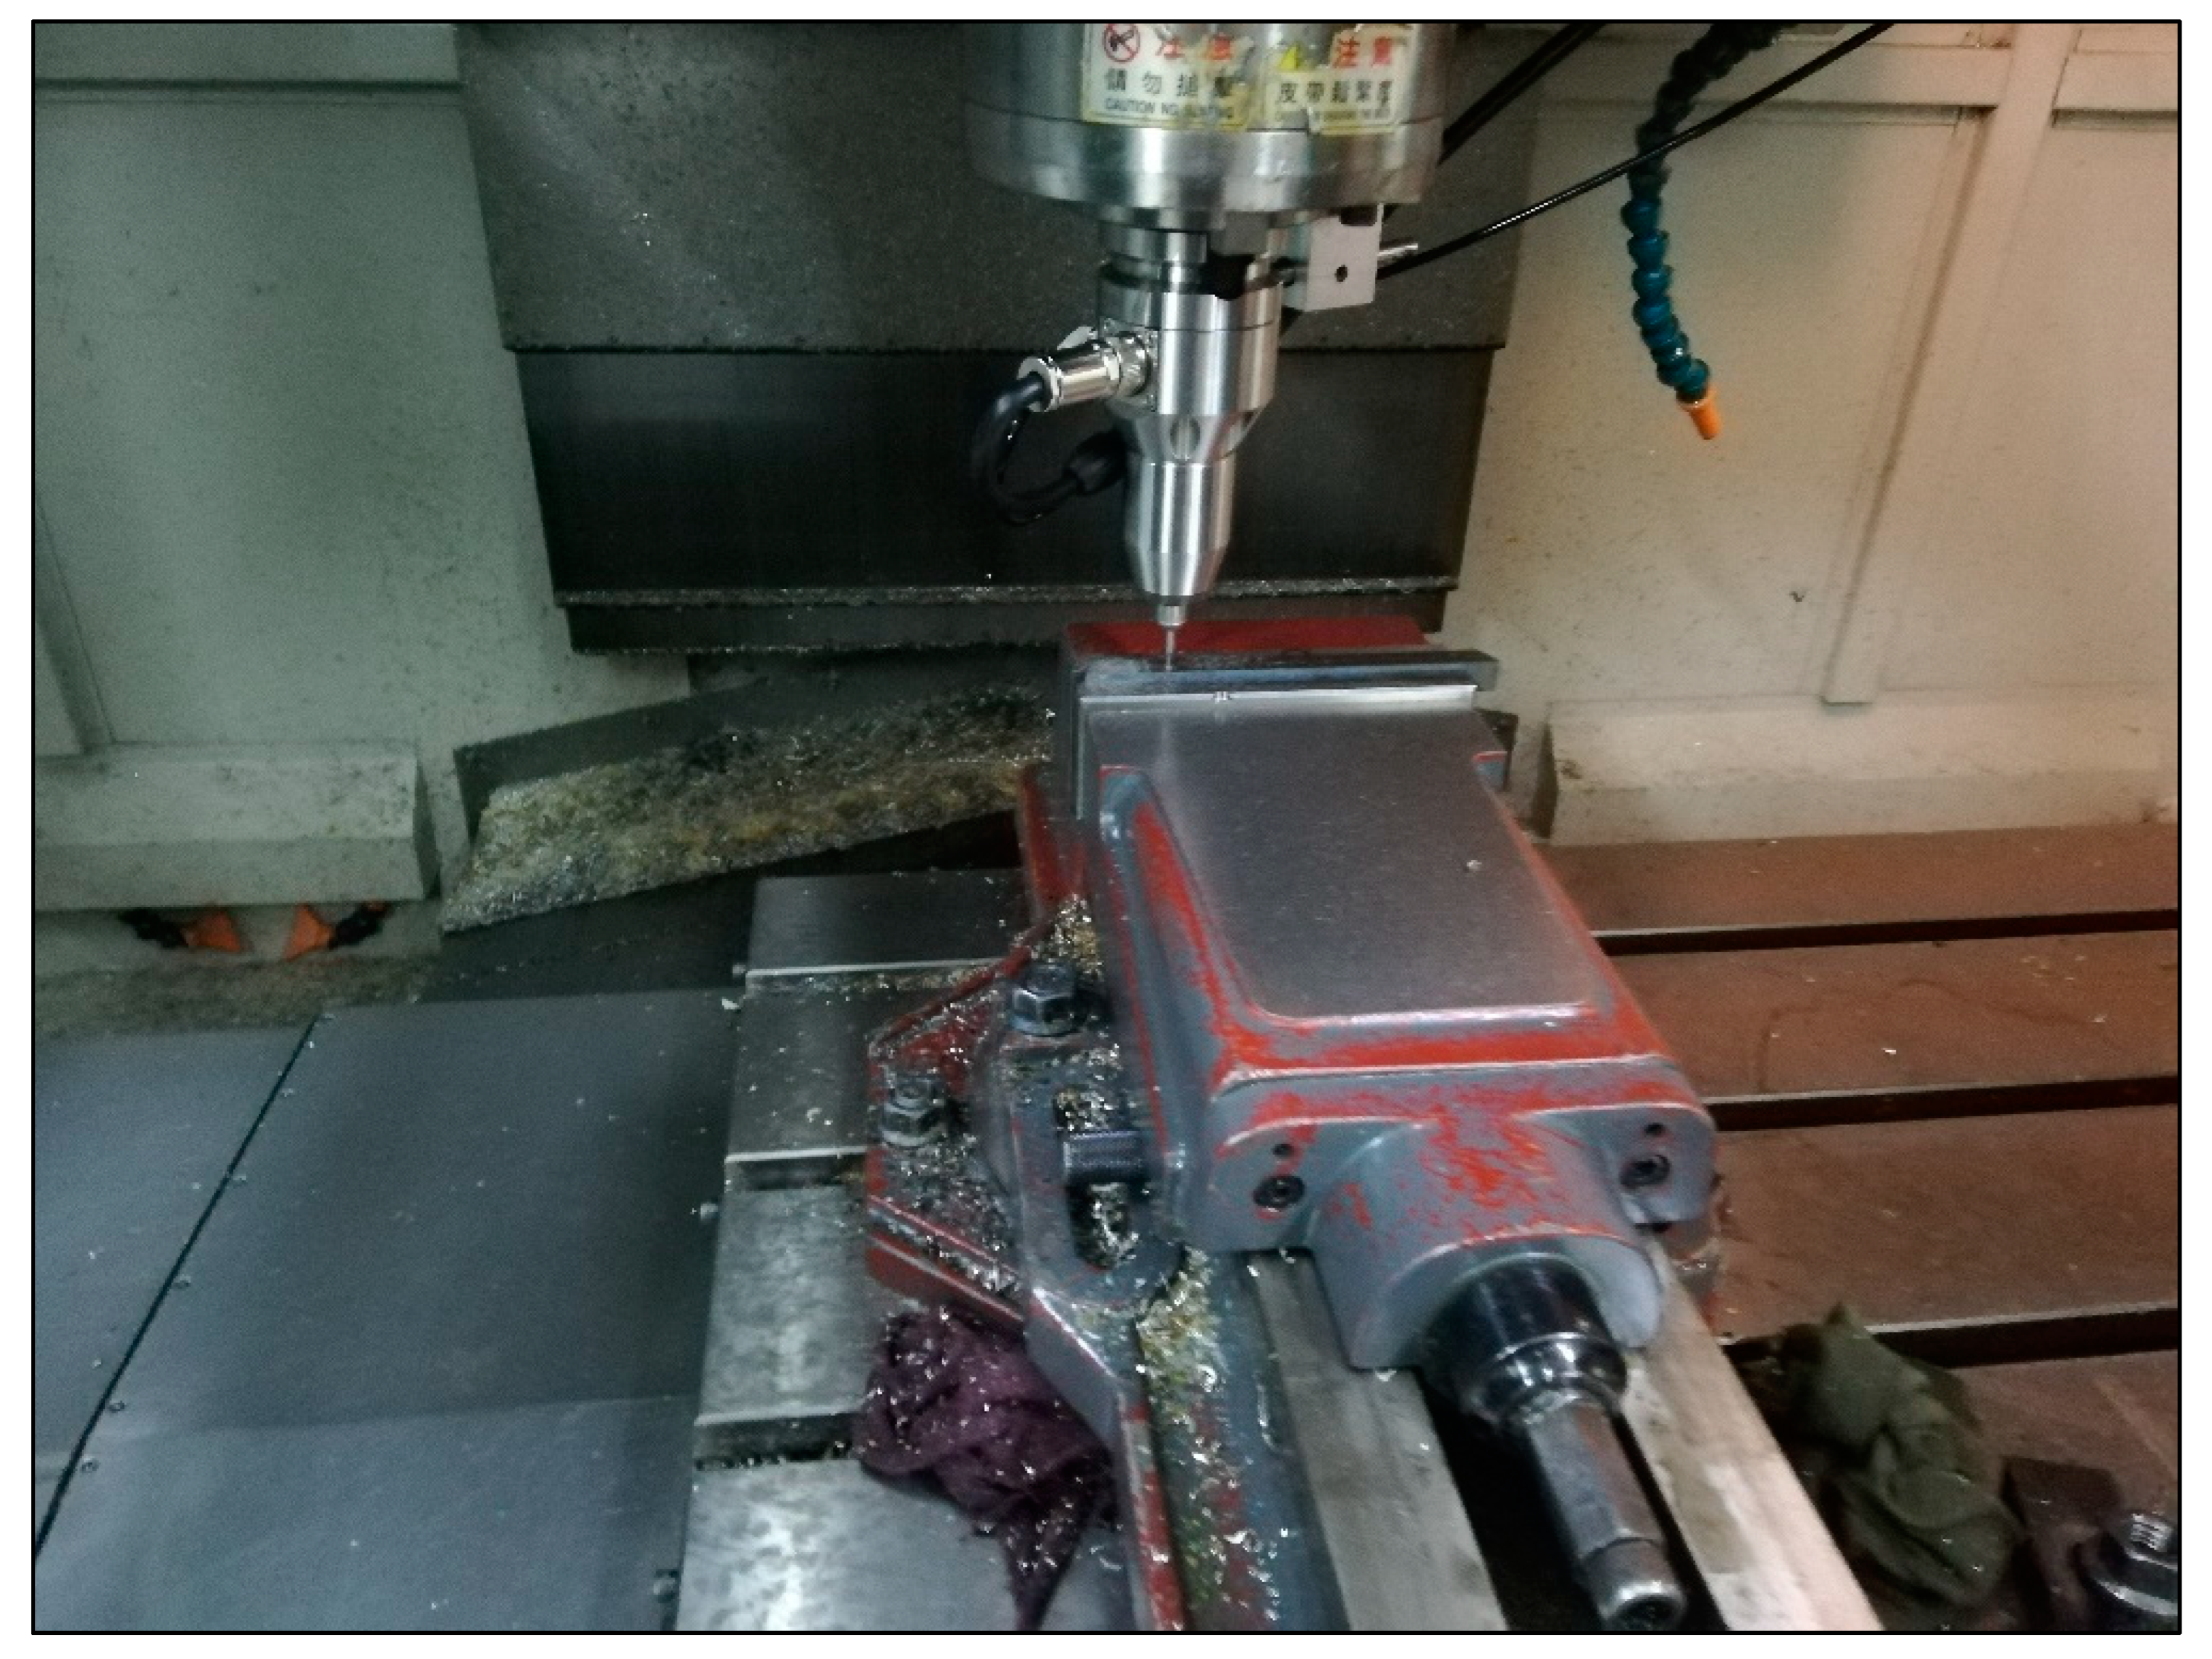
3.1. Experimental Setup and Material

Micro-milling tests were carried out on a computer numeric control milling center (CNC MV-1060). A maximum of 8000 rpm could be achieved on this machine; however, with the use of an extension ultra-precision high-speed spindle (HES810-BT40) it can be enhanced to 80,000 rpm. This spindle has an accuracy of 0.1 µm. Figure 1 shows the experimental setup employed for this research. A tungsten carbide end mill (2F-Ø0.5 × Ø4 × 50–60°) containing two flutes was used in this experimental study. The cutting edge of the tool was measured and found to be 4 µm, whereas the tool diameter was 500 µm. Tungsten carbide end mill cutting tools are commonly used in the industry for CNC milling of tough materials. Tungsten carbide has a high hardness and wear resistance. Because of its high hardness, materials with a high strength-to-weight ratio can be machined [26].
A titanium alloy grade 9 (Ti-4Al-2.5V) workpiece was selected for the experimentation. A 12 mm thick rectangular piece was wire-cut from a disc. The workpiece had measurements of 168 × 12 × 12 (L × W × H).

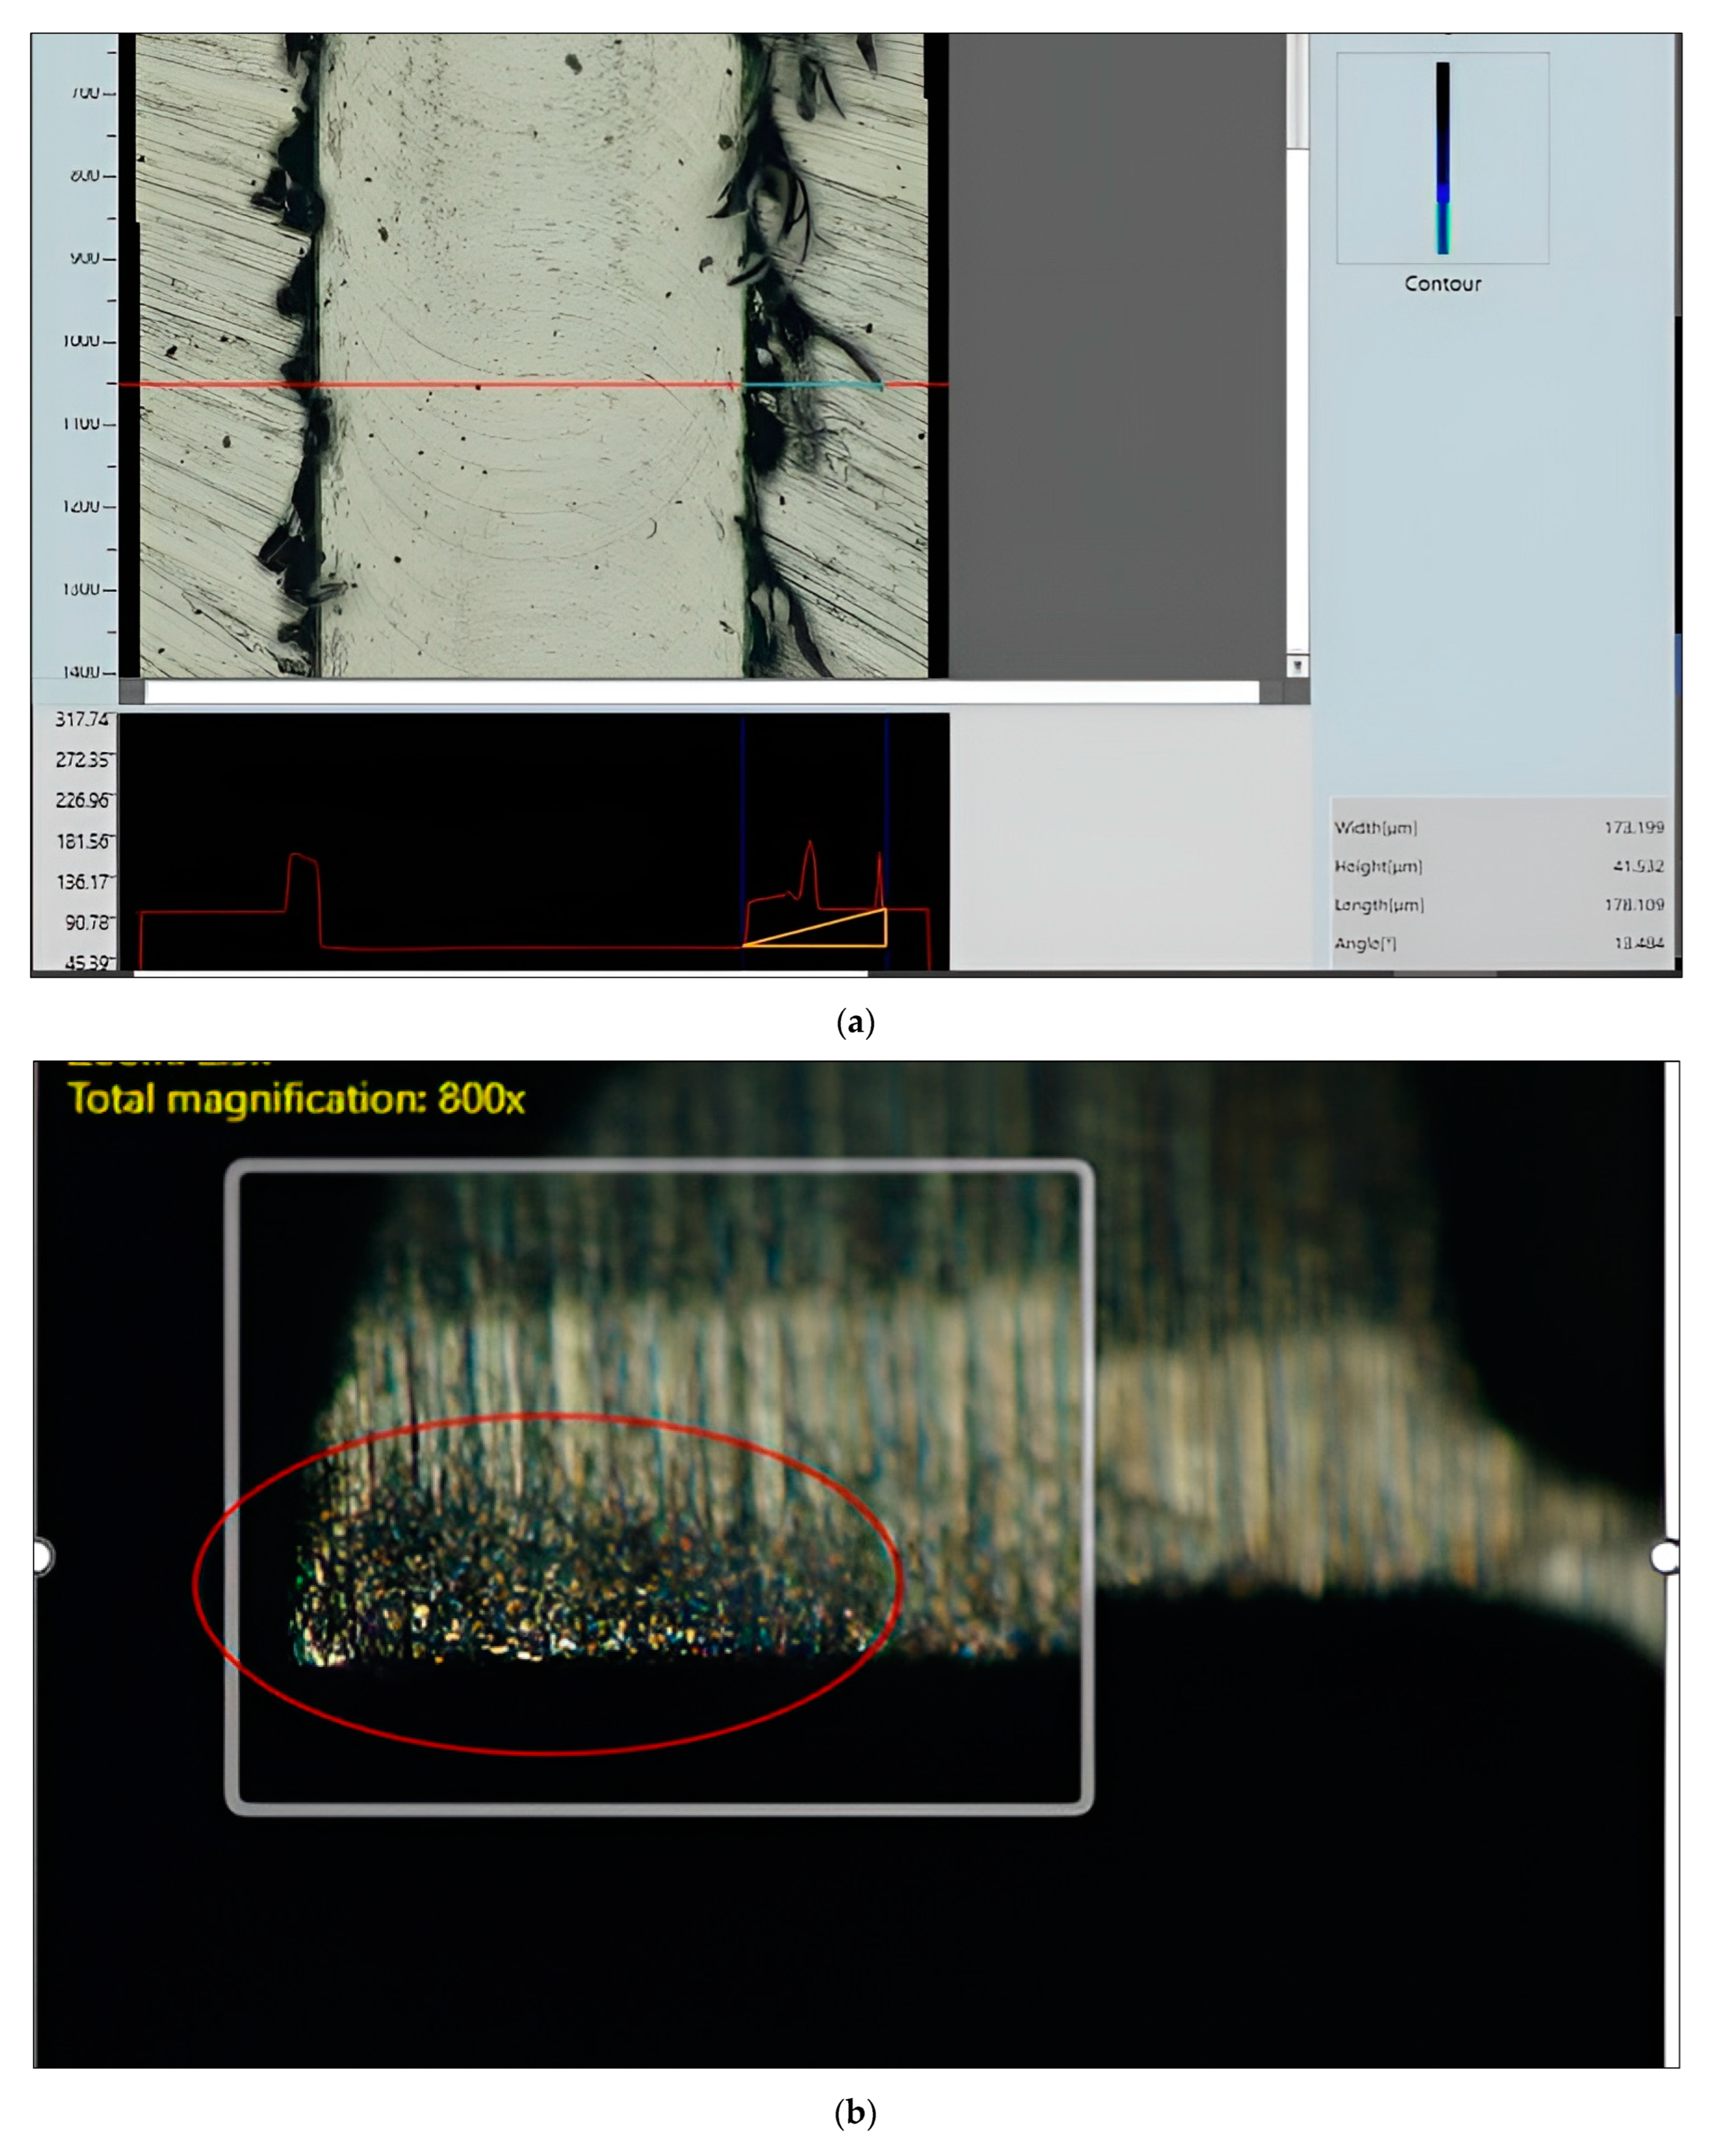
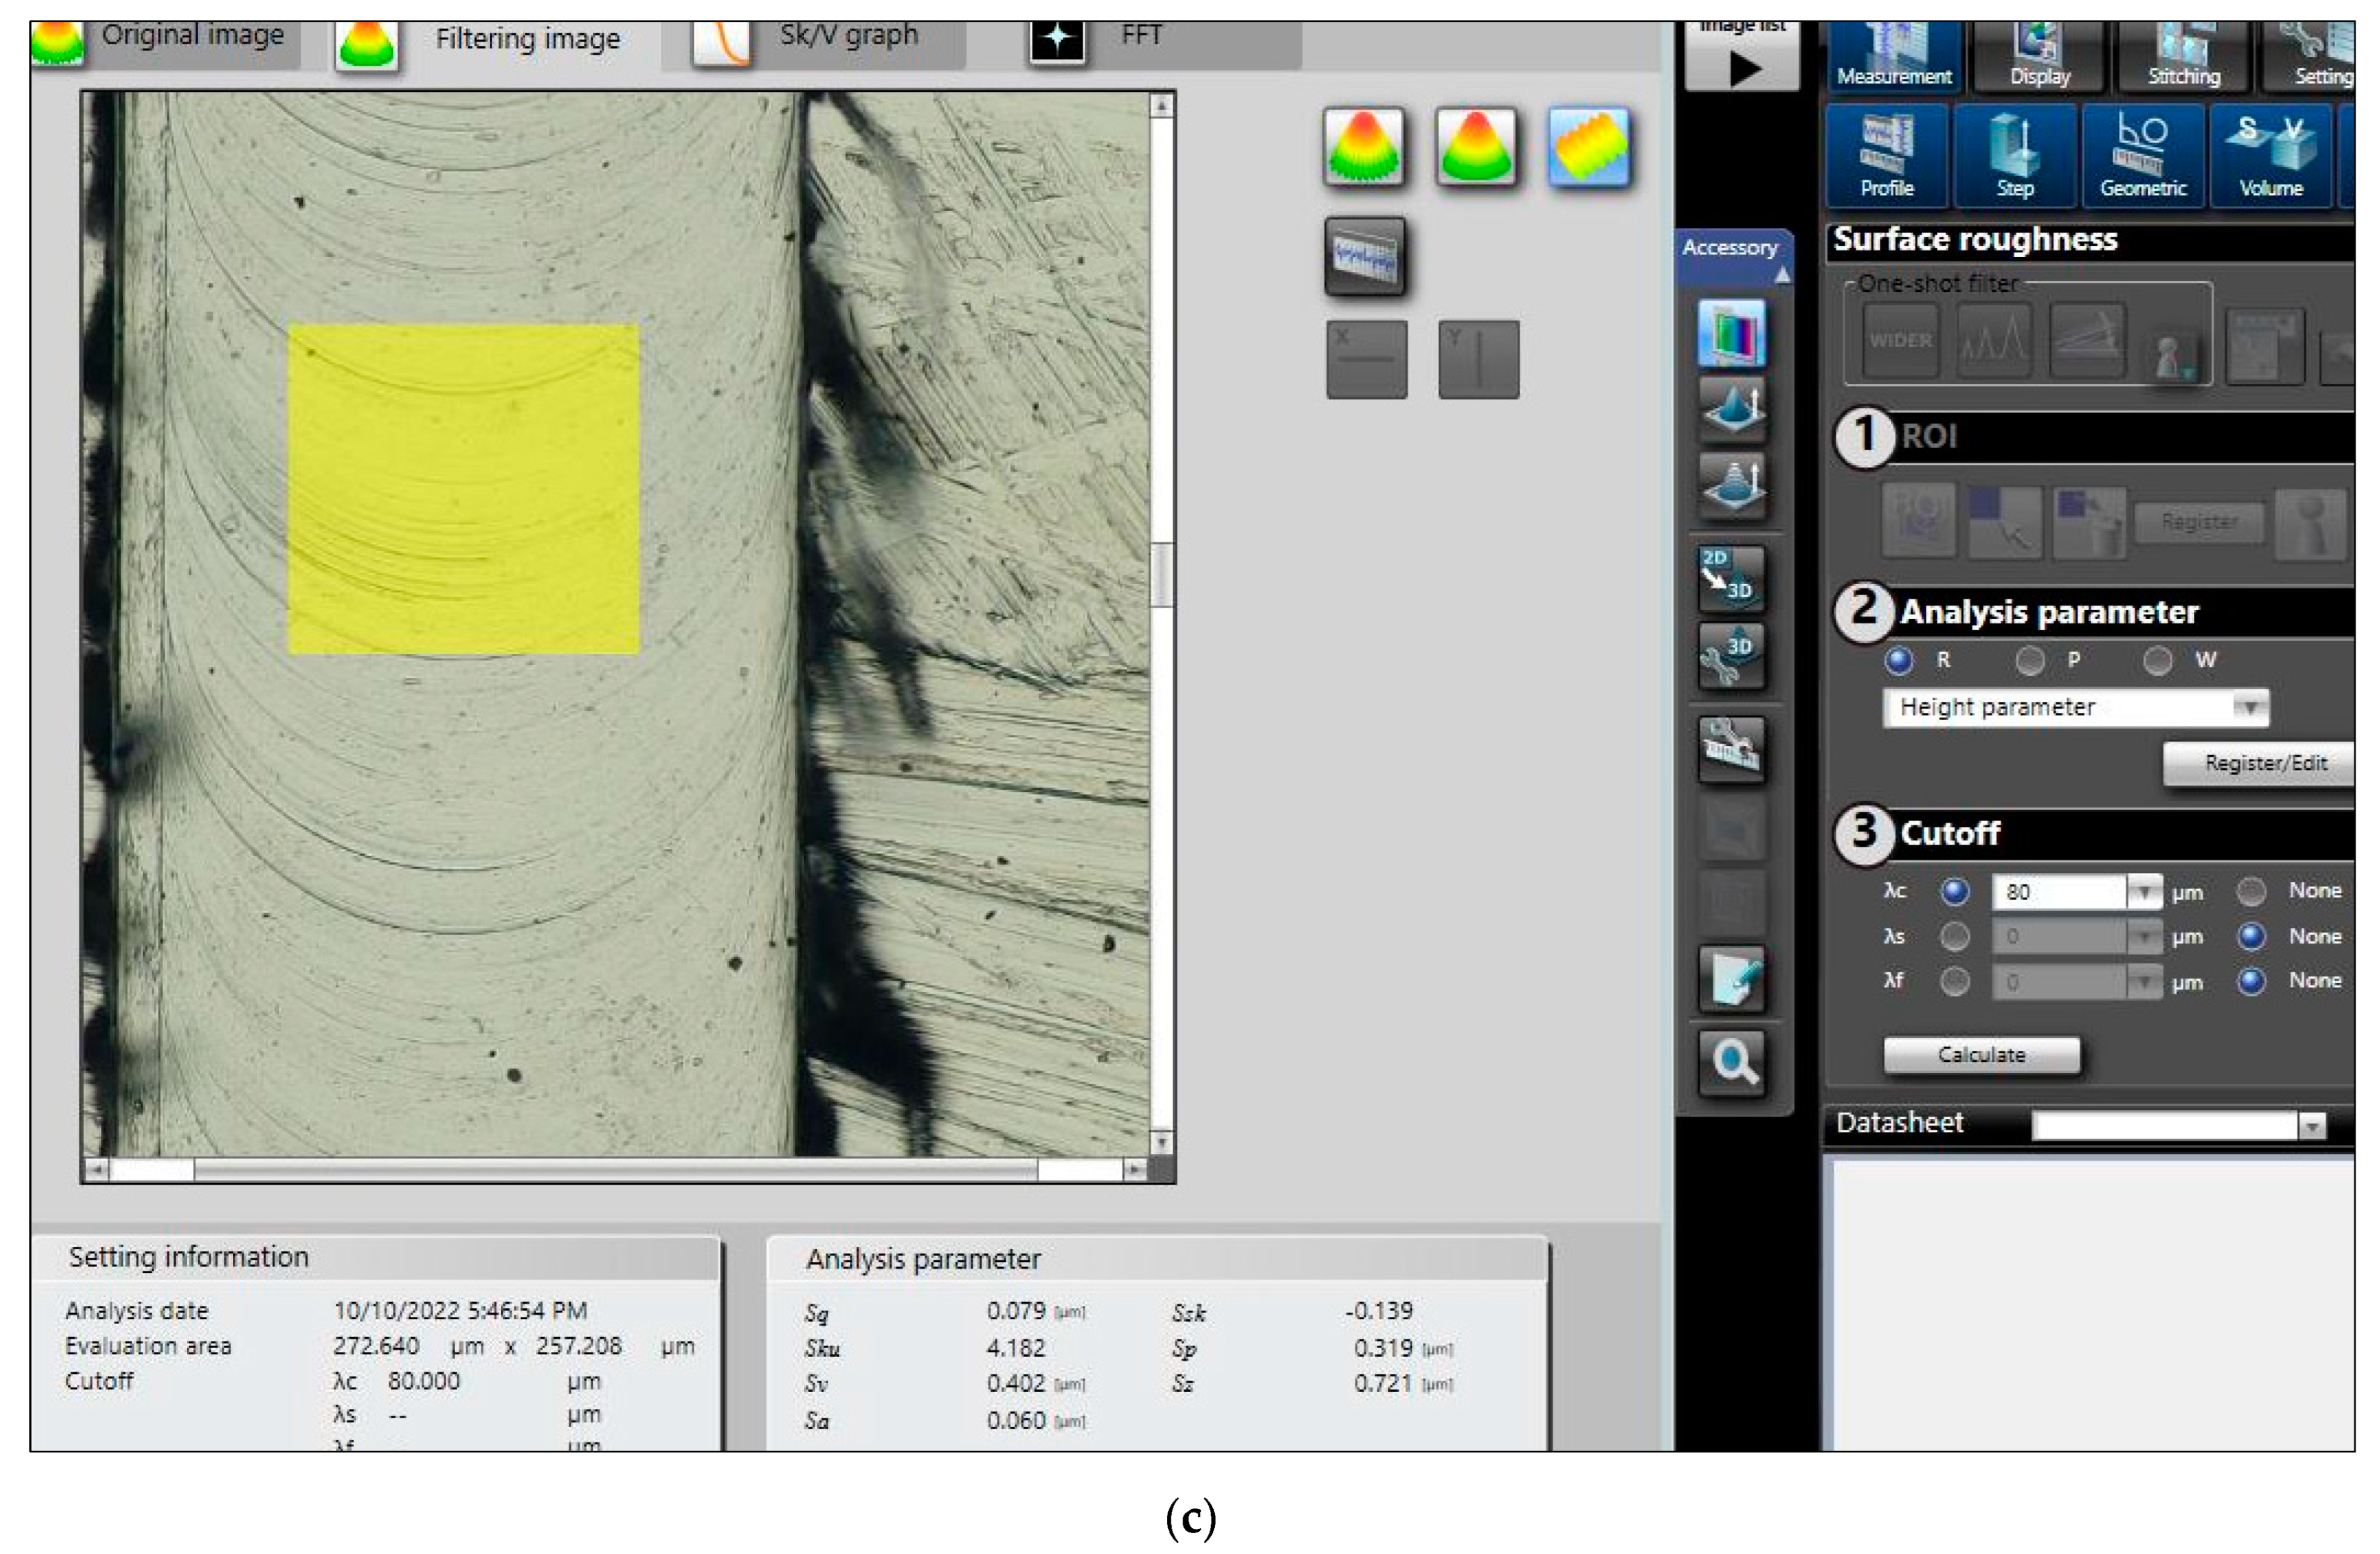
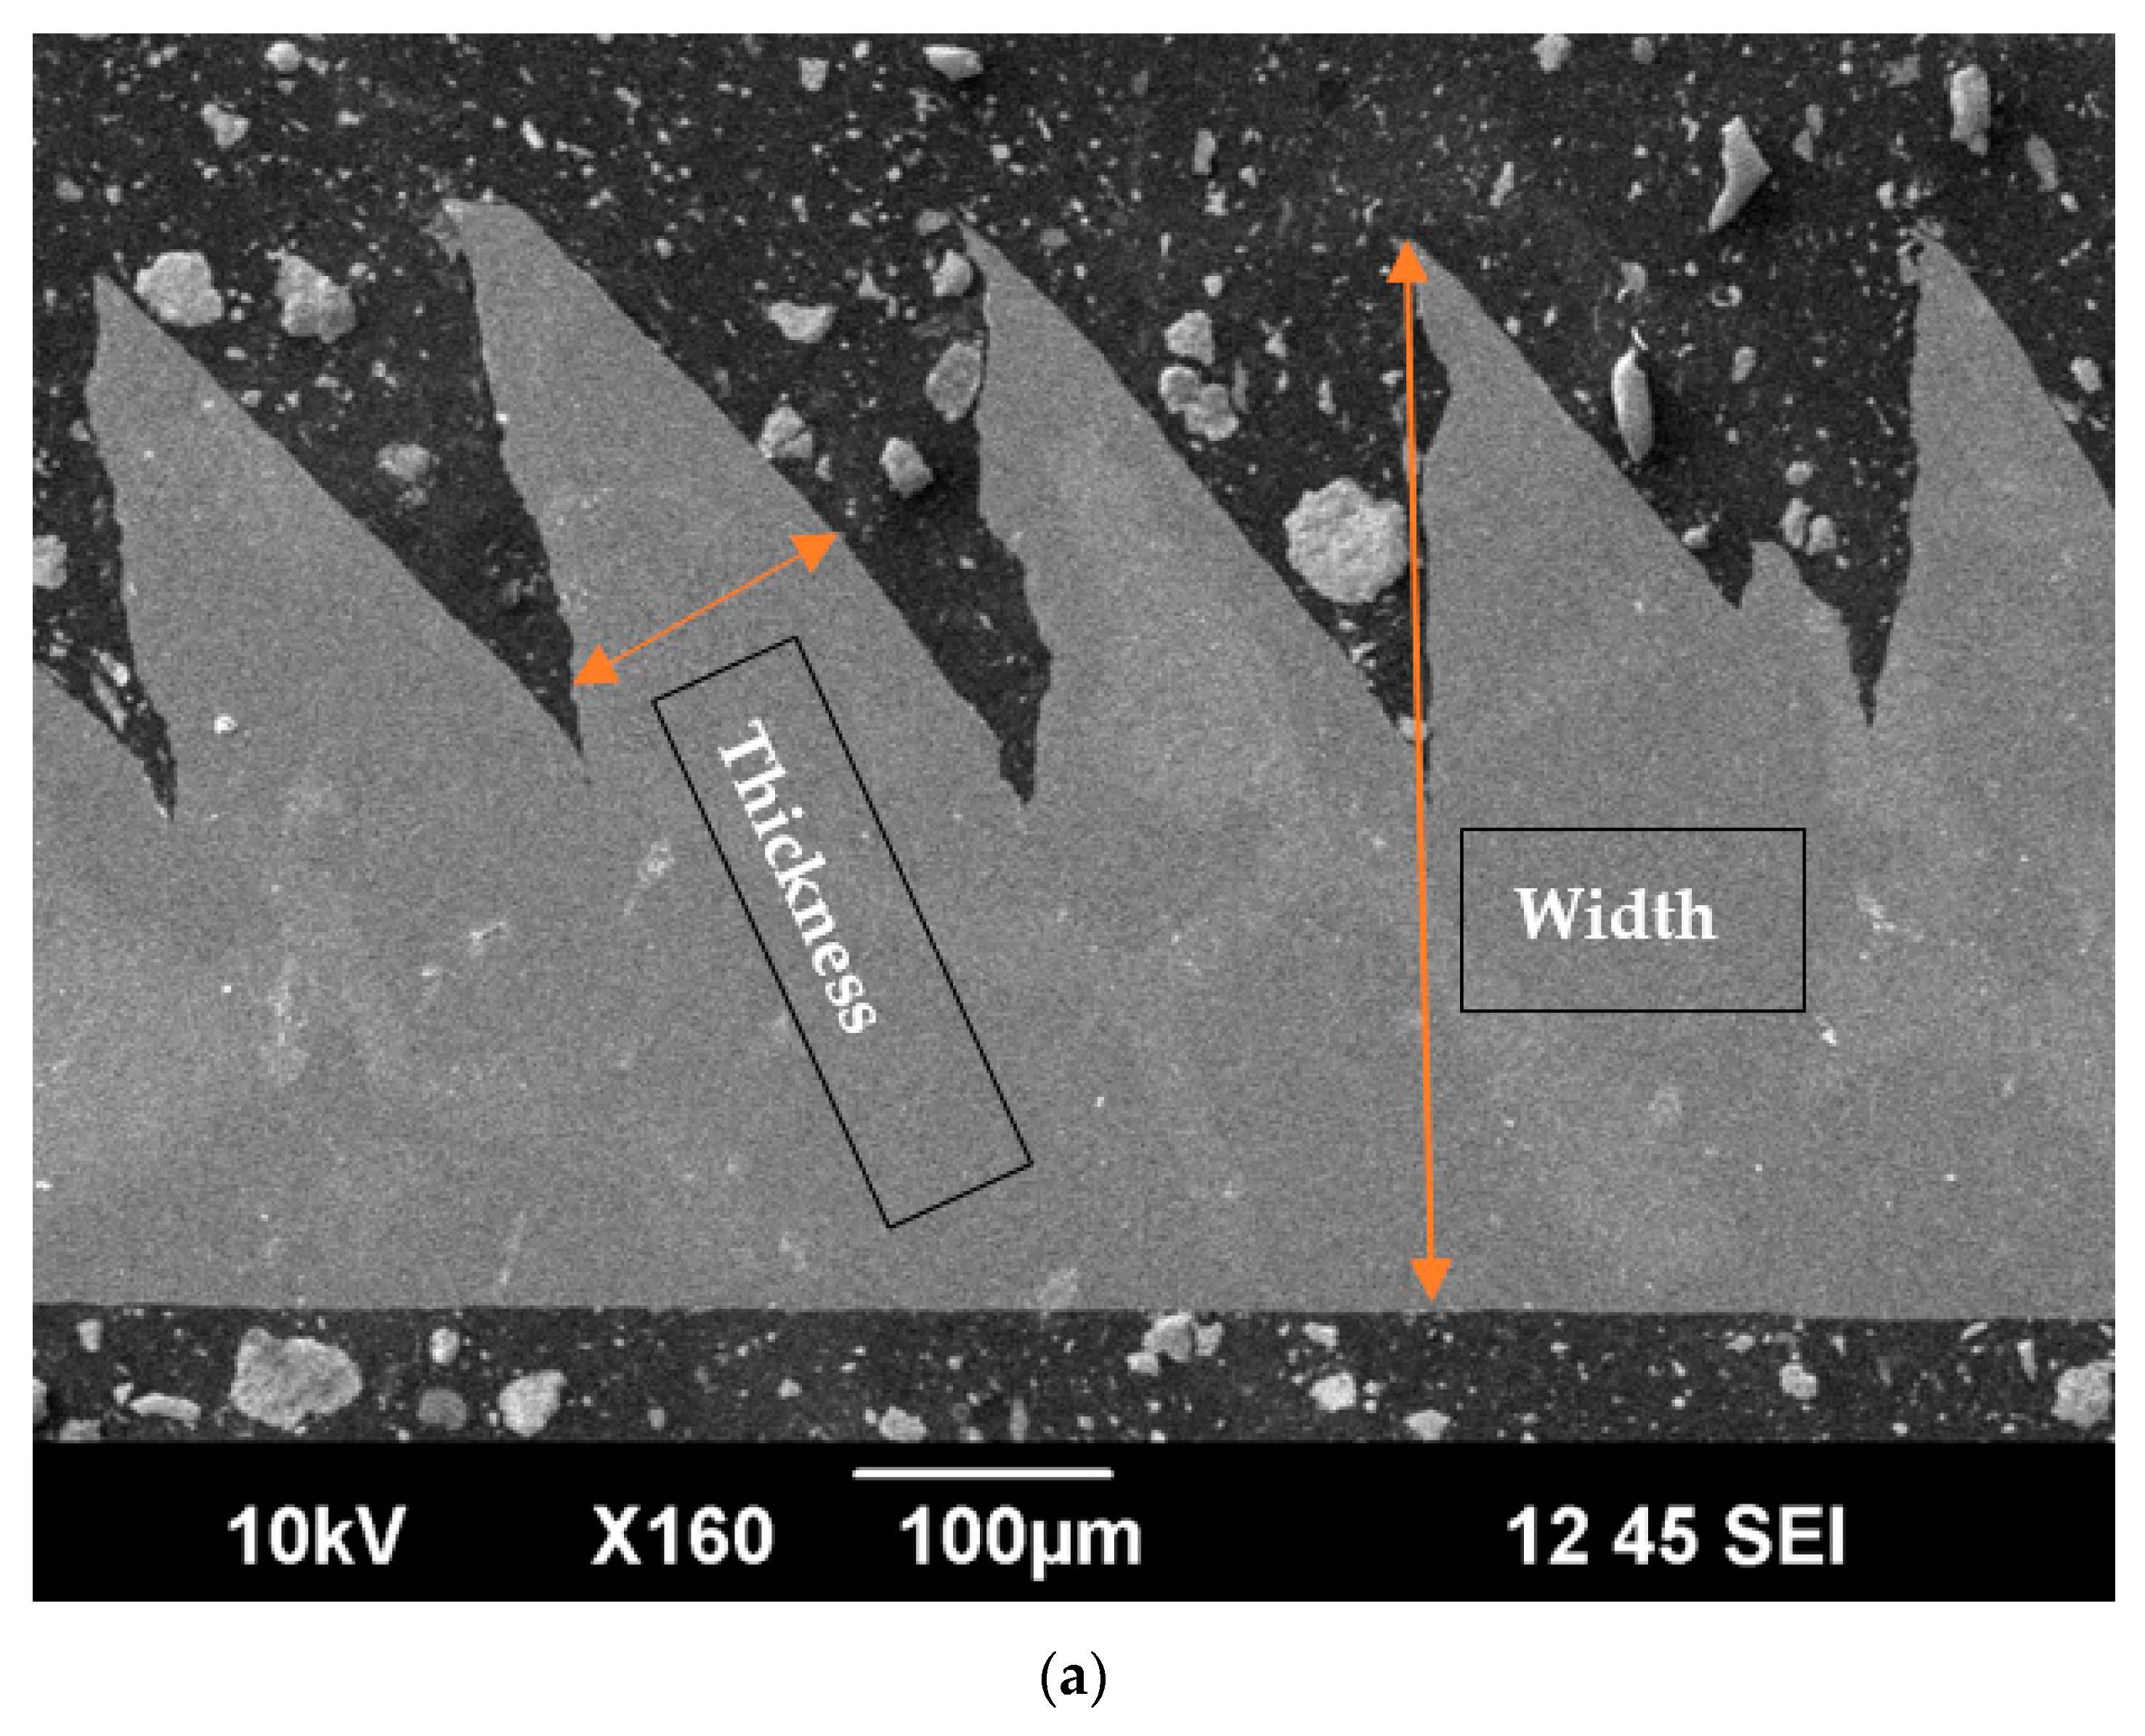
3.2. Response Measurement

In the field of micro milling, researchers frequently employ two descriptions of burrs: one based on burr formation and the other on burr location. Based on the burrs’ locations, shapes, and formation processes, Hashimura et al. [27] classified the burrs into top side and exit burrs. Herein, top burr has been considered for analysis. Burr size is measured in terms of width, length, and height. Most studies considered burr width and height for burr quantification, but no study on burr length was found in the literature; thus, burr length has been included in burr quantification here. An Olympus digital microscope (DXS-1000; Olympus Corporation, Tokyo, Japan) is used to measure tool wear, surface roughness, and burr size at various magnifications. Burr length was calculated using Pythagoras’ theorem, while burr width and height are easily measured under the microscope (Olympus DXS1000). The surface roughness of the slot is measured three times in the middle of the slot, and the average value is used for analysis. Down milling was selected as the worst-case scenario for burr width because burr size was larger on the down milling side, and the average value was used for analysis. Since tool wear occurred on both flutes of the tool, analysis is carried out using the higher value. Response measurement is illustrated in Figure 2. Figure 2a demonstrates the measurement of burr width. The DSX software utilizes line characteristics to determine the top burr width, where the blue section of the red line represents the measured burr width. In Figure 2b, the measurement of tool flank wear is depicted, with the red circled zoom area highlighting the tool wear at 800× magnifications. Furthermore, in Figure 2c, a yellow area within the middle of the slot has been selected to measure surface roughness.

3.3. Selection of Parameters

Literature studies of end milling have found that the major influencing factors affecting the process outcome are feed, cutting velocity and depth of cut [28,29,30,31]. Therefore, based on the literature review three most dominant affecting input parameters were selected in this research study. Range and levels of feed rate and cutting velocity were selected based on previous research studies [32]. While the depth of cut was selected in the range of the tool manufacturer’s recommended criteria [33]. Table 1 shows the detail of selected cutting parameters.

3.4. Design of Experiment

This research study implements the robust design of the experiment method as proposed by Genichi Taguchi. The aim of the Taguchi robust design of the experiment is to assess the influence of various parameters on the mean and variance of process performance characteristics, which in turn determine the efficacy of the process. The Taguchi experimental design utilizes orthogonal arrays to arrange the parameters affecting the process and their varying levels. By employing the Taguchi method, it is possible to make informed decisions regarding the subset of experimental parameters in the field of experimentation. As a result, you can study the entire experimental space with few experiments [34]. The L9 array was formulated for experimentation, and three levels of each parameter were chosen. Each experiment was repeated twice with a fresh tool. The L9 array along with the results are presented in Table 2.

4. Analysis

For a comparative study of outputs with various input parameters, all the responses have been plotted on the same graph. Inputs are examined and analyzed independently. Interaction plots are presented in Section 4.1, Section 4.2 and Section 4.3.

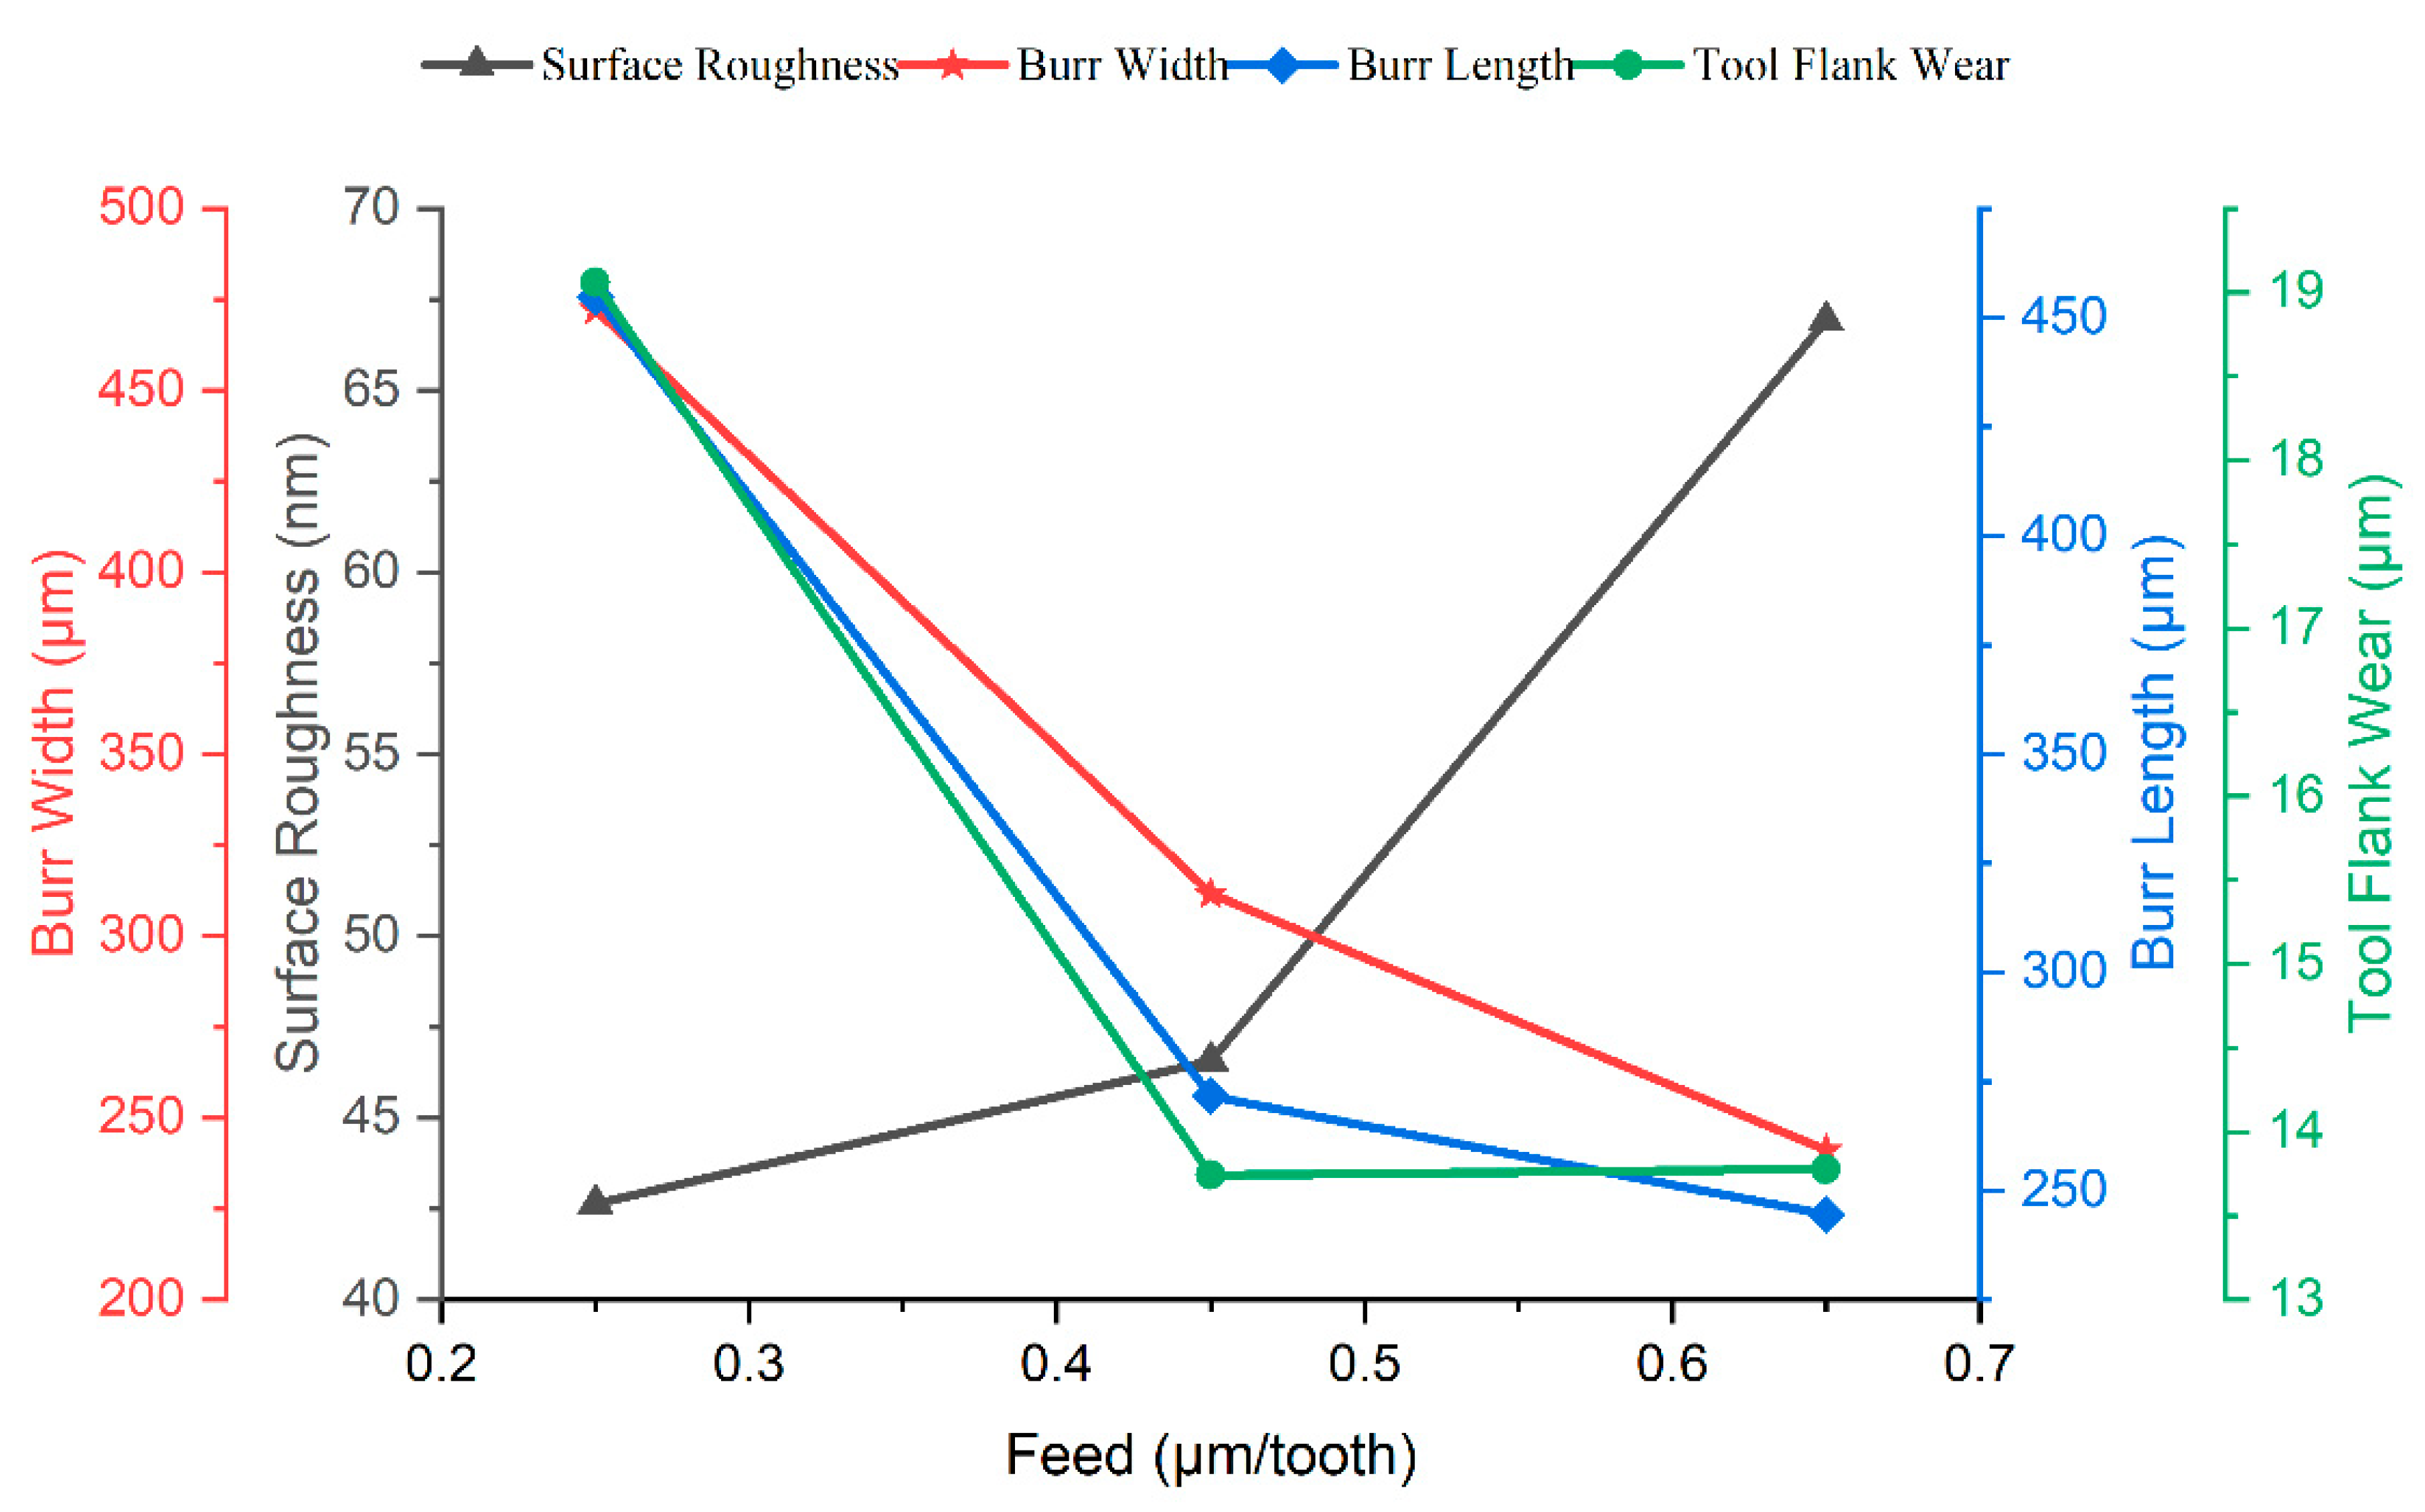
4.1. Influence of Feed

Practically speaking, the feed rate per tooth is the distance the tool’s edge travels through the longitudinal direction of the groove in one revolution. The material layer thickness removed by one edge of the tool, therefore, corresponds to the feed rate per tooth [35]. Feed is the most influential input parameter in micro milling that affects the outcome of the process [29,36,37]. Figure 3 shows the effect of feed rate on different outcomes of micro-milling of titanium grade 9 in this research study. It is evident from Figure 3 that feed rate has a profound impact on surface roughness, tool wear, burr width and length. Surface roughness increases when the feed rate is increased. A lower feed rate produced better surface roughness as compared to higher feed rates. Researchers have explained in their studies that with increasing feed rates, more heat is generated, the contact area between tool and workpiece increases, and cutting force also increases, thereby resulting in increased surface roughness [38]. Trends of tool wear, burr with, and burr length are also illustrated in Figure 3, which shows the decreasing trends with the increase in feed rate. Two material removal mechanisms, viz plowing and shearing, occur during the micro-milling process. The desired mechanism is a shearing dominant regime in which material is removed in distinct chips. The plowing dominant regime is an undesirable mechanism in which material removal is accomplished through plastic deformation. In the plowing dominant regime, there are high cutting and frictional forces, as well as high temperature, which results in high tool wear [5]. A plowing mechanism is dominant at lower feed rates; therefore, a larger burr size (width and length) is observed. At higher feed rates, material removal is accomplished through a shearing mechanism; hence, the burr size was smaller. Figure 4a,b displays SEM Imagery of the formed chips corresponding to maximum and minimum burr thickness conditions, respectively. The image labeled as 4a is captured at a magnification of 160×. On the other hand, the image labeled as 4b is taken at a higher magnification of 200×. Tool wear trend is also congruous with above stated phenomenon, i.e., higher temperature, higher frictional and cutting forces resulted in higher tool wear at lower feed rates.

4.2. Influence of Speed

The cutting speed serves as a crucial input parameter in the micro-milling process, as it significantly impacts the final process outcome. Previous studies in the field of micro milling have determined that cutting speed plays a primary role in determining factors such as surface roughness, tool wear, and burr formation [39,40].
Figure 5 shows the influence of cutting speed in the micro-milling of titanium grade 9, where it is illustrated that burr width decreases, whereas tool wear and surface roughness increase, with increasing cutting speed. Burr length initially increases, then decreases with increasing cutting speed. Deceasing trend of burr width may be ascribed to uncut chip thickness that decreases with the increasing cutting speed. For the tool increasing with cutting speed, it has been found in the literature that a high temperature is generated at higher speeds in difficult-to-cut materials [41]; the rubbing action between the tool and workpiece, even though for less time, causes heat generation, and thermal softening at the flank face, thereby leading to abrasive wear of tool [9]. Poor surface finishes at higher speeds result from an increase in the built edge due to the improvement in the ductility of the material at higher temperatures and friction, which causes a hindrance to continuous chips [42]. Chandiramani et al. [43] showed in their findings that discontinuous chips are formed at a low cutting speed. Smaller length burrs at low cutting speed might be due to discontinuous chips whereas after further increases, the length showed a decreasing trend. This decreasing trend can be attributed to decreasing uncut chip thickness.

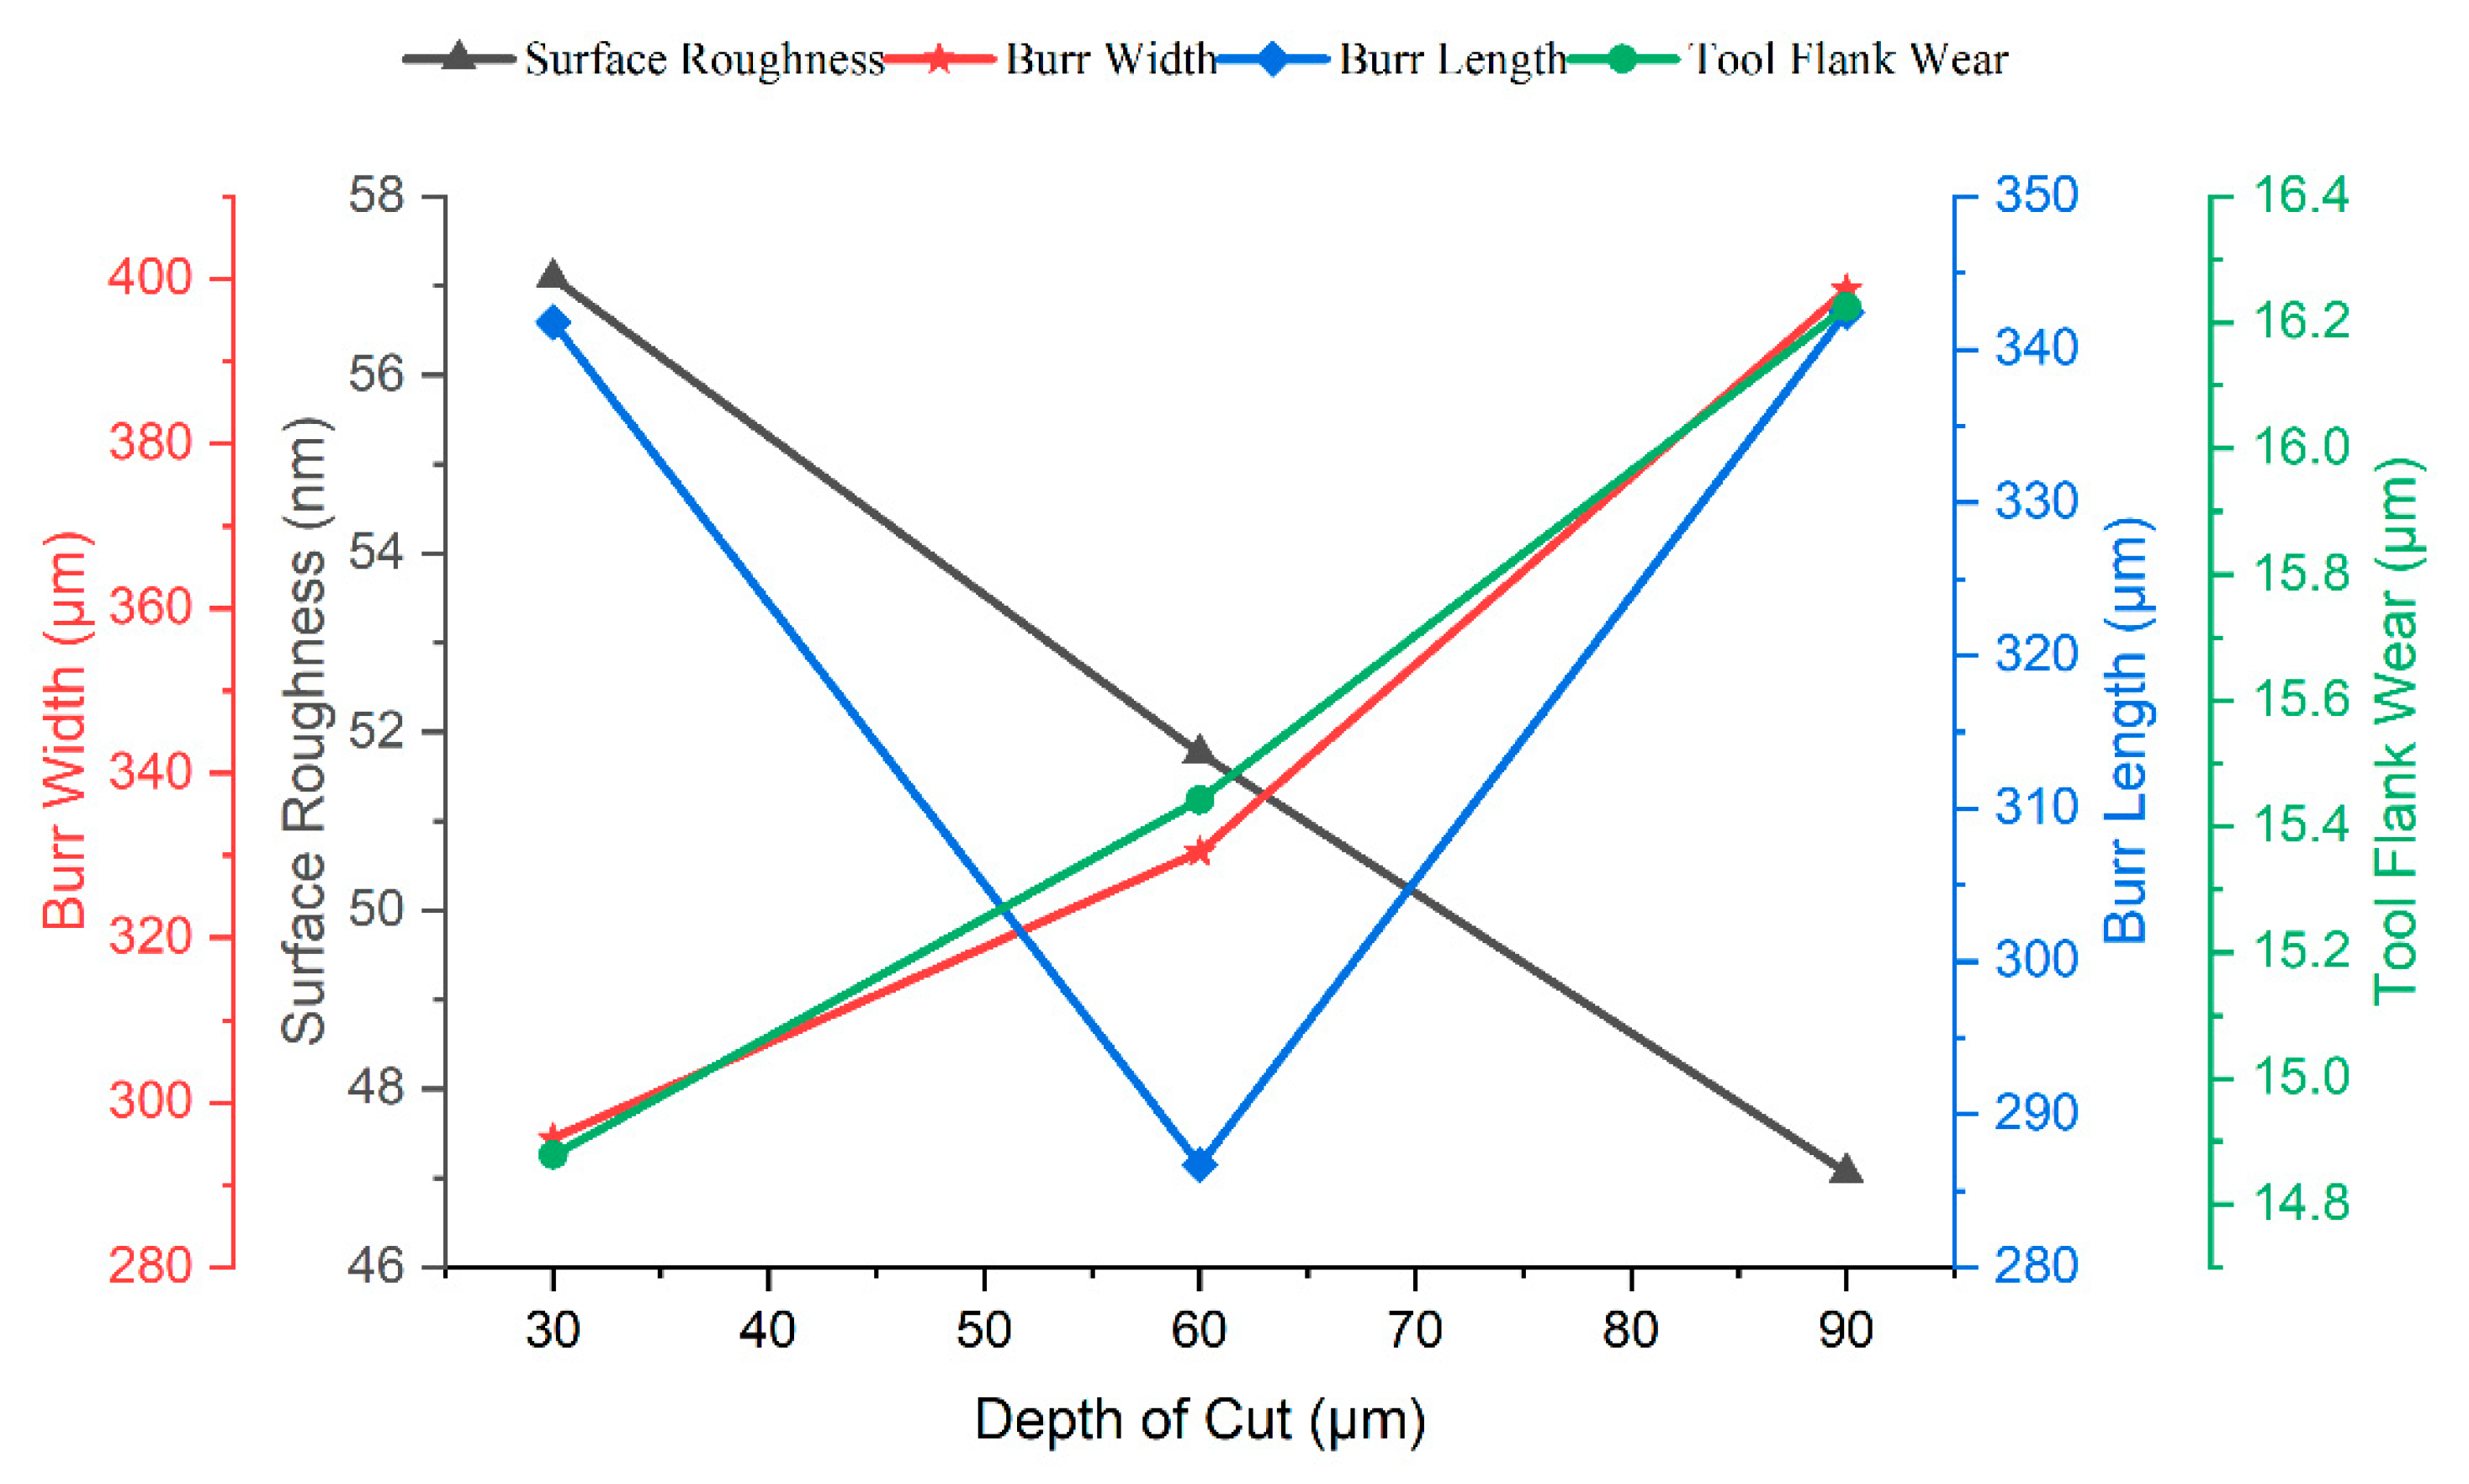
4.3. Influence of Depth of Cut

The axial depth of cut is the distance a tool engages a workpiece while moving perpendicular to it in its axis direction. Numerous studies [44,45,46,47] have considered the depth of cut as the primary input variable along with feed and cutting velocity. The influence of depth of cut on various process outputs in micro milling of titanium grade 9 is illustrated in Figure 6. Figure 6 shows the direct relationship between the depth of the cut with tool wear and burr width, i.e., with the increase in the depth of the cut, both the output variables increase. Whereas, with increasing the depth of cut, surface roughness decreases. Burr length did not show any clear trend with the depth of cut; first, it increased then showed a decreasing trend. Increasing trends of burr width and burr length can be attributed to increasing uncut chip thickness as the depth of cut increases. Improved surface quality at higher depth of cut might result from work hardening of layer surface at higher depth of cut [48]. Wang et al. [49] have stated in their study, on end milling of titanium grade 5, that more heat generation and increased cutting forces are observed at higher depths of cut; therefore, it is the reason for the increasing trend of tool wear observed in this study for tool wear.

4.4. Individual Process Outputs Optimization

Optimized parameters, less amount of burr size, tool wear, and lower surface roughness are required for the micro-milling process. Moreover, signal-to-noise ratio and orthogonal array are important tools commonly used in robust design. In the context of continuous characteristics, the S N ratio can be categorized into three groups: nominal (considered the best), smaller is better, and larger is better. Specifically, for the characteristics of minimal process outcomes, the objective is to minimize process outcome values, indicating that “smaller is better” is the desired characteristic [50]. The S N ratio is then determined by applying Equation (1).
S N = 10 l o g 1 n i = 1 n y i 2
Therefore, “Smaller is better” is the desired model for this research study. Table 3 represents the best and worst conditions of input parameters for various outcomes of the process. The worst case corresponds to the max value of the process outcome obtained at that individual input parameter, whereas the best case corresponds to the minimum value of the process outcome recorded at that input variable.

4.5. Need for Multi-Objective Optimization

If only one quality goal is pursued, the optimization process is referred to as a single objective; if several quality goals are taken on, it is referred to as multi-objective. Because there is a large solution space for manufacturing problems, the optimization strategy frequently includes multiple quality objectives [51]. Since the quality objective in this research study is to minimize all the process outcomes, i.e., surface roughness, burr size, and tool wear at the same time. From Table 3, it can be seen that the optimized value (best case) of input parameters for each process outcome is different from each other. Therefore, a multi-objective approach is required to optimize the process input parameters to obtain quality objectives in terms of low surface roughness, tool wear, and burr size.

5. Gray Relational Analysis

A grey system is a system in which only a portion of the system is known while the remainder is unknown [52]. Deng Julong introduced this optimization technique in 1989. Although the grey analysis was first put forth many years ago, it has only recently started to be utilized extensively. To assess a complex project’s performance with relatively limited data, grey analysis was used [53]. Using experimental data, GRA converts the multi-response optimization into GRG’s single-object optimization. GRA entails various steps, which have been explained in the following sections.

5.1. Step I: Normalization of Response Data

Data pre-processing is carried out to transform the original data sequence into a comparable sequence. Data are normalized range is from 0 to 1. Various methods of data preprocessing are available depending on the sequence of data characteristics. In the present research study, a smaller is better approach, where the objective function has the lowest values, has been adopted for optimization of the output of the process. Therefore, data are normalized based on Equation (2).
x i ( k )   = max y i ( k ) y i ( k ) max y i ( k ) m i n y i ( k )
where, x i ( k ) is the value obtained after normalization, min y i ( k )  is the smallest value of y i ( k ) for the Kth response, K contains values from 1 to nth, max y i ( k ) is the maximum value of the y i ( k ) for the kth response.
Normalized data are presented in Table 4.

5.2. Step II: Calculation of Grey Relational Coefficient (GRC)

After the normalization of response data, GRC was calculated by using Equation (3).
ξ i k = ( m i n + ξ m i n )   ( 0 i + ξ m a x )
where, 0 i = ||X0(k) − Xi(k)||, i.e., difference of target sequence and comparison sequence
ξ = distinguishing coefficient; range between 0 and 1.
X0(k) = target sequence
Xi(k) = comparison sequence
m i n = min value of 0 i
m a x = max value of 0 i .
Deviation sequence and grey relational coefficient are presented in Table 5.

5.3. Step III: Calculation of Grey Relational Grade (GRG) and Rank

The grey relational grade is employed to determine the correlation between a measurement space factor and a target sequence through the generation of a discrete sequence using grey relational analysis. The grey relational grade can be calculated by averaging the grey relational coefficients using Equation (4).
γ i = 1 n k = 1 n ξ i k
GRG calculation, using the above equation, is presented in Table 6. Then, experimental runs were ranked based on the GRG values. The run with the highest GRG value was ranked 1, and with the lowest GRG value ranked 9. Rank order is also presented in Table 6.
The values of GRG in Table 6 were used to calculate the mean value of the grey relational grade for each level of input variables, which was then summarized in the response table. The greater the grey relational grade shown in the response table, the better the multiple performance characteristics.
The total mean value, from Table 7, of the grey relational grade is 0.590.
Therefore, based on Table 7, the optimal values, and highlighted values of GRG in the table are observed for the input variables of f (µm/tooth) = 0.45, Vc (m/min) = 25 and ap (µm) = 60.

6. Response Surface Methodology (RSM)

RSM is a useful tool for process improvement when numerous variables and interactions affect desired results. The experimental process, which is influenced by multiple factors, is constantly being developed, improved, and optimized with the assistance of the useful statistical and mathematical tool known as RSM. Contrary to the Taguchi Method, the Response Surface Methodology integrates statistical and experimental techniques with data-fitting techniques. Regression analysis is employed to establish the relationships between responses and variables, thereby creating a mathematical model that represents the relationship between a set of test factors and objective functions based on the responses obtained from experiments. This model is subsequently utilized to explore the optimal solution within the experimental domain, as reported in different studies [54,55]. This recent study in the field also utilized the RSM technique to optimize the micro end milling process of titanium grade 9 (Ti-3Al-2.5V).

6.1. Regression Modeling

Using Minitab software, regression analysis is used in the current study to create mathematical models that represent the GRG as functions of the independent variables of feed, cutting speed, and depth of cut. On each response, no transformation has been applied. Formulated Equation (5) is presented.
GRG   ( f ,   Vc ,   ap ) = 0.193 + 3.784   f 0.01384   Vc + 0.01308   ap 2.967   f 2 + 0.000114   Vc 2 0.000071   ap 2 0.00193   f   ×   Vc 0.01188   f × ap ( R 2   =   94.40 % )
The determination coefficient R2 is used to assess the performance of a developed mathematical model. The range of R2 lies between 0 and 1. If it is close to one, then there is a good fit between the dependent and independent variables of the process [56]. In the present study, the R2 value of the regression model is close to 1. Examination of residual is used to determine the adequacy of the developed modal. The residuals are examined using residual versus predicted response plots and residual normal probability plots, which represent the difference between the respective observed response and predicted response. A straight line should be formed by the points on the residuals’ normal probability plots if the model is adequate. It can be observed from Figure 7 that the residual plot for the developed model of this study forms a straight line.

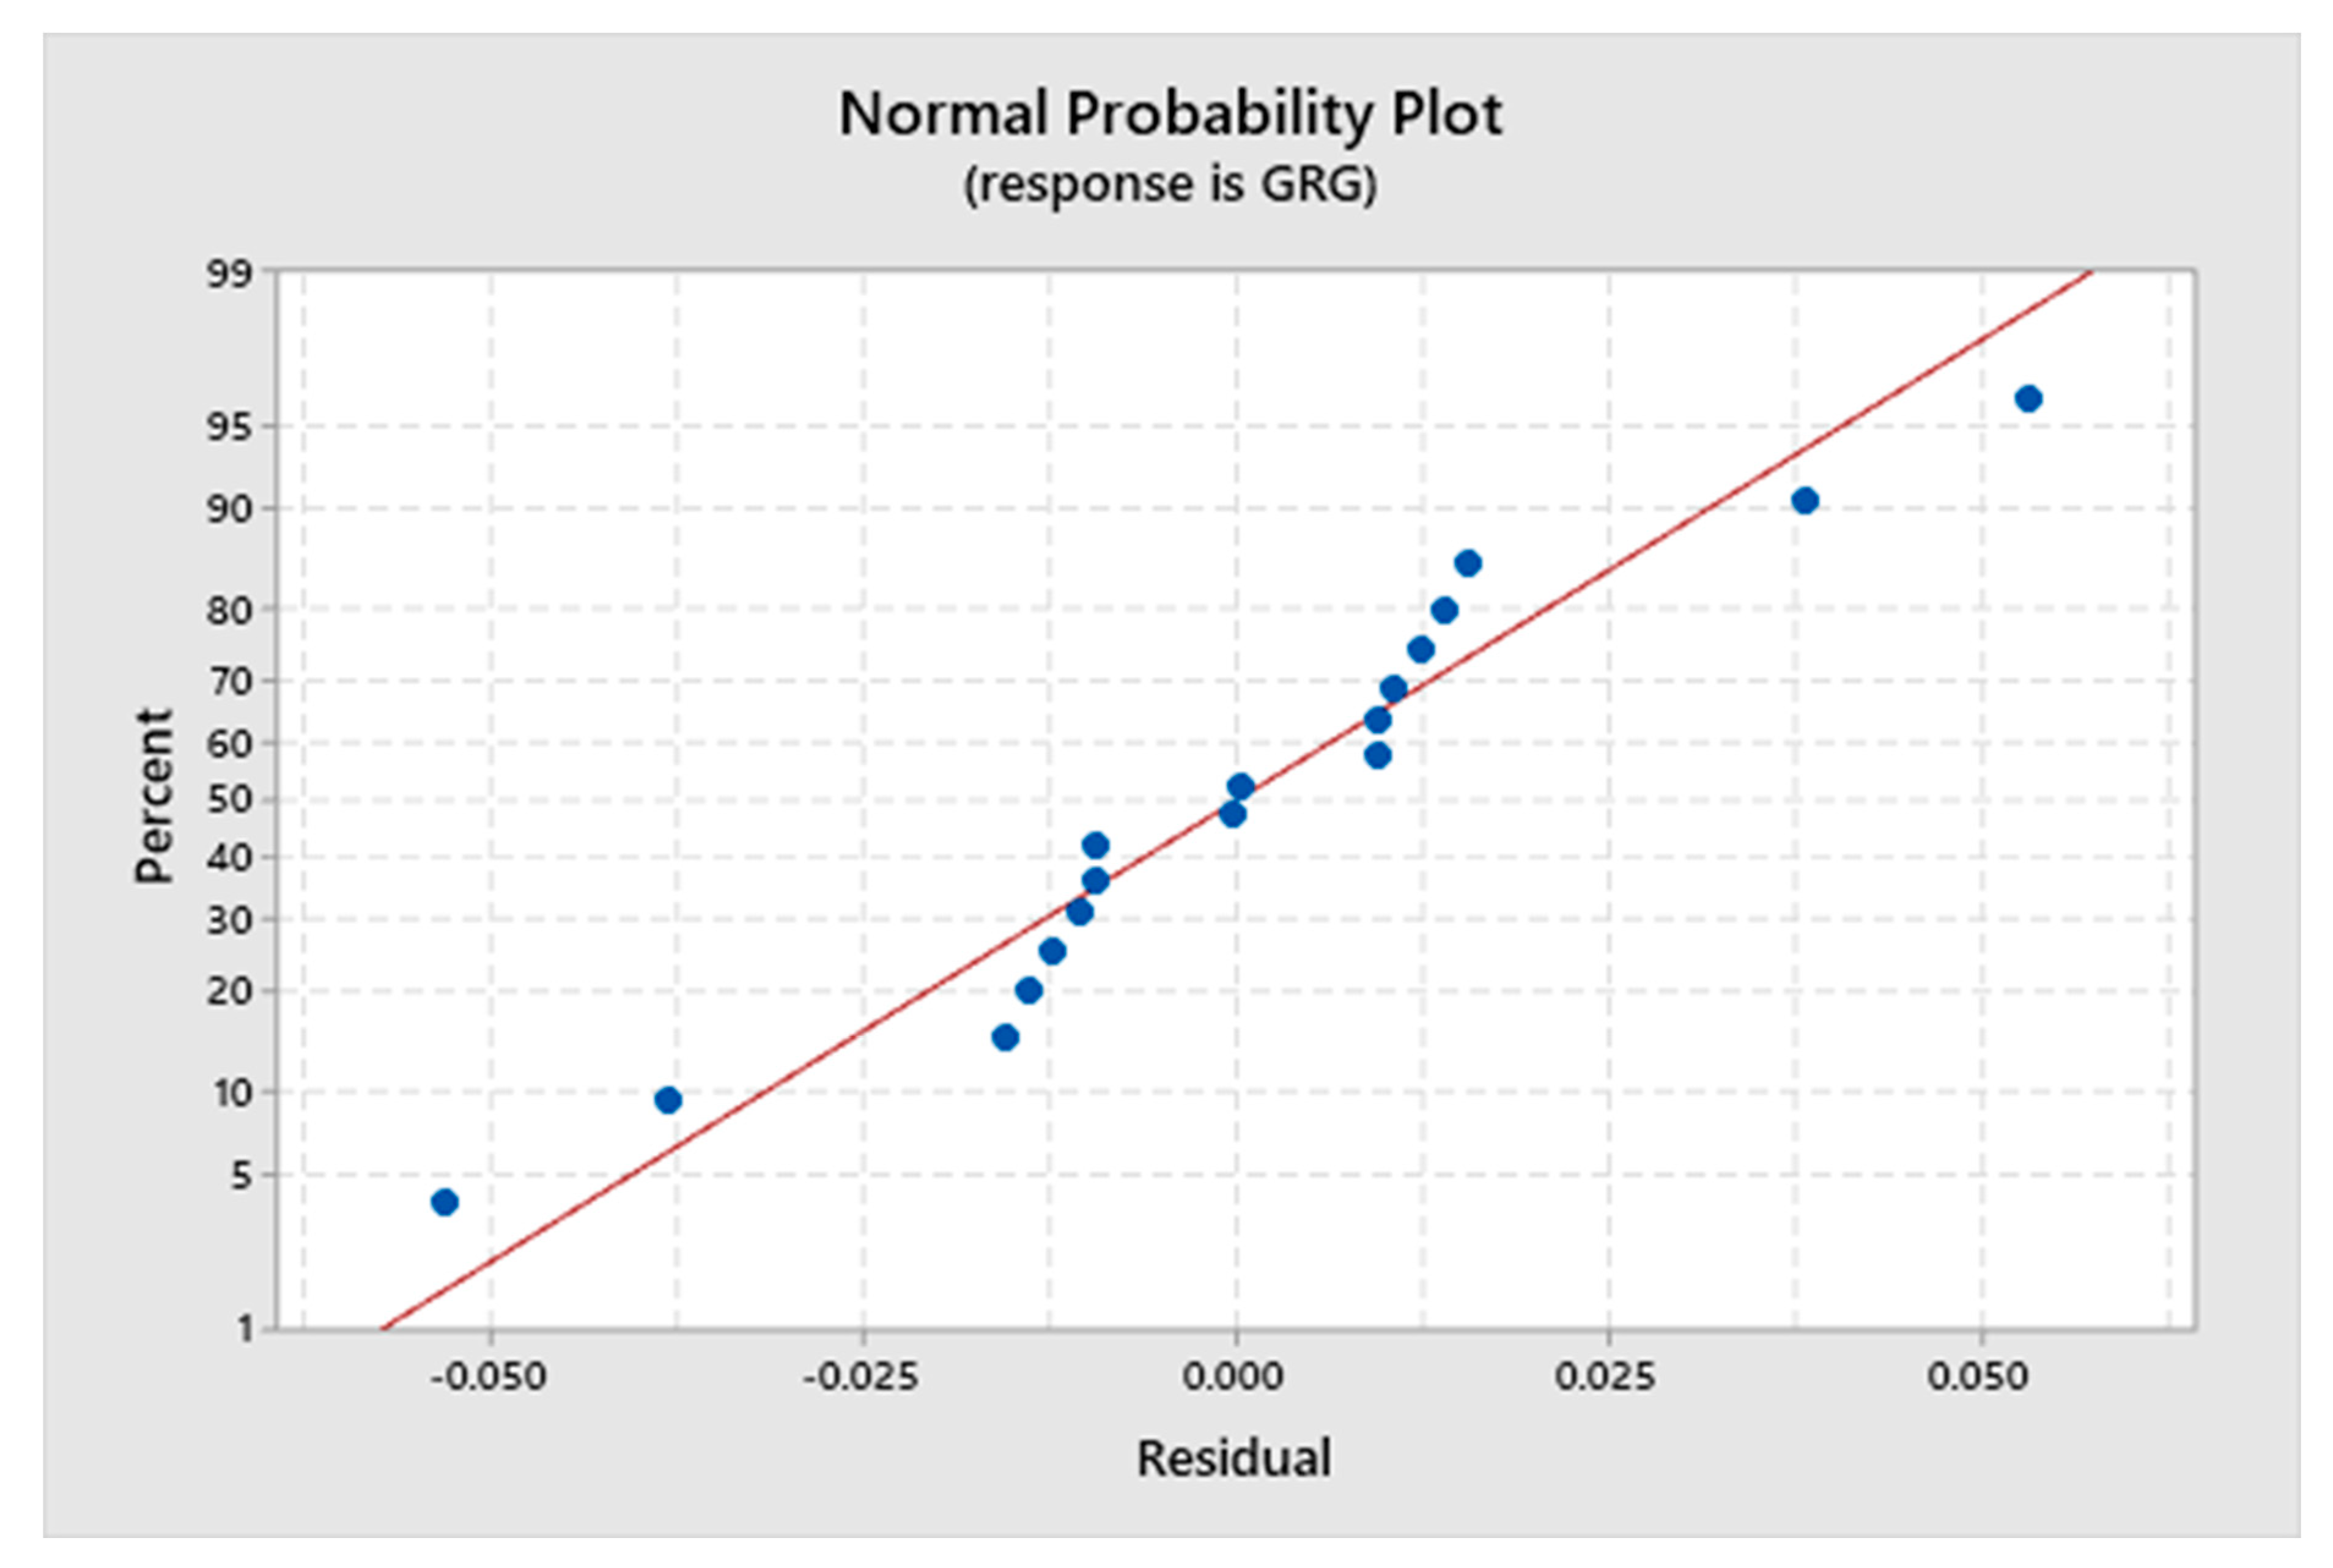
6.2. Analysis of Variance (ANOVA)

Analysis of Variance (ANOVA) is utilized to identify which independent process parameter has the most significant impact on the quality characteristic. A summary of the ANOVA results for the variables of surface roughness, burr width, burr length, and tool wear are presented in Table 8. The term “Model” in the ANOVA table refers to the statistical model that is being used to analyze the data. The model represents the mathematical relationship between the dependent variable (the variable being measured or observed) and the independent variables (the factors or variables that are believed to influence the dependent variable). In our research study, the model is significant (p-value = 0.000) which means the model provides a better fit to the data. The term “Linear” in the table refers to the linearity of the model. In a linear model, it is assumed that the relationship between the independent variables and the dependent variable can be described by a linear equation.
Table 8 depicts that the feed is a major contributing factor that influences the GRG with a higher contribution ratio (CR) value while cutting velocity stood second in individual parameter contribution. The depth of cut was found to be an insignificant individual parameter. It has also been observed from Table 8 that the interaction of parameters is also an important factor that affected the GRG. The contribution of (F × F) interaction stood highest with CR at 30.47%, while the interaction (F × ap) stood second with CR at 8.24%.

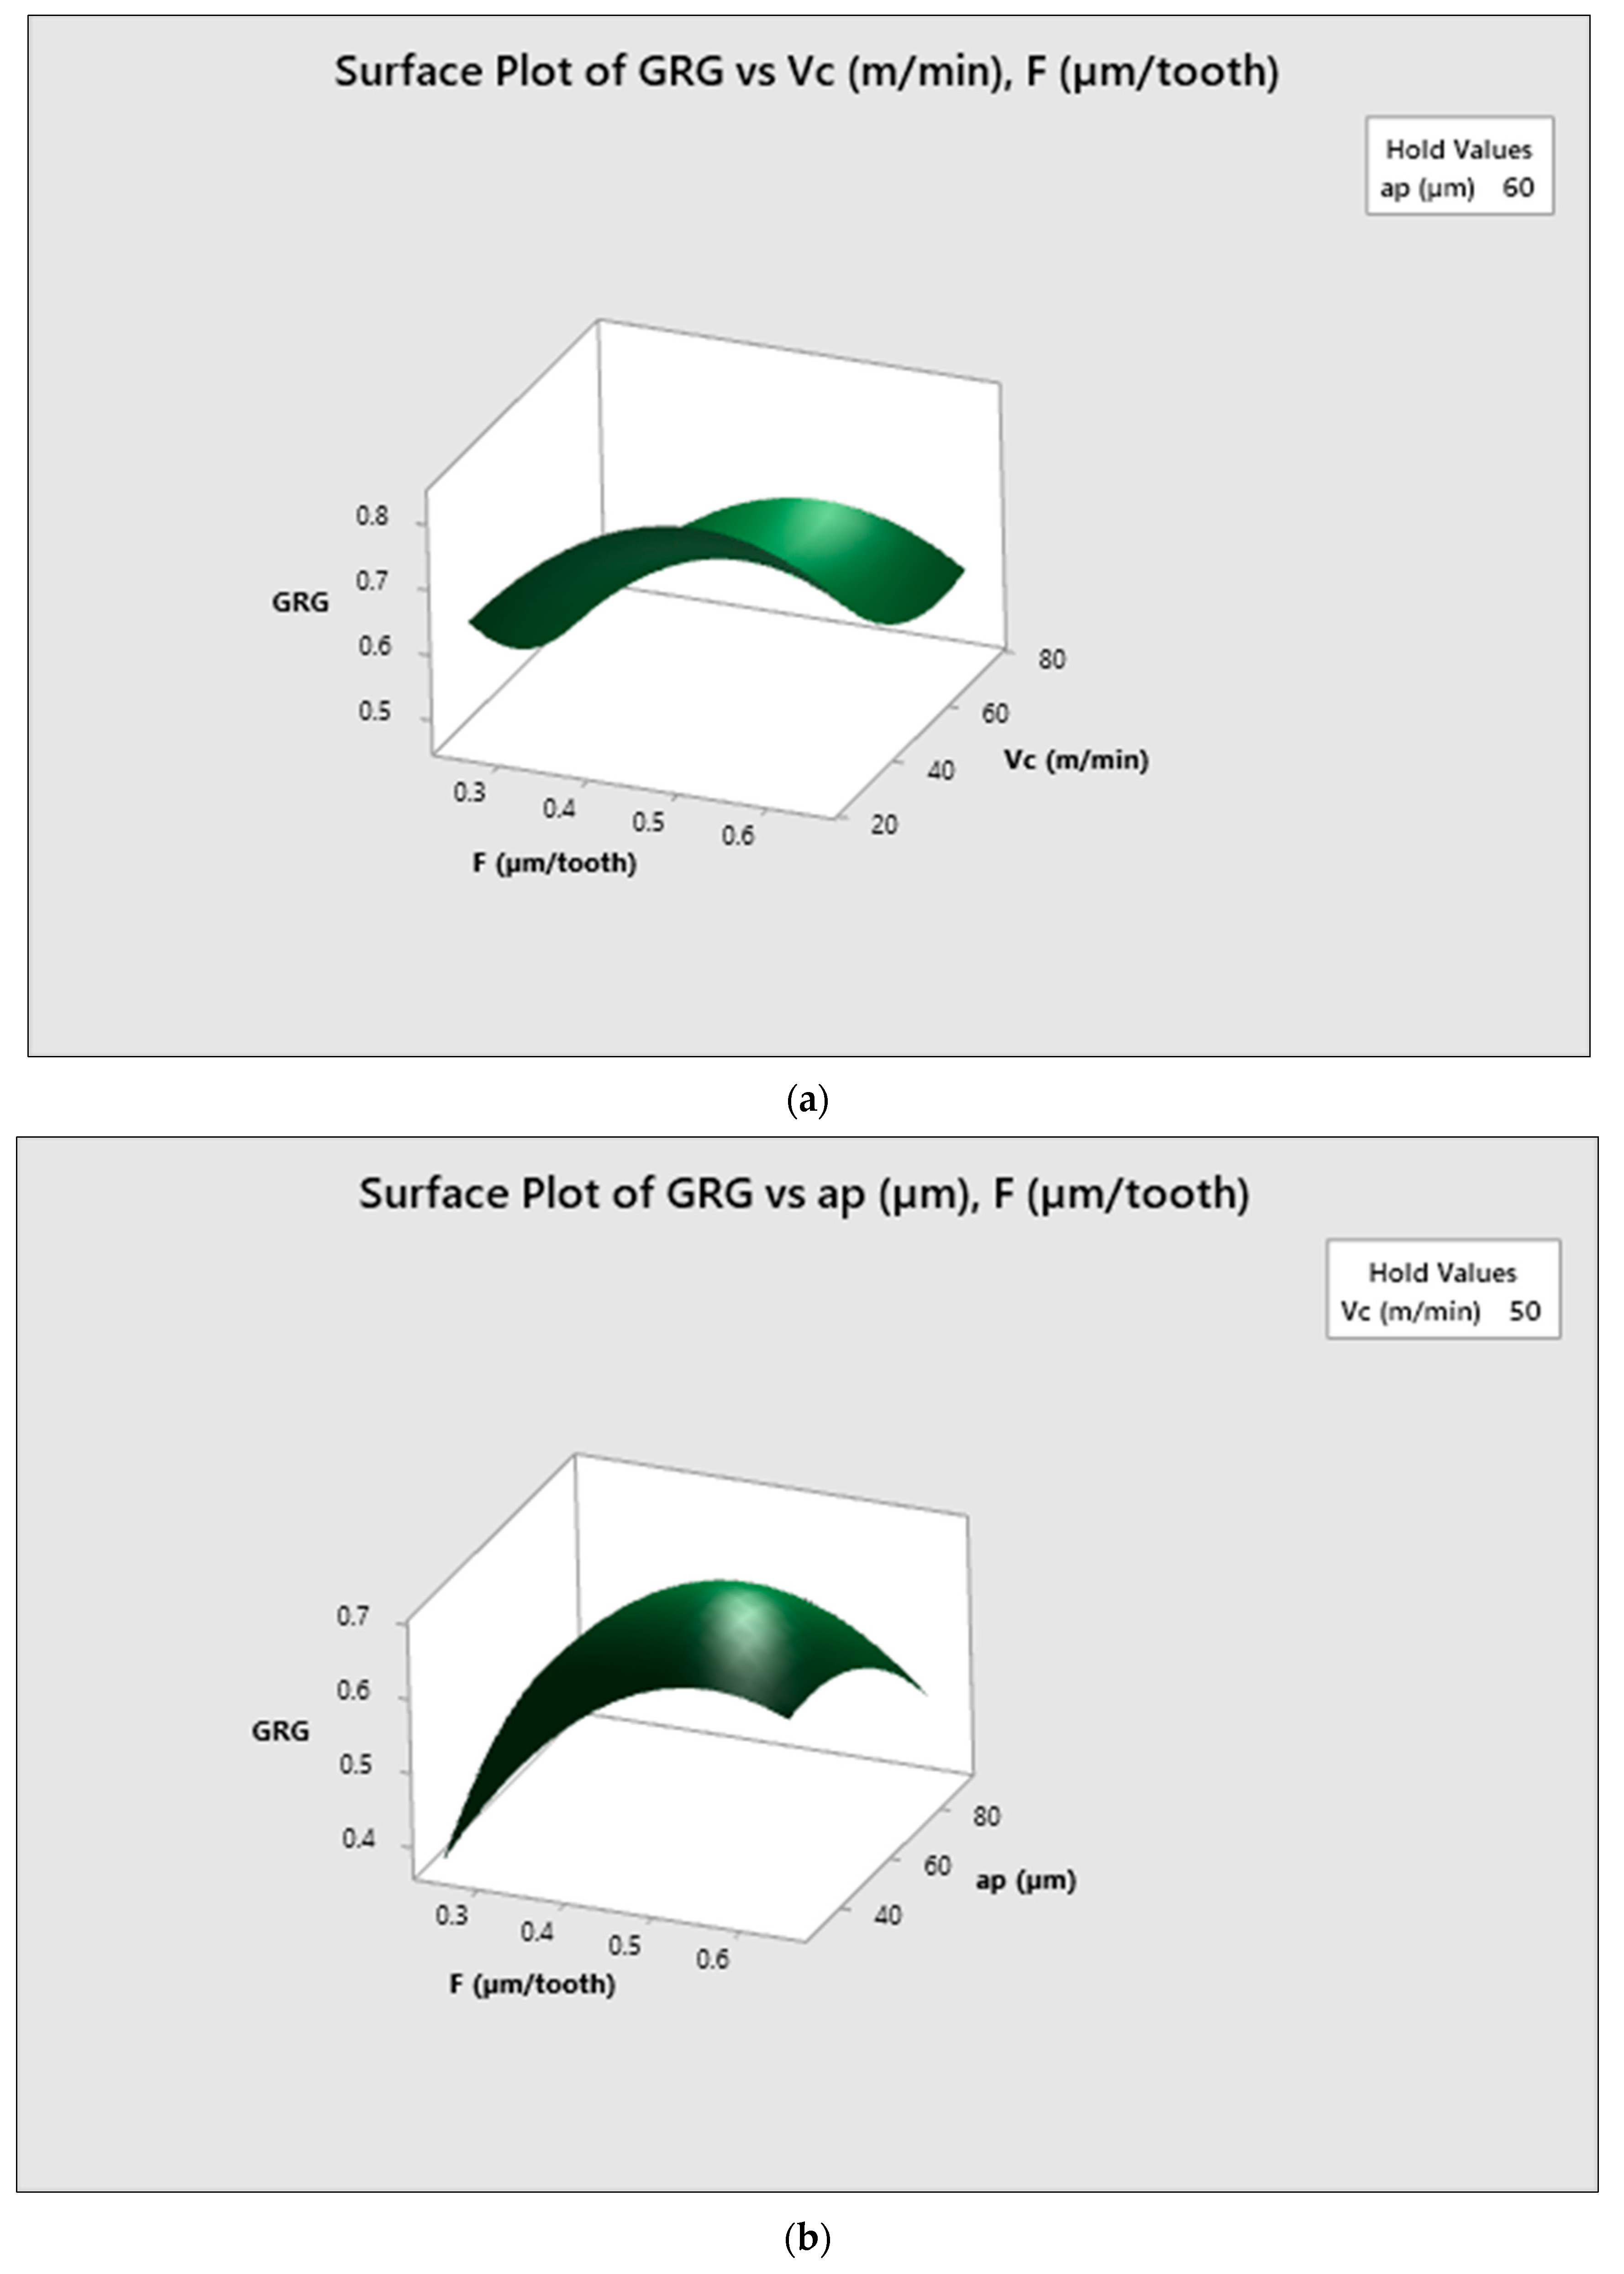
6.3. Contour and Surface Plots

Contour plots are utilized to analyze the correlation between the predicted response variable and two independent variables. The graphical representation utilizes distinct contours and surface plots to depict the predicted response variable. In Figure 8, contour plots are presented to showcase the relationship between the input parameters and GRG.
Similarly, Figure 9 exhibits surface plots displaying the relationship between GRG and input parameters. These graphs effectively illustrate the influence of process parameters in combination with their corresponding outcome in terms of GRG. From the plots, it becomes apparent that the highest value of GRG, the response variable, is observed when the feed rates are lower and the cutting velocity is higher.
The results further demonstrate that a combination of lower feed rates and lower cutting depth maximizes GRG. The interaction between higher cutting depth and velocity results in the highest value of GRG.

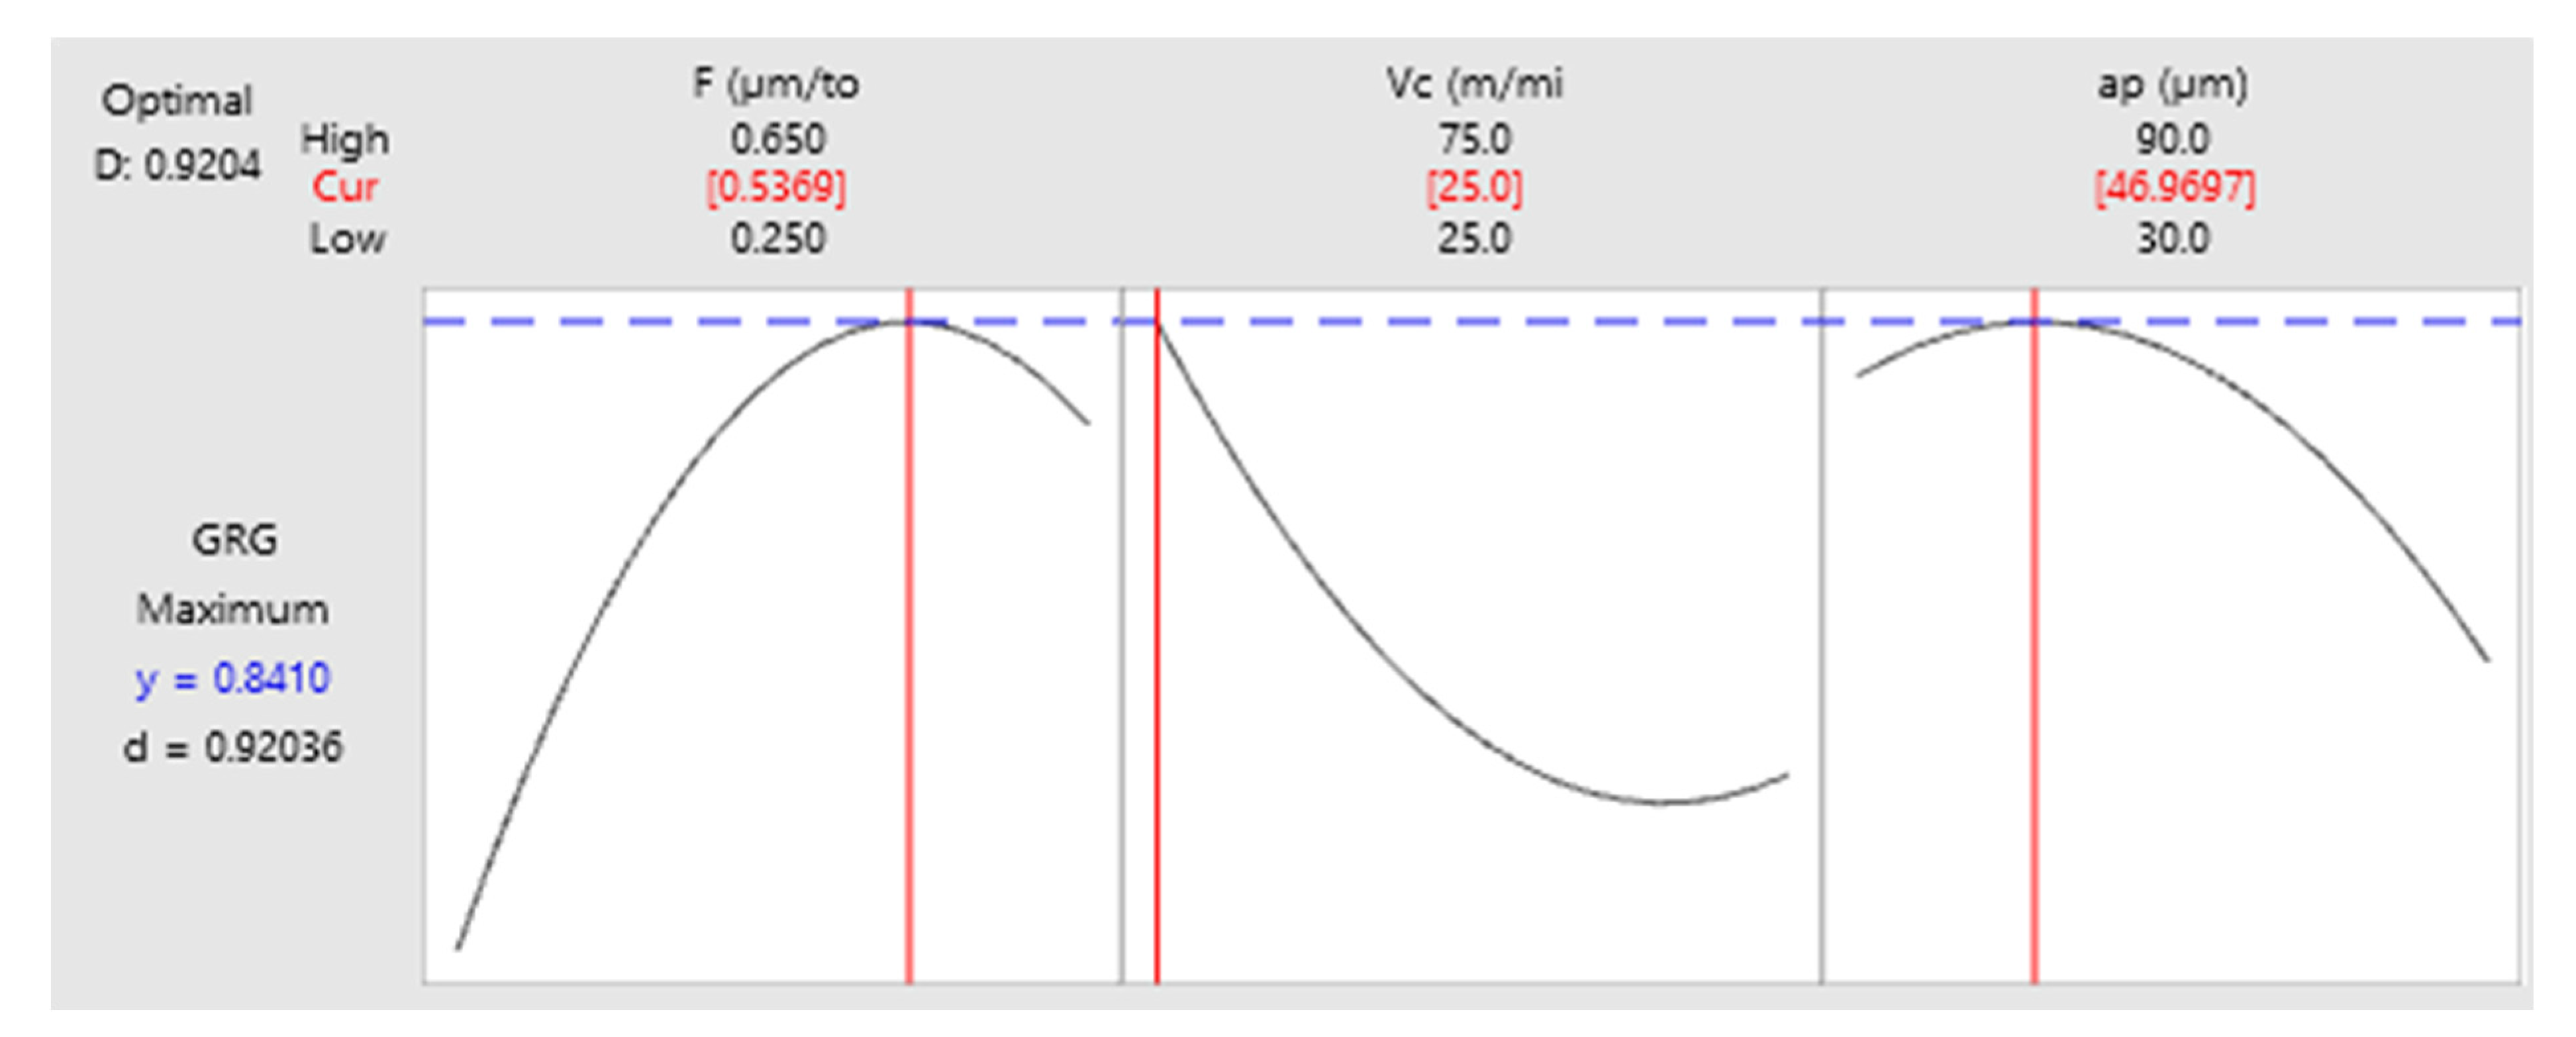
6.4. Optimization of Model

The aim of the current study is to optimize the process parameters for better surface quality, reduced burr size (width and length), and minimal tool wear in the micro-milling of grade 9. For this purpose, the RSM technique has been applied with the goal of minimizing surface roughness, burr width, burr length, and tool flank wear. Figure 10 shows the optimization plot for this study. It has been observed from the optimization plot that the optimization of GRG has been observed at moderate values of feed rates, lower cutting speed, and moderate value of depth of cut.

6.5. Validation Experiment

The final step was the verification test. The analysis’s optimized machining parameters were confirmed by performing validation tests. The values obtained from the experiments were compared with the best run condition (exp # 6) achieved in grey relational analysis. A comparison is presented in Table 9.
The comparison is tabulated in Table 9, and it is clear from the table that for an optimized run, two changes in the input cutting parameters have been noticed. In comparison to the values of these parameters that were originally planned (best run), the feed rate has increased while the depth of cut has decreased. Cutting speed is constant for the best and most optimized run. Results from the optimized run were superior to those from the best run. The main goal of this research was achieved because all process outcomes show a reduction at optimized parameters. Burr width has experienced the greatest reduction (36.25%), whereas burr length has experienced the second-largest reduction (18.4%), or almost half of the reduction observed in burr width. Optimized runs resulted in 16.11% and 14.60% less surface roughness and tool wear, respectively.

7. Conclusions

This research study aimed to enhance the productivity and efficiency of micro-milling of titanium grade 9 (Ti-3Al-2.5V). For this purpose, two multi-response optimizations, Grey Relational Analysis and Response Surface Methodology, techniques have been employed. A quadratic mathematical model has been developed to optimize the cutting parameters. Finally, a combination of cutting parameters was obtained, which resulted in improvements in all process output responses. Based on the work conducted in this research study the following conclusions can be drawn.
  • GRA and RSM have been successfully employed for the optimization of micro milling of grade 9 titanium alloy.
  • Optimal machining parameters obtained through grey relational analysis for titanium grade 9 are f = 0.45 µm/ tooth Vc = 25 m/ min and ap = 60 µm.
  • From the ANOVA table, it has been observed that the interaction between the cutting parameter conditions is equally important and influential in affecting the process outputs in micro-milling titanium grade 9. Feed rate and its interaction were found to be major influential factors among all the cutting parameters.
  • Multi-object optimization using the RSM technique showed that optimization of cutting parameters can be achieved at moderate values of feed rates and depth of cut, and lower values of cutting speed. The validation test’s results revealed that 36.25%, 18.41%, 16.11%, and 14.60% reduction can be achieved in Burr width, burr length, surface roughness, and tool flank wear by selecting optimized matching parameters.
  • The results of this study show improvement in different micro-milling process outputs. The improvement in surface finish will contribute to product quality enhancement. The reduction in tool wear will result in economic benefits in the micro-milling domain of titanium grade 9. A reduction in the burr size would result in a reduction in post-machining finishing processes.

8. Future Research

The current study paves the way for impactful future research. The economic and productivity advancements attained through this research can be extended to other superalloys, including nickel-based alloys. Further investigations should focus on characterizing surface hardness, residual stress, and microstructure. The results of this study have the potential to contribute significantly towards sustainable development goals, particularly those associated with enhancing overall manufacturing system productivity.

Author Contributions

Conceptualization, S.H.I.J.; Data curation, S.H.I.J., M.A.K. (Muhammad Ali Khan), M.I.F. and S.M.; Formal analysis, M.A.K. (Muhammad Ayyaz Khan), S.H.I.J., M.A.K. (Muhammad Ali Khan) and S.M.; Investigation, M.A.K. (Muhammad Ayyaz Khan) and M.I.F.; Methodology, M.A.K. (Muhammad Ayyaz Khan), M.A.K. (Muhammad Ali Khan) and M.I.F.; Resources, S.M.; Supervision, S.H.I.J.; Validation, M.A.K. (Muhammad Ali Khan); Writing—original draft, M.A.K. (Muhammad Ayyaz Khan); Writing—review and editing, M.I.F. All authors have read and agreed to the published version of the manuscript.

Funding

This work was supported by the Deanship of Scientific Research, Vice Presidency for Graduate Studies and Scientific Research, King Faisal University, Saudi Arabia [Grant No. 3798].

Data Availability Statement

Data of research are being used for further extended research and can be made available in due course of time.

Conflicts of Interest

The authors declare no conflict of interest.

References

  1. Kumar, A.; Grover, N.; Manna, A.; Kumar, R.; Chohan, J.S.; Singh, S.; Singh, S.; Pruncu, C.I. Multi-Objective Optimization of WEDM of Aluminum Hybrid Composites Using AHP and Genetic Algorithm. Arab J. Sci. Eng. 2022, 47, 8031–8043. [Google Scholar] [CrossRef]
  2. Lin, W.; Yu, D.; Zhang, C.; Zhang, S.; Tian, Y.; Liu, S.; Luo, M. Multi-objective optimization of machining parameters in multi-pass turning operations for low-carbon manufacturing. Proc. Inst. Mech. Eng. B J. Eng. Manuf. 2017, 231, 2372–2383. [Google Scholar] [CrossRef]
  3. Quan, Z.; Wang, Y.; Ji, Z. Multi-objective optimization scheduling for manufacturing process based on virtual workflow models. Appl. Soft. Comput. 2022, 122, 108786. [Google Scholar] [CrossRef]
  4. Golkarnarenji, G.; Naebe, M.; Badii, K.; Milani, A.S.; Jamali, A.; Bab-Hadiashar, A.; Jazar, R.N.; Khayyam, H. Multi-Objective Optimization of Manufacturing Process in Carbon Fiber Industry Using Artificial Intelligence Techniques. IEEE Access 2019, 7, 67576–67588. [Google Scholar] [CrossRef]
  5. O’Toole, L.; Kang, C.-W.; Fang, F.-Z. Precision micro-milling process: State of the art. Adv. Manuf. 2021, 9, 173–205. [Google Scholar] [CrossRef] [PubMed]
  6. Lu, X.; Zhang, H.; Jia, Z.; Feng, Y.; Liang, S.Y. Cutting parameters optimization for MRR under the constraints of surface roughness and cutter breakage in micro-milling process. J. Mech. Sci. Technol. 2018, 32, 3379–3388. [Google Scholar] [CrossRef]
  7. Lu, X.; Wang, F.; Xue, L.; Feng, Y.; Liang, S.Y. Investigation of material removal rate and surface roughness using multi-objective optimization for micro-milling of inconel 718. Ind. Lubr. Tribol. 2019, 71, 787–794. [Google Scholar] [CrossRef]
  8. Yang, J.; Zhang, Y.; Huang, Y.; Lv, J.; Wang, K. Multi-objective optimization of milling process: Exploring trade-off among energy consumption, time consumption and surface roughness. Int. J. Comput. Integr. Manuf. 2022, 36, 219–238. [Google Scholar] [CrossRef]
  9. Suresh, R.; Basavarajappa, S.; Gaitonde, V.N. Experimental studies on the performance of multilayer coated carbide tool in hard turning of high strength low alloy steel. J. Mater. Res. 2015, 30, 3056–3064. [Google Scholar] [CrossRef]
  10. Prajina, N.V. Multi Response Optimization of CNC End Milling Using Response Surface Methodology and Desirability Function. 2013. Available online: http://www.irphouse.com (accessed on 22 December 2022).
  11. Routara, B.C.; Bandyopadhyay, A.; Sahoo, P. Roughness modeling and optimization in CNC end milling using response surface method: Effect of workpiece material variation. Int. J. Adv. Manuf. Technol. 2009, 40, 1166–1180. [Google Scholar] [CrossRef]
  12. Ratnam, C.; Kumar, K.A.; Murthy, B.S.N.; Rao, K.V. An experimental study on boring of Inconel 718 and multi response optimization of machining parameters using Response Surface Methodology. Mater. Today Proc. 2018, 5, 27123–27129. [Google Scholar] [CrossRef]
  13. Avinash, S.; Balram, Y.; Babu, B.S.; Venkatramana, G. Multi-response optimization of pulse TIG welding process parameters of welds AISI 304 and Monel 400 using grey relational analysis. Mater. Today Proc. 2019, 19, 296–301. [Google Scholar] [CrossRef]
  14. Khan, M.A.; Jaffery, S.H.I.; Khan, M.; Alruqi, M. Machinability analysis of Ti-6Al-4V under cryogenic condition. J. Mater. Res. Technol. 2023, 25, 2204–2226. [Google Scholar] [CrossRef]
  15. Khan, M.A.; Jaffery, S.H.I.; Baqai, A.A.; Khan, M. Comparative analysis of tool wear progression of dry and cryogenic turning of titanium alloy Ti-6Al-4V under low, moderate and high tool wear conditions. Int. J. Adv. Manuf. Technol. 2022, 121, 1269–1287. [Google Scholar] [CrossRef]
  16. Zaidi, S.R.; Qadir, N.U.; Jaffery, S.H.I.; Khan, M.A.; Khan, M.; Petru, J. Statistical Analysis of Machining Parameters on Burr Formation, Surface Roughness and Energy Consumption during Milling of Aluminium Alloy Al 6061-T6. Materials 2022, 15, 8065. [Google Scholar] [CrossRef]
  17. Khan, M.A.; Jaffery, S.H.I.; Khan, M. Assessment of sustainability of machining Ti-6Al-4V under cryogenic condition using energy map approach. Eng. Sci. Technol. Int. J. 2023, 41, 101357. [Google Scholar] [CrossRef]
  18. Baig, A.; Jaffery, S.H.I.; Khan, M.A.; Alruqi, M. Statistical Analysis of Surface Roughness, Burr Formation and Tool Wear in High Speed Micro Milling of Inconel 600 Alloy under Cryogenic, Wet and Dry Conditions. Micromachines 2023, 14, 13. [Google Scholar] [CrossRef]
  19. Sheheryar, M.; Khan, M.A.; Jaffery, S.H.I.; Alruqi, M.; Khan, R.; Bashir, M.N.; Petru, J. Multi-Objective Optimization of Process Parameters during Micro-Milling of Nickel-Based Alloy Inconel 718 Using Taguchi-Grey Relation Integrated Approach. Materials 2022, 15, 8296. [Google Scholar] [CrossRef]
  20. Khan, M.A.; Jaffery, S.H.I.; Khan, M.; Younas, M.; Butt, S.I.; Ahmad, R.; Warsi, S. Statistical analysis of energy consumption, tool wear and surface roughness in machining of Titanium alloy (Ti-6Al-4V) under dry, wet and cryogenic conditions. Mech. Sci. 2019, 10, 561–573. [Google Scholar] [CrossRef]
  21. Khan, M.A.; Jaffery, S.H.I.; Khan, M.; Younas, M.; Butt, S.I.; Ahmad, R.; Warsi, S.S. Multi-objective optimization of turning titanium-based alloy Ti-6Al-4V under dry, wet, and cryogenic conditions using gray relational analysis (GRA). Int. J. Adv. Manuf. Technol. 2020, 106, 3897–3911. [Google Scholar] [CrossRef]
  22. Peng, Z.; Zhang, X.; Zhang, Y.; Liu, L.; Xu, G.; Wang, G.; Zhao, M. Wear resistance enhancement of Inconel 718 via high-speed ultrasonic vibration cutting and associated surface integrity evaluation under high-pressure coolant supply. Wear 2023, 530–531, 205027. [Google Scholar] [CrossRef]
  23. Peng, Z.; Zhang, X.; Liu, L.; Xu, G.; Wang, G.; Zhao, M. Effect of high-speed ultrasonic vibration cutting on the microstructure, surface integrity, and wear behavior of titanium alloy. J. Mater. Res. Technol. 2023, 24, 3870–3888. [Google Scholar] [CrossRef]
  24. Zhang, Y.; Yuan, S.; Yang, X.; Gao, W.; Zhang, M.; Peng, Z. Dry Hard Turning versus Grinding—The Influence of Machining-Induced Surface Integrity on Fatigue Performance. Coatings 2023, 13, 809. [Google Scholar] [CrossRef]
  25. Wang, G.; Sang, X.; Zhang, Y.; Zhao, M.; Xu, G.; Peng, Z. Carburization-induced microstructure evolution and hardening mechanism of 18CrNiMo7-6 steel. J. Mater. Res. Technol. 2023, 25, 1649–1661. [Google Scholar] [CrossRef]
  26. Mukkoti, V.V.; Sankaraiah, G.; Yohan, M. Effect of cryogenic treatment of tungsten carbide tools on cutting force and power consumption in CNC milling process. Prod. Manuf. Res. 2018, 6, 149–170. [Google Scholar] [CrossRef] [Green Version]
  27. Hashimura, M.; Hassamontr, J.; Dornfeld, D.A. Effect of In-Plane Exit Angle and Rake Angles on Burr Height and Thickness in Face Milling Operation. J. Manuf. Sci. Eng. 1999, 121, 13–19. [Google Scholar] [CrossRef]
  28. Ginting, A.; Nouari, M. Surface integrity of dry machined titanium alloys. Int. J. Mach. Tools Manuf. 2009, 49, 325–332. [Google Scholar] [CrossRef]
  29. Ulutan, D.; Ozel, T. Machining induced surface integrity in titanium and nickel alloys: A review. Int. J. Mach. Tools Manuf. 2011, 51, 250–280. [Google Scholar] [CrossRef]
  30. Warsi, S.S.; Agha, M.H.; Ahmad, R.; Jaffery, S.H.I.; Khan, M. Sustainable turning using multi-objective optimization: A study of Al 6061 T6 at high cutting speeds. Int. J. Adv. Manuf. Technol. 2019, 100, 843–855. [Google Scholar] [CrossRef]
  31. Rahman, M.A.; Ali, M.Y.; Khairuddin, A.S. Effects on Vibration and Surface Roughness in High Speed Micro End-Milling of Inconel 718 with Minimum Quantity Lubrication. IOP Conf. Ser. Mater. Sci. Eng. 2017, 184, 012037. [Google Scholar] [CrossRef]
  32. Jaffery, S.H.I.; Khan, M.; Ali, L.; Mativenga, P.T. Statistical analysis of process parameters in micromachining of Ti-6Al-4V alloy. Proc. Inst. Mech. Eng. B J. Eng. Manuf. 2016, 230, 1017–1034. [Google Scholar] [CrossRef]
  33. Niagra Cutter. Available online: https://www.niagaracutter.com/speedfeed?catalog=solidcarbide&category=speedfeed.html&cwd=/ (accessed on 21 June 2021).
  34. Țîțu, M.A.; Pop, A.B. Contribution on Taguchi’s Method Application on the Surface Roughness Analysis in End Milling Process on 7136 Aluminium Alloy. IOP Conf. Ser. Mater. Sci. Eng. 2016, 161, 012014. [Google Scholar] [CrossRef]
  35. Takács, M.; Verő, B. Actual Feed Rate per Tooth at Micro Milling. Mater. Sci. Forum 2007, 537–538, 695–700. [Google Scholar] [CrossRef]
  36. Wang, W.; Kweon, S.H.; Yang, S.H. A study on roughness of the micro-end-milled surface produced by a miniatured machine tool. J. Mater. Process. Technol. 2005, 162–163, 702–708. [Google Scholar] [CrossRef]
  37. Vázquez, E.; Rodríguez, C.A.; Elías-Zúñiga, A.; Ciurana, J. An experimental analysis of process parameters to manufacture metallic micro-channels by micro-milling. Int. J. Adv. Manuf. Technol. 2010, 51, 945–955. [Google Scholar] [CrossRef]
  38. Thakur, D.G.; Ramamoorthy, B.; Vijayaraghavan, L. Study on the machinability characteristics of superalloy Inconel 718 during high speed turning. Mater. Des. 2009, 30, 1718–1725. [Google Scholar] [CrossRef]
  39. Muhammad, A.; Gupta, M.K.; Mikołajczyk, T.; Pimenov, D.Y.; Giasin, K. Effect of Tool Coating and Cutting Parameters on Surface Roughness and Burr Formation during Micromilling of Inconel 718. Metals 2021, 11, 167. [Google Scholar] [CrossRef]
  40. Platt, T.; Meijer, A.; Biermann, D. Conduction-Based Thermally Assisted Micromilling Process for Cutting Difficult-to-Machine Materials. J. Manuf. Mater. Process. 2020, 4, 34. [Google Scholar] [CrossRef]
  41. Hou, J.; Zhou, W.; Duan, H.; Yang, G.; Xu, H.; Zhao, N. Influence of cutting speed on cutting force, flank temperature, and tool wear in end milling of Ti-6Al-4V alloy. Int. J. Adv. Manuf. Technol. 2014, 70, 1835–1845. [Google Scholar] [CrossRef]
  42. Arias, E.R.; Mecanico, I. Analysis of Surface Roughness for End Milling Operations. Master’s Thesis, Texas Tech University, Lubbock, TX, USA, May 1983. [Google Scholar]
  43. Chandiramani, K.L.; Cook, N.H. Investigations on the Nature of Surface Finish and Its Variation with Cutting Speed. J. Eng. Ind. 1964, 86, 134–140. [Google Scholar] [CrossRef]
  44. Gao, Q.; Gong, Y.; Zhou, Y.; Wen, X. Experimental study of micro-milling mechanism and surface quality of a nickel-based single crystal superalloy. J. Mech. Sci. Technol. 2017, 31, 171–180. [Google Scholar] [CrossRef]
  45. Lu, X.; Wang, F.; Wang, X.; Lu, Y.; Si, L. A surface roughness prediction model using response surface methodology in micro-milling Inconel 718. Int. J. Mach. Mach. Mater. 2017, 19, 230. [Google Scholar] [CrossRef]
  46. Lu, X.; Jia, Z.; Wang, H.; Feng, Y.; Liang, S.Y. The effect of cutting parameters on micro-hardness and the prediction of Vickers hardness based on a response surface methodology for micro-milling Inconel 718. Measurement 2019, 140, 56–62. [Google Scholar] [CrossRef]
  47. Peng, F.Y.; Dong, Q.; Yan, R.; Zhou, L.; Zhan, C. Analytical modeling and experimental validation of residual stress in micro-end-milling. Int. J. Adv. Manuf. Technol. 2016, 87, 3411–3424. [Google Scholar] [CrossRef]
  48. Xavier, J.F.; Ravi, B.; Jayabalakrishnan, D.; Ezilarasan, C.; Jayaseelan, V.; Elias, G. Experimental Study on Surface Roughness and Flank Wear in Turning of Nimonic C263 under Dry Cutting Conditions. J. Nanomater. 2021, 2021, 2054399. [Google Scholar] [CrossRef]
  49. Wang, M.-Y.; Chang, H.-Y. Experimental study of surface roughness in slot end milling AL2014-T6. Int. J. Mach. Tools Manuf. 2004, 44, 51–57. [Google Scholar] [CrossRef]
  50. Savković, B.; Kovač, P.; Stoić, A.; Dudić, B. Optimization of Machining Parameters Using the Taguchi and ANOVA Analysis in the Face Milling of Aluminum Alloys AL7075. Teh. Vjesn.-Tech. Gaz. 2020, 27, 1221–1228. [Google Scholar] [CrossRef]
  51. Fountas, N.; Krimpenis, A.; Vaxevanidis, N.M.; Davim, J.P. Single and Multi-objective Optimization Methodologies in CNC Machining. In Statistical and Computational Techniques in Manufacturing; Springer: Berlin/Heidelberg, Germany, 2012; pp. 187–218. [Google Scholar] [CrossRef]
  52. Rao, R.V. Modeling and Optimization of Machining Processes; Springer: London, UK, 2011; pp. 55–175. [Google Scholar] [CrossRef]
  53. Deng, J. Introduction to Grey System Theory. J. Grey Syst. 1989, 1, 1–24. [Google Scholar]
  54. Deng, L.; Cai, C.S. Bridge Model Updating Using Response Surface Method and Genetic Algorithm. J. Bridge Eng. 2010, 15, 553–564. [Google Scholar] [CrossRef]
  55. Myers, R.H.; Montgomery, D.C.; Anderson-Cook, C.M. Response Surface Methodology: Process and Product Optimization Using Designed Experiments, 4th ed.; John Wiley & Sons: New York, NY, USA, 2016. [Google Scholar]
  56. Gupta, M.K.; Sood, P.K.; Sharma, V.S. Machining Parameters Optimization of Titanium Alloy using Response Surface Methodology and Particle Swarm Optimization under Minimum-Quantity Lubrication Environment. Mater. Manuf. Process. 2016, 31, 1671–1682. [Google Scholar] [CrossRef]
Figure 1. Experiments being carried out on CNC machining center.
Metals 13 01373 g001
Figure 2. Response measurement (a) Burr width and length measurement (b) Tool flank wear measurement (c) Surface roughness measurement.
Metals 13 01373 g002aMetals 13 01373 g002b
Figure 3. Effect of feed on different outputs of process.
Metals 13 01373 g003
Figure 4. Scanning electron microscopy image of formed burrs (a) Max burr condition, (b) Min burr condition.
Metals 13 01373 g004aMetals 13 01373 g004b
Figure 5. Effect of cutting speed on different outputs of process.
Metals 13 01373 g005
Figure 6. Effect of depth of cut on different outputs of process.
Metals 13 01373 g006
Figure 7. Normal probability plot.
Metals 13 01373 g007
Figure 8. Contour plots: GRG vs. cutting parameters. (a) GRG vs. depth of cut and cutting speed (b) GRG vs. depth of cut and feed (c) GRG vs. cutting speed and feed.
Metals 13 01373 g008aMetals 13 01373 g008b
Figure 9. Surface plots: GRG vs. cutting parameters. (a) GRG vs. feed and cutting speed (b) GRG vs. feed and depth of cut.
Metals 13 01373 g009
Figure 10. Optimization plot.
Metals 13 01373 g010
Table 1. Cutting parameters level.
ParametersLevel
DescriptionSymbolUnitIIIIII
Feedfµm tooth−10.250.450.65
Cutting SpeedVcm min−1255075
Depth of Cutapµm306090
Table 2. L9 array of experiments and measured responses.
FactorsMeasured Responses
Exp. NoFeed
(µm/tooth)
Cutting Speed
(m/min)
Depth of Cut
(µm)
Surface Roughness Ra (nm)Burr Width (DM)Burr LengthTool Flank Wear
(µm)
fVcapDown Milling (µm)
Levels
1III38.885517.875526.12615.915
2IIIII46.330427.475462.33618.640
3IIIIIII42.675471.000375.78622.625
4IIIIIII38.290375.500386.13816.815
5IIIIII64.420169.095291.92015.710
6IIIII36.365390.185136.8898.700
7IIIIIIII72.585173.655260.81218.985
8IIIIIIII60.210349.500265.4889.325
9IIIII67.970200.000207.35813.010
Table 3. Best and worst conditions for parameters.
Input ParametersResponses
Surface RoughnessBurr WidthBurr LengthTool Flank Wear
BestWorstBestWorstBestWorstBestWorst
Feed (µm/tooth)0.250.650.650.250.650.250.650.25
Cutting Speed (m/min)2575752525452575
Depth of Cut (µm)9030309060903090
Table 4. Normalized data.
Exp. No.Normalized Data
Surface Roughness
Ra (nm)
Burr WidthBurr LengthTool Flank Wear
(µm)
Down Milling (µm)
10.9300.0000.0000.482
20.7250.2590.1640.286
30.8260.1340.3860.000
40.9470.4080.3600.417
50.2251.0000.6020.497
61.0000.3661.0001.000
70.0000.9870.6820.261
80.3420.4830.6700.955
90.1270.9110.8190.690
Table 5. Deviation sequence and GRC.
Exp. NoDeviation SequenceGray Relational Coefficient (GRC)
Surface Roughness
Ra (nm)
Burr WidthBurr LengthTool Flank Wear
(µm)
Surface Roughness
Ra (nm)
Burr WidthBurr LengthTool Flank Wear
(µm)
Down Milling (µm)Down Milling (µm)
10.0701.0001.0000.5180.8780.3330.3330.491
20.2750.7410.8360.7140.6450.4030.3740.412
30.1740.8660.6141.0000.7420.3660.4490.333
40.0530.5920.6400.5830.9040.4580.4380.462
50.7750.0000.3980.5030.3921.0000.5570.498
60.0000.6340.0000.0001.0000.4411.0001.000
71.0000.0130.3180.7390.3330.9750.6110.404
80.6580.5170.3300.0450.4320.4920.6020.918
90.8730.0890.1810.3100.3640.8490.7340.618
Table 6. GRG and rank.
Exp. NoGray Relational Grade: GRank
10.5097
20.4599
30.4738
40.5666
50.6123
60.8601
70.5815
80.6114
90.6412
Table 7. Response table.
ParametersLevelsRank
IIIIII
f 0.4800.6790.6111 (0.199)
Vc0.6700.5450.5552 (0.125)
ap0.5870.6330.5503 (0.084)
Table 8. ANOVA table.
Source of VariationDFSeq SSContribution RatioAdj SSAdj MSF-Valuep-Value
Model80.17454194.40%0.1745410.02181818.970.000
Linear30.07576440.98%0.0985260.03284228.550.000
f (µm/tooth)10.04452524.08%0.0445250.04452538.710.000
Vc (m/min)10.02703114.62%0.0414260.04142636.020.000
ap (µm)10.0042092.28%0.0033290.0033292.890.123
Square30.07533940.75%0.0876730.02922425.410.000
f 210.05633730.47%0.0563370.05633748.980.000
Vc210.0050502.73%0.0151920.01519213.210.005
ap210.0139527.55%0.0122450.01224510.650.010
2-Way Interaction20.02343812.68%0.0234380.01171910.190.005
f × Vc10.0082034.44%0.0002800.0002800.240.634
f × ap10.0152358.24%0.0152350.01523513.250.005
Error90.0103525.60%0.0103520.001150
Total170.184893100.00%
Table 9. Validation experiments.
Process ParametersProcess Output/Responses
fVcapRaBurr WidthBurr LengthTool Flank Wear
Best run0.45256036.36390.19136.888.7
Optimized run0.532546.9630.50248.73111.687.43
% Reduction 16.1136.2518.4114.60
Disclaimer/Publisher’s Note: The statements, opinions and data contained in all publications are solely those of the individual author(s) and contributor(s) and not of MDPI and/or the editor(s). MDPI and/or the editor(s) disclaim responsibility for any injury to people or property resulting from any ideas, methods, instructions or products referred to in the content.

