Article

The Optimization of Welding Spots’ Arrangement in A-Pillar Patchwork Blank Hot Stamping

Key Laboratory of Automobile Materials, Ministry of Education, School of Material Science and Engineering, Jilin University, 5988 Renmin Street, Changchun 130022, China
*
Author to whom correspondence should be addressed.
Metals 2023, 13(8), 1409; https://doi.org/10.3390/met13081409
Submission received: 26 June 2023 / Revised: 30 July 2023 / Accepted: 4 August 2023 / Published: 6 August 2023
(This article belongs to the Special Issue Hot Stamping Processing of Steel and Alloys)

Abstract

:
With increasingly severe environmental problems, energy saving and environmental protection have become two important issues to be solved in the automobile industry. Patchwork blank hot-stamping technology can be used to obtain light-weight and high-strength parts and is thus increasingly used in the manufacture of autobody parts. Because the main blank and the patched blank need to be connected through spot welding before forming, the welding spots’ arrangement has a great influence on the formability of the part. In this study, a thermal–mechanical coupling finite element analysis model of A-pillar patchwork blanks was established. With the thickness of the patched blank, the distance between the welding spot and the external contour of the patched blank, and the number of welding spots as optimization variables, together with the maximum thinning rate and the maximum welding spot force as objectives, the influence of welding spot arrangement on forming quality was analyzed, and the welding spots’ arrangement was optimized using a central composite design (CCD), the response surface method (RSM), and the genetic algorithm (GA). The results showed that when the initial welding spot was located close to the contour of the patched blank, the bending moment was greater when the weld spot passed through the die corner, leading to the rupture of the welding spot or its surrounding base material due to the greater thinning rate. When the patched blank was thicker than the main blank, the main blank cracked during the forming process due to a greater increase in the thinning rate. The optimal solution of the weld spot arrangement on the A-pillar patchwork blanks was a 1.2 mm thick main blank, 0.8 mm thick patched blank, a distance of 29 mm between the weld spot and the contour line of the patched blank, and 16 weld spots. Hot-stamping experiments were conducted using the optimized weld spots’ arrangement, and high-quality parts were obtained.

1. Introduction

In order to meet strict environmental requirements, achieve fuel economy, and reduce vehicle exhaust pollution, the application of lightweight materials in automobile bodies is becoming increasingly widespread. Among these materials, 22MnB5 boron steel, with the advantages of a high strength, low cost, and good cost performance, is gradually becoming favored [1,2,3,4]. Hot stamping has gradually replaced cold stamping, which can reduce effects such as springback and wrinkling during the stamping process and is also beneficial for extending the service life of the die. The hot-stamping forming process involves heating boron steel until it is fully austenitized and then quickly closing the dies for forming and quenching to obtain high-strength parts with tensile strengths of over 1500 MPa [5,6,7]. In recent years, in order to improve the safety of collision, it has become necessary to design customized parts with partition strength and toughness in the case of some boron steel structural parts. Hot-stamping patchwork blank technology is a new method used to produce customized parts, which has the advantages of a good applicability and low cost and is more and more widely used in the manufacture of customized parts. At present, the main welding methods for patchwork blanks’ hot stamping are resistance spot welding, laser welding, and arc welding [8,9,10]. Considering the cost and efficiency of automobile production, resistance spot welding is a common connection method. Patchwork blank hot stamping is first used to connect the main blank and patched blank together via spot welding, and then the connected the main blank and patched blank are heated and hot-stamped together. Then, the patchwork parts with a given partition strength and toughness are obtained. The patchwork blank hot-stamping forming technology can be used to obtain different thickness and shapes of the main blank and patchwork blank. Compared with a continuously variable cross-section blank, the patchwork blanks can be more flexible, allowing one to adjust the mechanical properties of parts. Since the main blank and the patchwork blank are connected before hot-stamping forming, the number of required dies can be reduced. This method has been widely used in automobile A-pillar, B-pillar, and front reinforcement beams, among others [11,12,13]. Its advantages are a good collision safety, high bending load, local reinforcement, and good lightweight effects. Klaus et al. [14] used numerical simulation methods for the hydroforming patchwork blanks and carried out an experimental verification, providing a suitable model for the numerical simulation of patchwork blanks’ forming process. Gao et al. [15] studied the influences of spot welding parameters on the connection performance of hot-stamped patchwork blanks and successfully produced a B-pillar reinforcement. Wang et al. [16] conducted an effective experimental study and finite element analysis of patchwork blanks, verified the accuracy of the patchwork blank hot-forming finite element model, and outlined the principle of the welding spots’ arrangement. However, the material near the welding spot can easily become thin and crack during the hot-stamping process, which affects not only the forming quality but also the stability of the production process [17,18,19]. At present, there are still two problems that need to be solved for the hot stamping of patchwork blanks. First, the quality of the spot-welding connection should be controlled before hot stamping to ensure that the welding spot is not deformed or cracked after the hot stamping. Second, due to the difference in thickness between the main blank and the patched blank area and the existence of welding spots, the forming ability will be reduced to a certain extent compared with the uniform thickness sheet. If the welding spots are not properly arranged, an uneven material flow will easily occur during the hot-stamping process, thus increasing the possibility of wrinkling and cracking in the hot-stamping process of patchwork blanks [20,21].
In this study, a finite element method was used to simulate and analyze the hot stamping forming process of A-pillar patchwork blanks. The influences of the number of welding spots, the thickness of the patched blank, and the distance between the welding spot and the external contour of the patched blank on the thinning rate and welding spot force were studied using a central composite design (CCD), the response surface method (RSM), and the genetic algorithm (GA) multi-objective optimization method to obtain the optimal welding spot arrangement. Based on this, hot-stamping experiments of the A-pillar patchwork blanks were conducted to verify the optimization results.

2. Establishment of Finite Element Model for A-Pillar Patchwork Blanks

The material of A-pillar patchwork blanks is 22MnB5 steel. Its chemical composition is shown in Table 1, and its physical and thermal parameters at different temperatures are shown in Table 2 [22,23,24,25].
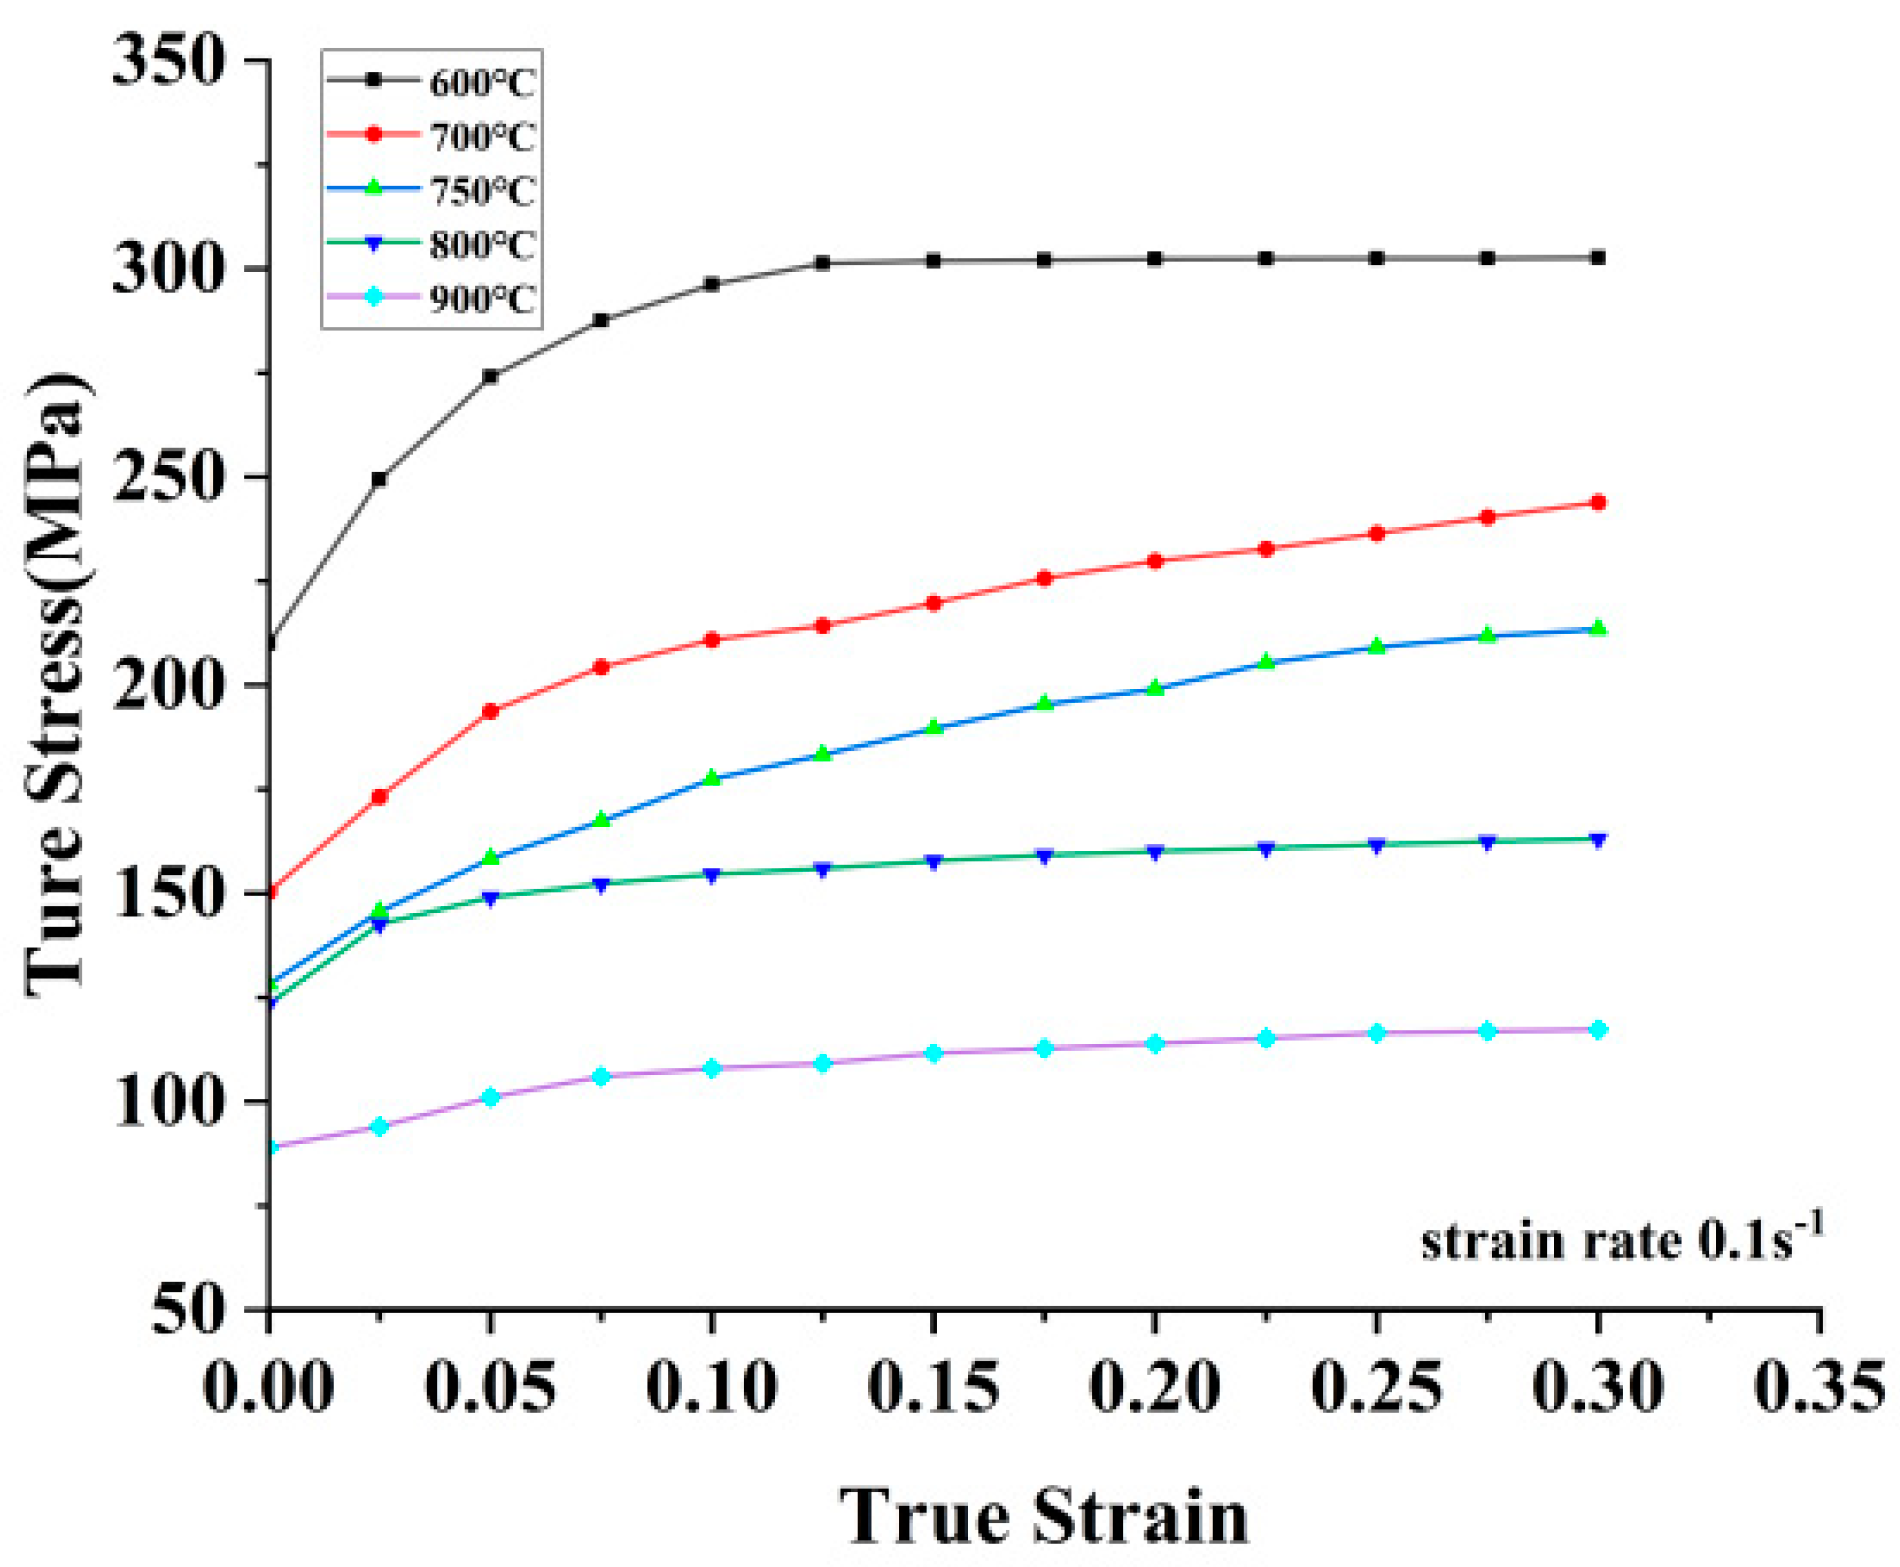
The thicknesses of the main blank and the patched blank are 1.2 mm and 1.5 mm, respectively, and the overall dimensions of the part are 692 mm × 380 mm × 115 mm, as shown in Figure 1. Uniaxial tensile tests of the 22MnB5 at different temperatures and strain rates were carried out using a Gleeble 1500 testing machine to obtain the stress–strain curves at different temperatures [26,27].The stress–strain curves of the material at different temperatures are shown in Figure 2. With the increase in temperature, the rheological stress of the material decreases.
The dies’ arrangement for the hot stamping of the A-pillar patchwork blanks is shown in Figure 3. The friction coefficient was set to 0.45, and the heating temperature of the blank was 930 °C so as to render it completely austenitized [28,29]. The transfer time was 8 s, the tool temperature was 70 °C, and the stamping stroke was 200 mm. The waiting time of the blank in the die before the punch touched the blank was set to 2 s. The quenching time was 7 s, and the holding force was 5000 kN during quenching.
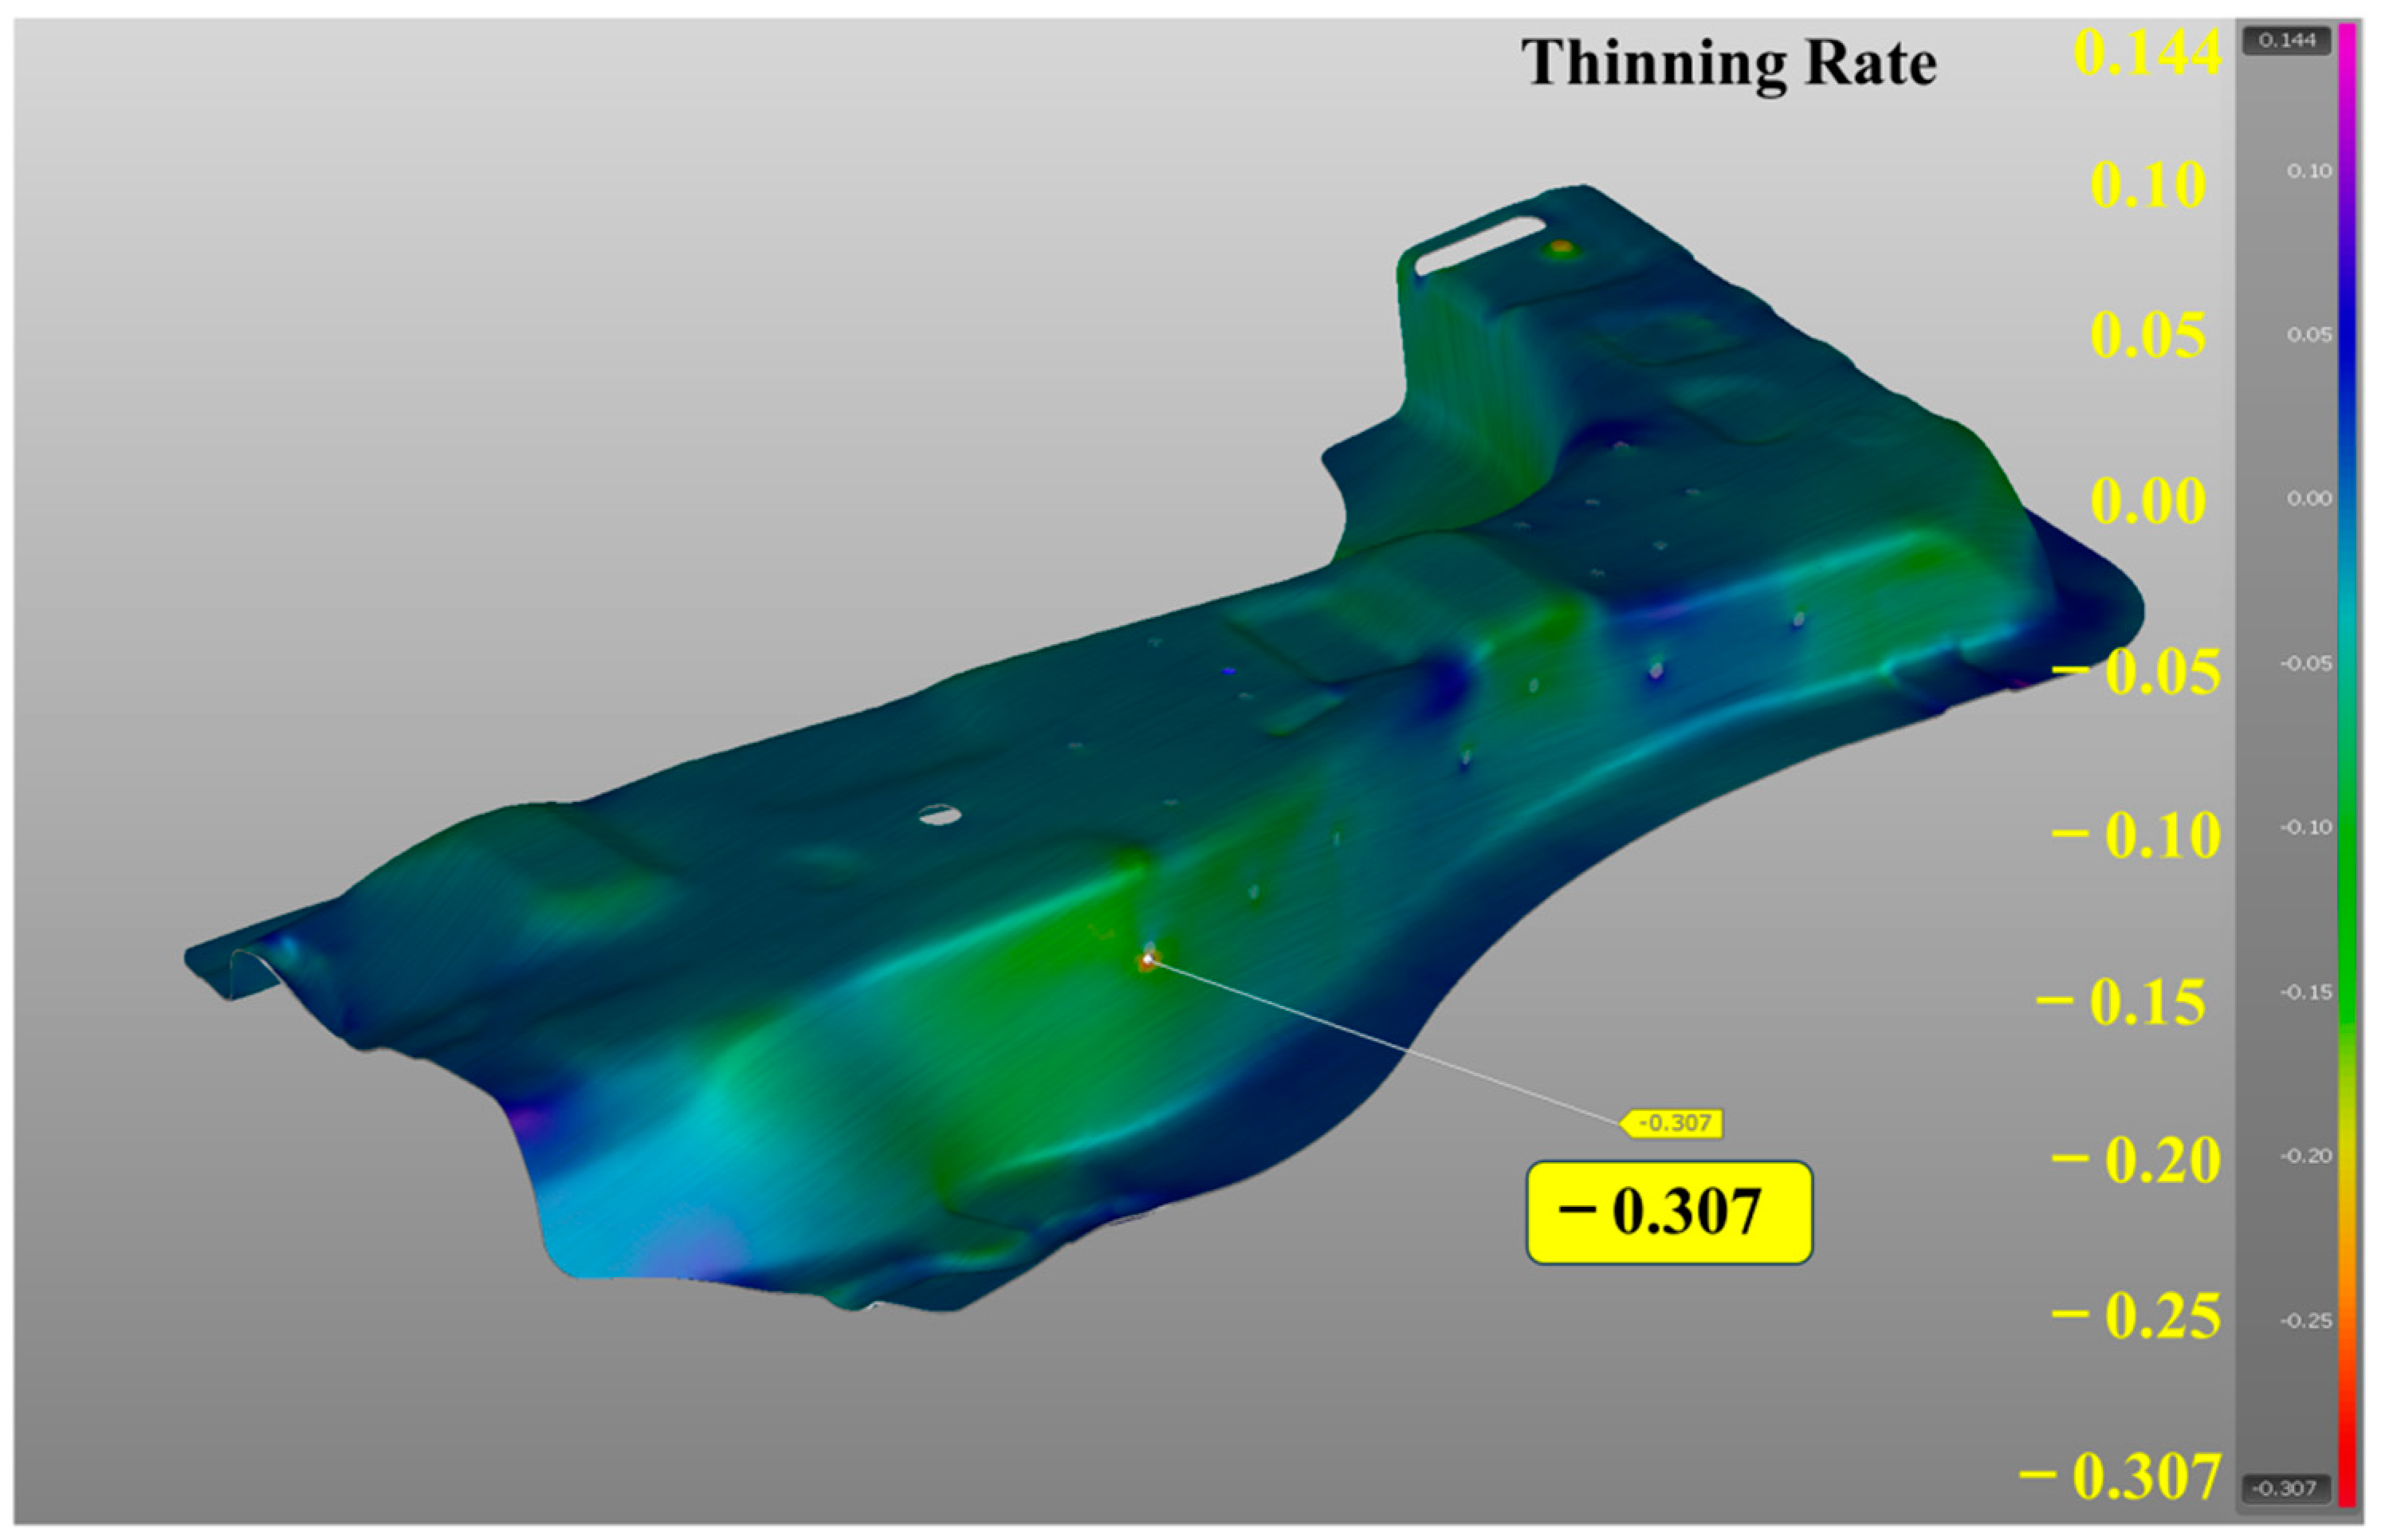
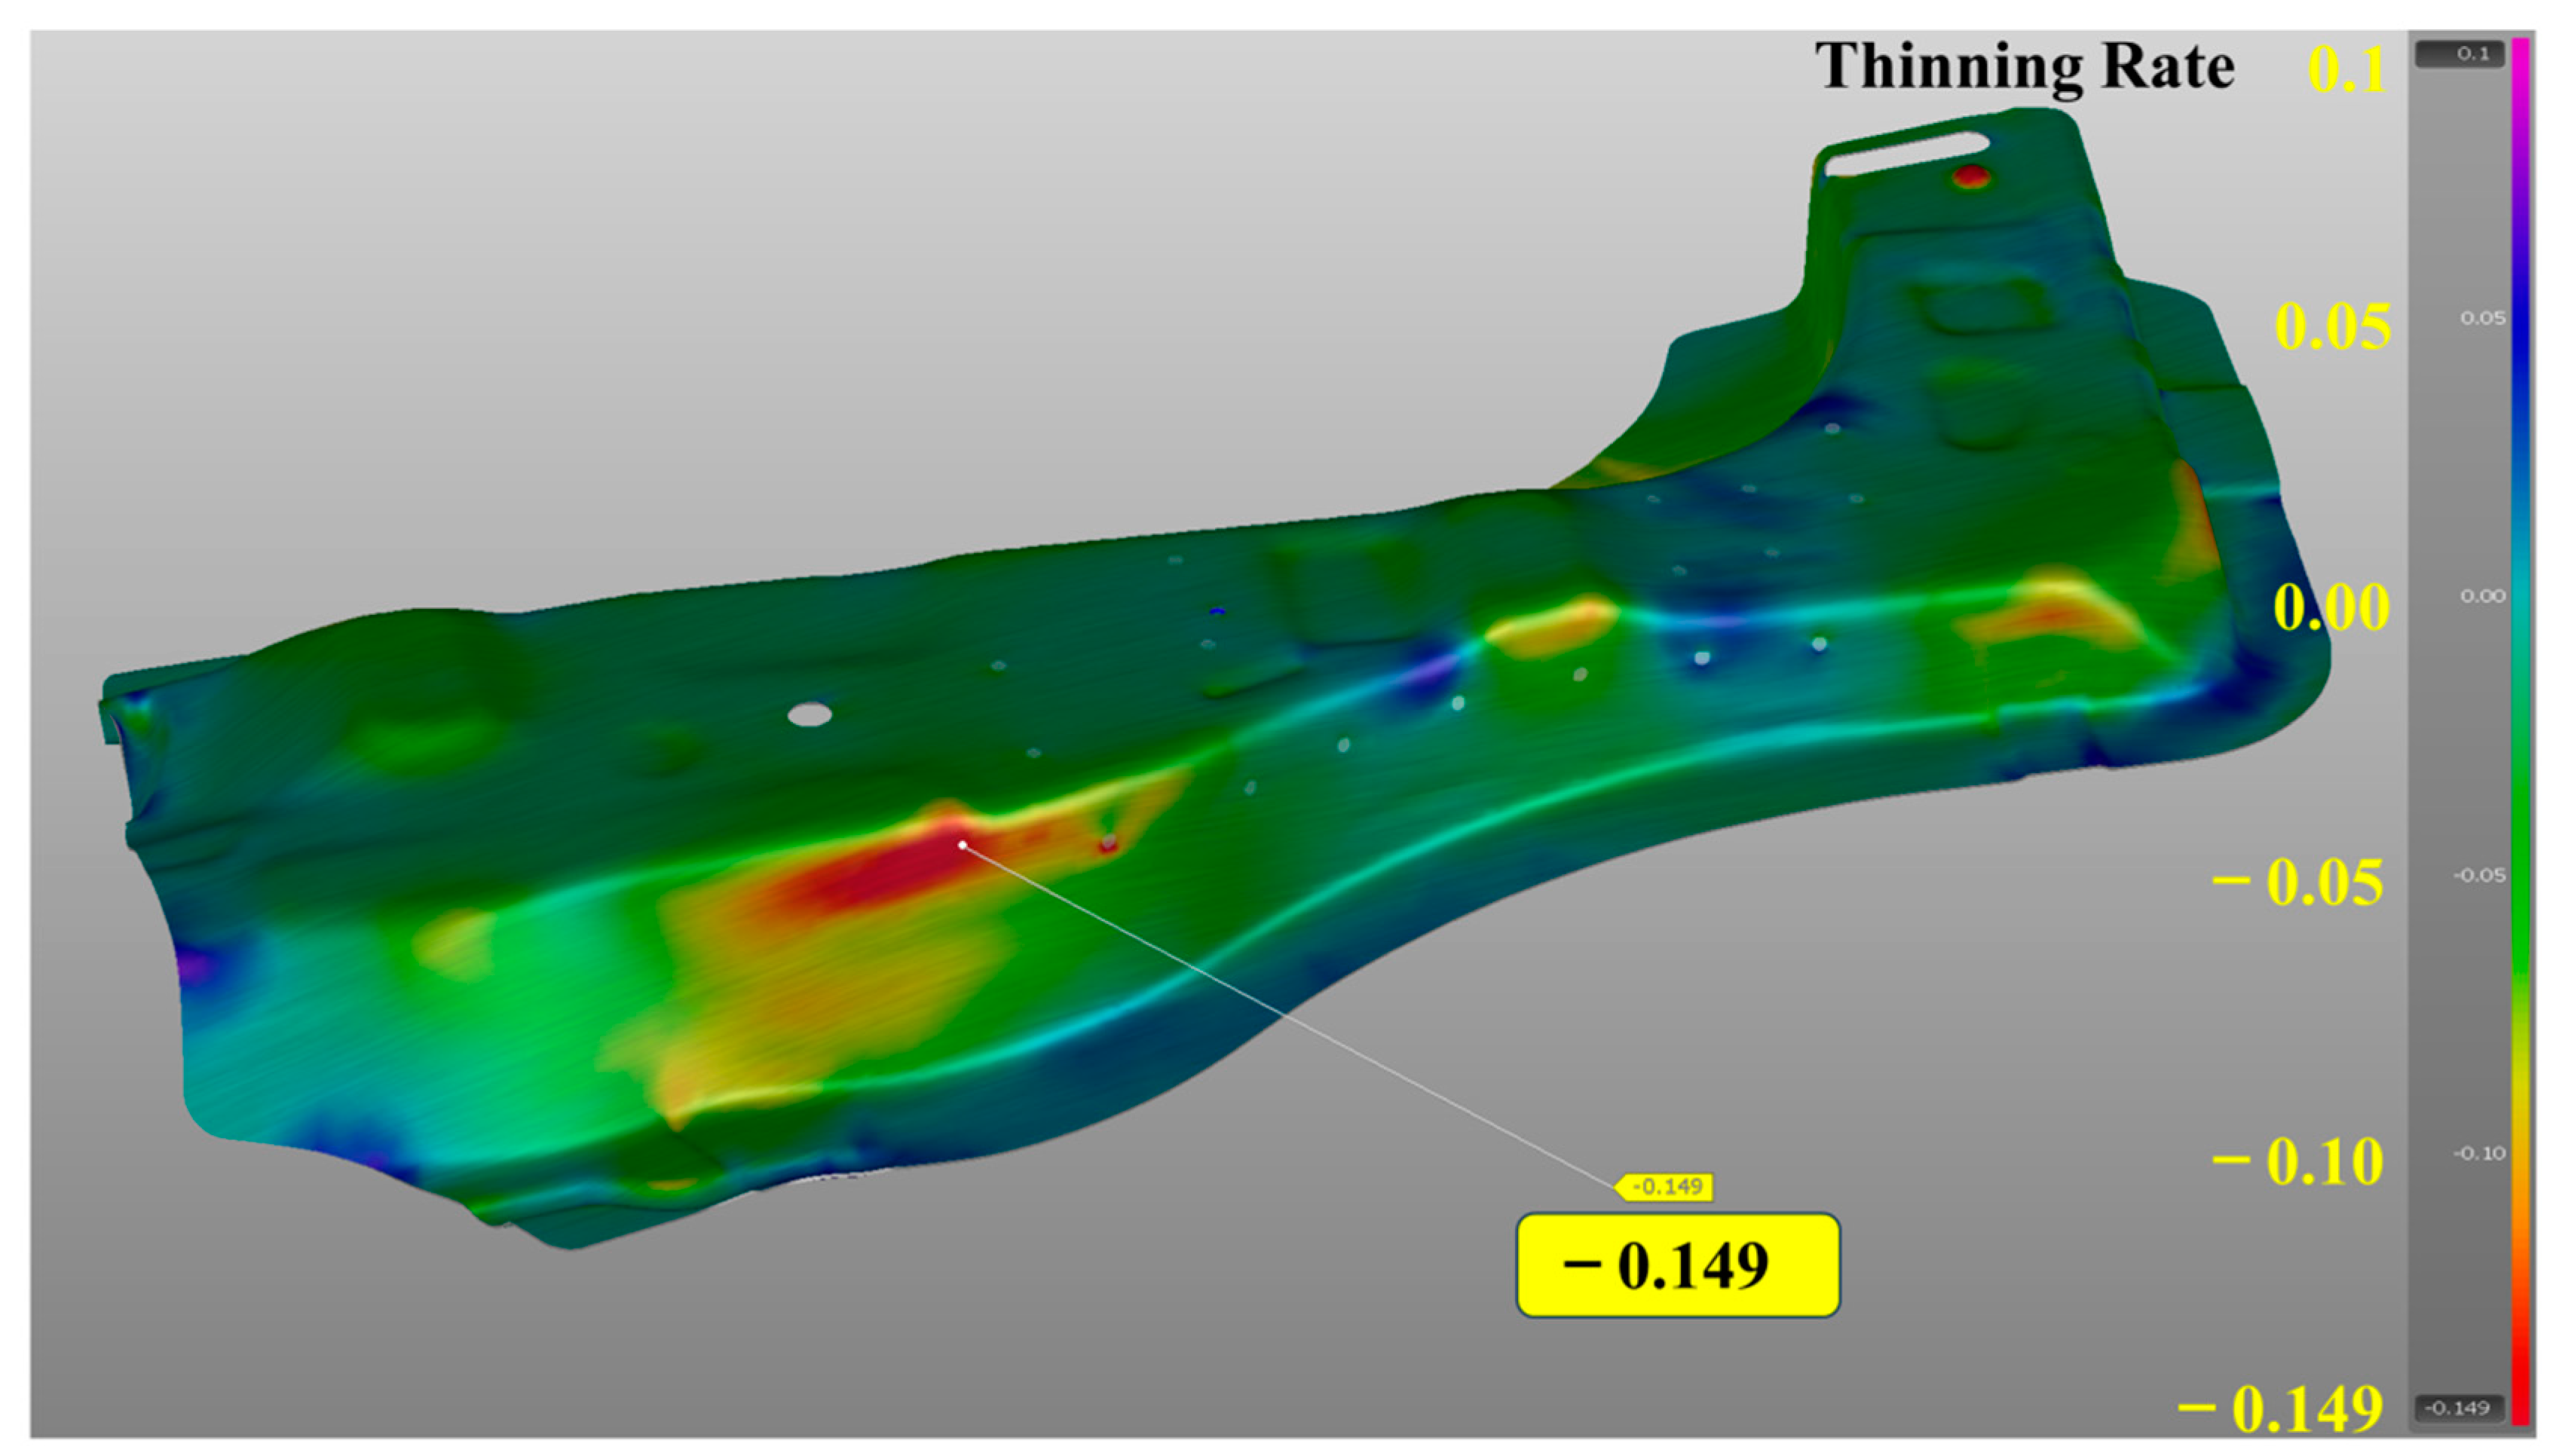
Figure 4 shows the simulation results without the optimization of the welding spots’ arrangement. In hot-stamping analysis, it is generally required that the maximum thinning rate of the material is no more than 17%; otherwise, the material is considered to be cracked. It can be seen that the thinning rate of the main blank around the welding spots on the sidewall is 30.7%, far exceeding the requirement of 17%. To reduce the excessive rate of thinning around the welding spots, the central composite design, response surface methods, and genetic algorithm multi-objective optimization method were used to optimize the formability of the A-pillar patchwork blanks, and the optimization process is shown in Figure 5.

3. Response Surface Method Hot Stamping of A-Pillar Patchwork Blanks

The central composite design is the most commonly used response surface design for experiments, composed of a factor design or partial factor design with a central point and enhanced by a group of axis points (or star points). By adding center points and axis points to the previously run factor design, this method has the advantages of covering a wide design space and obtaining accurate high-order information. During the hot-stamping process of the patchwork blanks, the area between the welding spot and the external contour of the patched blank is prone to an excessive thinning rate, which leads to the crack of the base material around the weld spots. At the same time, the number of welding spots is also an important factor affecting the forming performance of the patchwork blanks. Exploring the number of welding spots required for the motherboard with different thickness combinations is also of great significance for optimizing the structure of the patch plate and improving the forming performance. In addition, the stress on welding spots during hot stamping is also an important index with which to evaluate the formability of patchwork blanks, which has an important influence on the performance of patchwork blanks. Hence, the thickness of the patched blank X1, the distance between the welding spots and the contour of the patched blank X2, and the number of welding spots X3 were selected as optimization variables, and the maximum thinning rate and the maximum tensile shear force on the welding spots during the forming process were studied as objective functions. The thickness of the main blank was 1.2 mm, and the patched blank thickness was in the range of 0.8–1.6 mm. If the distance between the welding spots and the contour of the patched blank is too small, the main blank is prone to cracking. The distance between the welding spots and the contour line of the patched blank was selected to be in the range of 12–40 mm. Because the welding spots on the bottom of the forming part have little influence on the forming quality, only the welding spots on the side wall after forming were optimized. The number of sidewall welding spots ranged from 4 to 20. The values of the design variables X1, X2, and X3 are shown in Table 3. Based on the central composite design principle, a total of 20 groups of tests were conducted, and the experimental scheme and results are shown in Table 4.
The response surface models for the maximum thinning rate Y1 and maximum weld spot force Y2 based on the results in Table 4 are shown in Equations (1) and (2):
Y 1 = 14.97148 + 43.76238 x 1 1.02883 x 2 1.146551 x 3 0.238839 x 1 x 2 0.019531 x 1 x 3 0.012388 x 2 x 3 13.46591 x 1 2 + 0.021150 x 2 2 + 0.051491 x 3 2
Y 2 = 2582.89549 + 688.57224 x 1 17.35005 x 2 77.89261 x 3 7.76786 x 1 x 2 + 9.14062 x 1 x 3 + 0.09375 x 2 x 3 150.85227 x 1 2 + 0.0376855 x 2 2 + 2.10724 x 3 2
The variance analysis of the maximum thinning rate Y1 and the maximum weld spot force Y2 are shown in Table 5 and Table 6. The magnitude of the F-value reflects the degree of the interactive effect, while the p-value reflects the degree of significance (usually, for models, p < 0.01 indicates highly significant, and p < 0.005 indicates significant). A larger F-value and smaller p-value can reflect the significance of the correlation coefficient. The model p-values of the response surfaces for both the maximum thinning rate and the weld spot force are less than 0.005, indicating that the model is significant. This shows that the fitting accuracy is good, and the response surface approximation model can be used for subsequent optimization design. It can be seen from Table 5 that the F-values of the linear terms X1, X2, X3 and the quadratic terms X 1 2 ,   X 2 2 ,   X 3 2 are less than 0.005, indicating that the effect on the thinning rate of the patch board is extremely significant, and the other factors are not significant. From Table 6, it can be seen that the F-value of the first terms X1, X2, and X3 and the second term X 3 2 is <0.005, indicating that the influence on the solder joint force of the patch plate is extremely significant, and the other factors are not significant. According to the F-value, it can be concluded that the factors affecting the maximum thinning rate, from strong to weak, are the distance between the welding spot and the contour of the patched blank X2, the number of weld spots X3, and the thickness of the patched blank X1, while the factors affecting the weld spot force, from strong to weak, are the number of weld spots X3, the thickness of the patched blank X1, and the distance between the welding spot and the contour of the patched blank X2.
To ensure the validity of the response surface model, the fitting accuracy was verified using the sample correlation coefficient R2 and the revised correlation coefficient Radj2. When the values of R2 and Radj2 are close to 1, this indicates that the smaller the relative error is, the higher the model fitting accuracy is. The results of the accuracy analysis of the maximum thinning rate and weld spot force response surface models are shown in Table 7, with correlation coefficients R2 of 0.9660 and 0.9354 and revised correlation coefficients Radj2 of 0.9558 and 0.9159, respectively, which indicate that the constructed second-order response surface models have a good fitting accuracy and can be used for subsequent optimization.
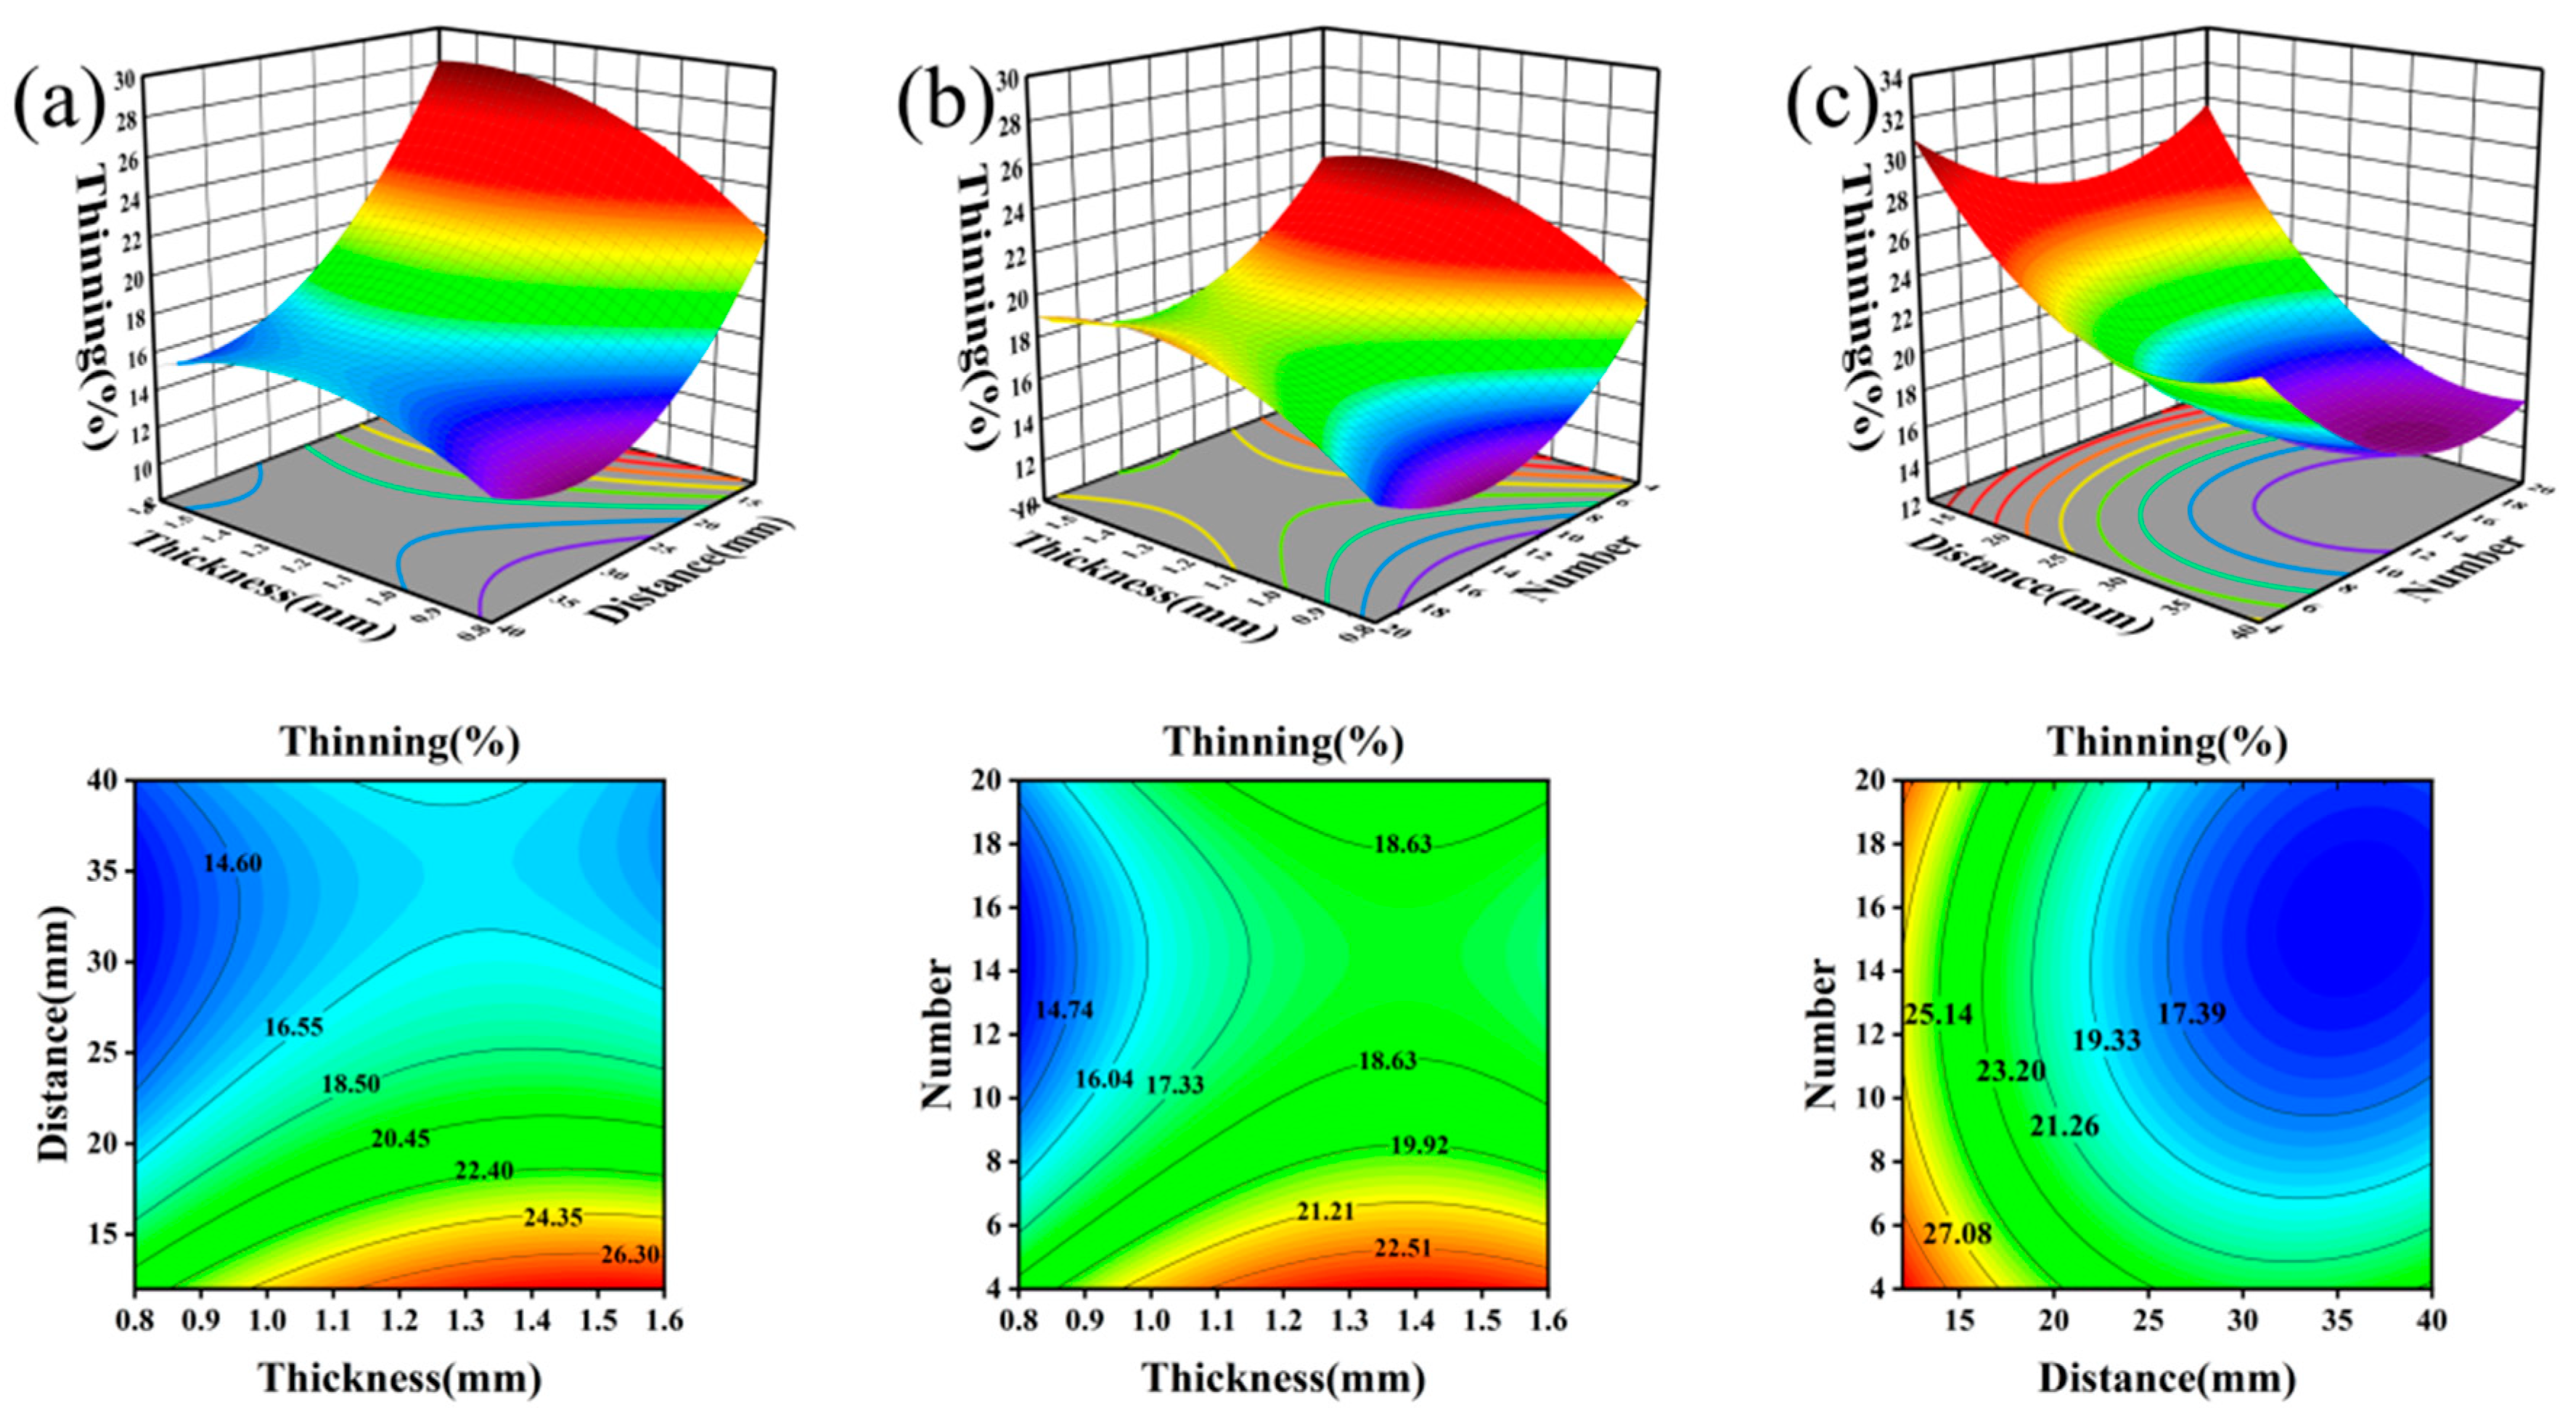
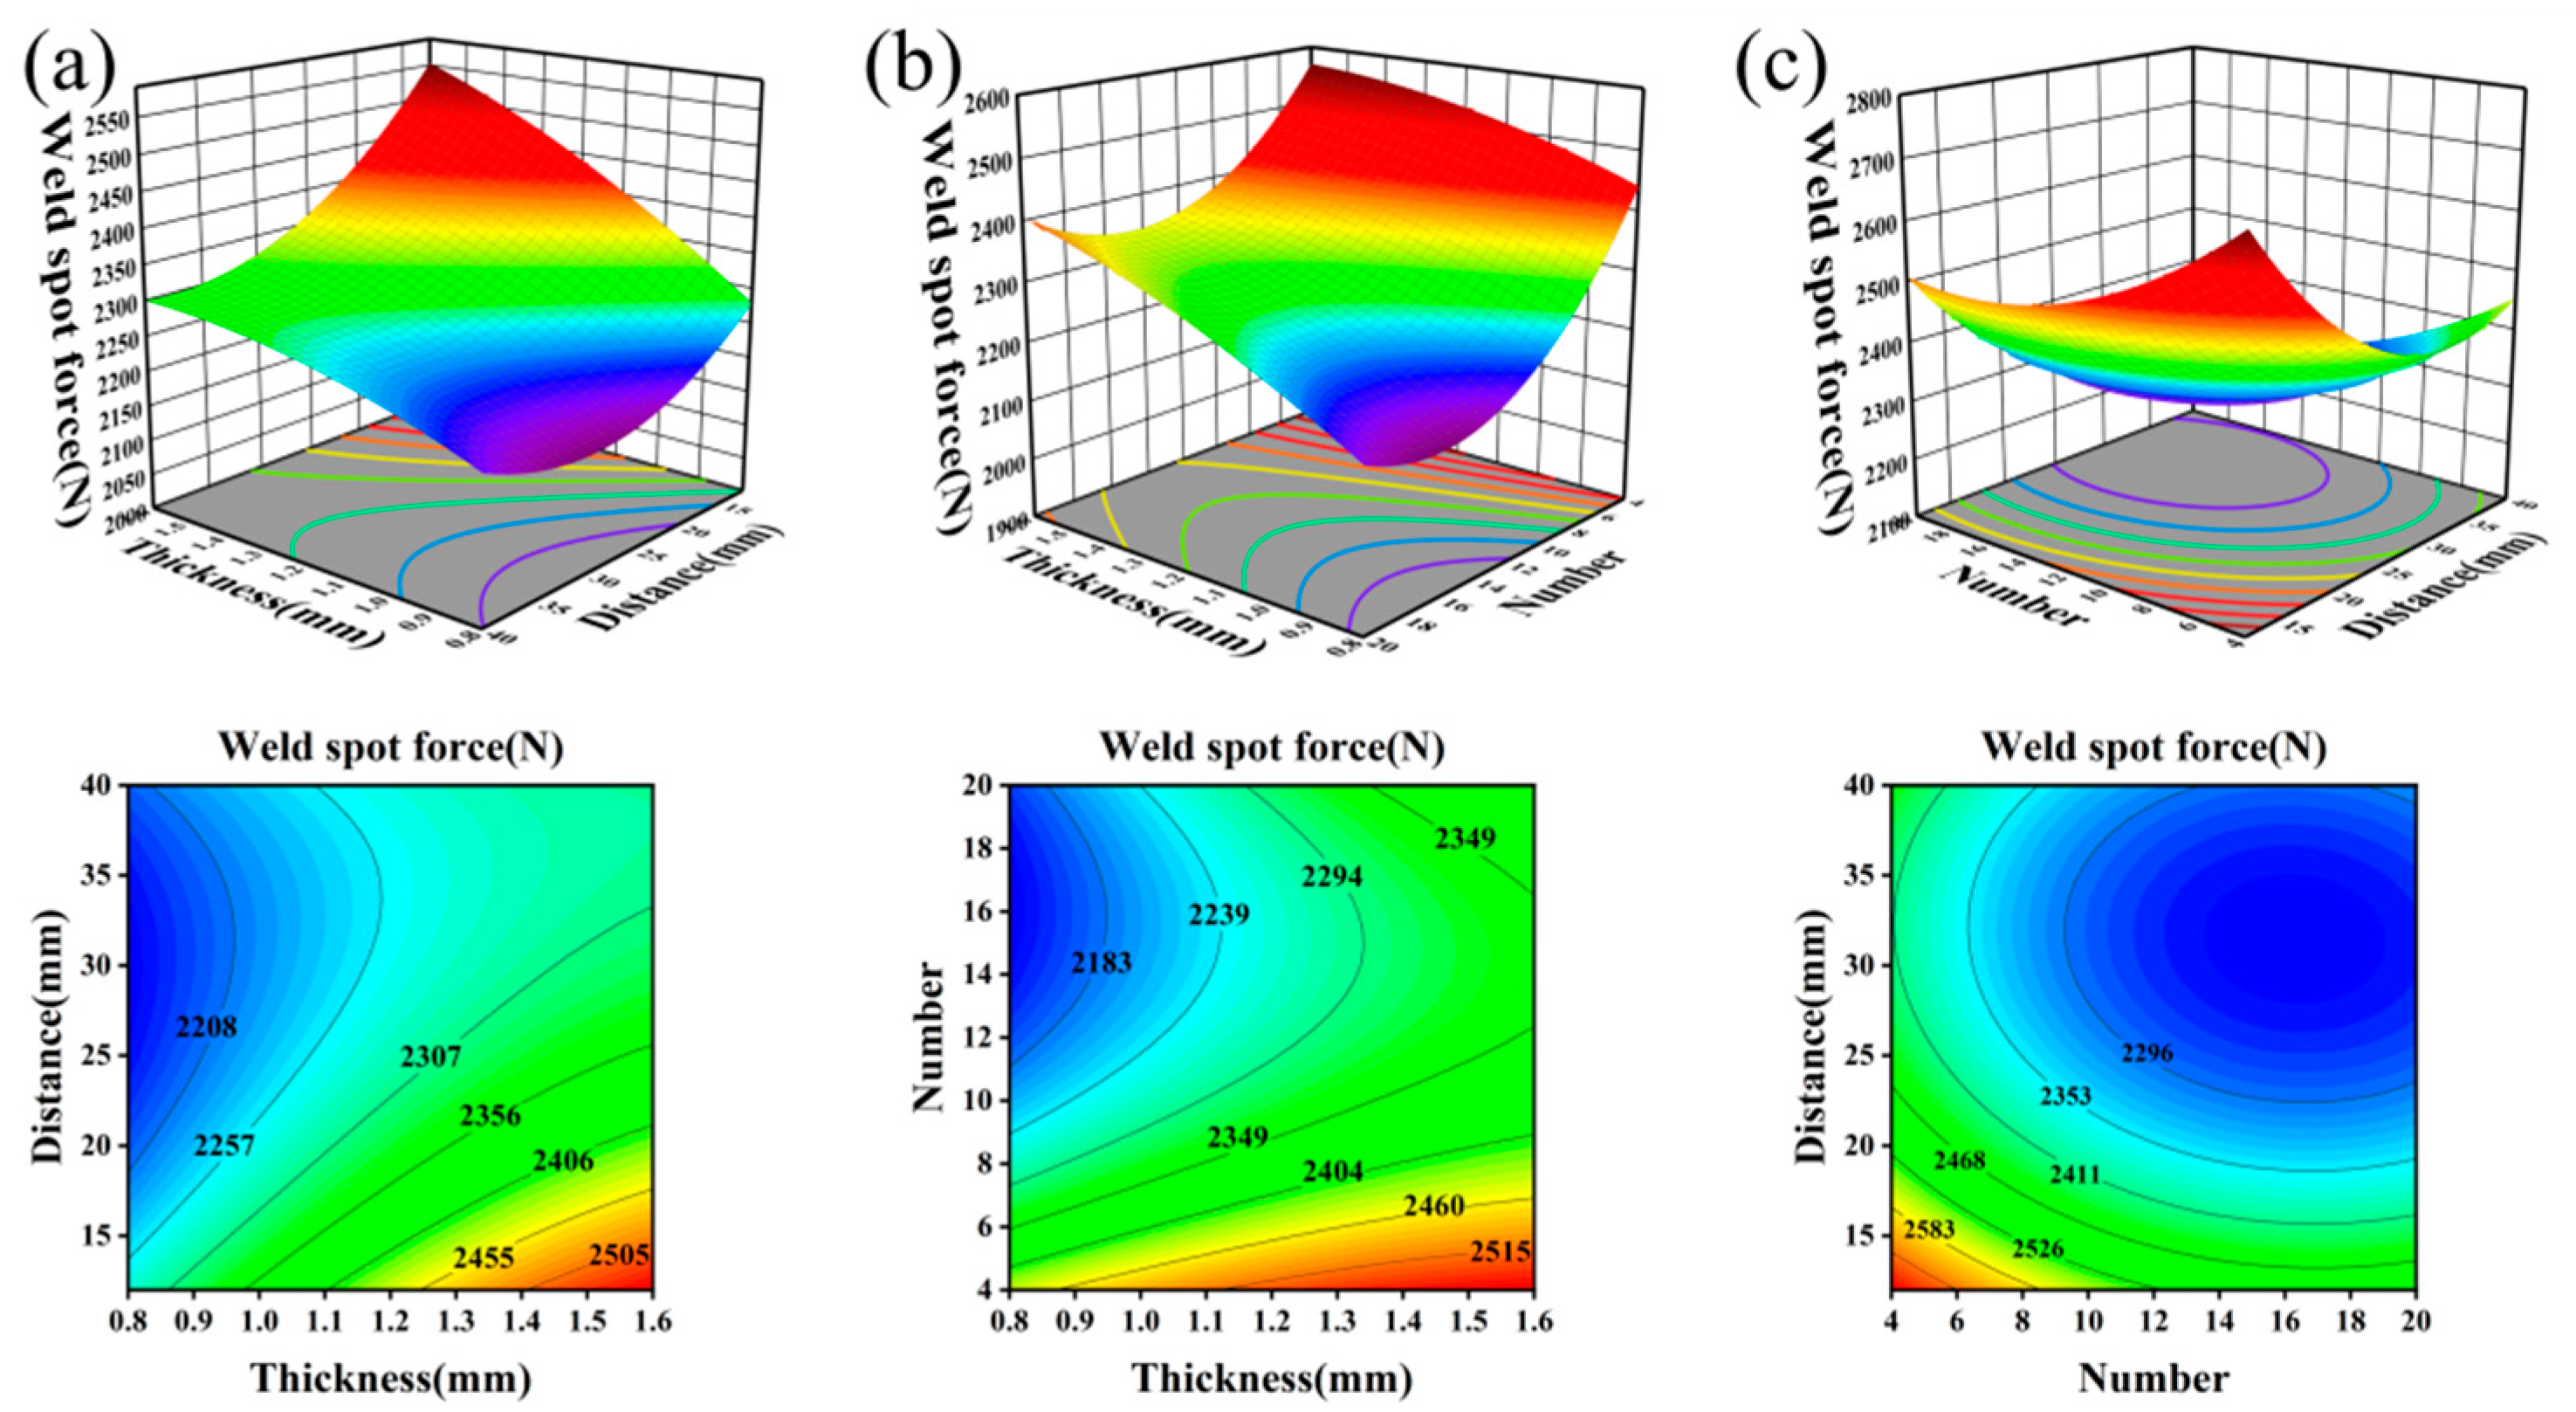
Although analysis of variance can be used to determine whether the constructed response surface model has a high fitting accuracy, it cannot be used to evaluate the interaction between design variables and the impact on the response results. Therefore, the rule of influence between design variables and their corresponding variables is generally explored by creating a three-dimensional response surface map between two parameters and a response variable and analyzing the corresponding contour line map. The degree of influence between the design factors and response variables is judged according to the slope angle and curvature change in the response surface and the color gradient distribution of the contour line map.
Figure 6 shows the effects of the thickness of the patched blank X1, the distance between the welding spot and the contour of the patched blank X2, and the number of weld spots X3 on the maximum thinning rate Y1. As the thickness of the patched blank increased, the maximum thinning rate showed a gradually increasing trend. When the thickness of the patched blank was greater than that of the main blank, the rigidity of the main blank was less than that of the patched blank, which increased the deformation of the main blank and the thinning rate. With increasing distance between the welding spot and the contour of the patched blank, the thinning rate [30] gradually decreased. The reason for this effect is that increasing the distance between the welding spot and the contour of the patched blank reduces the impact of the bending moment on the welding spot during the forming process, thus reducing the thinning rate. The effect of the number of weld spots on the maximum thinning rate shows a trend of first decreasing and then increasing. In the case of a small number of welding spots, increasing the number of welding spots could better constrain the patched blank and reduce the thinning rate. However, with the continuous increase in the number of welding spots, the stiffness of the patched blank increased, the deformation of the main blank increased during the forming process, and the thinning rate increased.
Figure 7 shows the effects of the three factors on the maximum welding spot force Y2. With the increasing thickness of the patched blank, the maximum welding spot force showed a gradually increasing trend. As the thickness of the patched blank increased, the required forming force increased, and thus, the welding spot force became larger. With increasing distance between the welding spot and the contour of the patched blank, the maximum welding spot force gradually decreased. As the distance from the welding spot to the contour of the patched blank decreased, the bending moment of the welding spot decreased during the forming process, and the welding spot force decreased. As the number of welding spots increased, the maximum welding spot force showed a downward trend.

4. Multi-Objective Optimization Based on the NSGA-II Algorithm

According to the response surface analysis, a mathematical model of parameter optimization was established, as shown in Equation (3):
Z = F X = min   Y 1 X 1 , X 2 , X 3 min   Y 2 X 1 , X 2 , X 3   0.8 X 1 1.6 12 X 2 40 4 X 3 20
The NSGA-II genetic optimization algorithm was used to solve the problem. The optimization process is shown in Figure 8. The crossover probability was 0.9, the crossover distribution index was 20, the variance distribution index was 20, the initial population number was 12, the number of population iterations was 20, and the final stopping iteration was 240. To meet the real needs for the production of parts, under the condition that the maximum thinning rate is less than 17%, the maximum welding spot force is as low as possible, the optimal solution set is the patched blank thickness of 0.8003 mm, the distance between the welding spot and the edge of the patched blank is 29.483 mm, and the number of welding spots is 16.002. Considering the real situation, a patched blank thickness of 0.8 mm, a distance between the welding spot and the edge of the patched blank of 29 mm, and a number of welding spots of 16 were selected as the optimal solution.
The simulation result obtained under the optimal solution conditions is shown in Figure 9. Compared with the maximum thinning rate of 30.7% (Figure 4) before optimization, the maximum thinning rate was significantly reduced to 14.9% after the optimization of the welding spots’ arrangement, which meets the hot-stamping production specifications.
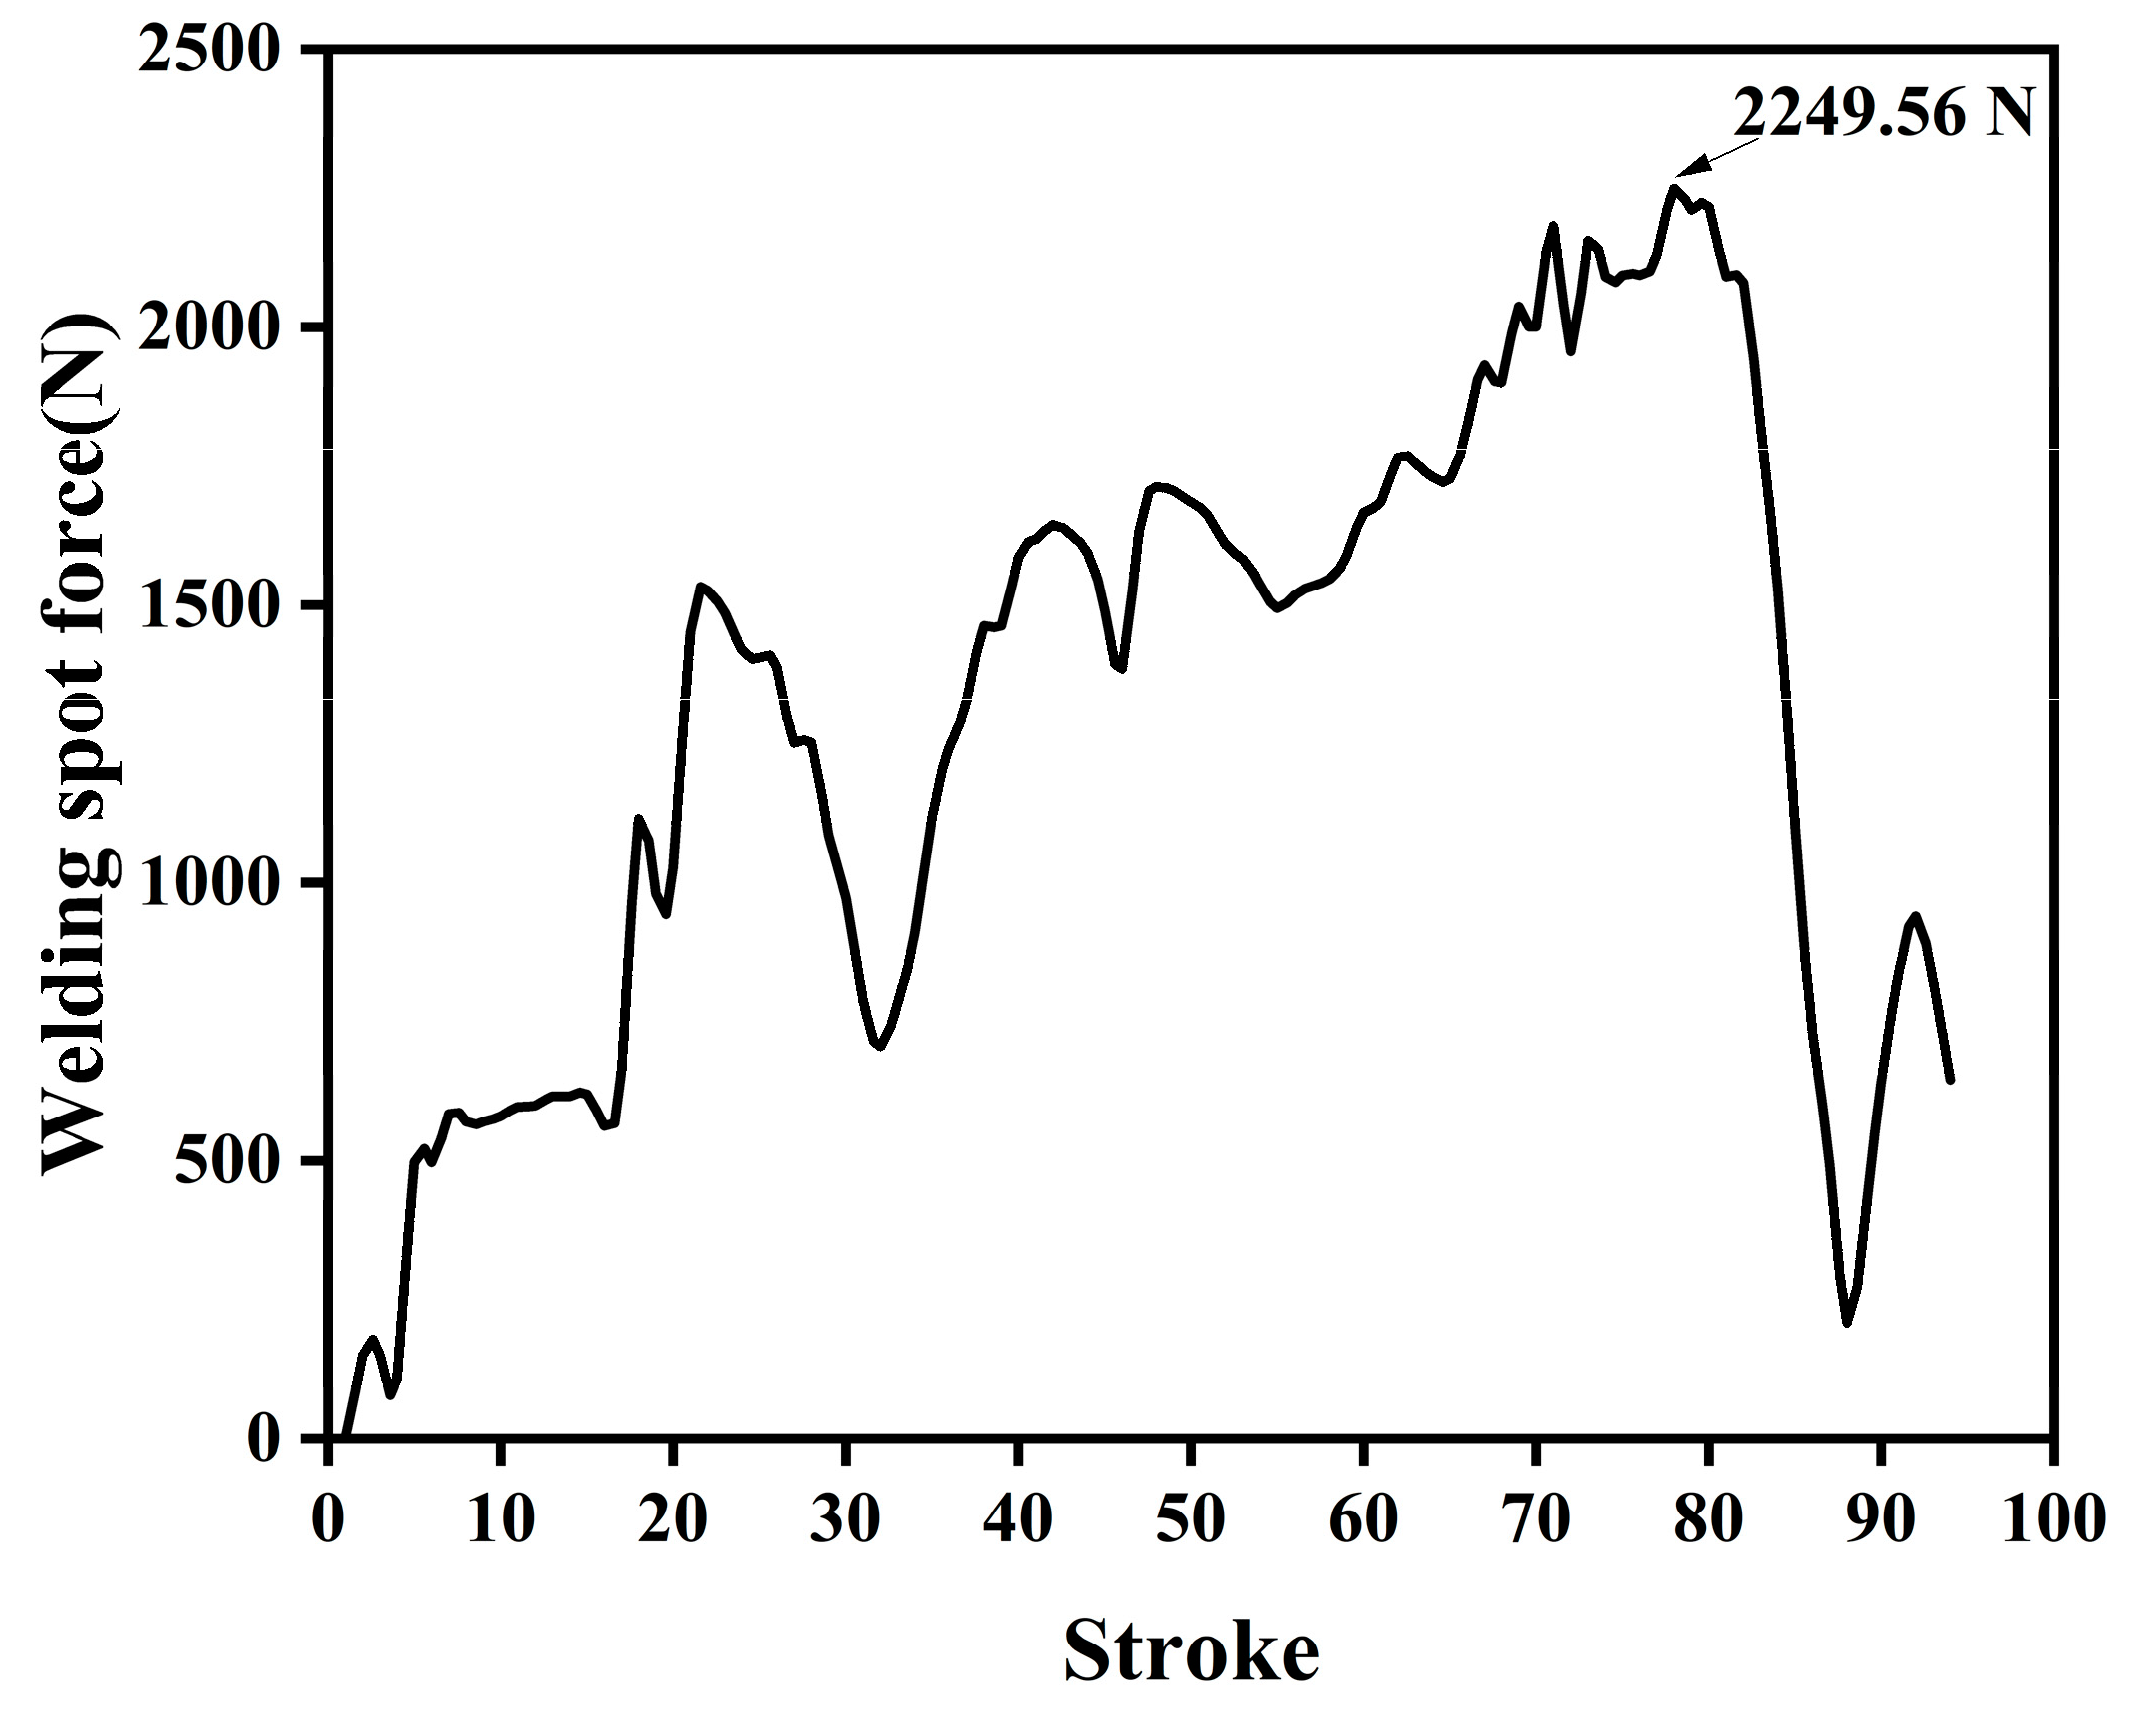
Figure 10 shows the evolution of the maximum welding spot force after optimization. With the increase in the punch stroke, the welding spot force increased, and the welding spot force decreased rapidly after reaching the maximum of 2249.56 N.
To further verify the influence of the optimized process parameters on the real hot-stamping quality, an A-pillar patchwork blank part was produced. The formed part is shown in Figure 11. With the plastic deformation of patchwork blanks, the position of the weld spots will change. When the weld spots were in the flange position, as the punch moved downwards, the weld spots moved to the die fillet area, and the force gradually increased. Near the corner of the die, the weld spot force was the greatest. When the weld spots entered the side wall area of the part, the resistance was reduced, so that the weld spot force was reduced. There were no crack or wrinkling defects in the formed part, and the welding spots were intact and met the quality requirements.

5. Conclusions

By optimizing the thickness of the patchwork blanks, the distance between the welding spot and the contour of the patched blank, and the number of welding spots, the influence law of the parameters on the forming quality was obtained. The optimal set of Pareto solutions were acquired using the multi-objective optimization NSGA-II algorithm. The optimal solution of the weld spot arrangement on the A-pillar patchwork blanks was a 1.2 mm thick main blank, 0.8 mm thick patched blank, a distance of 29 mm between the weld spot and the contour line of the patched blank, and 16 weld spots. Experiments of the hot-stamping process of A-pillar patchwork blanks with the optimal welding spot arrangement were carried out. The obtained A-pillar patchwork blanks parts were free of wrinkles and crack defects, which fully proved that the optimization method could significantly improve the hot-forming ability of patchwork blank hot stamping.

Author Contributions

W.L. helped to perform the analysis with constructive discussions and wrote the manuscript; Z.Z. contributed to the conception of the study; H.J. performed the data analyses; M.R. performed the experiments. All authors have read and agreed to the published version of the manuscript.

Funding

This research received no external funding.

Institutional Review Board Statement

Not applicable.

Informed Consent Statement

Not applicable.

Data Availability Statement

Not applicable.

Acknowledgments

We would like to thank Yonggang Li of LingYun GNS Technology Co., Ltd. for his support and help in the finite element simulation. We would like to thank the anonymous reviewers for their helpful remarks.

Conflicts of Interest

The authors declare no conflict of interest.

References

  1. Xu, W.; Tao, W.; Luo, H.W.; Yang, S.L. Effect of oscillation frequency on the mechanical properties and failure behaviors of laser beam welded 22MnB5 weld. J. Mater. Res. Technol. 2023, 22, 1436–1448. [Google Scholar] [CrossRef]
  2. Wang, Y.W.; Ding, Y.J.; Jiang, Y.H.; Wang, W.R.; Zhao, Y.Y.; Wei, X.C. The Effects of Die Temperature and Cooling Condition on Friction Behavior of Bare 22MnB5 Boron Steel in Hot Stamping. Tribol. Trans. 2022, 65, 519–530. [Google Scholar] [CrossRef]
  3. Li, S.S.; Luo, H.W. Medium-Mn steels for hot forming application in the automotive industry. Int. J. Min. Met. Mater. 2021, 28, 741–753. [Google Scholar] [CrossRef]
  4. Zhou, Q.; Guo, P.C.; Qin, F. Stress Response Behavior, Microstructure Evolution and Constitutive Modeling of 22MnB5 Boron Steel under Isothermal Tensile Load. Metals 2022, 12, 930. [Google Scholar] [CrossRef]
  5. Hirtler, M.; Unsal, I.; Buhl, J.; Bambach, M. Investigation of quench hardening behavior of directed energy deposited 22MnB5 steel for local reinforcement of hot stamping parts. CIRP J. Manuf. Sci. Technol. 2022, 39, 223–231. [Google Scholar] [CrossRef]
  6. Yuan, C.W.; Li, S.C.; Huang, J.J.; Lin, X.B.; Bian, X.Z.; Chen, J.M. Effect of hierarchical martensitic microstructure on fatigue crack growth behavior of ultra-high strength hot stamping steel. Mater. Charact. 2021, 174, 111041. [Google Scholar] [CrossRef]
  7. Esiyok, F.; Ertan, R.; Sevilgen, G.; Bulut, E.; Ozturk, F.; Alyay, I.; Abi, T.T. A Comparative Study on Conventional and Hybrid Quenching Hot Forming Methods of 22MnB5 Steel for Mechanical Properties and Microstructure. J. Mater. Eng. Perform. 2023, 32, 1347–1356. [Google Scholar] [CrossRef]
  8. Yogo, Y.; Kurato, N.; Iwata, N. Investigation of Hardness Change for Spot Welded Tailored Blank in Hot Stamping Using CCT and Deformation-CCT Diagrams. Metall. Mater. Trans. A 2018, 49A, 2293–2301. [Google Scholar] [CrossRef]
  9. Yang, J.; Xiao, M.; Wu, L.Q.; Li, Z.G.; Liu, H.B.; Zhao, Y.X.; Guo, W.; Tan, C.W. The influence of laser power on microstructure and properties of laser welding-brazing of Al alloys to Al-Si coated 22MnB5 steel. Opt. Laser. Technol. 2023, 162, 109318. [Google Scholar] [CrossRef]
  10. Almeida, D.T.; Clarke, T.G.R.; de Souza, J.H.C.; Haupt, W.; de Lima, M.S.F.; Mohrbacher, H. The effect of laser welding on microstructure and mechanical properties in heavy-gage press hardening steel alloys. Mat. Sci. Eng. A-Struct. 2021, 821, 141341. [Google Scholar] [CrossRef]
  11. Lei, C.; Xing, Z.; Xu, W.; Hong, Z.; Shan, D. Hot stamping of patchwork blanks: Modelling and experimental investigation. Int. J. Adv. Manuf. Technol. 2017, 92, 2609–2617. [Google Scholar] [CrossRef]
  12. Long, A.; Ge, R.; Zhang, Y.S.; Wei, X. Numerical Simulation of B-Pillar’s Hot Press Forming Process and its Shape Optimization. Appl. Mech. Mater. 2011, 138–139, 749–753. [Google Scholar] [CrossRef]
  13. Zhang, Z.; Ouyang, X.; Zhu, L. Study on the hot stamping simulation and experiment of A-pillar patchwork blanks. Int. J. Adv. Manuf. Technol. 2022, 122, 365–376. [Google Scholar] [CrossRef]
  14. Lamprecht, K.; Merklein, M.; Geiger, M. Hydroforming of Patchwork Blanks—Numerical Modeling and Experimental Validation. In Proceedings of the 6th International Conference and Workshop on Numerical Simulation of 3D Sheet Metal Forming Processes, Detroit, MI, USA, 15–19 August 2005. [Google Scholar]
  15. Xiancheng, G.; Dongfang, H.; Wende, L.; Peng, L.; Xiaolu, X. Hot stamping process of ultra high strength steel patchworks. Forg. Stamp. Technol. 2016, 41, 80–83. (In Chinese) [Google Scholar]
  16. Chenlei, W.; Yanjun, W.; Weili, X.; Aihui, L. Simulation and experiment of patchwork B-pillar hot forming. Die Mould Technol. 2016, 6, 10–13. (In Chinese) [Google Scholar]
  17. Zhao, Y.; Zhang, Y.; Lai, X. Analysis of Fracture Modes of Resistance Spot Welded Hot-Stamped Boron Steel. Metals 2018, 8, 764. [Google Scholar] [CrossRef] [Green Version]
  18. Li, Y.; Cui, X.; Luo, Z.; Ao, S. Microstructure and Tensile-Shear Properties of Resistance Spot Welded 22MnMoB Hot-Stamping Annealed Steel. J. Mater. Eng. Perform. 2016, 26, 424–430. [Google Scholar] [CrossRef]
  19. Zhang, Y.; Fu, C.; Yi, R.; Ju, J. Optimization of Double-pulse Process in Resistance Spot Welding of Hot Stamped Steel Sheet. ISIJ Int. 2020, 60, 1284–1290. [Google Scholar] [CrossRef]
  20. Schwedler, O.; Zinke, M.; Jüttner, S. Determination of hydrogen input in welded joints of press-hardened 22MnB5 steel. Weld. World 2014, 58, 339–346. [Google Scholar] [CrossRef]
  21. Ribeiro, R.; Romão, E.L.; Luz, E.; Gomes, J.H.; Costa, S. Optimization of the Resistance Spot Welding Process of 22MnB5-Galvannealed Steel Using Response Surface Methodology and Global Criterion Method Based on Principal Components Analysis. Metals 2020, 10, 1338. [Google Scholar] [CrossRef]
  22. Güler, H.; Ertan, R.; Özcan, R. Investigation of the hot ductility of a high-strength boron steel. Mater. Sci. Eng. A-Struct. Mater. Prop. Microstruct. Process. 2014, 608, 90–94. [Google Scholar] [CrossRef]
  23. Min, J.; Lin, J.; Min, Y.a.; Li, F. On the ferrite and bainite transformation in isothermally deformed 22MnB5 steels. Mater. Sci. Eng. A-Struct. Mater. Prop. Microstruct. Process. 2012, 550, 375–387. [Google Scholar] [CrossRef]
  24. Merklein, M.; Lechler, J. Determination of Material and Process Characteristics for Hot Stamping Processes of Quenchenable Ultra-High-Strength Steels With Respect to a FE-Based Process Design. SAE Int. J. Mater. Manuf. 2008, 1, 411–426. [Google Scholar] [CrossRef]
  25. Hu, P.; Ying, L.; Jiang, D.X.; Shi, D.Y.; Shen, G.Z.; Zhang, X.K.; Liu, W.Q. The investigation of 3D temperature field numerical simulation in hot forming of high strength steel. In Proceedings of the 11th International Conference on Numerical Methods in Industrial Forming Processes (NUMIFORM), Shenyang, China, 6–10 July 2013. [Google Scholar]
  26. Palmieri, M.E.; Galetta, F.R.; Tricarico, L. Study of Tailored Hot Stamping Process on Advanced High-Strength Steels. Mater. Manuf. Process. 2022, 6, 11. [Google Scholar] [CrossRef]
  27. Merklein, A.; Lechler, J. Investigation of the thermo-mechanical properties of hot stamping steels. J. Mater. Process. Technol. 2006, 177, 452–455. [Google Scholar] [CrossRef]
  28. Liu, H.; Lu, X.; Jin, X.; Dong, H.; Shi, J. Enhanced mechanical properties of a hot stamped advanced high-strength steel treated by quenching and partitioning process. Scr. Mater. 2011, 64, 749–752. [Google Scholar] [CrossRef]
  29. Zheng, G.; Li, X.; Chang, Y.; Wang, C.; Dong, H. A Comparative Study on Formability of the Third-Generation Automotive Medium-Mn Steel and 22MnB5 Steel. J. Mater. Eng. Perform. 2018, 27, 530–540. [Google Scholar] [CrossRef]
  30. Ouyang, X.; Zhang, Z.; Jia, H.; Ren, M.; Sun, Y. Study on the Effect of Heat Treatment on Microstructures and High Temperature Mechanical Properties of Welding Spots of Hot Stamped Ultra-High Strength Steel Patchwork Blanks. Metals 2021, 11, 1033. [Google Scholar] [CrossRef]
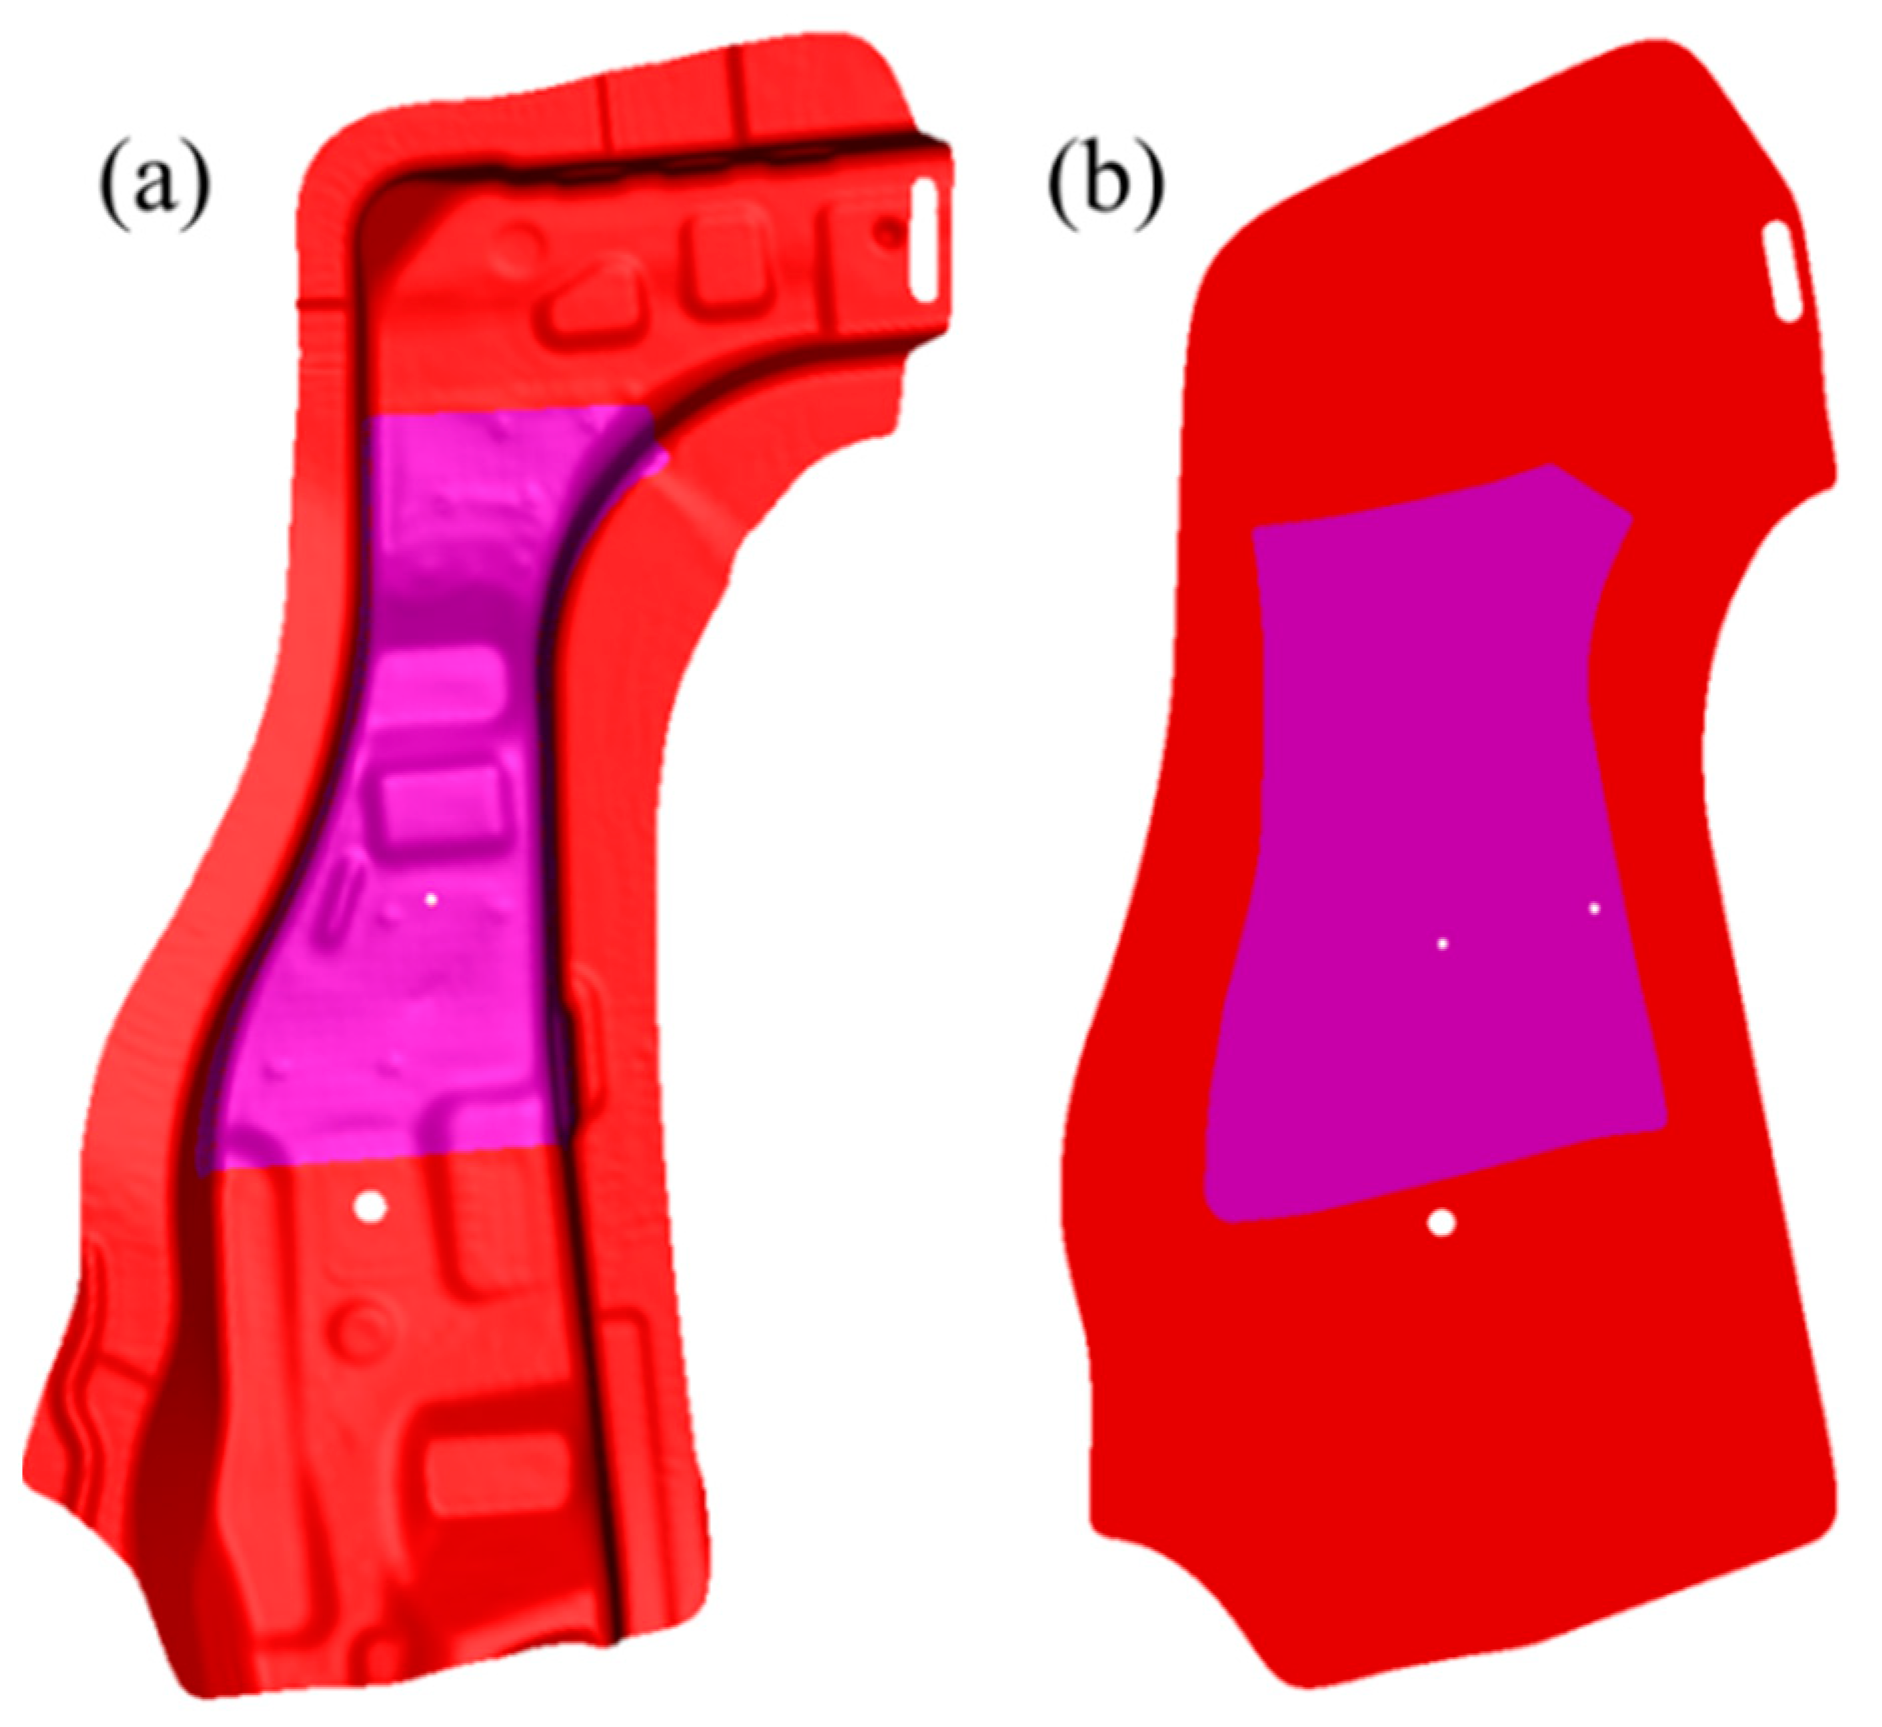
Figure 1. A-pillar patchwork blanks. (a) Part. (b) Blanks. Note: main blank red; patched blank purple.
Metals 13 01409 g001
Figure 2. The stress−strain curves of 22MnB5 at different temperatures.
Metals 13 01409 g002
Figure 3. The dies’ arrangement for the hot stamping of the A-pillar patchwork blanks.
Metals 13 01409 g003
Figure 4. Simulation results before the optimization of the welding spots’ arrangement.
Metals 13 01409 g004
Figure 5. Chart of the A-pillar patchwork blank welding spots’ optimization process.
Metals 13 01409 g005
Figure 6. Response surface and contour line map of the three factors showing effects on the maximum thinning rate: (a) X1 and X2, (b) X1 and X3, (c) X2 and X3.
Metals 13 01409 g006
Figure 7. Response surface and contour line map of the three factors showing effects on the welding spots force: (a) X1 and X2, (b) X1 and X3, (c) X2 and X3.
Metals 13 01409 g007
Figure 8. Chart of the NSGA-II genetic algorithm optimization process.
Metals 13 01409 g008
Figure 9. Simulation results after optimization of the welding spots’ arrangement.
Metals 13 01409 g009
Figure 10. Evolution of maximum welding spot force after optimization of the welding spots’ arrangement.
Metals 13 01409 g010
Figure 11. A-pillar patchwork blank part after multi-objective optimization.
Metals 13 01409 g011
Table 1. Chemical composition of 22MnB5 (w%).
CSiMnPBCrTiFe
≤0.250.231.2≤0.020.003≤0.20≤0.30Bal.
Table 2. 22MnB5 physical and thermal parameters.
Temperature (°C)20500600700800900
Elasticity modulus E (MPa)212158150142134126
Poisson’s ratio ν0.2840.3030.3010.3170.3250.334
Thermal conductivity K (W/m °C)32.022.323.624.525.626.7
Specific heat capacity Cp (J/kg °C)412573581586590596
Table 3. Design factors and levels for the optimization of patchwork blank parameters.
Design FactorsLevels
−101
X1 (mm)0.81.21.6
X2 (mm)122640
X341220
Table 4. Experimental scheme and simulation results.
Experiment NumberDesign FactorsThinning RateWelding Spot Force
X1 (mm)X2 (mm)X3Y1 (%)Y2 (N)
10.812424.72553
21.612431.22785
30.840420.62453
41.640422.82501
50.8122023.12245
61.6122030.42584
70.8402014.52177
81.6402015.42352
90.8261214.62232
101.6261217.72375
111.2121229.92476
121.2401215.02327
131.226423.92552
141.2262019.32373
151.2261217.32253
161.2261217.32253
171.2261217.32253
181.2261217.32253
191.2261217.32253
201.2261217.32253
Table 5. Variance analysis of maximum thinning rate.
SourceQuadratic SumDegree of FreedomAverage VarianceF-Valuep-Value
Models521.08957.931.55<0.0001
X14014021.80.0009
X2260.11260.1141.74<0.0001
X342.02142.0222.90.0007
X1X214.31114.317.80.019
X1X30.031310.03130.0170.8988
X2X315.4115.48.390.0159
X 1 2 12.77112.776.960.0248
X 2 2 47.26147.2625.750.0005
X 3 2 29.87129.8716.280.0024
Table 6. Variance analysis of welding spot force.
SourceQuadratic SumDegree of FreedomAverage VarianceF-Valuep-Value
Models454,600950,511.3124<0.0001
X187,796.9187,796.941.72<0.0001
X269,388.9169,388.932.970.0002
X3123,9001123,90058.86<0.0001
X1X215,138115,1387.190.023
X1X36844.516844.53.250.1015
X2X388218820.41910.532
X 1 2 1602.0511602.050.76120.4034
X 2 2 15,003.55115,003.557.130.0235
X 3 2 50,017.55150,017.5523.760.0006
Table 7. Accuracy analysis of maximum thinning rate and welding spot force response surface model.
ModelCorrelation Coefficient R2Revised Correlation Coefficient Radj2
Y10.96600.9354
Y20.95580.9159
Disclaimer/Publisher’s Note: The statements, opinions and data contained in all publications are solely those of the individual author(s) and contributor(s) and not of MDPI and/or the editor(s). MDPI and/or the editor(s) disclaim responsibility for any injury to people or property resulting from any ideas, methods, instructions or products referred to in the content.