Article

Influence of Current Density upon Hydrogenation on the Shape Memory Effect of Binary TiNi Alloy Single Crystals

Siberian Physical Technical Institute, National Research Tomsk State University, Lenin Ave. 36, 634050 Tomsk, Russia
*
Author to whom correspondence should be addressed.
Metals 2023, 13(8), 1412; https://doi.org/10.3390/met13081412
Submission received: 20 July 2023 / Revised: 3 August 2023 / Accepted: 4 August 2023 / Published: 7 August 2023
(This article belongs to the Special Issue Progress in and Prospects of Shape Memory Alloys)

Abstract

:
Some results concerning the hydrogen effect at electrolytic saturation at a current density of j = 1500 and 3500 A/m2 for 3 h at room temperature on the temperature dependence of the yield stress σ0.1(T) and the shape memory effect (SME) under tension of the [011]-oriented Ti-50.55%Ni (at.%) alloy single crystals are presented. It was shown that hydrogen is in a solid solution and forms particles of titanium hydride TiH2 after hydrogenation at j = 1500 and 3500 A/m2, respectively. Both hydrogen in the solid solution and TiH2 particles led to a decrease in the Ms temperature of the onset of the forward martensitic transformation (MT) upon cooling and the Md temperature (Md is the temperature at which the stresses for the onset of the stress-induced MT are equal to the stresses for the onset of plastic flow of the high-temperature B2 phase), and increased the yield stress σ0.1 of the B2 phase at the Md temperature compared to hydrogen-free crystals. It was found that the SME under stress depends on the tensile stress level and current density. The maximum SME εSME = 10 ± 0.2% at σex = 200 MPa and εSME = 10.5 ± 0.2% at σex = 300 MPa was observed in the hydrogen-free crystals and after hydrogenation at j = 1500 A/m2, respectively, which exceeded the theoretical value of lattice deformation ε0 = 8.95% for the B2-B19′ MT in [011] orientation under tension. At j = 1500 A/m2, the physical reason for the excess of the SME of the theoretical ε0 value was due to the increase in the plasticity of B19′ martensite upon hydrogenation. At j = 3500 A/m2, εSME = 8.0 ± 0.2%, and it was less than ε0 = 8.95% for B2-B19′ MT in [011] orientation under tension. The decrease in SME after hydrogenation at j = 3500 A/m2 was associated with the interaction of two types of B19′-martensite: oriented under stress and non-oriented, formed near TiH2 particles. It was shown that the redistribution of hydrogen in the bulk of the crystals during long-term holding for 168 h at 263 K after hydrogenation at j = 1500 A/m2 increases the SME relative to crystals without long-term holding: 3.5 times at 50 MPa and 1.8 times at 100–150 MPa. After long-term holding, εSME = 9.5 ± 0.2% at 150 MPa, which exceeds the theoretical value ε0 = 8.95% for B2-B19′ MT in [011] orientation under tension.

1. Introduction

It is well known that interstitial atoms are the most effective in solid-solution hardening of alloys compared to substitutional atoms [1,2,3,4]. Among the interstitial atoms, such as nitrogen and carbon, hydrogen can be distinguished in a special row. Firstly, hydrogen is “the smallest and lightest atom”, which, as a hardener, can be located both in octahedral and tetrahedral interstices. However, hydrogen strengthens the solid solution much weaker than nitrogen and carbon atoms, due to the small elastic distortion of the crystal lattice. Therefore, to increase the yield stress of alloys with a face-centered cubic lattice (fcc) and a body-centered cubic lattice, a high concentration is necessary [1]. It is important to note that at high concentrations above 400 wppm (wppm is weight-part per million; ~100 wppm = 0.01 wt.%~0.5 at.% [5]), hydrogen in TiNi alloys forms metal hydride particles, which, as well as hydrogen in a solid solution, lead to strengthening of the metal and alloy [1,6,7,8]. Secondly, saturation with hydrogen, in contrast to alloying with nitrogen and carbon atoms, can be carried out electrolytically at room temperature due to the small size and high diffusion mobility of hydrogen atoms [1,7,8,9,10,11,12]. This is important in terms of technology, since to improve the properties of the sample, for example, superplasticity, hydrogen atoms can be quickly introduced into the samples to the full depth [1]. Thirdly, due to high mobility, hydrogen can be exchanged with the environment and redistributed in the volume of the sample during plastic deformation at normal strain rates of 10−4 s−1, which can have a significant effect on the properties of alloys. In the electrolytic method of hydrogenation, hydrogen, as a rule, is concentrated in a narrow near-surface layer, which is significantly hardened and leads to the appearance of hydrogen embrittlement [1,12,13]. Long-term holding of electrolytically hydrogenated samples at room temperature leads to a diffusion redistribution of hydrogen over the sample volume. This, for instance, in austenitic steels increased plasticity and suppressed hydrogen embrittlement [1].
The hydrogen effect on thermoelastic martensitic transformations (MT) has been most thoroughly studied in polycrystalline TiNi alloys. These studies have shown that hydrogen changes the Ms temperature of the onset of the forward MT upon cooling [7,8,14,15], which leads to a decrease in the stability of the crystal lattice [8,16], promotes the formation of oriented martensite and the appearance of a two-way shape memory effect (SME) during hydrogenation [17], leads to the formation of titanium hydride TiH2 particles, and affects the strength properties of martensite and austenite [1,7,17]. On a high-nickel Ti-50.9 Ni alloy with B2-R-B19′ MT and a nanocrystalline structure, it has shown that long-term holding for 6 months at room temperature suppresses R-B19′ MT and does not affect the B2–R transition. As a matter of fact, the B2–R transition has been observed at the same temperature after a long-term holding. However, in this case, it was characterized by lower entropy ΔH values compared to hydrogenated crystals before a long-term holding at room temperature [10]. It can be assumed that a long-term holding after hydrogenation will also affect the SME.
The purpose of this work was to study the effect of different current densities (1500 and 3500 A/m2) during hydrogenation for 3 h at room temperature on the temperature dependence of yield stress σ0.1(T) within the temperature range of 77 to 373 K, the SME and the effect of long-term holding for 168 h at temperature of 263 K after hydrogenation at 1500 A/m2 on the SME in [011]-oriented Ti-50.55Ni (at.%) alloy single crystals under tension. At 296 K, hydrogenation occurs in the B2 phase, since the Ti-50.55Ni (at.%) alloy at 296 K is in the high-temperature B2 phase, due to the low Ms temperature for the start of forward B2-B19′ MT upon cooling due to the high Ni concentration [18,19,20]. It was assumed that in the [011]-oriented Ti-50.55Ni single crystals after hydrogenation, by analogy with previous studies [4,7,8,17], hydrogen atoms will be in a solid solution at a current density of j = 1500 A/m2 and form particles of titanium hydride TiH2 at j = 3500 A/m2. The choice of the [011] orientation is due to the large theoretical value of the lattice deformation ε0 = 8.95%, which includes the strain of the formation of twinned B19′ martensite εCVP = 5.2% (CVPs are the correspondence variant pairs) and the detwinning strain of B19′ martensite εdet = 3.75% [18,21]. This choice of orientation will make it possible to elucidate the effect of different current densities during hydrogenation (or hydrogen concentration) on the mobility of twin boundaries and the SME during isobaric tensile deformation. Secondly, the [011]-oriented crystals are characterized by large values of the Schmid factor msl = 0.35 for <100>{110} slip systems in the high-temperature B2 phase under tension [22,23]. This means that the B2 phase is easily deformed by slip and, at high levels of external tensile stresses σex~200–300 MPa, B2–B19′ MT under stress in the temperature range of the stress-induced MT (SIM) can be accompanied by local plastic deformation of the B2 phase [19,22,23]. This can lead to a deviation from the linear dependence σ0.1 on the temperature dependence of σ0.1(T) in the temperature range of SIM, the appearance of irreversible deformation εirr, and SME degradation in isobaric experiments in “transformation strain-temperature” cycles under tensile stresses. Thus, it was assumed that hydrogen, being in a solid solution, and TiH2 particles will lead to an increase in σ0.1 stresses of the B2 phase, suppress local plastic deformation of the B2 phase during the development of the stress-induced MT in the temperature range of SIM on the σ0.1(T) dependence, and improve the SME compared to the hydrogen-free crystals.

2. Materials and Methods

Ti-50.55Ni alloy (at.%) single crystals were grown by the Bridgman method in a helium atmosphere with graphite crucibles on a Russian-made Redmet installation (Firm “Kristallooptika”, Tomsk, Russia). To determine the [011] orientation of the crystals, the diffractometric method was used by means of a DRON-3M X-ray diffractometer (Bourevestnik, St.-Petersburg, Russia) with monochromatic Fe Kα radiation. Dog-bone-shaped tension samples with a gauge length of 12 mm and a cross section of 2 × 1.5 mm2 were cut using wire electrical discharge machining ARTA-5.9 (DELTA-TEST, Fryazino, Moscow region, Russia). The damaged layer after cutting was removed by chemical etching in a 3H2O + 2HNO3 + 1HF solution. All samples were initially homogenized at 1220 K for 12 h in a quartz tube, in a helium atmosphere, followed by water quenching. After quenching, the samples were subjected to mechanical grinding and electrolytic polishing in 490 mL of an CH3COOH + 10 mL of an HClO4 electrolyte at 263 K, with 20 V applied voltage. The chemical composition of the single crystals after quenching was determined using the X-ray fluorescence method, by means of a wavelength dispersive X-ray fluorescence XRF-1800 spectrometer (SHIMADZU, Kyoto, Japan), giving the atomistic percentages Ti = 49.45% and Ni = 50.55% (at.%). The martensitic transformation (MT) was monitored by the temperature dependence of the electrical resistance ρ(T) (a Russian-manufactured installation (Firm “Kristallooptika”, Tomsk, Russia), with a heating/cooling rate of 10 K/min within a temperature range of 77 to 623 K). Starting Ms and finishing Mf temperatures of the forward B2-B19′ MT during cooling and starting As and finishing Af temperatures of the reverse B19′-B2 MT during heating were determined by the intersection of tangents on the ρ(T)- curves. Mechanical tests were determined using an Instron 5969 universal testing machine (Instron, Norwood, MA, USA), at a strain rate of 4 × 10⁻⁴ s−1. SME under isobaric tensile deformation was studied on home-made dilatometer (Firm “Kristallooptika”, Tomsk, Russia) during cooling and heating in the temperature range from 77 to 400 K at a constant stress in the cycle, with a heating/cooling rate of 10 K/min.
The samples were subjected to electrolytic hydrogenation in a thermostated cell in a 0.9% NaCl solution at a current density of 1500 and 3500 A/m2. The saturation time was 3 h at room temperature, which was chosen to obtain a high hydrogen concentration in order to obtain strengthening of the B2 phase. To obtain the same hydrogen concentration in the samples under the same hydrogenation regime, several samples were placed simultaneously in the cell. The anodes were plane-parallel stainless steel plates, between which the samples were placed. The samples were the cathodes. The hydrogen concentration was measured on a LECO RHEN 602 gas analyzer (LECO, St. Joseph, MI, USA). To safekeep hydrogen in the samples after hydrogenation, the samples were placed in a vessel with liquid nitrogen. Long-term holding of samples after hydrogenation at j = 1500 A/m2 for 3 h was carried out at a temperature of 263 K for 168 h in a freezer. It was assumed that long-term holding at 263 K for 168 h would slow down the release of hydrogen from the sample surface into the environment, and almost all hydrogen introduced by the electrolytic method would be redistributed over the sample volume compared to long-term holding at 296 K.
To study the phase composition and microstructure of the samples after hydrogenation, a transmission electron microscope (TEM), a JEOL-2010 (JEOL, Tokyo, Japan), with an accelerating voltage of 200 kV was used. The thin foils were prepared using double-jet electropolishing (TenuPol-5; “Struers”, Ballerup, Denmark), with an electrolyte containing 20% sulfuric acid in methyl alcohol at room temperature, with 12.5 V applied voltage. In hydrogen-free crystals, thin foils were cut from the body of the sample. Thin foils of hydrogenated samples were cut from directly at the edge of the samples that contained the hydrogenation product. The fracture surfaces were investigated using a TESCAN VEGA3 scanning electron microscope (SEM) (TESCAN, Brno, Czech).

3. Results and Discussion

3.1. Temperature Dependence of Yield Stress

The temperatures of B2-B19′ MT of the [011]-oriented Ti-50.55Ni alloy single crystals after hydrogenation at different current densities j are presented in Table 1. The [011]-oriented Ti-50.55Ni single crystals after hydrogenation are characterized by a one-stage B2-B19′ MT, regardless of the current density j [8,19]. Analysis of the data presented in Table 1 shows that hydrogenation at a current density of j = 1500 and 3500 A/m2 leads to a decrease in the Ms temperature by 19 and 11 K, respectively, relative to hydrogen-free crystals. Previously, a decrease in the Ms temperature under similar hydrogenation regimes was observed on Ti-50.3Ni and Ti-50.7Ni (at.%) single crystals [8,14,15]. The temperature hysteresis after hydrogenation is symmetrical, since Th1 = AfMs and Th2 = AsMf are equal to each other, but it becomes larger in magnitude than in the hydrogen-free crystals.
TEM studies showed that after hydrogenation at j = 1500 A/m2 at 300 K, only reflections from the ordered B2 phase were observed in microdiffraction patterns with the (110) zone axis. Reflections from the R phase and particles of secondary phases were not detected (Figure 1a). Consequently, hydrogen atoms after hydrogenation at a current density of j = 1500 A/m2 for 3 h of [011]-oriented Ti-50.55Ni alloy single crystals are in solid solution, similarly to the Ti–50.3Ni alloy crystals after hydrogenation in this regime [8]. With regard to hydrogenation at j = 3500 A/m2, the [011]-oriented Ti-50.55Ni alloy single crystals were characterized by a two-phase state at 300 K. On the bright-field images, particles of a non-equiaxed shape were observed in the B2 phase (Figure 1b). Diffraction analysis showed that these particles are titanium hydride TiH2, which have an fcc lattice and non-coherent conjugation with the B2 phase (Figure 1b). Titanium hydride TiH2 particles of non-equiaxed shape had a length of 1500 nm and a width of 400 nm on average (Figure 1b). The volume fraction of TiH2 particles according to TEM data was 7%. The formation of TiH2 particles at j = 3500 A/m2 leads, firstly, to an increase in the nickel concentration in the B2 phase. As a result of this factor, the Ms temperature should decrease relative to the Ms temperature of hydrogenated crystals at 1500 A/m2. Secondly, the particles are sources of internal stresses and this factor should lead to an increase in the Ms temperature compared to hydrogenated crystals at j = 1500 A/m2. The result of these two factors is an increase in the Ms temperature by 11 K relative to the Ms temperature of hydrogenated crystals at j = 1500 A/m2 (Table 1). A more important role in the increase in Ms temperature is played by internal stresses from the TiH2 particles.
The temperature dependence of yield stress σ0.1(T) during tensile deformation of [011]-oriented Ti-50.55Ni alloy single crystals without and with hydrogen within a wide temperature range of 170 to 570 K is shown in Figure 2. It can be seen that the σ0.1(T) dependence exhibits stages characteristic of alloys experiencing MT under stress [18,19,24,25]. The minimum stresses σ0.1 on the σ0.1(T) dependence were observed at the Ms temperature coinciding with the Ms obtained in the study of the temperature dependence of the electrical resistance ρ(T) (Table 1). At T < Ms, a low-temperature stage was observed, at which σ0.1 increased with decreasing test temperature. This is typical of alloys in the martensitic state and is associated with the thermally activated motion of twinning and interphase boundaries. The maximum stresses σ0.1 on the σ0.1(T) dependence correspond to the Md temperature. At Md temperature, the stresses for the onset of stress-induced B2-B19′ MT are equal to the stresses for the onset of plastic deformation of the high-temperature B2 phase. In the temperature range Ms < T < Md, the σ0.1 increased linearly with increasing test temperature. This stage of the σ0.1(T) dependence is associated with stress-induced B19′-martensite and is described by the Clausius–Clapeyron equation [18,19,24,25]:
d σ 0.1 d T = Δ H ε 0 T 0
where ΔH is the change in enthalpy at B2–B19′ MT, T0 is the phase equilibrium temperature, and ε0 is the lattice deformation at B2–B19′ MT. At T > Md, a stage was observed that was related with plastic deformation of the high-temperature B2 phase.
Analysis of the data presented in Figure 2 led to the following findings. Firstly, hydrogenation leads to a decrease in the Ms temperature by 25 and 15 K at j = 1500 and 3500 A/m2, respectively (Figure 2, Inset). Secondly, in the temperature range Ms < T < Md, the σ0.1(T) dependence in the hydrogen-free crystals has two sections with different values of α = dσ0.1/dT: the first section in the temperature range of 225 to 300 K with α = dσ0.1/dT = 5.1 MPa/K and the second section from 300 K to Md temperature with α = dσ0.1/dT = 1.6 MPa/K. After hydrogenation at j = 1500 A/m2, the σ0.1(T) dependence has only one section with α = dσ0.1/dT = 5.0 MPa/K in the temperature range Ms < T < Md. As for the hydrogenation at j = 3500 A/m2, two sections again appear on the σ0.1(T) dependence in the temperature range Ms < T < Md: the first in the temperature range of 213 to 290 K with α = dσ0.1/dT = 6.5 MPa/K and the second from 290 K to Md with α = dσ0.1/dT = 2.1 MPa/K. Thirdly, hydrogen lowers the Md temperature and increases the σ0.1(Md) of the high-temperature B2 phase. Relative to the hydrogen-free crystals, the Md temperature decreases by 20 and 40 K, and σ0.1(Md) increases by 55 and 75 MPa at j = 1500 and 3500 A/m2, respectively, (Figure 2). Hence, both the hydrogen in the solid solution and TiH2 particles strengthen the B2 phase. A similar strengthening of the initial phase upon hydrogenation by the electrolytic method was previously observed in single crystals of the Ti–50.7Ni (at %) alloy and austenitic stainless steel, when hydrogen was in a solid solution and formed titanium hydride particles [3,6,7,8].
The TiH2 particles are non-coherent and interact with dislocations by the rounding mechanism [26,27,28]. According to [26,27,28], the yield stress σ0.1 in alloys with non-coherent particles during slip deformation is determined as
σ 0.1 = σ f b + G · b L
Here, σf(b) is the friction stress experienced by the perfect dislocation a/2<001> moving in the B2 phase; G = 41,000 MPa is the shear modulus of the TiNi alloys in the B2 phase [18]; L is the distance between the TiH2 particles, which from the TEM data was equal to 700 nm on average; and b = 0.15 nm is the modulus of the Burgers vector of the perfect dislocation a/2<100>. As a result, the estimate of the contribution (Gb/L) from the TiH2 particles to σ0.1 gives a value of the order of 10 MPa for L = 700 nm. This value turned out to be close to the stress difference Δσ0.1 = 20 MPa at the Md temperature between the crystals after hydrogenation at j = 1500 and 3500 A/m2 (Figure 2). Consequently, a low volume fraction of TiH2 particles does not make a significant contribution to the strengthening of the B2 phase during hydrogenation at j = 3500 A/m2 relative to the hydrogenation at j = 1500 A/m2, or does not compensate for the softening of the matrix due to the reduction of Ti and H2 atoms during their formation.
The difference in the phase state of [011]-oriented Ti-50.55Ni alloy single crystals upon hydrogenation at a current density of j = 1500 and 3500 A/m2, when hydrogen atoms, H2, are in solid solution at j = 1500 A/m2 (single-phase state) or form the TiH2 particles at j = 3500 A/m2 (two-phase state: B2 phase + TiH2 particles), may be the reason for the appearance of one or two stages on the σ0.1(T) dependence in the SIM temperature range.
On the σ0.1(T) dependence in the SIM temperature range, the transition from the stage with high α = dσ0.1/dT to the stage with low α = dσ0.1/dT indicates that the development of stress-induced MT proceeds simultaneously with the local plastic deformation of the B2 phase [18,19,22,23]. In this case, the plastic deformation that accompanies the stress-induced MT blocks the increase in the transformation strain εtr during cooling/heating under stress, leads to the appearance of irreversible deformation εirr when heated under stress, and reduces the SME [19,22]. The appearance of a stage with low α = dσ0.1/dT in the SIM temperature range with a one-stage B2-B19′ MT is controlled by the stress level of the high-temperature B2 phase [18,19,22,23]. Indeed, in the [011]-oriented Ti-50.55Ni alloy crystals after hydrogenation at j = 1500 A/m2, when hydrogen was in solid solution and increased σ0.1(Md), only one stage of the linear σ0.1(T) dependence took place in the SIM temperature range. As for hydrogenation at j = 3500 A/m2, when TiH2 particles appeared, the B2 phase stresses at the Md temperature also increased, as in the case of hydrogenation at j = 1500 A/m2. Nevertheless, the σ0.1(T) dependence in the SIM temperature range showed a deviation from the linear dependence of α = dσ0.1/dT (Figure 2); namely, there were two sections with different α = dσ0.1/dT values. In the case of hydrogenation at j = 3500 A/m2, the transition from the stage with high α = dσ0.1/dT to the stage with low α = dσ0.1/dT on the σ0.1(T) dependence in the SIM temperature range can be associated with the plastic deformation of the TiH2 particles themselves and local deformation of the B2 phase directly near the particles during the formation of stress-induced B19′-martensite [18,19]. The TiH2 particles have an fcc structure (Figure 1b) and, like other fcc alloys that do not experience MT, they can be deformed by slip or twinning [1]. However, in the [011]-oriented crystals containing TiH2 particles, the transition from the stage with high α = dσ0.1/dT to the stage with low α = dσ0.1/dT occurred at higher σ0.1 = 550 MPa than in the [011]-oriented hydrogen-free crystals due to the higher stress level of σ0.1(Md) (Figure 2).
It is important to note that at the stage of linear σ0.1(T) dependence in the SIM range from 50 to 450–500 MPa, α = dσ0.1/dT had close values of 5–5.1 MPa/K in the hydrogen-free crystals and after hydrogenation at j = 1500 A/m2, and it increased to 6.5 MPa/K after hydrogenation at j = 3500 A/m2. According to equation (1), the α = dσ0.1/dT value is proportional to 1/ε0 [18,19,22,23]. Therefore, in accordance with equation (1), we should expect close SME for the hydrogen-free crystals and after hydrogenation at j = 1500 A/m2 and its decrease at j = 3500 A/m2, which will be presented below.

3.2. Shape Memory Effect

The results of studying the transformation strain εtr during cooling/heating at different tensile stress levels σex from 50 to 300 MPa for the [011]-oriented Ti-50.55Ni alloy single crystals without and with hydrogen are presented in Figure 3 and Figure 4. It can be seen from Figure 3 that in the [011]-oriented Ti-50.55Ni single crystals without and with hydrogen, the B2-B19′ MT under a tensile stress developed almost according to explosive kinetics with large values of dεtr/dT [22]. The Ms temperature increased with the growth of σex (Figure 3 and Figure 5) and the value α = dσ/dMs was described by equation (1). The value of reversible εrev (or SME) and irreversible εirr deformation depended on the tensile stress level σex and the current density during hydrogenation (Figure 3 and Figure 4). The transformation strain εtr was the total strain that occurred in the “cooling-heating” cycle under a tensile stress σex during cooling. The value of reversible deformation εrev or SME εSME was determined in the “cooling-heating” cycle under σex after heating. If after heating in the “cooling-heating” cycle under a tensile stress σex there was no irreversible deformation, εirr = 0, then εtr = εSME and when εirr ≠ 0, then εSME = εtr – εirr and εtr > εSME. All types of deformations, namely, transformation deformation during cooling under stress εtr, reversible deformation εrev, and irreversible deformation εirr during heating under stress, are shown in Figure 3.
As can be seen from Figure 3 and Figure 4, in the [011]-oriented Ti-50.55Ni single crystals with and without hydrogen, the εtr(T) curves in the “cooling-heating” cycle under stress had a closed form at tensile stresses of σex = 50–150 MPa. Hence, B2-B19′ MT, which was realized under stress during cooling, was completely reversible when heated, and, therefore, SME was realized [8,18,19,22,23,24]. At σex = 50 MPa, the SME in hydrogen-free crystals was 2–3 times higher than after hydrogenation at j = 1500 and 3500 A/m2. With a successive increase in σex, the εtr and SME values in hydrogen-free crystals were always higher than in crystals after hydrogenation. Consequently, both hydrogen in solid solution and TiH2 particles increased the resistance to the movement of interphase boundaries [7,8]. The irreversible deformation εirr in the “cooling-heating” cycle under tensile stress σex appeared at σex ≥ 150 MPa and then increased with increasing σex. The maximum reversible deformation εrev or SME of 10.0 ± 0.2% was realized in the hydrogen-free [011]-oriented Ti-50.55Ni single crystals at σex = 200 MPa. This SME value, εSME = 10.0 ± 0.2%, in hydrogen-free crystals turned out to be 1.0 ± 0.2% larger than the theoretical value of the lattice deformation ε0 = εCVP + εdet = 8.95% for the [011] orientation to B2-B19′ MT under tension [21]. After hydrogenation, the maximum SME was 10.5 ± 0.2% at σex = 300 MPa and 8.0 ± 0.2% at σex = 200 MPa, respectively, at j = 1500 and 3500 A/m2 (Figure 3 and Figure 4). When hydrogen was in solid solution at j = 1500 A/m2, the maximum εSME = 10.5 ± 0.2% turned out to be 1.55 ± 0.2% higher than the theoretical value of the lattice deformation ε0 = εCVP + εdet = 8.95% for the [011] orientation to B2-B19′ MT under tension [21]. But, in the case of hydrogenation at j = 3500 A/m2, when hydrogen formed particles, the maximum εSME = 8.0 ± 0.2% was somewhat less than the theoretical value ε0. At σex > 200 and 300 MPa, the [011]-oriented Ti-50.55Ni crystals after hydrogenation at j = 3500 and 1500 A/m2, respectively, were destroyed from the beginning of the development of B2-B19′ MT under stress during cooling.
A similar result, when the SME exceeded the theoretical ε0 value, was obtained on Ti-40Ni-10Cu single crystals for the B2-B19-B19’ MT [22]. In the case of the [011]-oriented Ti-40Ni-10Cu crystals, the physical reason for the excess of the reversible strain under tensile stresses of the theoretical ε0 value was associated with the simultaneous development under stress of mechanical {110}B19 twinning in B19 martensite and {001}B19′ twinning in B19’ martensite. These twins were completely reversible in the “cooling-heating” cycle under stress at σex ≤ 200 MPa. By analogy with the [011]-oriented Ti-40Ni-10Cu crystals, in our case, in the [011]-oriented Ti-50.55Ni crystals, the excess SME of the theoretical ε0 value can also be associated with the development of {001}B19′ twins in B19′-martensite. In the [011]-oriented Ti-50.55Ni crystals in the “cooling-heating” cycle, the irreversible deformation was 2.0 ± 0.2% at σex = 250 MPa in hydrogen-free crystals and 1.3 ± 0.2% at σex = 300 MPa in crystals after hydrogenation at j = 1500 A/m2. TEM studies of the microstructure in both cases revealed only dislocations that were in the one system (Figure 6a–c). The dislocation density was higher in hydrogen-free crystals than in crystals after hydrogenation at j = 1500 A/m2, which was due to the difference in the magnitude of irreversible deformation. Residual B19’ martensite with {001}B19′ twins could not be detected. To elucidate the physical reason for the excess of the SME of the theoretical ε0 value in these crystals, additional in situ studies of the MT under stress in the column of a transmission electron microscope are required. It is important to note that after hydrogenation at j = 1500 A/m2 the [011]-oriented Ti-50.55Ni crystals showed SME at σex = 300 MPa, while hydrogen-free crystals at these stresses were already destroyed from the beginning of the development of an MT under stress. Consequently, hydrogen, being in a solid solution, not only increased the σ0.1 stresses of the B2 phase, but also increased the plasticity of B19’ martensite in the [011]-oriented Ti-50.55Ni crystals.
As for the [011]-oriented Ti-50.55Ni crystals, hydrogenated at j = 3500 A/m2, in a TEM study of the microstructure after the “cooling-heating” cycle at σex = 200 MPa, when irreversible deformation εirr = 0.5 ± 0.2%, residual B19’ martensite was found directly near the TiH2 particles (Figure 6d–f). From Figure 6d,f, it can be seen that the particles generate their own variant of B19′martensite, which is not oriented with respect to the external tensile stress. Under stress, as is known, oriented B19’ martensite is formed [19,21], which interacts with non-oriented B19′ martensite formed by TiH2 particles. The interaction of two types of B19′ martensite (oriented and non-oriented) hinders the development of oriented B19′-martensite upon cooling under stress and its reverse movement upon heating under stress. In addition, the TiH2 particles themselves do not experience MT, but can be deformed only by slip or twinning and are brittle [1]. Both of these factors contribute to the appearance of irreversible deformation during heating under stress at σex > 150 MPa and reduce the SME.
At σex ≥ 250 MPa, all the studied crystals demonstrated a quasi-brittle fracture (Figure 7). However, the fracture surface had differences at σex ≥ 250 MPa. In the case of hydrogen-free crystals, dimples and cleavage facets were observed on the fracture surface, which are characteristic of a quasi-brittle fracture (Figure 7a) [24]. In hydrogenated crystals at j = 1500 A/m2, traces of localized deformation in one system were visible on the fracture surface (Figure 7b), which was previously observed in [8], when hydrogen was in a solid solution. As for hydrogenation at j = 3500 A/m2, no localization bands were observed and the crack developed in several systems (Figure 7c). Such a crack propagation mechanism is typical for the presence of hydrides [29] and can occur along the “particle-matrix” interfaces or at the intersections of two types of B19′-martensite (oriented and non-oriented formed by titanium hydride TiH2 particles). Thus, the observed differences on the fracture surface of crystals after hydrogenation are direct evidence of the different nature of the presence of hydrogen in the volume of the sample: in the solid solution after hydrogenation at j = 1500 A/m2 and as TiH2 hydride at j = 3500 A/m2.
The effect of hydrogen on the SME (Figure 3 and Figure 4) was studied on samples with a relatively large thickness (h = 1.5 mm). As was mentioned in the introduction and in [10,30], when saturated with hydrogen by the electrolytic method at 300 K, hydrogen in thick samples did not pass through the entire thickness of the sample, but only surface saturation occurred to a depth of about 30–50 μm. This means that, after hydrogenation, the sample is a composite consisting of a hydrogenated surface layer and the inner part of the sample that does not contain hydrogen.
The SME obtained on the samples immediately after hydrogenation at j = 1500 A/m2 and after long-term holding for 168 h at 263 K at the same tensile stress level (50, 100 and 150 MPa) is shown in Figure 8. An analysis of the data presented in Figure 8 showed that the long-term holding of the samples after hydrogenation leads, firstly, to an increase in the Ms temperature under stress at the same level of σex. In fact, the Ms temperature under stress increased by 30 K at σex = 50 MPa and by 10–15 K at σex = 100–150 MPa (Figure 8). Therefore, long-term holding of the samples after hydrogenation at j = 1500 A/m2 for 168 h at 263 K leads to an increase in the Ms temperature in the free state. Secondly, an increase in the SME was found. The SME increased by 3.5 times at σex = 50 MPa and by 1.8 times at σex = 100–150 MPa, relative to hydrogenated samples without long-term holding. It is important to note that the SME after long-term holding at the same σex level became larger than in hydrogen-free crystals (Figure 4 and Figure 8). In addition, after long-term holding, the εSME = 8.3 ± 0.2% at σex = 100 MPa and εSME = 9.5 ± 0.2% at σex = 150 MPa, which was almost equal to and greater, respectively, than the theoretical lattice deformation ε0 = εCVP + εdet = 8.95% for B2-B19′ MT in [011] orientation under tension [21]. It is important to note that after long-term holding, the SME, almost equal to ε0, was achieved at lower σex = 100 MPa than in the hydrogen-free crystals and after hydrogenation at j = 1500 A/m2 without long-term holding. This is due to an increase in the plasticity of B19′ martensite upon the redistribution of hydrogen in the bulk of the sample.

4. Conclusions

The above studies of the development of stress-induced B2-B19′ MT and SME in the [011]-oriented Ti-50.55Ni alloy single crystals with varying current density j = 1500 and 3500 A/m2 during electrolytic hydrogenation for 3 h at room temperature allow us to draw the following findings.
  • Variation of the current density j = 1500 and 3500 A/m2 during electrolytic hydrogenation for 3 h at room temperature did not change the type of B2-B19′ MT and did not lead to the formation of the R phase. When hydrogenated at a current density of 1500 A/m2 for 3 h at room temperature, hydrogen was in solid solution and lowered the Ms temperature by 19 K relative to the hydrogen-free crystals with Ms = 224 K. In the case of hydrogenation at a current density of 3500 A/m2 for 3 h at room temperature, particles of titanium hydride TiH2 were formed and the alloy was in a two-phase state at room temperature (B2 phase + TiH2 particles) with a temperature of Ms = 213 K, which was at 11 K below the Ms temperature in the hydrogen-free crystals. Both hydrogen in solid solution and TiH2 particles led to an increase in the yield stress σ0.1 of the B2 phase at the Md temperature by 55 and 75 MPa, respectively, relative to the hydrogen-free crystals with σ0.1(Md) = 700 MPa.
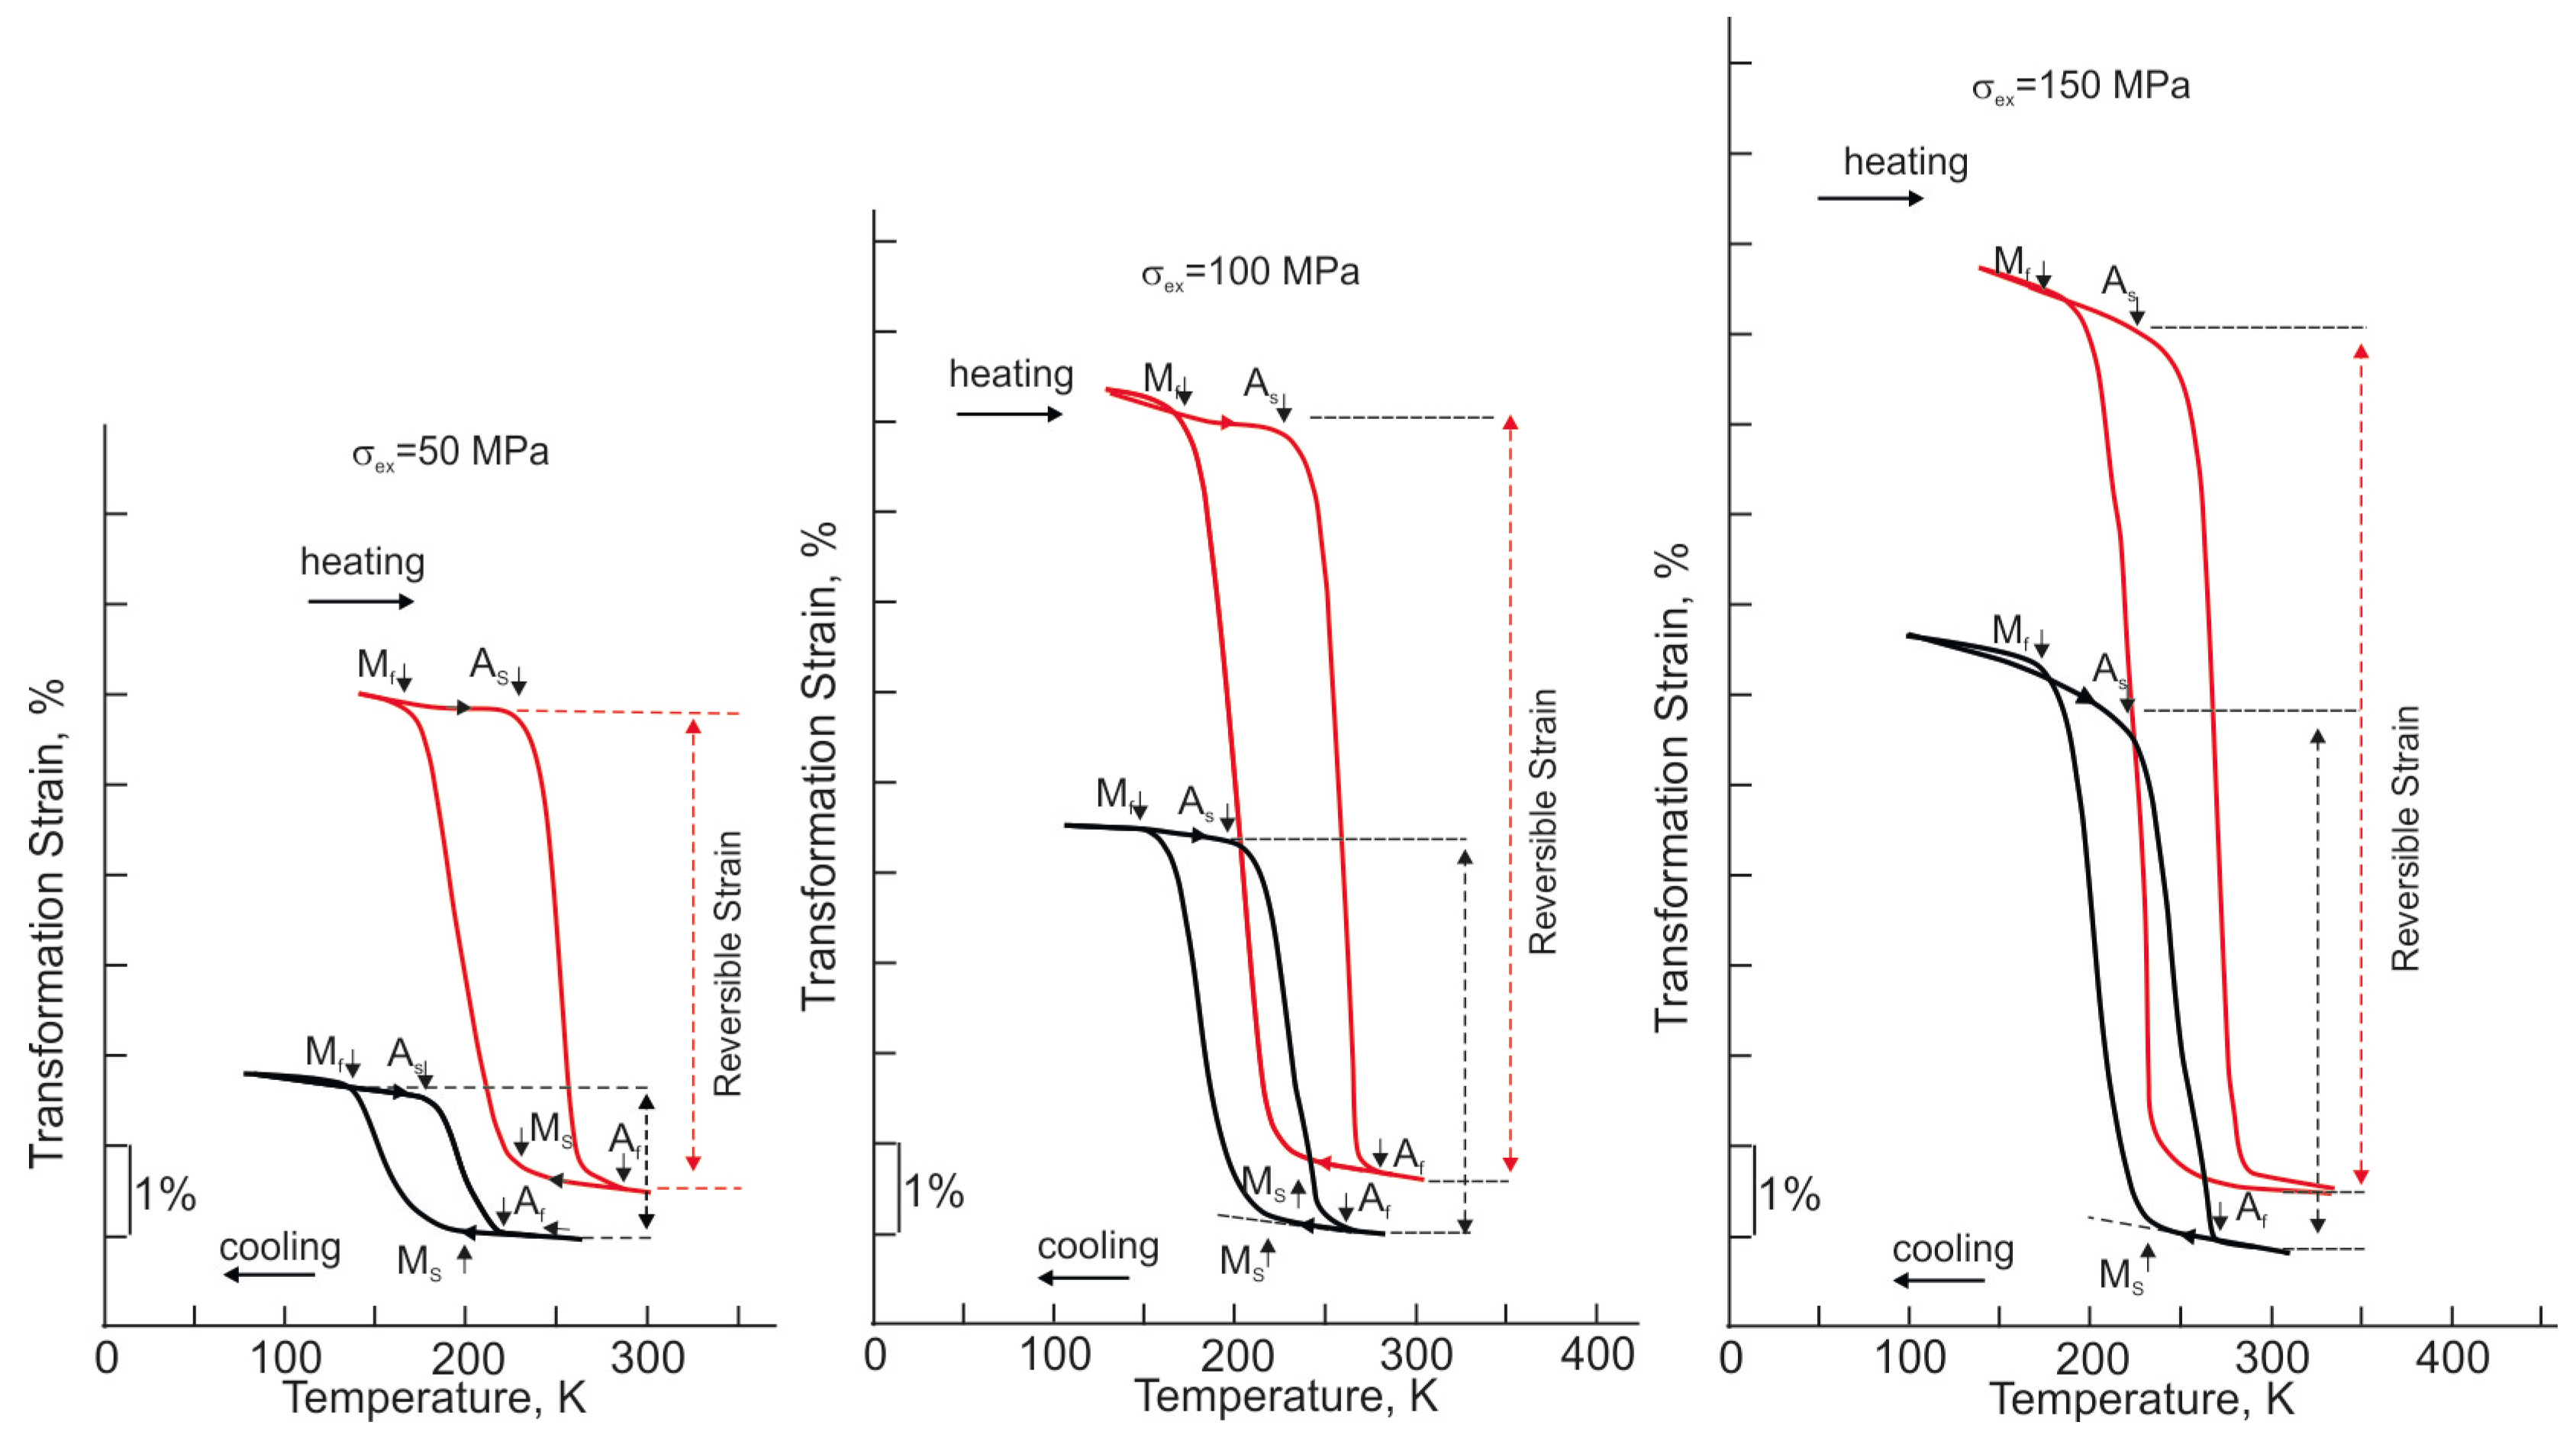
  • The SME value depended on the level of the external tensile stresses σex and current density. The maximum SME was εSME = 10.0 ± 0.2% at σex = 200 MPa in the hydrogen-free crystals; εSME = 10.5 ± 0.2% at σex = 300 MPa in crystals with hydrogen after hydrogenation at j = 1500 A/m2; and εSME = 8.0 ± 0.2% at σex = 200 MPa in crystals with hydrogen after hydrogenation at j = 3500 A/m2. At j = 1500 A/m2, when hydrogen was in solid solution, the maximum εSME = 10.5 ± 0.2% exceeded the theoretical value of lattice deformation ε0 = εCVP + εdet = 8.95% for B2-B19′ MT in [011] orientation under tension, which was associated with an increase in the plasticity of B19′ martensite upon hydrogenation. In the case of formation of TiH2 particles after hydrogenation at j = 3500 A/m2, the maximum εSME = 8.0 ± 0.2% was less than ε0. The physical reason for the decrease in the SME was due to the interaction of two types of B19’ martensite (oriented and non-oriented martensite), which inhibited the development of oriented B19′ martensite under stress during cooling and its reverse movement upon heating.
  • The long-term holding of samples for 168 h at 263 K after hydrogenation at j = 1500 A/m2 increases the SME relative to hydrogenated samples without long-term holding. The SME was 1.5 ± 0.2%, 4.5 ± 0.2% and 5.9 ± 0.2% without long-term holding, respectively, at σex = 50, 100 and 150 MPa. After long-term holding, the SME became 5.4 ± 0.2%, 8.3 ± 0.2% and 9.5 ± 0.2%, respectively, at σex = 50, 100 and 150 MPa. The physical reason for the increase in the SME after long-term holding was related to the redistribution of hydrogen in the bulk of the crystal and an increase in the plasticity of B19′ martensite.

Author Contributions

Conceptualization, I.V.K. and Y.I.C.; methodology, I.V.K. and Y.I.C.; validation, I.V.K.; formal analysis, I.V.K. and Y.I.C.; investigation, I.V.K., L.P.Y. and A.V.V.; writing—original draft preparation, I.V.K. and Y.I.C.; writing—review and editing, I.V.K. and Y.I.C.; supervision, Y.I.C.; and project administration, I.V.K. All authors have read and agreed to the published version of the manuscript.

Funding

The research was carried out with the support of a grant under the Decree of the Government of the Russian Federation No. 220 of 9 April 2010 (Agreement No. 075-15-2021-612 of 4 June 2021) and by the Tomsk State University Development Programme (Priority-2030). Work was conducted with the application of equipment of the Tomsk Regional Core Shared Research Facilities Centre of National Research Tomsk State University.

Institutional Review Board Statement

Not applicable.

Informed Consent Statement

Not applicable.

Data Availability Statement

Data are available from the corresponding author on reasonable request.

Conflicts of Interest

The authors declare no conflict of interest.

References

  1. Shtremel, M.A. Prochnost Splavov, Part II; MISIS, RF: Moscow, Russia, 1997; p. 527. (In Russian) [Google Scholar]
  2. Astafurova, E.; Reunova, K.; Melnikov, E.; Panchenko, M.; Astafurov, S.; Maier, G.; Moskvina, V. On the difference in carbon- and nitrogen-alloying of equiatomic FeMnCrNiCo high-entropy alloy. Mater. Lett. 2020, 276, 128183. [Google Scholar] [CrossRef]
  3. Astafurova, E.G.; Panchenko, M.Y.; Reunova, K.A.; Mikhno, A.S.; Moskvina, V.A.; Melnikov, E.V.; Astafurov, S.V.; Maier, H.J. The effect of nitrogen alloying on hydrogen-assisted plastic deformation and fracture in FeMnNiCoCr high-entropy alloys. Scripta Mater. 2021, 194, 113642. [Google Scholar] [CrossRef]
  4. Semenyuk, A.; Klimova, M.; Shaysultanov, D.; Salishchev, G.; Zherebtsov, S.; Stepanov, N. Effect of nitrogen on microstructure and mechanical properties of the CoCrFeMnNi high-entropy alloy after cold rolling and subsequent annealing. J. Alloys Compd. 2021, 888, 161452. [Google Scholar] [CrossRef]
  5. Pelton, A.R.; Trepanier, C.; Gong, X.-Y.; Wick, A.; Chen, K.C. Structural and diffusional effects of hydrogen in TiNi. In Proceedings of the ASM Materials & Processes for Medical Devices Conference 2003, Anaheim, CA, USA, 8–10 September 2003; Shrivastava, S., Ed.; ASM International: Almere, The Netherlands; 2003; pp. 285–289. [Google Scholar]
  6. Pelton, B.L.; Slater, T.; Pelton, A.R. Effect of hydrogen in TiNi. In Proceedings of the 2nd International Conference on Shape Memory and Superplastic Technologies SMST-97, Asilomar Conference Center, Pacific Grove, CA, USA, 2–6 March 1997; Pelton, A., Hodsgson, D., Eds.; pp. 395–400. [Google Scholar]
  7. Yokoyama, K.; Ogawa, T.; Asaoka, K.; Sakai, J.; Nagumo, M. Degradation of tensile strength of Ni-Ti superelastic alloy due to hydrogen absorption in methanol solution containing hydrochloric acid. Mater. Sci. Eng. A 2003, 360, 153–159. [Google Scholar] [CrossRef]
  8. Kireeva, I.V.; Chumlyakov, Y.I.; Yakovleva, L.P.; Vyrodova, A.V. Hydrogen’s Effect on the shape memory effect of TiNi alloy single crystals. Metals 2023, 13, 1324. [Google Scholar] [CrossRef]
  9. Lotkov, A.; Baturin, A.; Grishkov, V.; Rodionov, I.; Kudiyarov, V.; Lider, A. Effect of hydrogen on superelasticity of the titanium nickelide-based alloy. AIP Conf. Proc. 2015, 1683, 020124. [Google Scholar] [CrossRef]
  10. Baturin, A.; Lotkov, A.; Grishkov, V.; Rodionov, I.; Kabdylkakov, Y.; Kudiiarov, V. The Effect of hydrogen on martensite transformations and the state of hydrogen atoms in binary TiNi-based alloy with different grain sizes. Materials 2019, 12, 3956. [Google Scholar] [CrossRef] [PubMed] [Green Version]
  11. Grishkov, V.; Lotkov, A.; Zhapova, D.; Mironov, Y.; Timkin, V.; Barmina, E.; Kashina, O. Structure and phase state of Ti49.4Ni50.6 (at%) hydrogenated in normal saline. Materials 2021, 14, 7046. [Google Scholar] [CrossRef]
  12. Baturin, A.; Lotkov, A.; Grishkov, V.; Rodionov, I.; Kudiiarov, V. Effect of hydrogen redistribution during aging on the structure and phase state of nanocrystalline and coarse-grained TiNi alloys. J. Alloys Compd. 2018, 751, 359–363. [Google Scholar] [CrossRef]
  13. Spivak, L.V. Synergy effects in the deformation response of thermodynamically open metal-hydrogen systems. Phys.-Uspekhi 2008, 51, 863–886. [Google Scholar] [CrossRef]
  14. Shorshorov, M.H.; Stepanov, I.A.; Flomenblit, Y.M.; Travkin, V.V. Phase and structural transformations caused by hydrogen in alloys based on titanium nickelide. Phys. Met. Met. 1985, 60, 326–333. [Google Scholar]
  15. Stepanov, I.A.; Flomenblit, Y.M.; Zaymovskiy, V.A. Effect of hydrogen on the temperature of thermoelastic martensitic transformation in Titanium Nickel. Phys. Met. Met. 1983, 55, 612–614. [Google Scholar]
  16. Rotini, A.; Biscarini, A.; Campanella, R.; Coluzzi, B.; Mazzolai, G.; Mazzolai, F. Martensitic transition in a Ni40Ti50Cu10 alloy containing hydrogen: Calorimetric (DSC) and mechanical spectroscopy experiments. Scr. Mater. 2001, 44, 719–724. [Google Scholar] [CrossRef]
  17. Kireeva, I.; Platonova, Y.; Chumlyakov, Y. Effect of hydrogen on the two-way shape memory effect in TiNi single crystals. Mater. Today Proc. 2017, 4, 4773–4777. [Google Scholar] [CrossRef]
  18. Otsuka, K.; Wayman, C.M. Shape Memory Materials; Cambridge University Press: Cambridge, UK, 1998; p. 284. [Google Scholar]
  19. Otsuka, K.; Ren, X. Physical metallurgy of Ti-Ni-based shape memory alloys. Prog. Mater. Sci. 2005, 50, 511–678. [Google Scholar] [CrossRef]
  20. Resnina, N.; Palani, I.; Belyaev, S.; Prabu, S.M.; Liulchak, P.; Karaseva, U.; Manikandan, M.; Jayachandran, S.; Bryukhanova, V.; Sahu, A.; et al. Structure, martensitic transformations and mechanical behaviour of NiTi shape memory alloy produced by wire arc additive manufacturing. J. Alloys Compd. 2020, 851, 156851. [Google Scholar] [CrossRef]
  21. Sehitoglu, H.; Hamilton, R.; Canadinc, D.; Zhang, X.Y.; Gall, K.; Karaman, I.; Chumlyakov, Y.; Maier, H.J. Detwinning in NiTi alloys. Met. Mater. Trans. A 2003, 34, 5–13. [Google Scholar] [CrossRef]
  22. Kireeva, I.; Chumlyakov, Y.; Pobedennaya, Z.; Saraeva, A. Orientation dependence and tension-compression asymmetry of shape memory effect in Ti50Ni40Cu10 single crystals. Mater. Sci. Eng. A 2021, 832, 142468. [Google Scholar] [CrossRef]
  23. Kireeva, I.; Pobedennaya, Z.; Chumlyakov, Y.; Marchenko, E. Effect of stress-induced martensite ageing on the one-way and two-way shape memory effect of [011]-oriented TiNiCu crystals under tension. Mater. Lett. 2021, 305, 130773. [Google Scholar] [CrossRef]
  24. Sidharth, R.; Mohammed, A.S.K.; Abuzaid, W.; Sehitoglu, H. Unraveling frequency effects in shape memory alloys: NiTi and FeMnAlNi. Shap. Mem. Syperelasticity 2021, 7, 235–249. [Google Scholar] [CrossRef]
  25. Chumlyakov, Y.I.; Kireeva, I.V.; Pobedennaya, Z.V.; Yakovleva, L.P.; Vyrodova, A.V.; Kuksgauzen, I.V. Orientation dependence of shape memory effect and superelasticity in (TiZrHf)50Ni25Co10Cu15 high-entropy alloy single crystals. Shape Mem. Superelasticity 2023, 9, 300–312. [Google Scholar] [CrossRef]
  26. Kireeva, I.V.; Chumlyakov, Y.I.; Pobedennaya, Z.V.; Vyrodova, A.V.; Saraeva, A.A. High-strength behavior of the Al0.3CoCrFeNi high-entropy alloy single crystals. Metals 2020, 10, 1149. [Google Scholar] [CrossRef]
  27. Gwalani, B.; Soni, V.; Lee, M.; Mantri, S.; Ren, Y.; Banerjee, R. Optimizing the coupled effects of Hall-Petch and precipitation strengthening in a Al 0.3 CoCrFeNi high entropy alloy. Mater. Des. 2017, 121, 254–260. [Google Scholar] [CrossRef]
  28. Nembach, E. Particle Strengthening of Metals and Alloys; John Wiley & Sons, Inc.: New York, NY, USA, 1997; 285p. [Google Scholar]
  29. He, J.Y.; Gao, K.W.; Su, Y.J.; Qiao, L.J.; Chu, W.Y. The effect of hydride and martensite on the fracture toughness of TiNi shape memory alloy. Smart Mater. Struct. 2004, 13, N24–N28. [Google Scholar] [CrossRef]
  30. Yokoyama, K.; Ogawa, T.; Takashima, K.; Asaoka, K.; Sakai, J. Hydrogen embrittlement of Ni-Ti superelastic alloy aged at room temperature after hydrogen charging. Mater. Sci. Eng. A 2007, 466, 106–113. [Google Scholar] [CrossRef]
Figure 1. (a)—Microdiffraction pattern after hydrogenation at j = 1500 A/m2, showing only reflexes of the B2 phase; zone axis (110)B2 and (b)—bright-field image of titanium hydride TiH2 particle after hydrogenation at j = 3500 A/m2 and the corresponding microdiffraction pattern from particles of the [011]-oriented Ti-50.55Ni alloy single crystals.
Metals 13 01412 g001
Figure 2. Temperature dependence of 0.1% offset yield stress of the [011]-oriented Ti-50.55Ni alloy single crystals under tension. Inset, shows the selected area at a larger scale.
Metals 13 01412 g002
Figure 3. “Transformation strain—temperature” curves under different tensile stresses of the [011]-oriented Ti-50.55Ni alloy single crystals: (a)—hydrogen-free crystals; (b)—after hydrogenation for 3 h at a current density of 1500 A/m2 at room temperature; and (c)—after hydrogenation for 3 h at a current density of 3500 A/m2 at room temperature.
Metals 13 01412 g003
Figure 4. Reversible and irreversible strain under different tensile stresses of the [011]-oriented Ti-50.55Ni alloy single crystals. The dotted line shows the theoretical value of the lattice deformation ε0 = εCVP + εdet = 8.95% for the [011] orientation to B2-B19′ MT under tension.
Metals 13 01412 g004
Figure 5. Ms temperature under different tensile stresses for the [011]-oriented Ti-50.55Ni alloy single crystals.
Metals 13 01412 g005
Figure 6. Dislocations in B2 phase in hydrogen-free crystals (a) with corresponding diffraction patters (b) and after hydrogenation at j = 1500 A/m2 (c); TiH2 particles and non-oriented B19′ martensite, which generate near particles after hydrogenation at j = 3500 A/m2 (df) with corresponding diffraction patters (e) in the [011]-oriented Ti-50.55Ni alloy single crystals.
Metals 13 01412 g006
Figure 7. Fracture surface of the [011]-oriented Ti-50.55Ni alloy single crystals after SME experiment: (a)—hydrogen-free crystals, σex = 250 MPa; (b)—after hydrogenation at j = 1500 A/m2, σex = 300 MPa; and (c)—after hydrogenation at j = 3500 A/m2, σex = 200 MPa.
Metals 13 01412 g007
Figure 8. “Transformation strain—temperature” curves under different tensile stresses of the [011]-oriented Ti-50.55Ni alloy single crystals: black curves show SME after hydrogenation at j = 1500 A/m2 without long-term holding; red curves show SME after hydrogenation at j = 1500 A/m2 and long-term holding for 168 h at 263 K.
Metals 13 01412 g008
Table 1. Martensitic transformation temperatures depend on the current density of hydrogenation.
StateConcentration H2, wppmConcentration H2, at.%Ms, KMf, KAs, KAf, KTh1 = AfMs, KTh2 = AsMf, K
Without H2002241822222583440
With H2,
j = 1500 A/m2
100 ± 20~0.52051702152554045
With H2,
j = 3500 A/m2
500 ± 20~2.52131702152594645
Disclaimer/Publisher’s Note: The statements, opinions and data contained in all publications are solely those of the individual author(s) and contributor(s) and not of MDPI and/or the editor(s). MDPI and/or the editor(s) disclaim responsibility for any injury to people or property resulting from any ideas, methods, instructions or products referred to in the content.

