Statistically Modeling the Fatigue Life of Copper and Aluminum Wires Using Archival Data
Abstract
1. Introduction
2. Materials and Methods
3. Results
3.1. S-N Modeling
3.1.1. Annealed Electrolytic Copper Wire
3.1.2. Annealed Aluminum Wire
3.2. cdf Modeling
3.2.1. Annealed Electrolytic Copper Wire
3.2.2. Annealed Aluminum Wire
3.3. Time-Dependent Modeling
3.3.1. Annealed Electrolytic Copper Wire
3.3.2. Annealed Aluminum Wire
4. Discussion
5. Conclusions
Funding
Data Availability Statement
Conflicts of Interest
References
- Shimokawa, T.; Hamaguchi, Y. Relationship between Fatigue Life Distribution, Notch Configuration, and S–N Curve of a 2024–T4 Aluminum Alloy. J. Eng. Mater. Technol. 1985, 107, 214–220. [Google Scholar] [CrossRef]
- Schütz, W. A History of Fatigue. Eng. Fract. Mech. 1996, 54, 263–300. [Google Scholar] [CrossRef]
- Wöhler, A. Versuche zur Ermittlung der auf die Eisenbahnwagenachsen einwirkenden Kräfte und die Widerstandsfähigkeit der Wagen-Achsen. Z. Für Bauwes. 1860, 10, 583–616. [Google Scholar]
- Moore, H.F.; Kommers, J.B. The Fatigue of Metals; McGraw-Hill: New York, NY, USA, 1927; pp. 168–170. [Google Scholar]
- Ravilly, E. Contribution a l’etude de la rupture des fils metalliques soumis à des torsions alternees. Publ. Sci. Et Tech. Du Minist. De L’air 1938, 120, 52–70. [Google Scholar]
- Freudenthal, A.M. Planning and Interpretation of fatigue Tests. In Symposium on Statistical Aspects of Fatigue; ASTM STP 121; American Society for Testing Materials: Philadelphia, PA, USA, 1951; pp. 3–13. [Google Scholar]
- Freudenthal, A.M.; Gumbel, E.J. Statistical Interpretation of Fatigue Tests. Proc. R. Soc. A 1953, 216, 309–332. [Google Scholar]
- Freudenthal, A.M.; Gumbel, E.J. Minimum Life in Fatigue. J. Am. Stat. Assoc. 1954, 49, 575–597. [Google Scholar] [CrossRef]
- Gumbel, E.J. Étude statistique de la fatigue des matériaux. Rev. De Stat. Appliquée 1957, 5, 51–86. [Google Scholar]
- Dieter, G.E.; Mehl, R.F. Investigation of the Statistical Nature of the Fatigue of Metals; Technical Note 3019; National Advisory Committee for Aeronautics: Washington, DC, USA, 1953. [Google Scholar]
- Stagg, A.M. An Investigation of the Scatter in Constant Amplitude Fatigue Test Results of Aluminium Alloys 2024 and 7075; Ministry of Technology, Aeronautical Research Council: Current Papers 1093; Her Majesty’s Stationery Office: London, UK, 1970. [Google Scholar]
- Kesling, G.D.; Whittaker, I.C. A Simulation Model of Railroad Reliability. Simulation 1985, 44, 168–180. [Google Scholar] [CrossRef]
- Ratnaparkhi, M.V.; Park, W.J. Lognormal Distribution-Model for Fatigue Life and Residual Strength of Composite Materials. IEEE Trans. Rel. 1986, 35, 312–315. [Google Scholar] [CrossRef]
- Zheng, X.-L.; Lü, B.; Jiang, H. Determination of Probability Distribution of Fatigue Strength and Expressions of P-S-N Curves. Eng. Fract. Mech. 1995, 50, 483–491. [Google Scholar] [CrossRef]
- Ramamurty, R.P.; Rajesh, S.; Satyanarayana, B.; Ramji, K. Statistical Analysis of Fatigue Life Data of A356.2-T6 Aluminum Alloy. Tech Sci. Press SDHM 2011, 7, 139–152. [Google Scholar]
- Bazaras, Ž.; Lukoševičius, V. Statistical Assessment of Low-Cycle Fatigue Durability. Symmetry 2022, 14, 1205. [Google Scholar] [CrossRef]
- Weibull, W. A Statistical Theory of the Strength of Materials. Ing. Vetenskaps. Handl. 1939, 151, 1–45. [Google Scholar]
- Weibull, W. A Statistical Distribution Function of Wide Applicability. J. Appl. Mech. Trans. ASME 1951, 18, 293–297. [Google Scholar] [CrossRef]
- Fréchet, M. Sur la loi de probabilité de l’écart maximum. Ann. De La Société Pol. De Math. 1927, 6, 93–116. [Google Scholar]
- Fisher, R.A.; Tippett, L.H.C. Limiting Forms of the Frequency Distribution of the Largest or Smallest Member of a Sample. Proc. Cambridge Philos. Soc. 1928, 24, 180–190. [Google Scholar] [CrossRef]
- Gnedenko, B.V. Sur la Distribution Limite du Terme Maximum d’une Série Aléatoire. Ann. Math. 1943, 44, 423–453. [Google Scholar] [CrossRef]
- Bolotin, V.V. Statistical Methods in Structural Mechanics; Holden-Day, Inc.: San Francisco, CA, USA, 1969; pp. 71–77. [Google Scholar]
- Strzelecki, P. Determination of Fatigue Life for Low Probability of Failure for Different Stress Levels using 3-parameter Weibull Distribution. Int. J. Fatigue 2021, 145, 106080. [Google Scholar] [CrossRef]
- Zhao, Y.X.; Gao, Q.; Wang, J.N. An Approach for Determining an Appropriate Assumed Distribution of Fatigue Life Under Limited Data. Reliab. Eng. Syst. Saf. E 2000, 67, 1–7. [Google Scholar] [CrossRef]
- Tosha, K.; Ueda, D.; Shimoda, H.; Shimizu, S. A Study on P-S-N Curve for Rotating Bending Fatigue Test for Bearing Steel. Tribol. Trans. 2008, 51, 166–172. [Google Scholar] [CrossRef]
- Zhao, Y.X.; Liu, H.B. Weibull Modeling of the Probabilistic S-N Curves for Rolling Contact Fatigue. Int. J. Fatigue 2014, 66, 47–54. [Google Scholar] [CrossRef]
- Kracík, J.; Strnadel, B. A Statistical Model for Lifespan Prediction of Large Steel Structures. Eng. Struct. 2018, 176, 20–27. [Google Scholar] [CrossRef]
- Lan, C.; Bai, N.; Yang, H.; Liu, C.; Li, H.; Spencer, B.F. Weibull Modeling of the Fatigue Life for Steel Rebar Considering Corrosion Effects. Int. J. Fatigue 2018, 111, 134–143. [Google Scholar] [CrossRef]
- Hoole, J.; Sartor, P.; Booker, J.; Cooper, J.; Gogouvitis, X.V.; Schmidt, R.K. Systematic Sstatistical Characterisation of Stress-Life Datasets Using 3-Parameter Distributions. Int. J. Fatigue 2019, 129, 105216. [Google Scholar] [CrossRef]
- Diniz, B.D.C.; Júnior, R.C.S.F. Study of the Fatigue Behavior of Composites Using Modular ANN with the Incorporation of a Posteriori Failure Probability. Int. J. Fatigue 2020, 131, 105357. [Google Scholar] [CrossRef]
- Barbosa, J.F.; Correia, J.A.F.O.; Júnior, R.C.S.F.; Zhu, S.-P.; De Jesus, A.M.P. Probabilistic S-N Fields Based on Statistical Distributions Applied to Metallic and Composite Materials: State of the Art. Adv. Mech. Eng. 2019, 11, 1687814019870395. [Google Scholar] [CrossRef]
- Lia, C.; Wua, S.; Zhang, J.; Xie, L.; Zhang, Y. Determination of the Fatigue P-S-N Curves—A Critical Review and Improved Backward Statistical Inference Method. Int. J. Fatigue 2020, 139, 105789. [Google Scholar] [CrossRef]
- Hanaki, S.; Yamashita, M.; Uchida, H.; Zako, M. On Stochastic Evaluation of S-N Data Based on Fatigue Strength Distribution. Int. J. Fatigue 2010, 32, 605–609. [Google Scholar] [CrossRef]
- Fouchereau, R.; Celeux, G.; Pamphile, P. Probabilistic Modeling of S-N Curve. Int. J. Fatigue 2014, 68, 217–223. [Google Scholar] [CrossRef]
- Júnior, R.C.S.F.; Belísio, A.S. Probabilistic S-N Curves Using Exponential and Power Laws Equations. Compos. Part B Eng. 2014, 56, 582–590. [Google Scholar] [CrossRef]
- Bai, X.; Zhang, P.; Zhang, Z.J.; Liu, R.; Zhang, Z.F. New Method for Determining P-S-N Curves in Terms of Equivalent Fatigue Lives. Fatigue Fract. Eng. Mater. Struct. 2019, 42, 2340–2353. [Google Scholar] [CrossRef]
- Shimizu, S.; Tosha, K.; Tsuchiya, K. New Data Analysis of Probabilistic Stress-Life (P-SN) Curve and Its Application for Structural Materials. Int. J. Fatigue 2010, 32, 565–575. [Google Scholar] [CrossRef]
- Ling, J.; Pan, J. A Maximum Likelihood Method for Estimating P-S-N Curves. Int. J. Fatigue 1997, 19, 415–419. [Google Scholar] [CrossRef]
- Leonetti, D.; Maljaars, J.; Snijder, H.H.B. Fitting Fatigue Test Data with a Novel S-N Curve Using Frequentist and Bayesian Inference. Int. J. Fatigue 2017, 105, 128–143. [Google Scholar] [CrossRef]
- Guida, M.; Penta, F. A Bayesian Analysis of Fatigue Data. Struct. Saf. 2010, 32, 64–76. [Google Scholar] [CrossRef]
- Liu, X.W.; Lu, D.G.; Hoogenboom, P.C.J. Hierarchical Bayesian Fatigue Data Analysis. Int. J. Fatigue 2017, 100, 418–428. [Google Scholar] [CrossRef]
- Liu, X.W.; Lu, D.G. Survival Analysis of Fatigue Data: Application of Generalized Linear Models and Hierarchical Bayesian Model. Int. J. Fatigue 2018, 117, 39–46. [Google Scholar] [CrossRef]
- Júnior, R.C.S.F.; Neto, A.D.D.; Aquino, E.M.F. Building of Constant Life Diagrams of Fatigue Using Artificial Neural Networks. Int. J. Fatigue 2005, 27, 746–751. [Google Scholar] [CrossRef]
- Bučar, T.; Nagode, M.; Fajdiga, M. A Neural Network Approach to Describing the Scatter of S-N Curves. Int. J. Fatigue 2006, 28, 311–323. [Google Scholar] [CrossRef]
- Barbosa, J.F.; Correia, J.A.F.O.; Júnior, R.C.S.F.; Jesus, A.M.P.D. Fatigue Life Prediction of Metallic Materials Considering Mean Stress Effects by Means of an Artificial Neural Network. Int. J. Fatigue 2020, 135, 105527. [Google Scholar] [CrossRef]
- Jimenez-Martinez, M. Fatigue of Offshore Structures: A Review of Statistical Fatigue Damage Assessment for Stochastic Loadings. Int. J. Fatigue 2020, 132, 105327. [Google Scholar] [CrossRef]
- Zhan, Z.; Li, H. Machine Learning Based Fatigue Life Prediction with Effects of Additive Manufacturing Process Parameters for Printed SS 316L. Int. J. Fatigue 2021, 142, 105941. [Google Scholar] [CrossRef]
- Luo, Y.W.; Zhang, B.; Feng, X.; Song, Z.M.; Qi, X.B.; Li, C.P.; Chen, G.F.; Zhang, G.P. Pore-Affected Fatigue Life Scattering and Prediction of Additively Manufactured Inconel 718: An Investigation Based on Miniature Specimen Testing and Machine Learning Approach. Mater. Sci. Eng. A 2021, 802, 140693. [Google Scholar] [CrossRef]
- Chen, J.; Liu, Y. Probabilistic Physics-Guided Machine Learning for Fatigue Data Analysis. Expert Syst. Appl. 2021, 168, 114316. [Google Scholar] [CrossRef]
- Hooda, R.; Joshi, V.; Shah, M. A Comprehensive Review of Approaches to Detect Fatigue Using Machine Learning Techniques. Chronic Dis. Transl. Med. 2021, in press. [CrossRef]
- Zhang, J.; Zhu, J.; Guo, W.; Guo, W. A Machine Learning-Based Approach to Predict the Fatigue Life of Three-Dimensional Cracked Specimens. Int. J. Fatigue 2022, 159, 106808. [Google Scholar] [CrossRef]
- Braun, M.; Kellner, L.; Schreiber, S.; Ehlers, S. Prediction of Fatigue Failure in Small-Scale Butt-Welded Joints with Explainable Machine Learning. Procedia Struct. 2022, 38, 182–191. [Google Scholar] [CrossRef]
- Zhan, Z.; Ao, N.; Hu, Y.; Liu, C. Defect-Induced Fatigue Scattering and Assessment of Additively Manufactured 300M-AerMet100 Steel: An Investigation Based on Experiments and Machine Learning. Eng. Fract. Mech. 2022, 264, 108352. [Google Scholar] [CrossRef]
- Qian, G.; Lei, W.-S. A Statistical Model of Fatigue Failure Incorporating Effects of Specimen Size and Load Amplitude on Fatigue Life. Philos. Mag. A Mater. Sci. 2019, 99, 2089–2125. [Google Scholar] [CrossRef]
- Ai, Y.; Zhu, S.P.; Liao, D.; Correia, J.A.F.O.; Souto, C.; De Jesus, A.M.P.; Keshtegar, B. Probabilistic Modeling of Fatigue Life Distribution and Size Effect of Components with Random Defects. Int. J. Fatigue 2019, 126, 165–173. [Google Scholar] [CrossRef]
- Huang, J.; Meng, Q.; Zhan, Z.; Hu, W.; Shen, F. Damage Mechanics-Based Approach to Studying Effects of Overload on Fatigue Life of Notched Specimens. Int. J. Damage Mech. 2019, 28, 538–565. [Google Scholar] [CrossRef]
- Chai, T.; Draxler, R.R. Root Mean Square Error (RMSE) or Mean Average Error (MAE)?—Arguments Against Avoiding RMSE in the Literature. Geosci. Model Dev. 2014, 7, 1247–1250. [Google Scholar] [CrossRef]
- Ross, S. Introduction to Probability and Statistics for Engineers and Scientists, 4th ed.; Elsevier: London, UK, 2009. [Google Scholar]
- Manson, S.S. A Simple Procedure for Estimating High-Temperature Low-Cycle Fatigue. Exp. Mech. 1968, 8, 349–355. [Google Scholar] [CrossRef]
- Manson, S.S.; Halford, G.R. Practical Implementation of the Double Linear Damage Rule and Damage Curve Approach for Treating Cumulative Fatigue Damage. Int. J. Fract 1981, 17, 169–192. [Google Scholar] [CrossRef]
- Harlow, D.G. Low Cycle Fatigue: Probability and Statistical Modeling of Fatigue Life. In Proceedings of the ASME 2014 Pressure Vessels and Piping Conference, Anaheim, CA, USA, 20–24 July 2014; PVP2014-28114, V06BT06A045. ISBN 978-0-7918-4604-9. [Google Scholar]
- Klemenc1, J.; Podgornik, B. An Improved Model for Predicting the Scattered S-N Curves. J. Mech. Eng./Stroj. Vestn. 2019, 65, 265–275. [Google Scholar] [CrossRef]
- Mann, N.R.; Schafer, R.E.; Singpurwalla, N.D. Methods for Statistical Analysis of Reliability and Life Data; Wiley: New York, NY, USA, 1974. [Google Scholar]
- Harlow, D.G. The Effect of Proof-Testing on the Weibull Distribution. J. Mater. Sci. 1989, 24, 1467–1473. [Google Scholar] [CrossRef]
- Harlow, D.G. Fatigue Life Estimation with Censored Data. Int. J. Fatigue 2020, 141, 105899. [Google Scholar] [CrossRef]
- Coleman, B.D. Time Dependence of Mechanical Breakdown Phenomena. J. Appl. Phys. 1956, 27, 862–866, Erratum in J. Appl. Phys. 1957, 28, 1514. [Google Scholar] [CrossRef]
- Coleman, B.D. Time Dependence of Mechanical Breakdown in Bundles of Fibers. I. Constant Total Load. J. Appl. Phys. 1957, 28, 1058–1064. [Google Scholar] [CrossRef]
- Coleman, B.D.; Marquardt, D.W. Time Dependence of Mechanical Breakdown in Bundles of Fibers. II. The Infinite Ideal Bundle under Linearly Increasing Loads. J. Appl. Phys. 1957, 28, 1065–1067. [Google Scholar] [CrossRef]
- Coleman, B.D. Statistics and Time Dependence of Mechanical Breakdown in Fibers. J. Appl. Phys. 1958, 29, 968–983. [Google Scholar] [CrossRef]
- Coleman, B.D.; Marquardt, D.W. Time Dependence of Mechanical Breakdown in Bundles of Fibers. IV. Infinite Ideal Bundle under Oscillating Loads. J. Appl. Phys. 1958, 29, 1091–1099. [Google Scholar] [CrossRef]
- Coleman, B.D. Time Dependence of Mechanical Breakdown in Bundles of Fibers. V. Fibers of Class A-2. J. Appl. Phys. 1959, 30, 720–724. [Google Scholar] [CrossRef]
- Phoenix, S.L. Stochastic Strength and Fatigue of Fiber Bundles. Int. J. Fract. 1978, 13, 327–344. [Google Scholar] [CrossRef]
- Harlow, D.G. Probability Versus Statistical Modeling: Examples from Fatigue Life Prediction. Int. J. Reliab. Qual. 2005, 12, 535–550. [Google Scholar] [CrossRef]
- Harlow, D.G. Generalized Probability Distributions for Accelerated Life Modeling. SAE Int. J. Mater. Manuf. 2011, 4, 980–991. [Google Scholar] [CrossRef]
- Harlow, D.G. Fatigue Life Modeling Using Nitinol Data. In Proceedings of the ASME 2020 Pressure Vessels & Piping Conference, Virtual, 3 August 2020; Volume 83815, p. V001T01A025. [Google Scholar] [CrossRef]
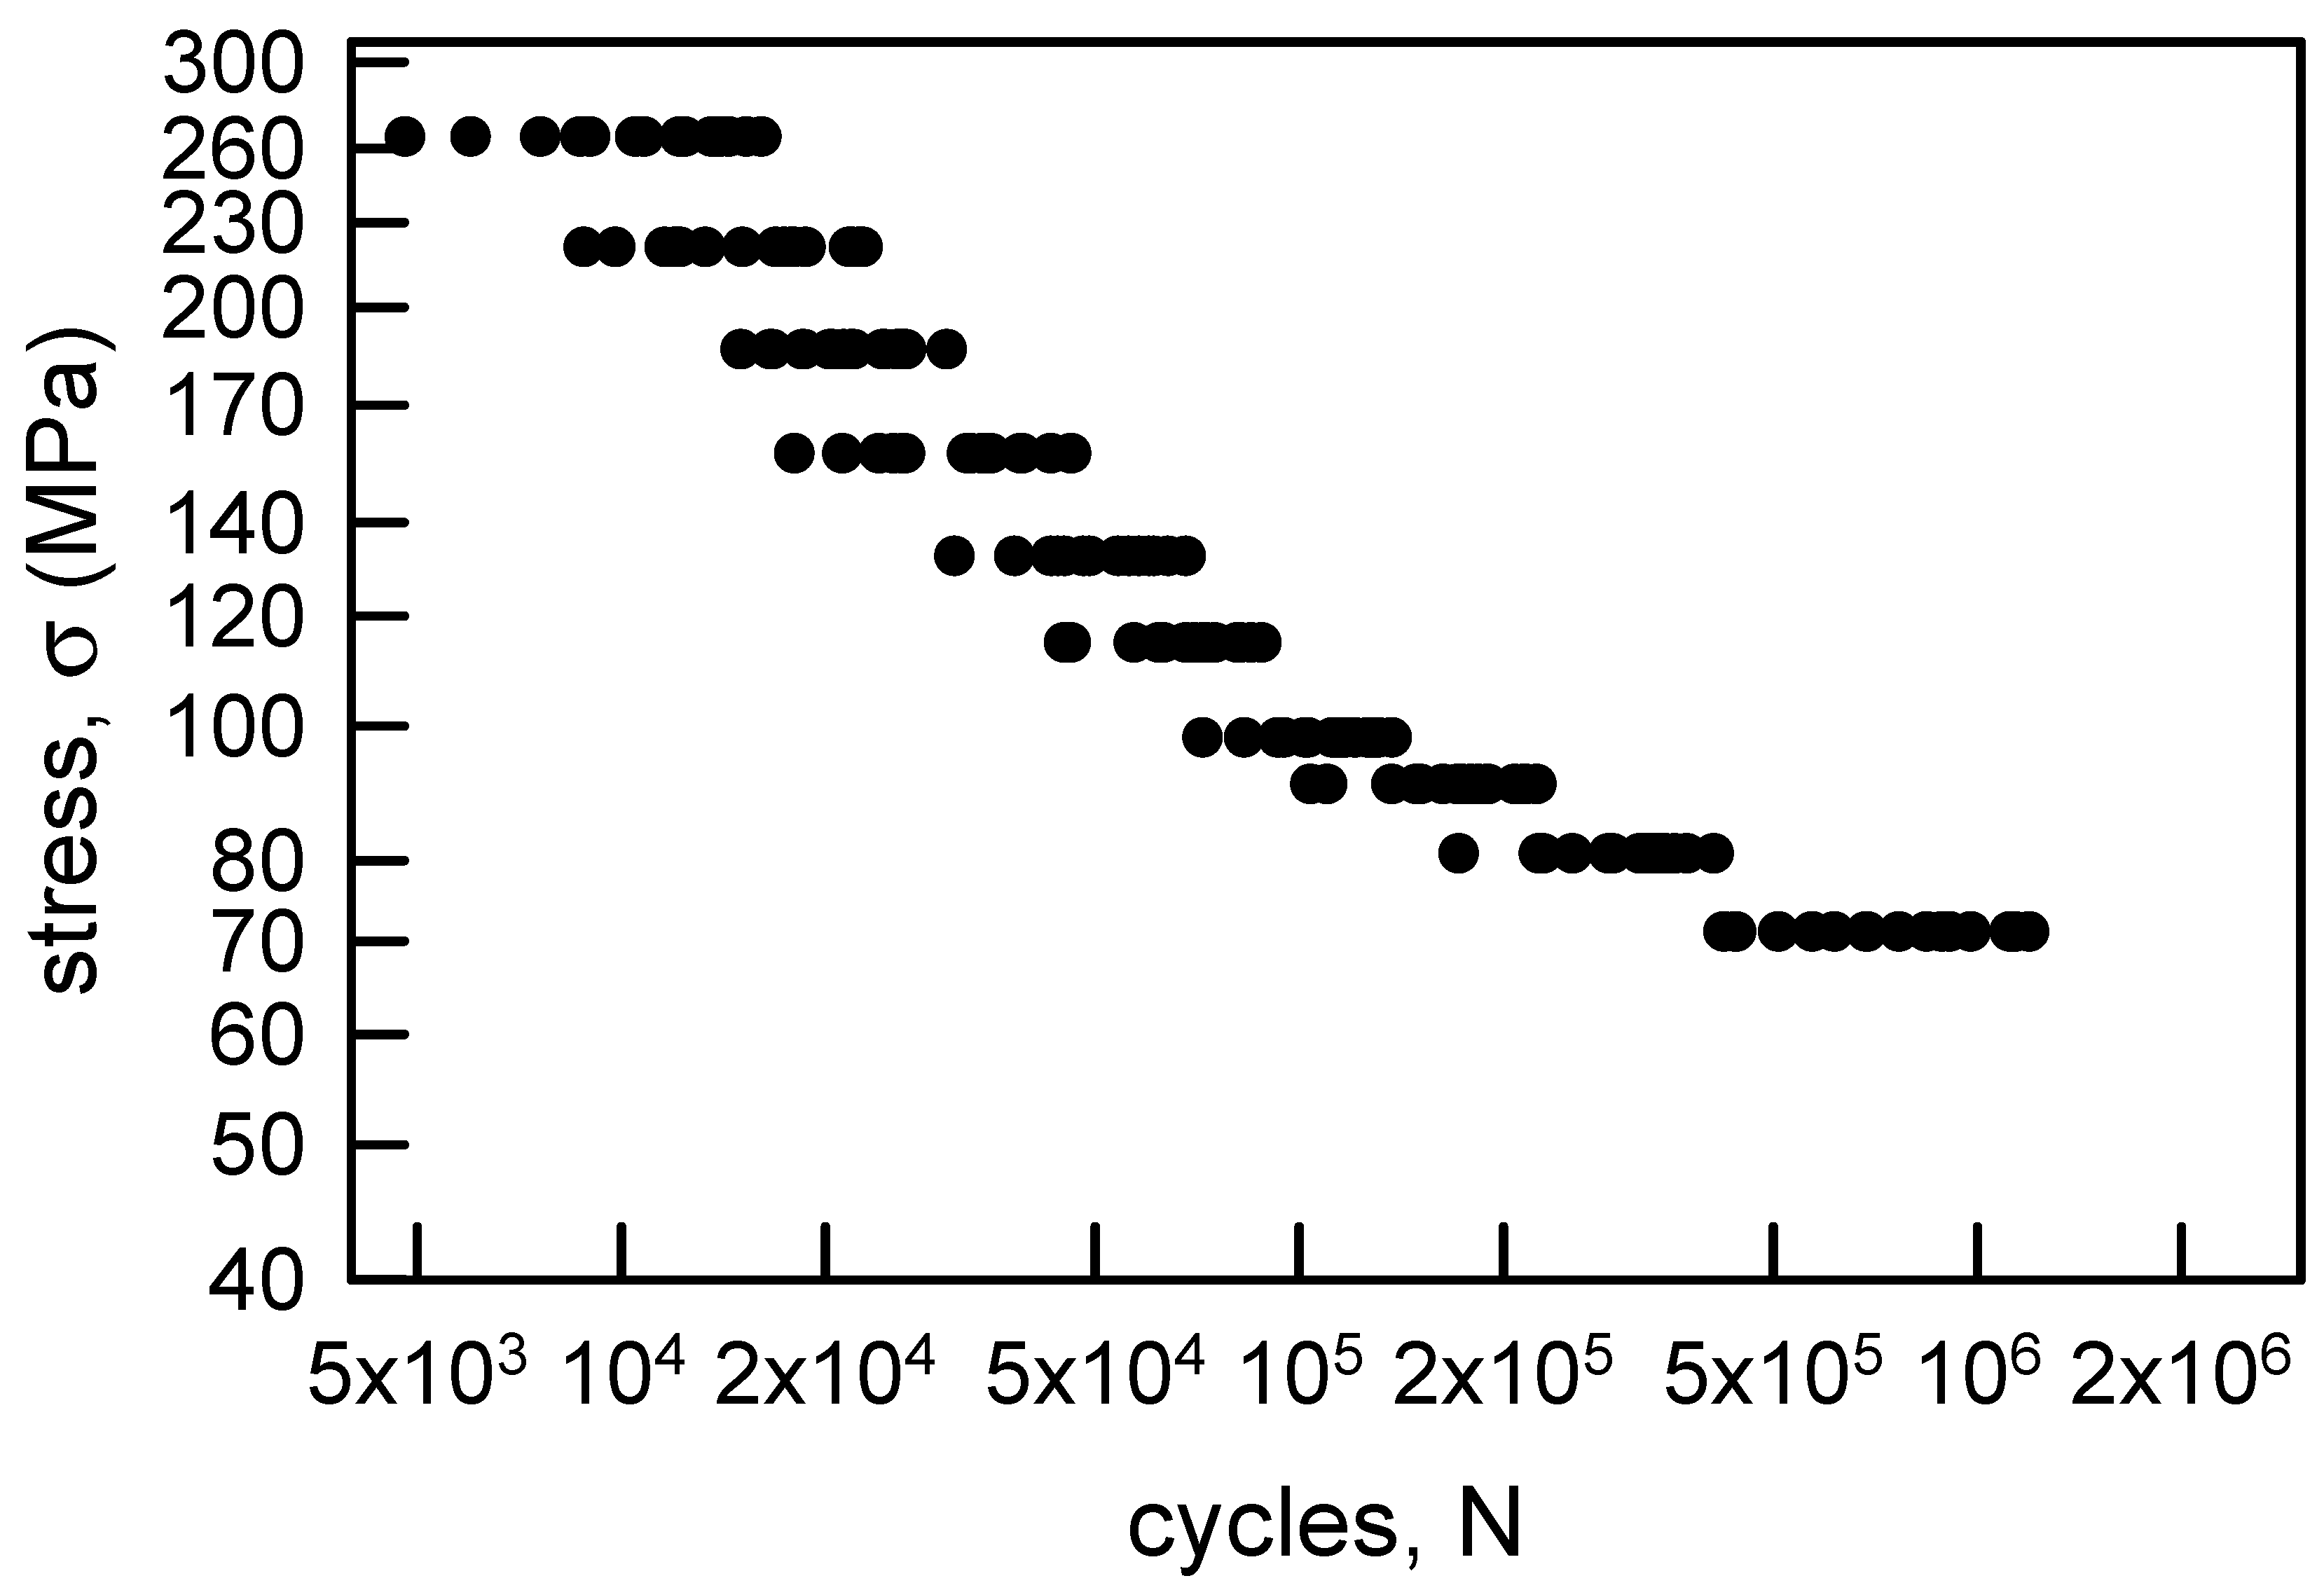
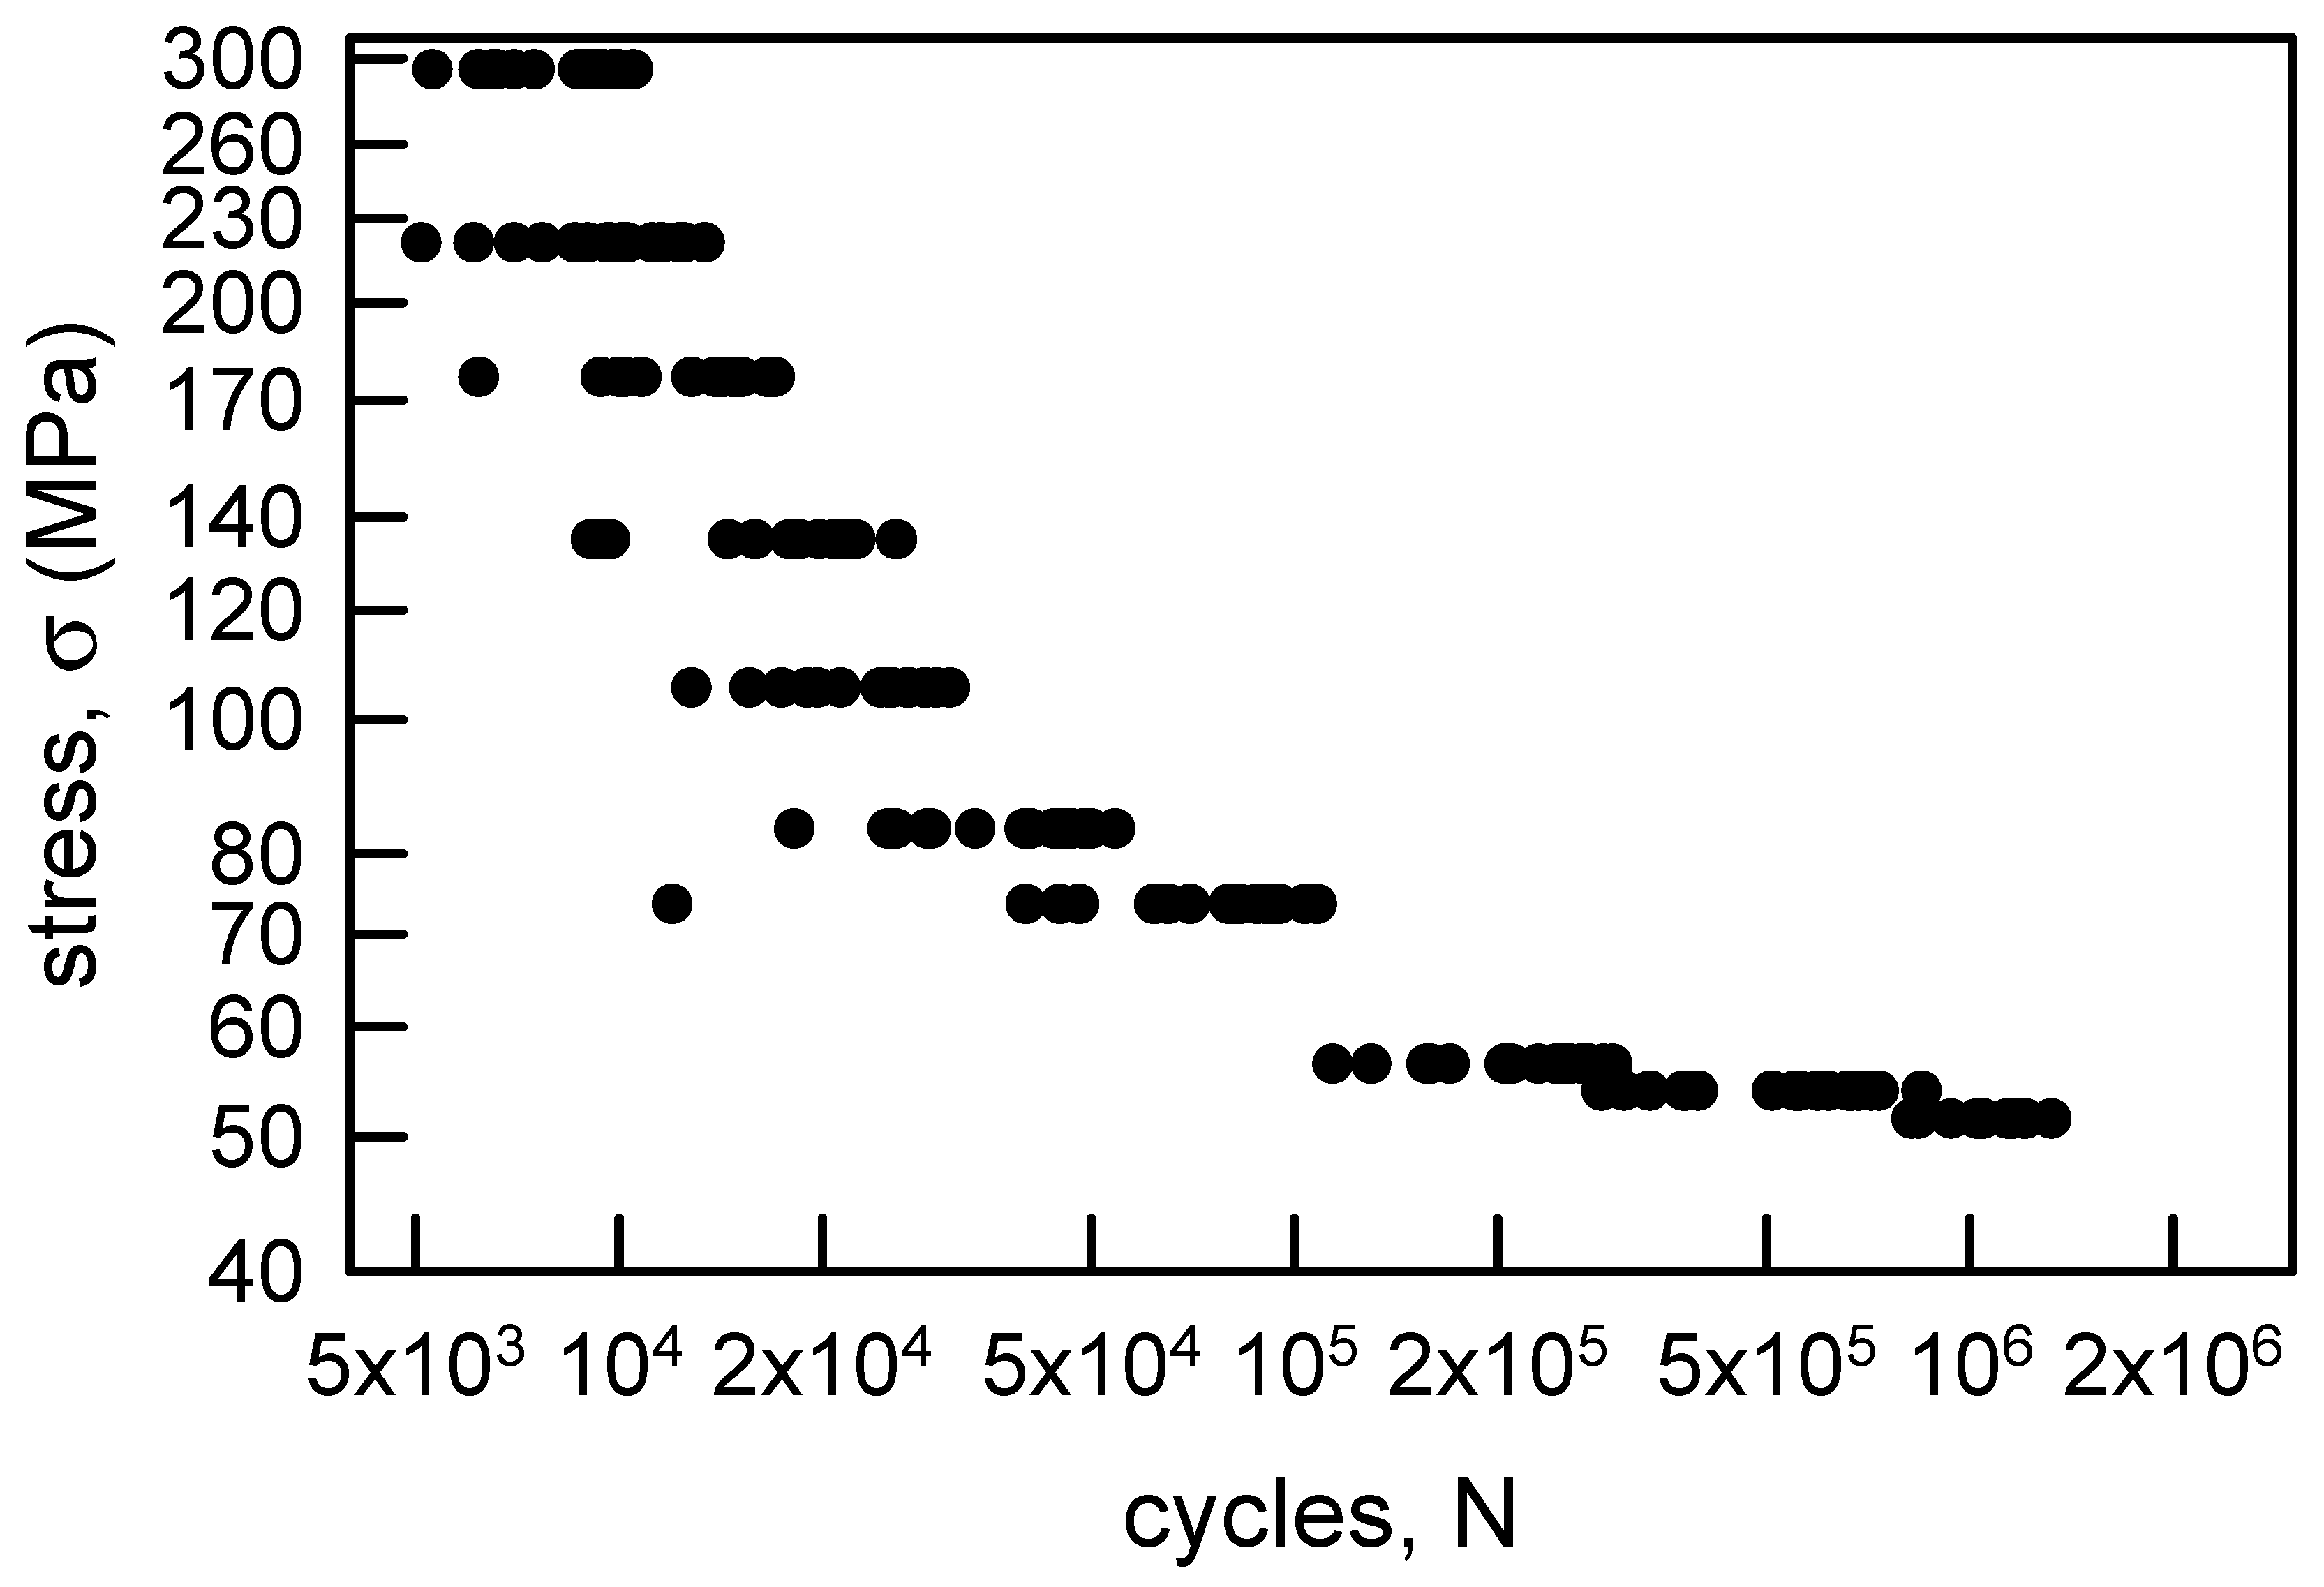
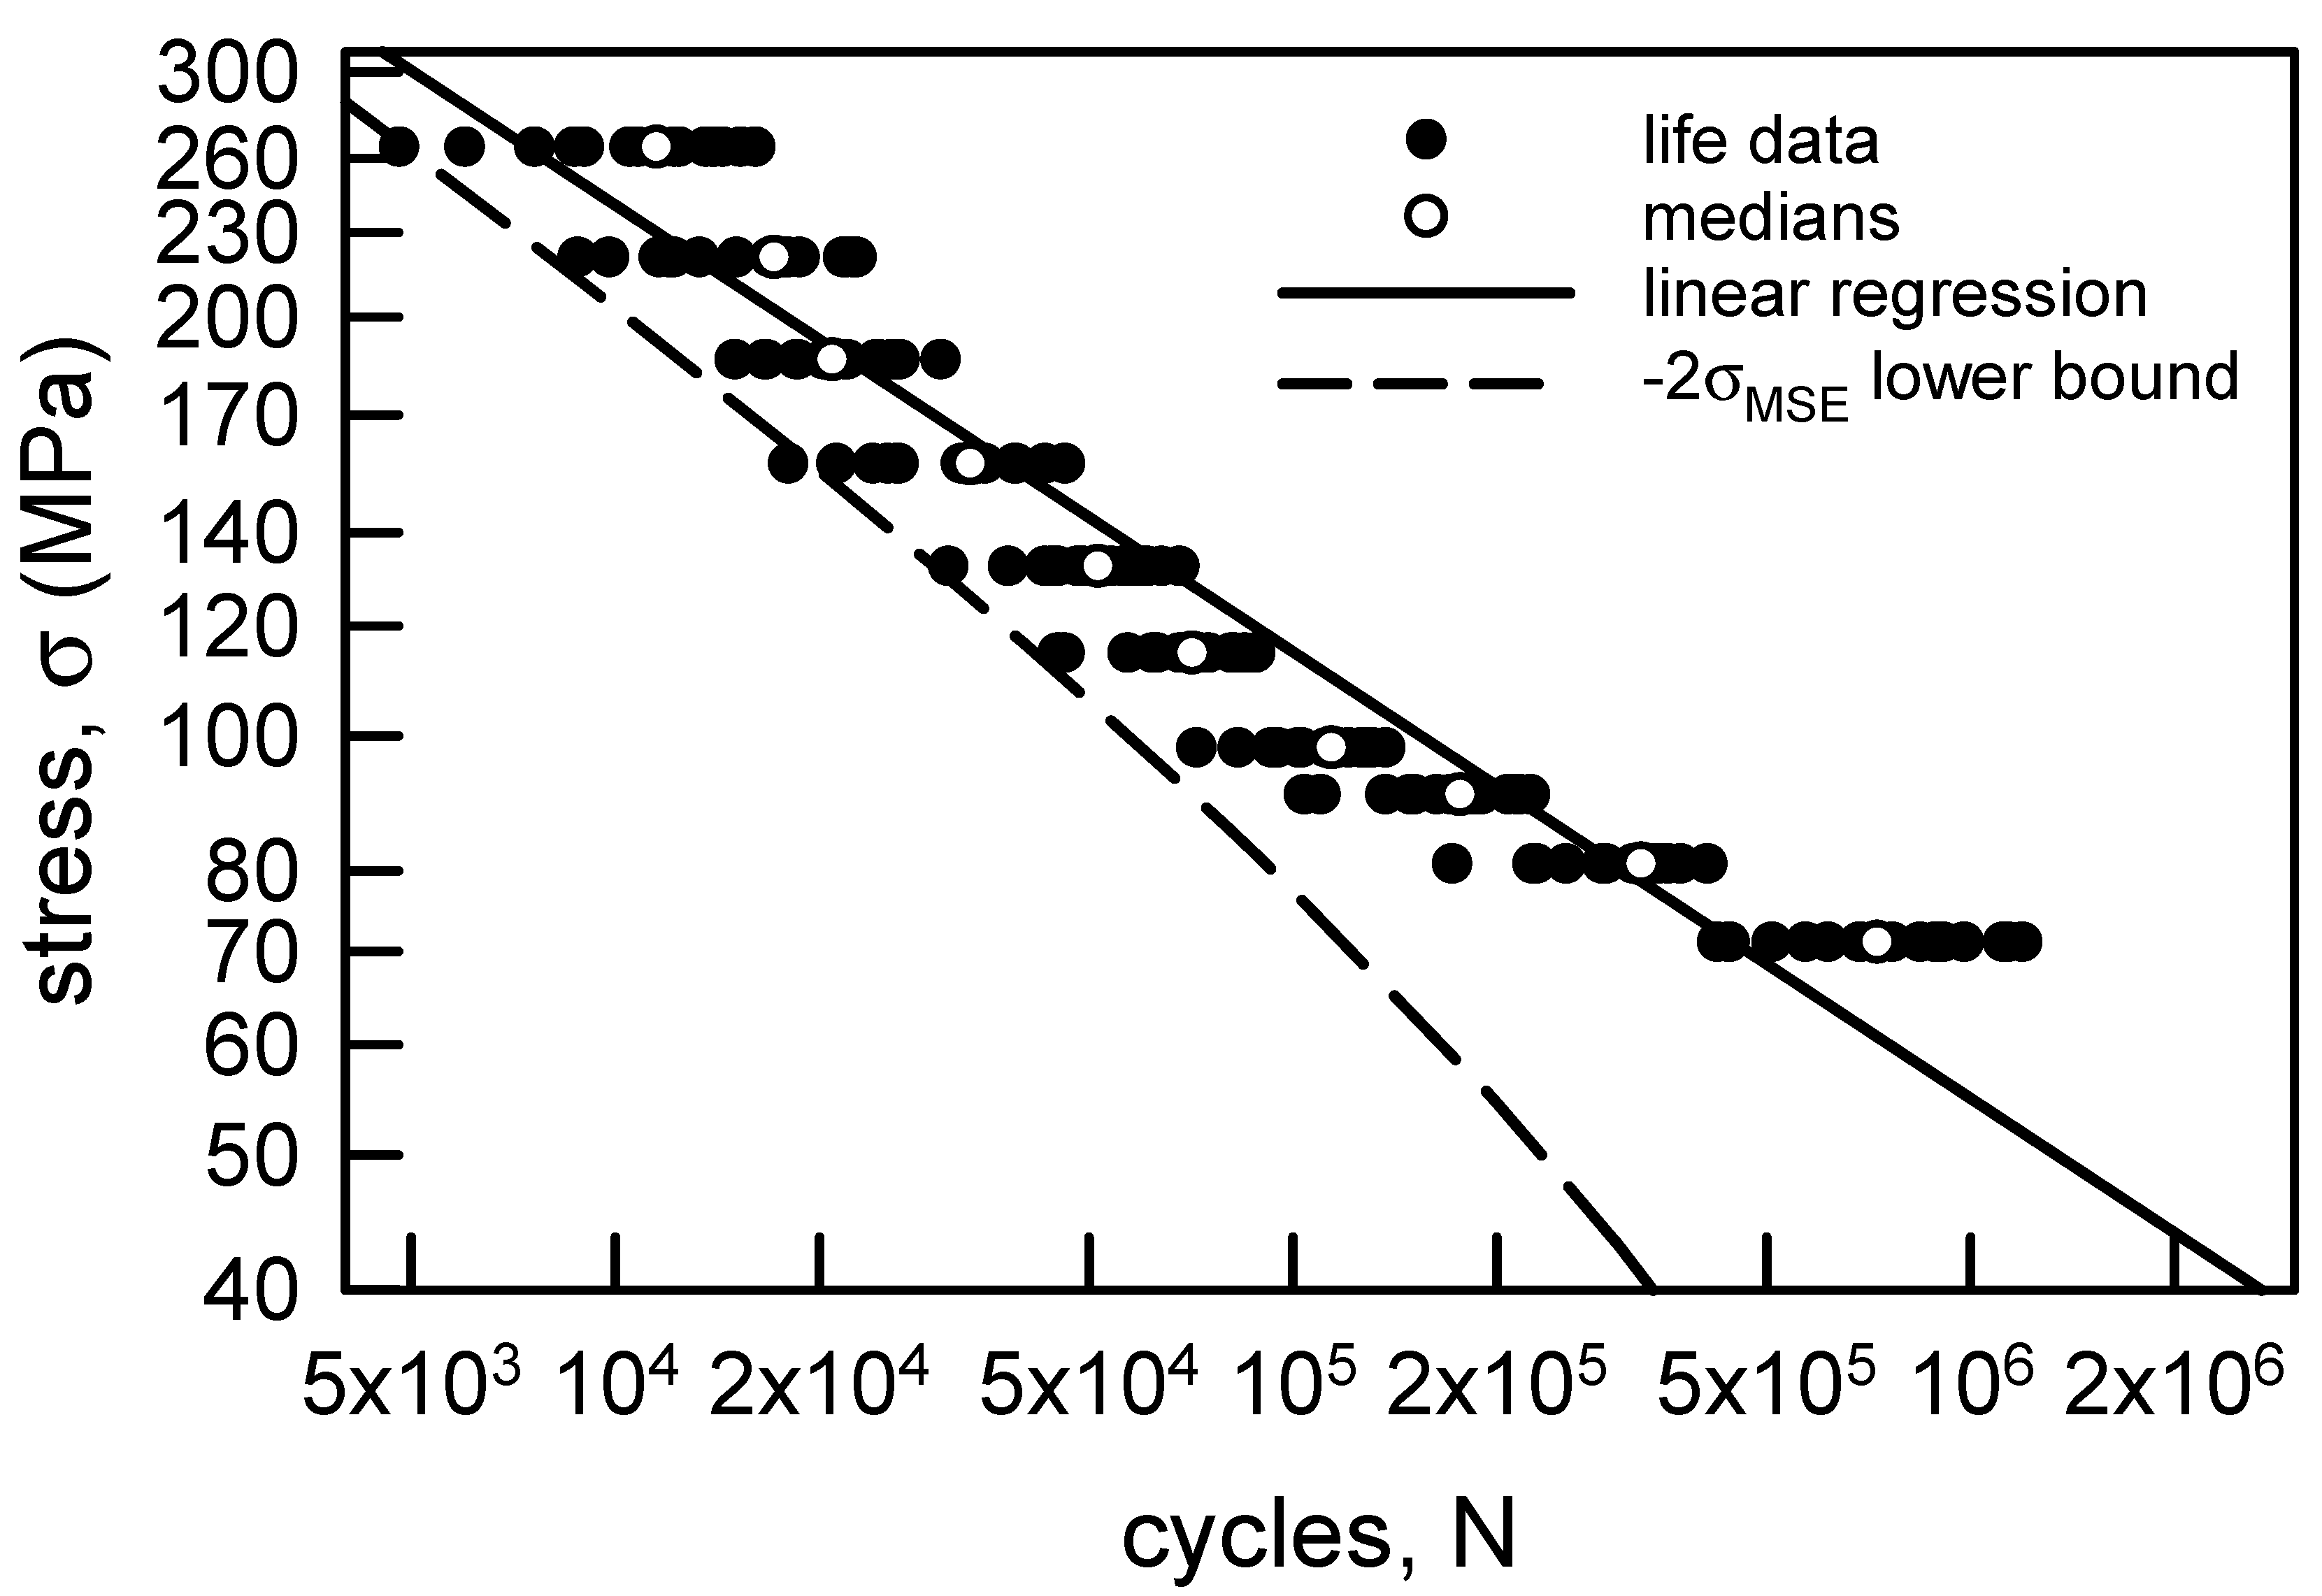
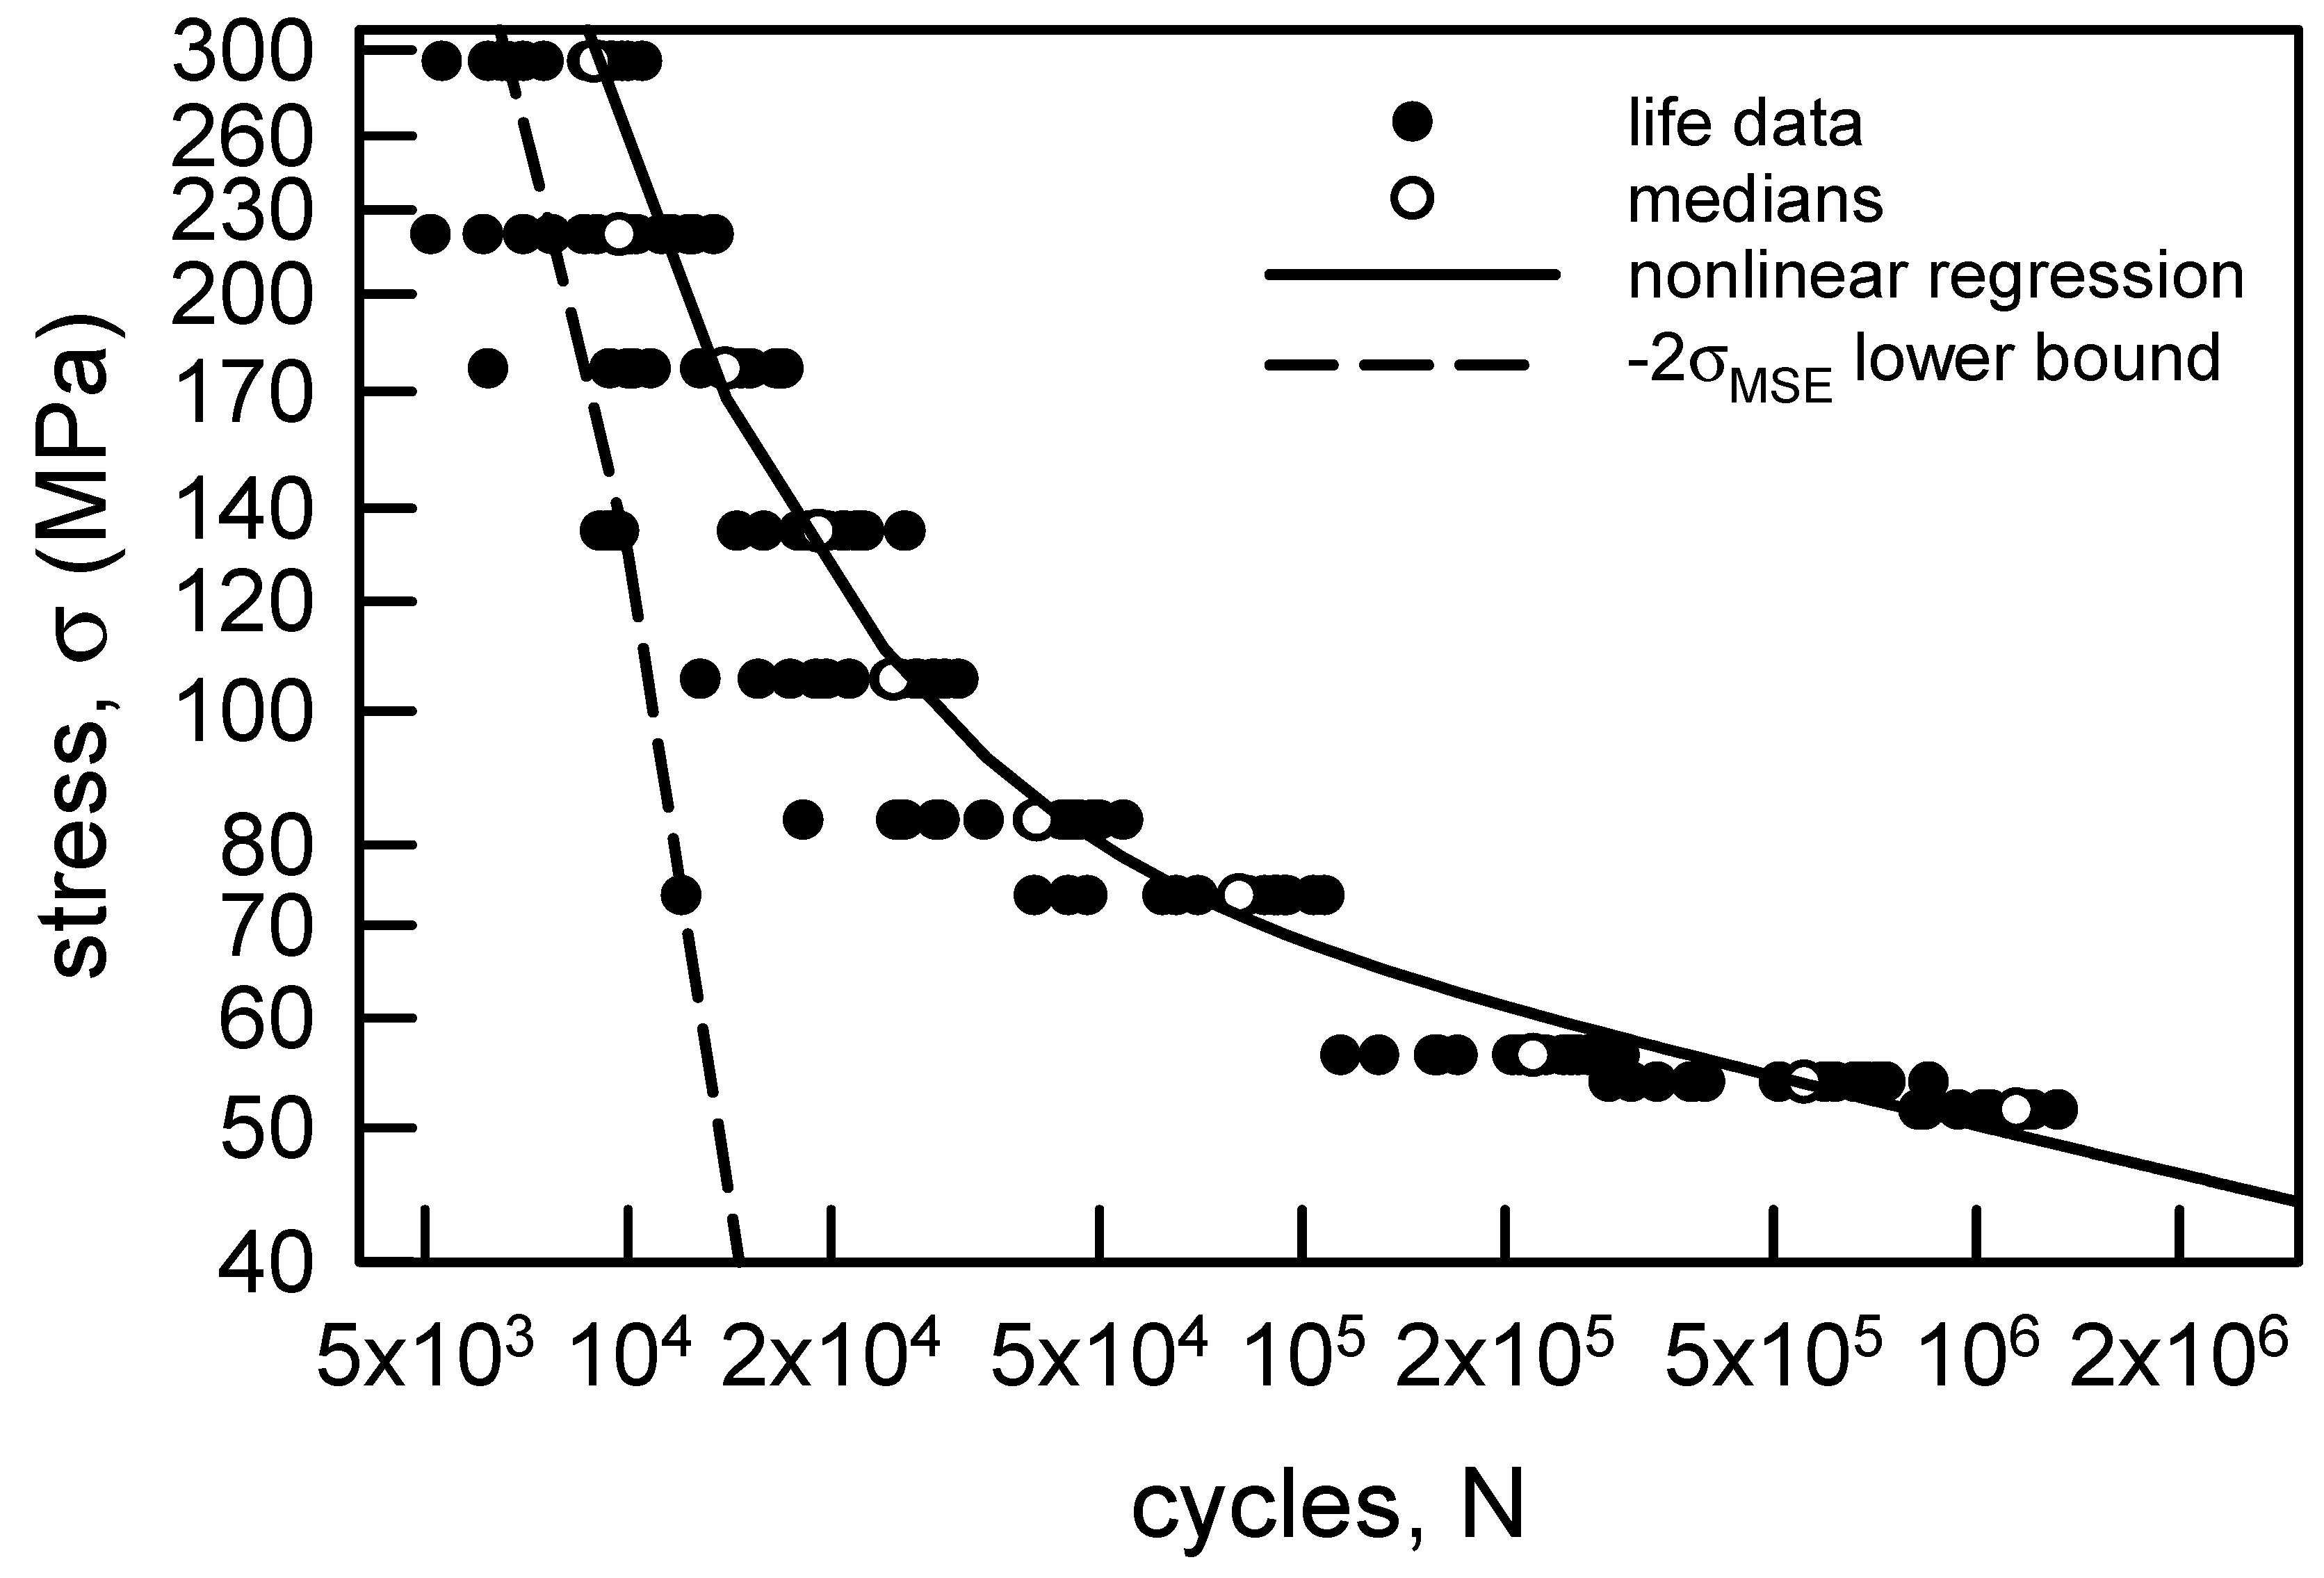
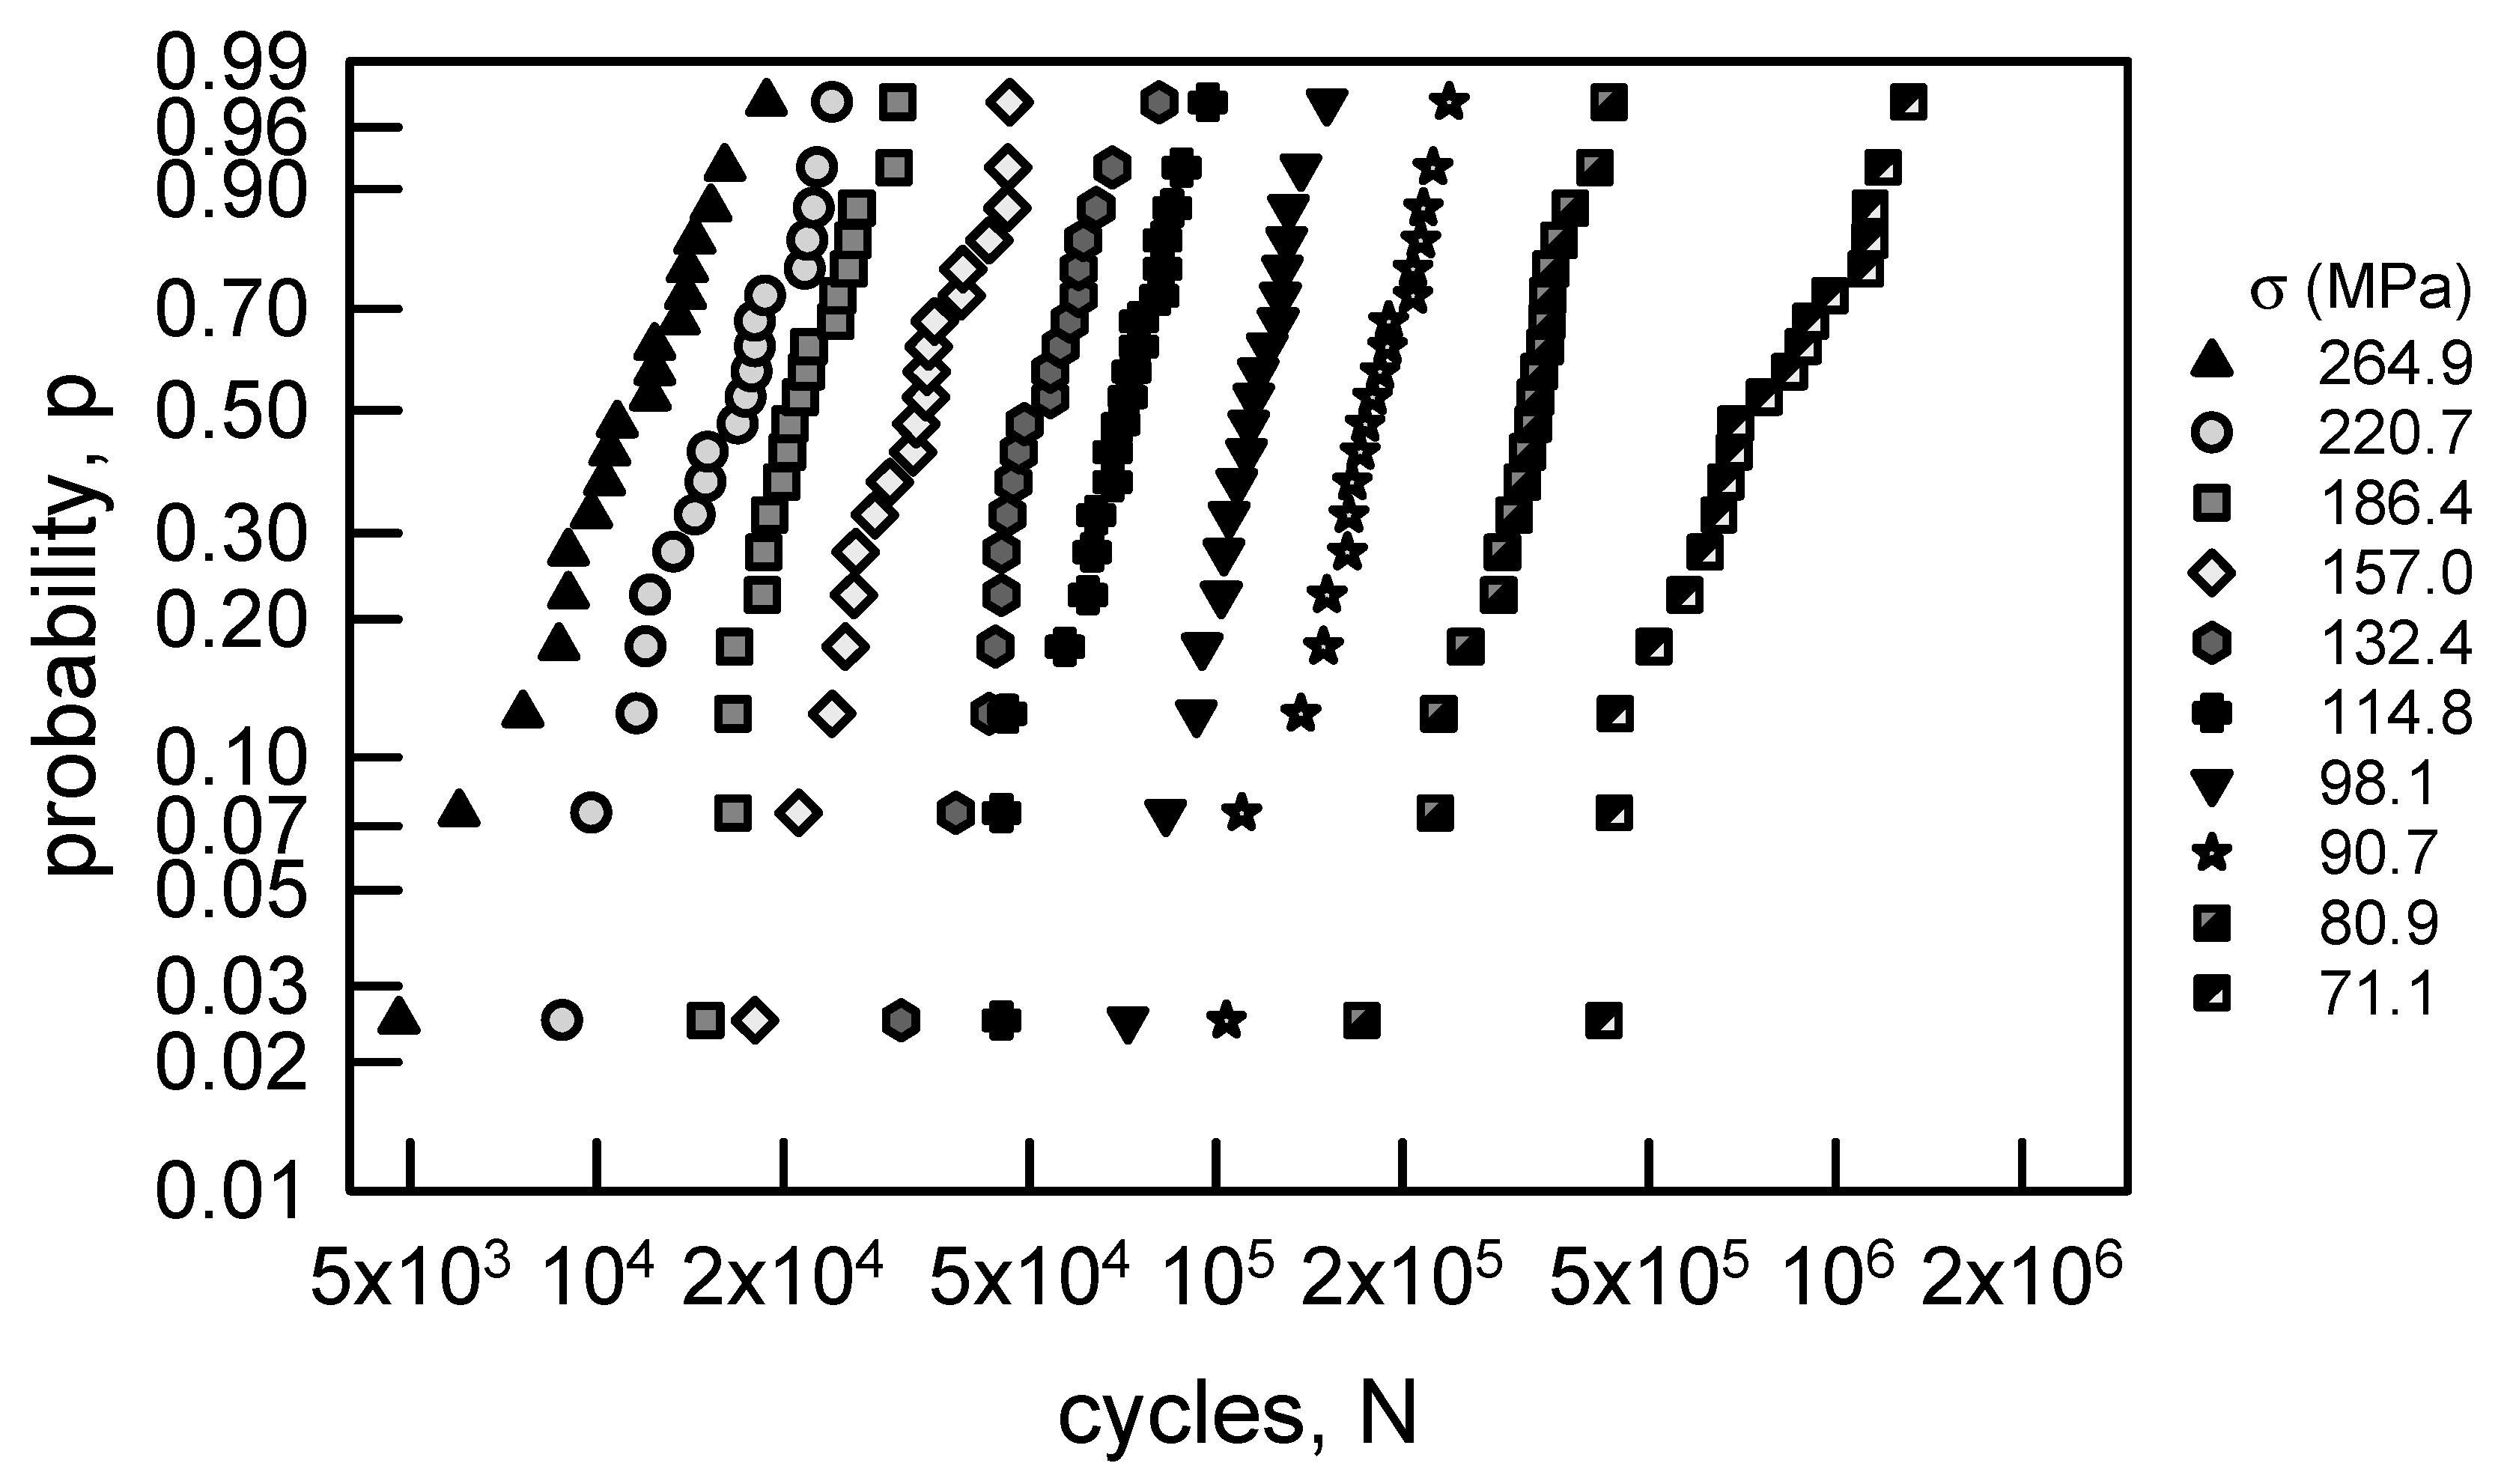
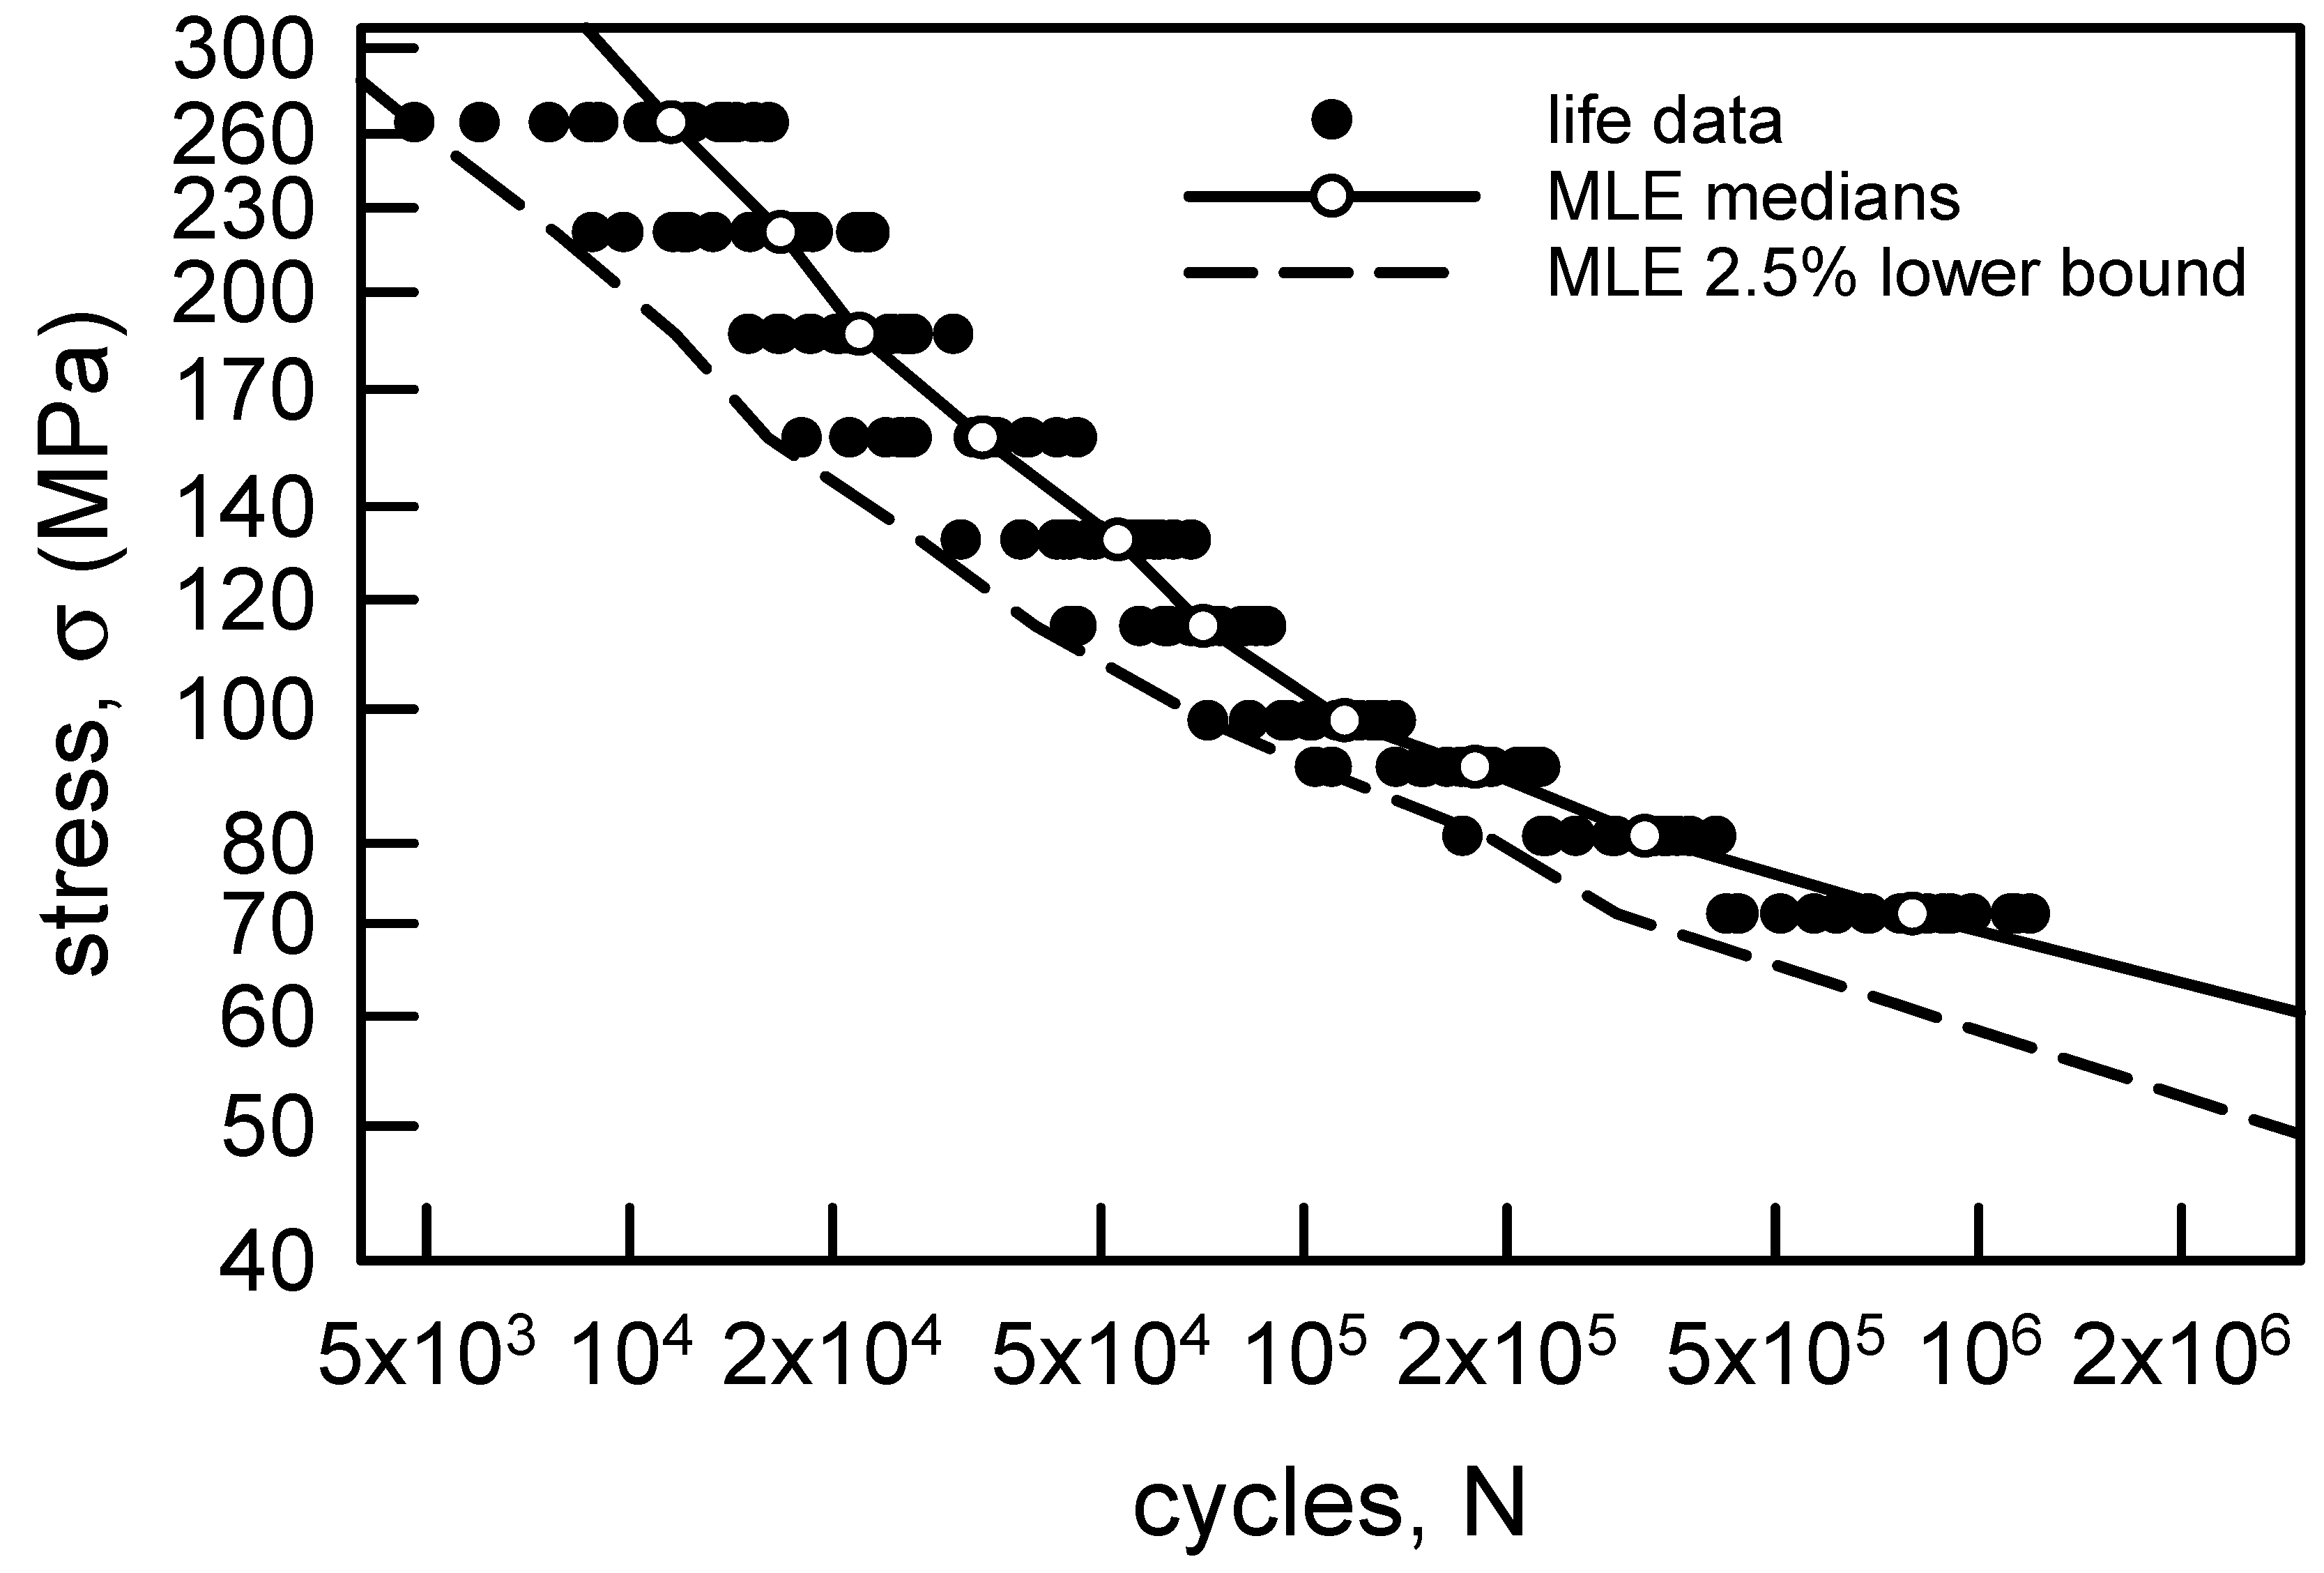
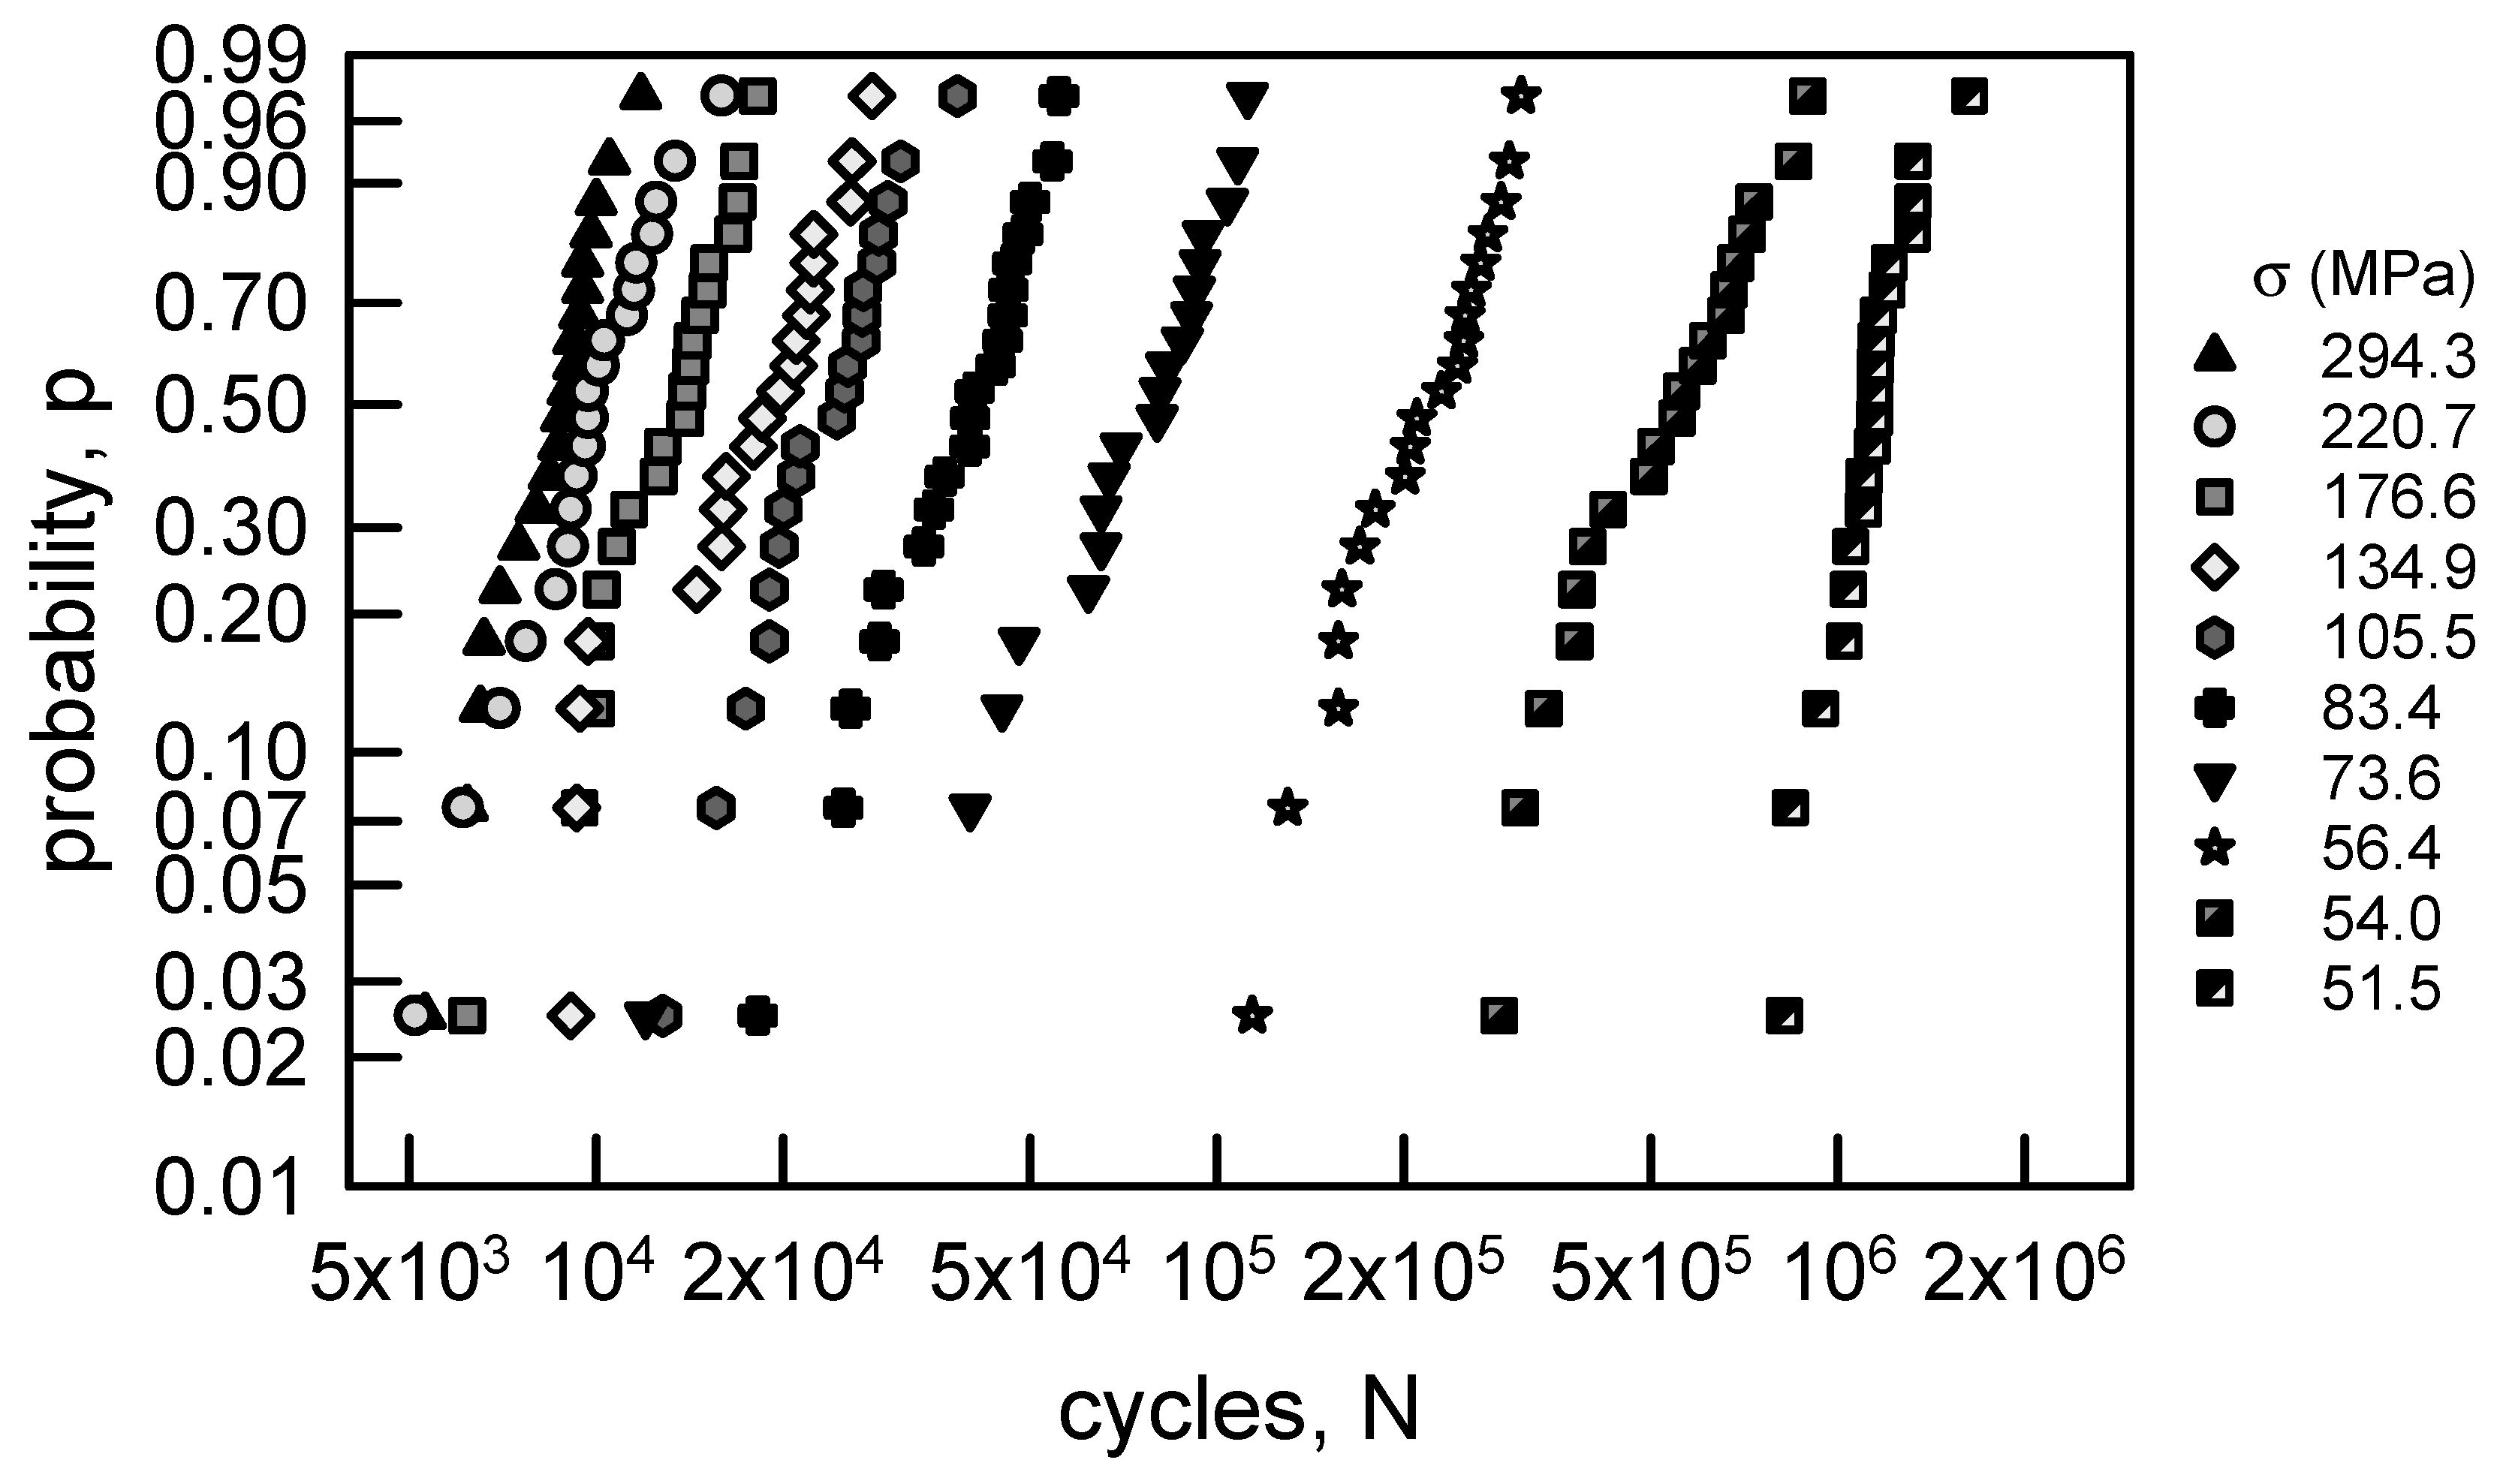
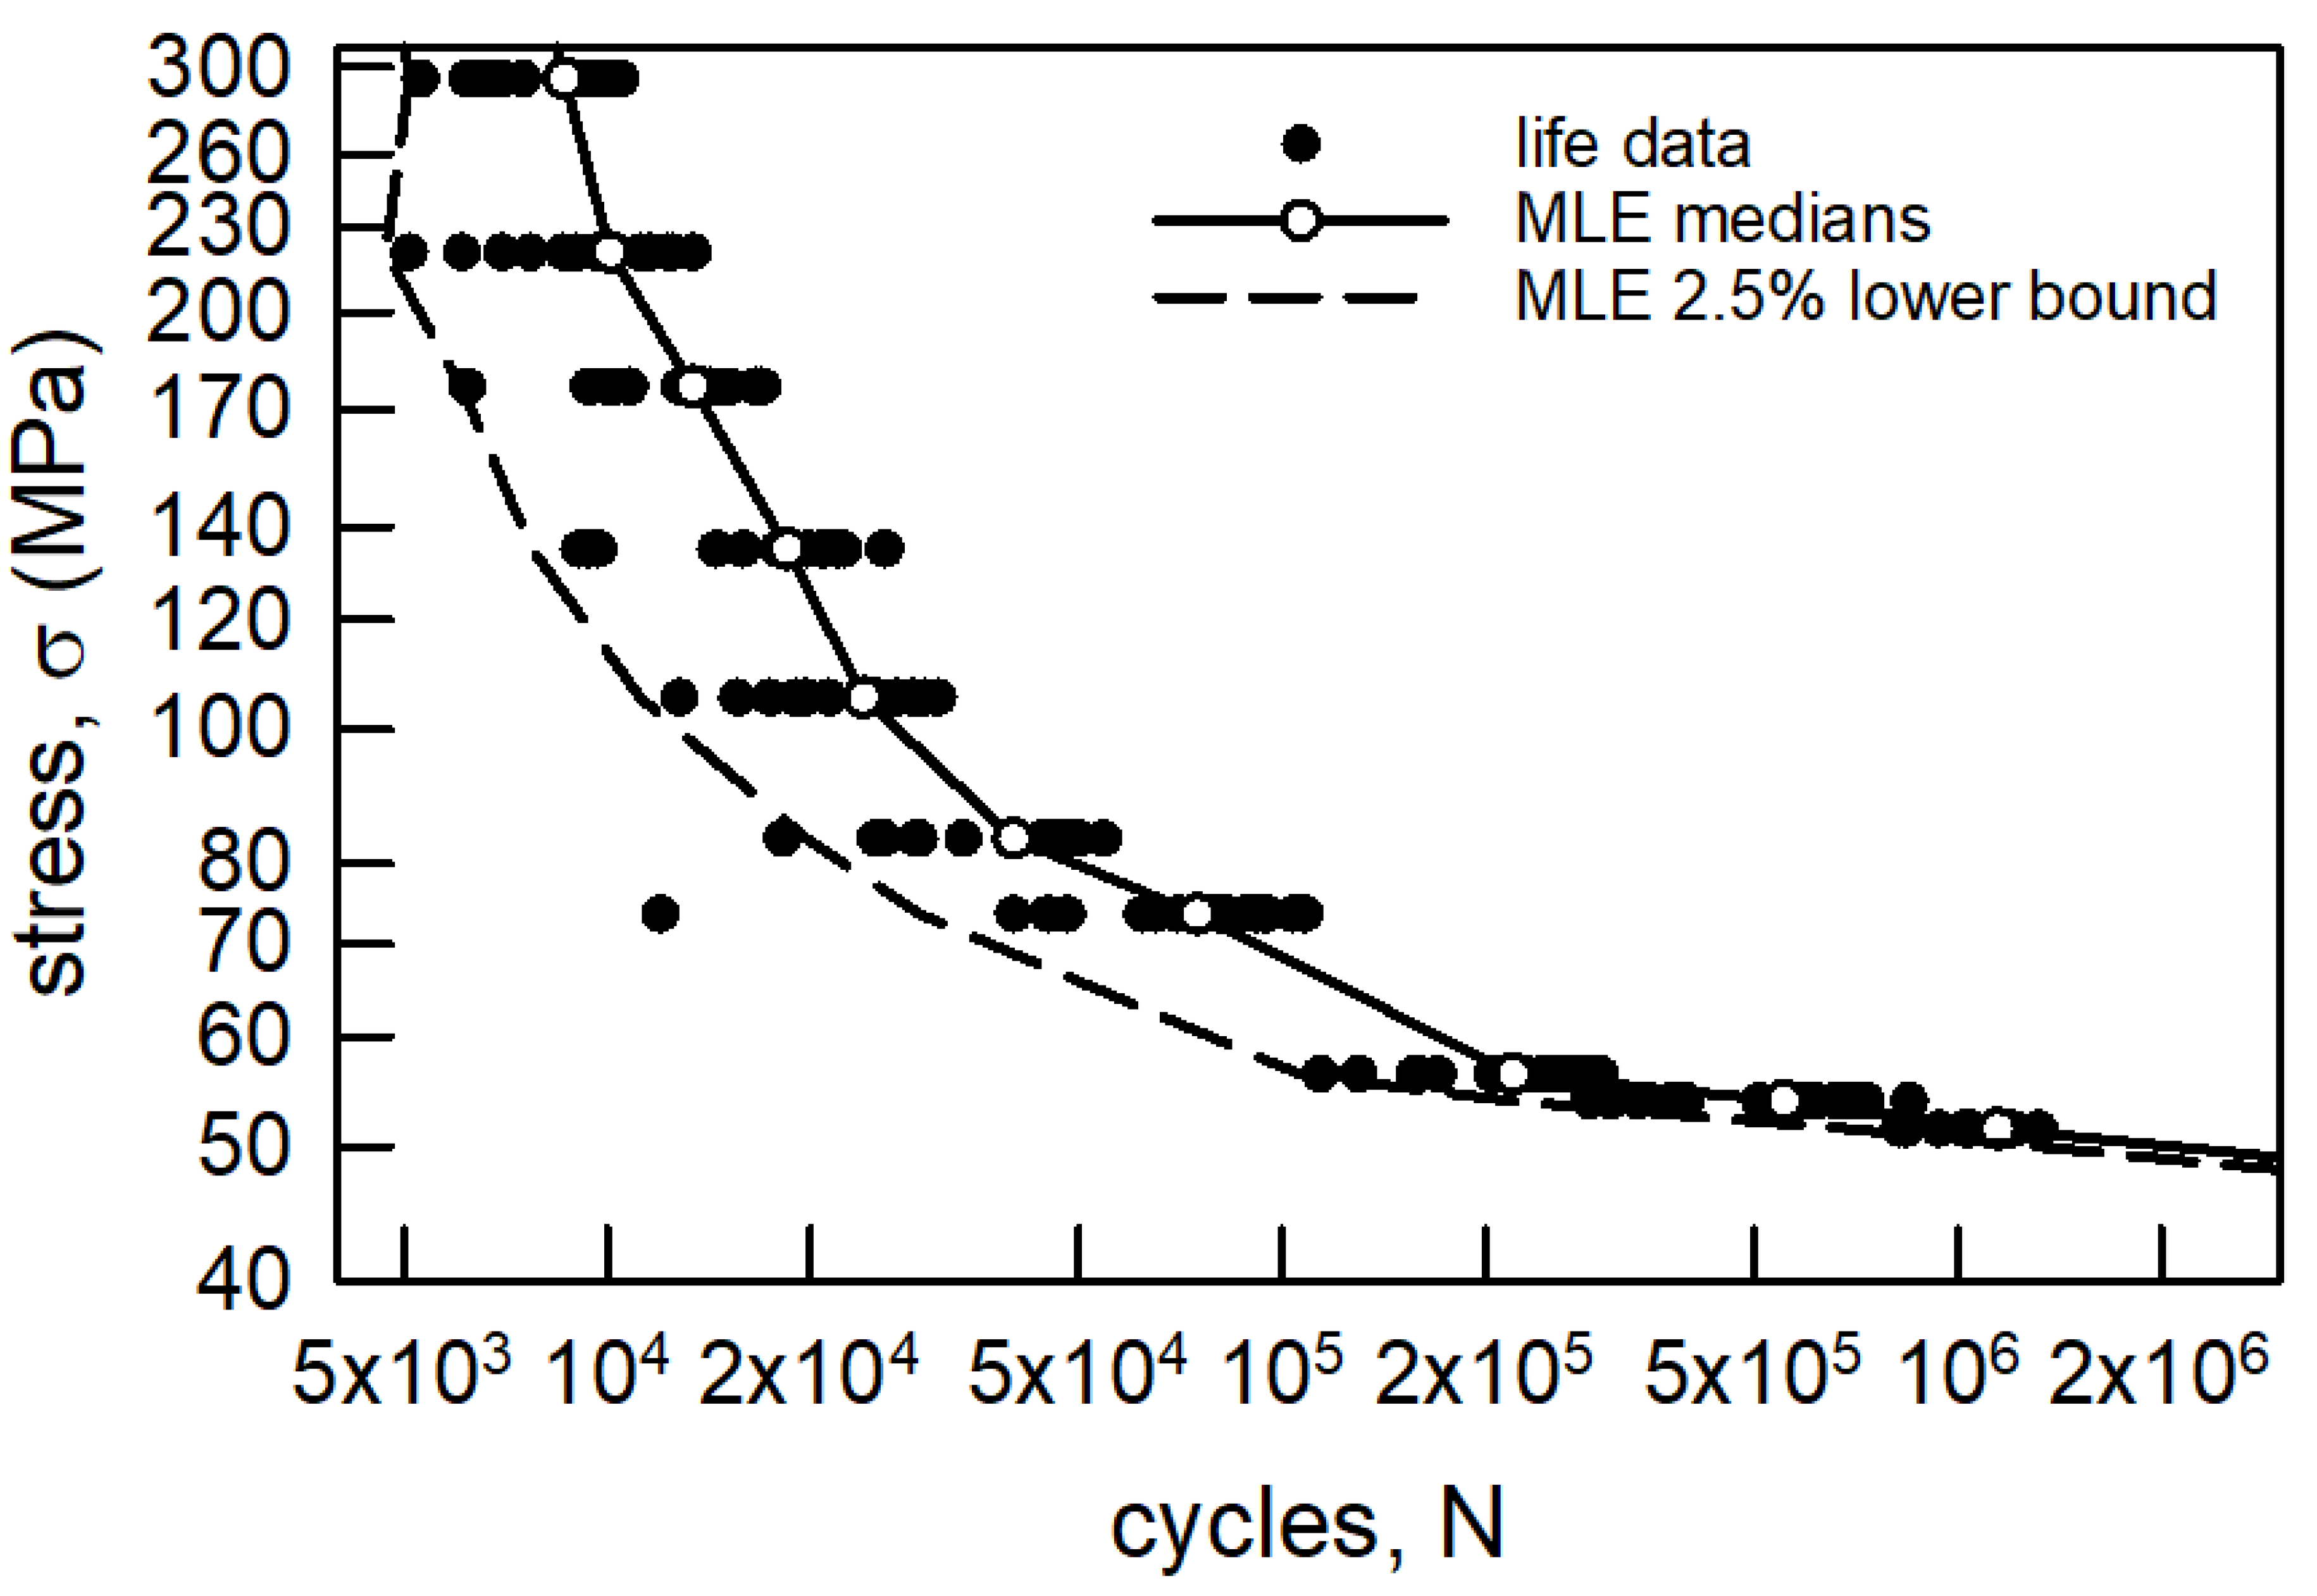
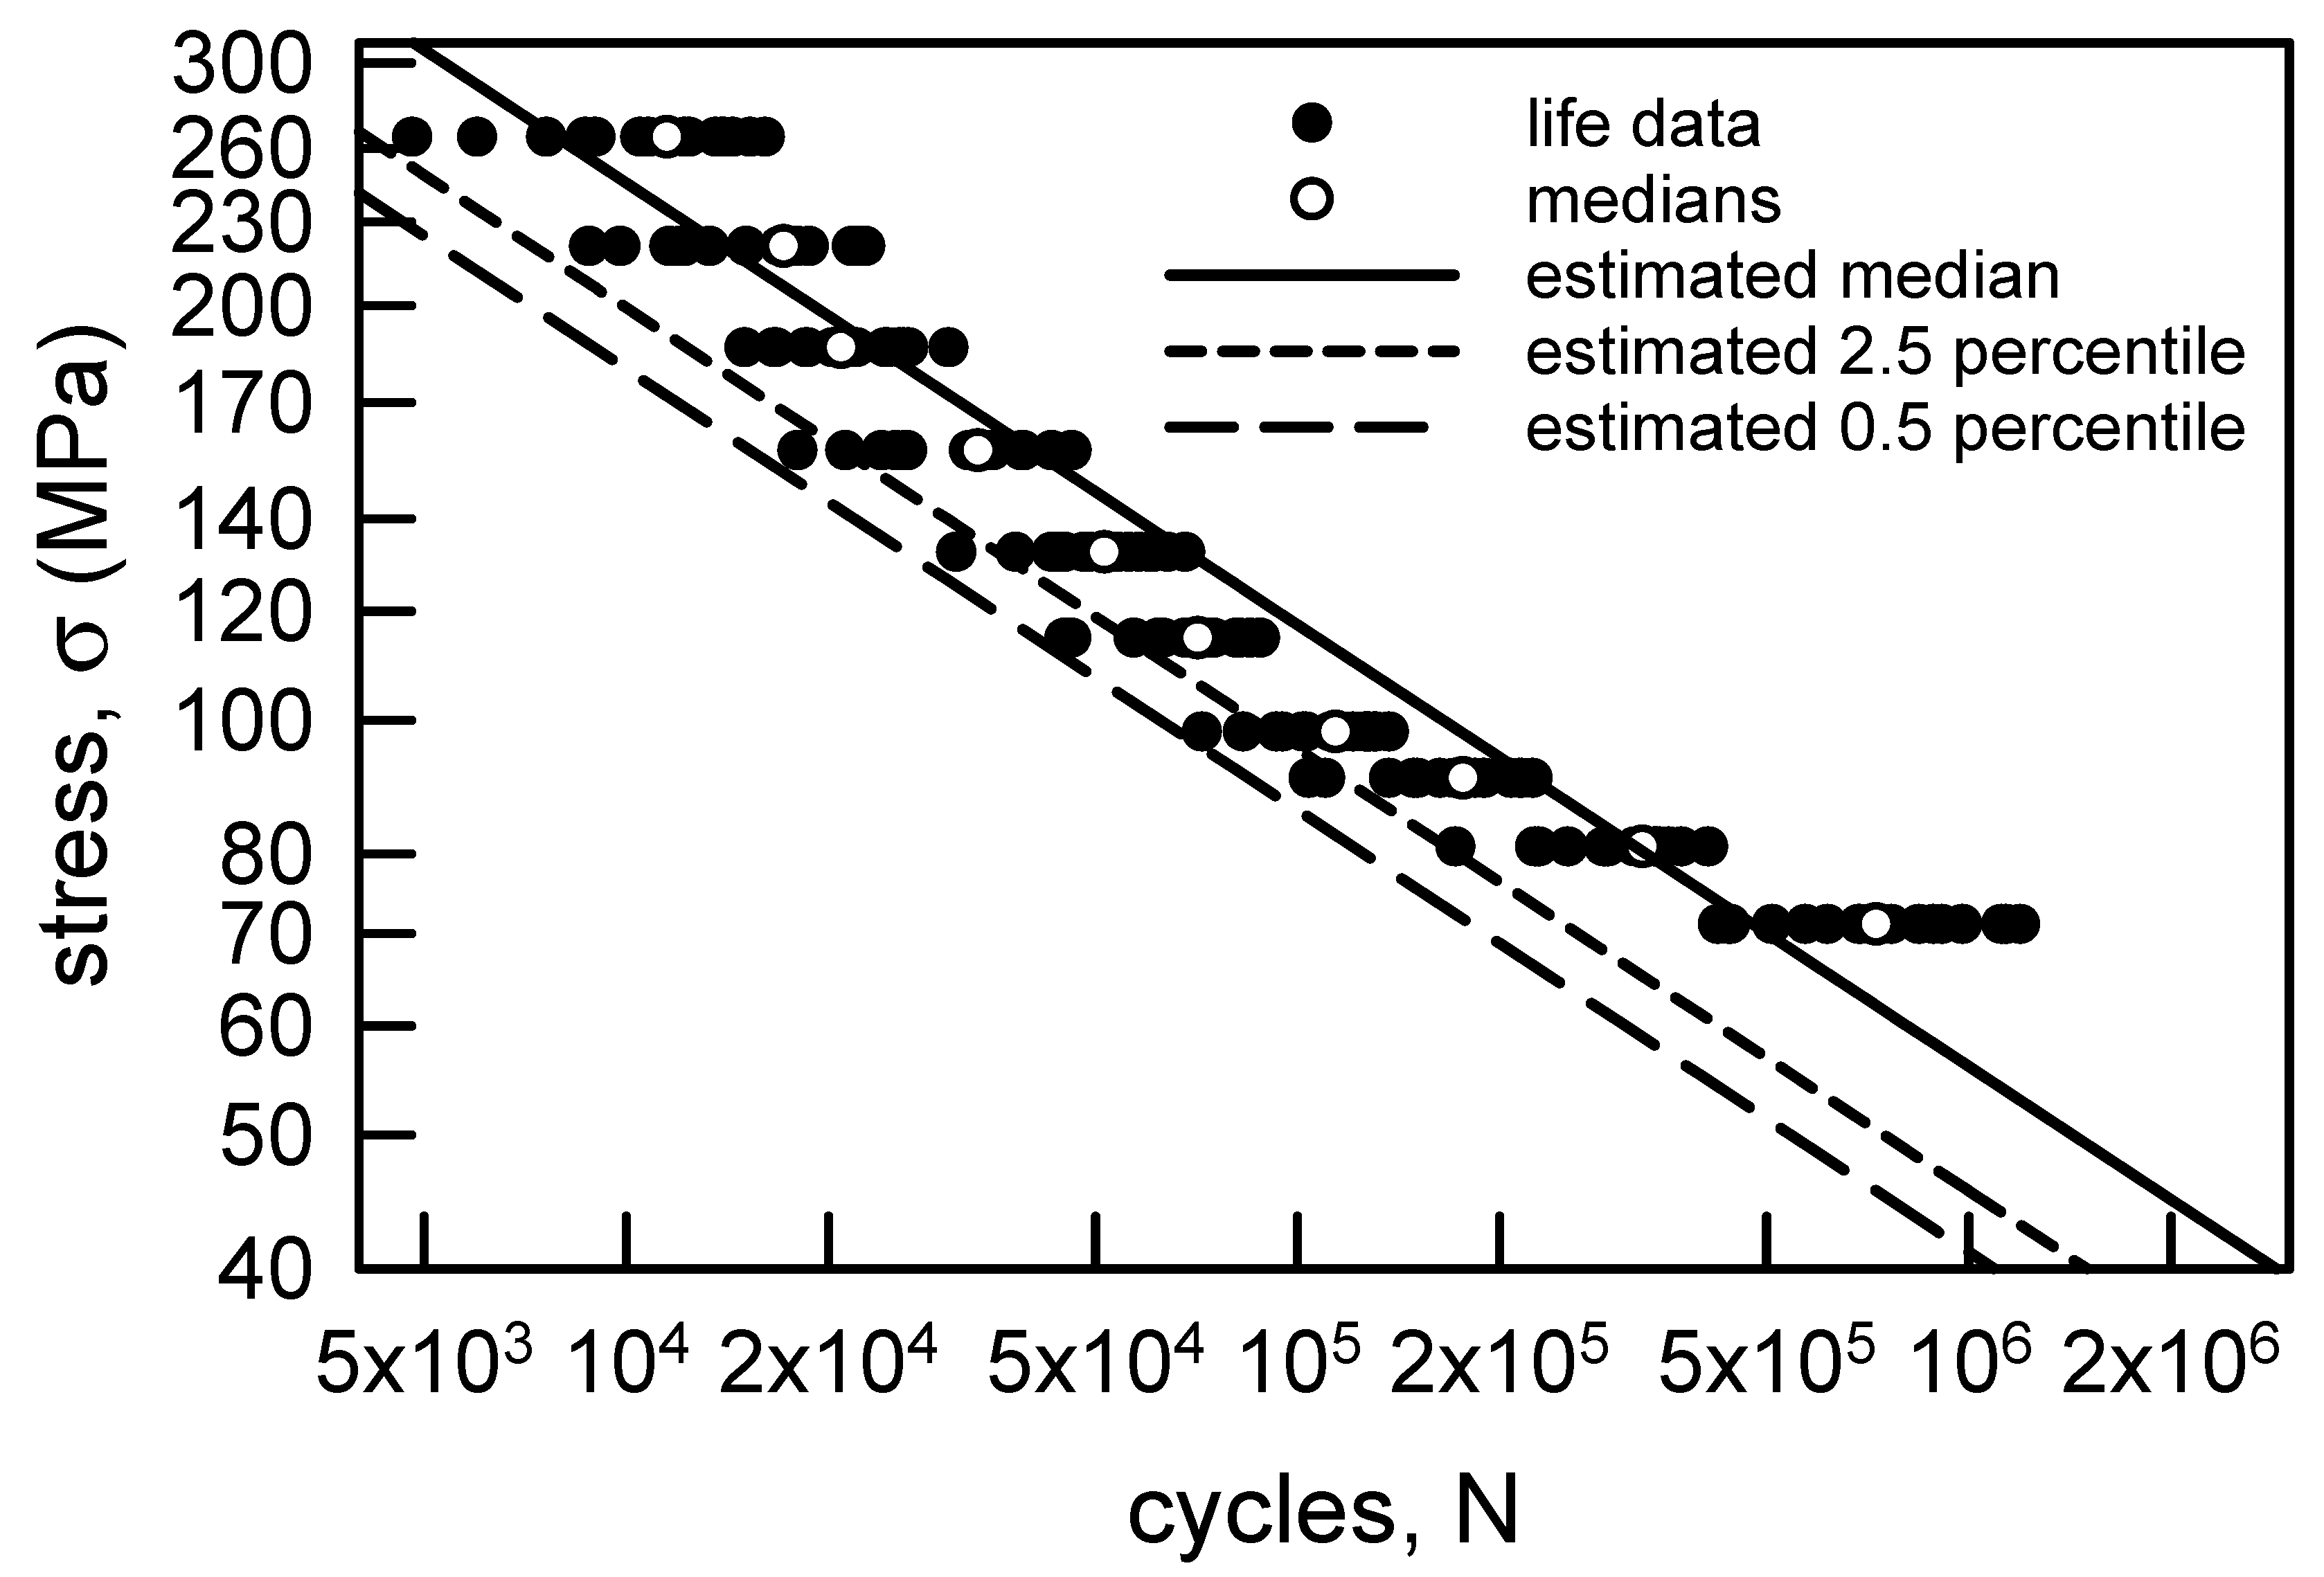
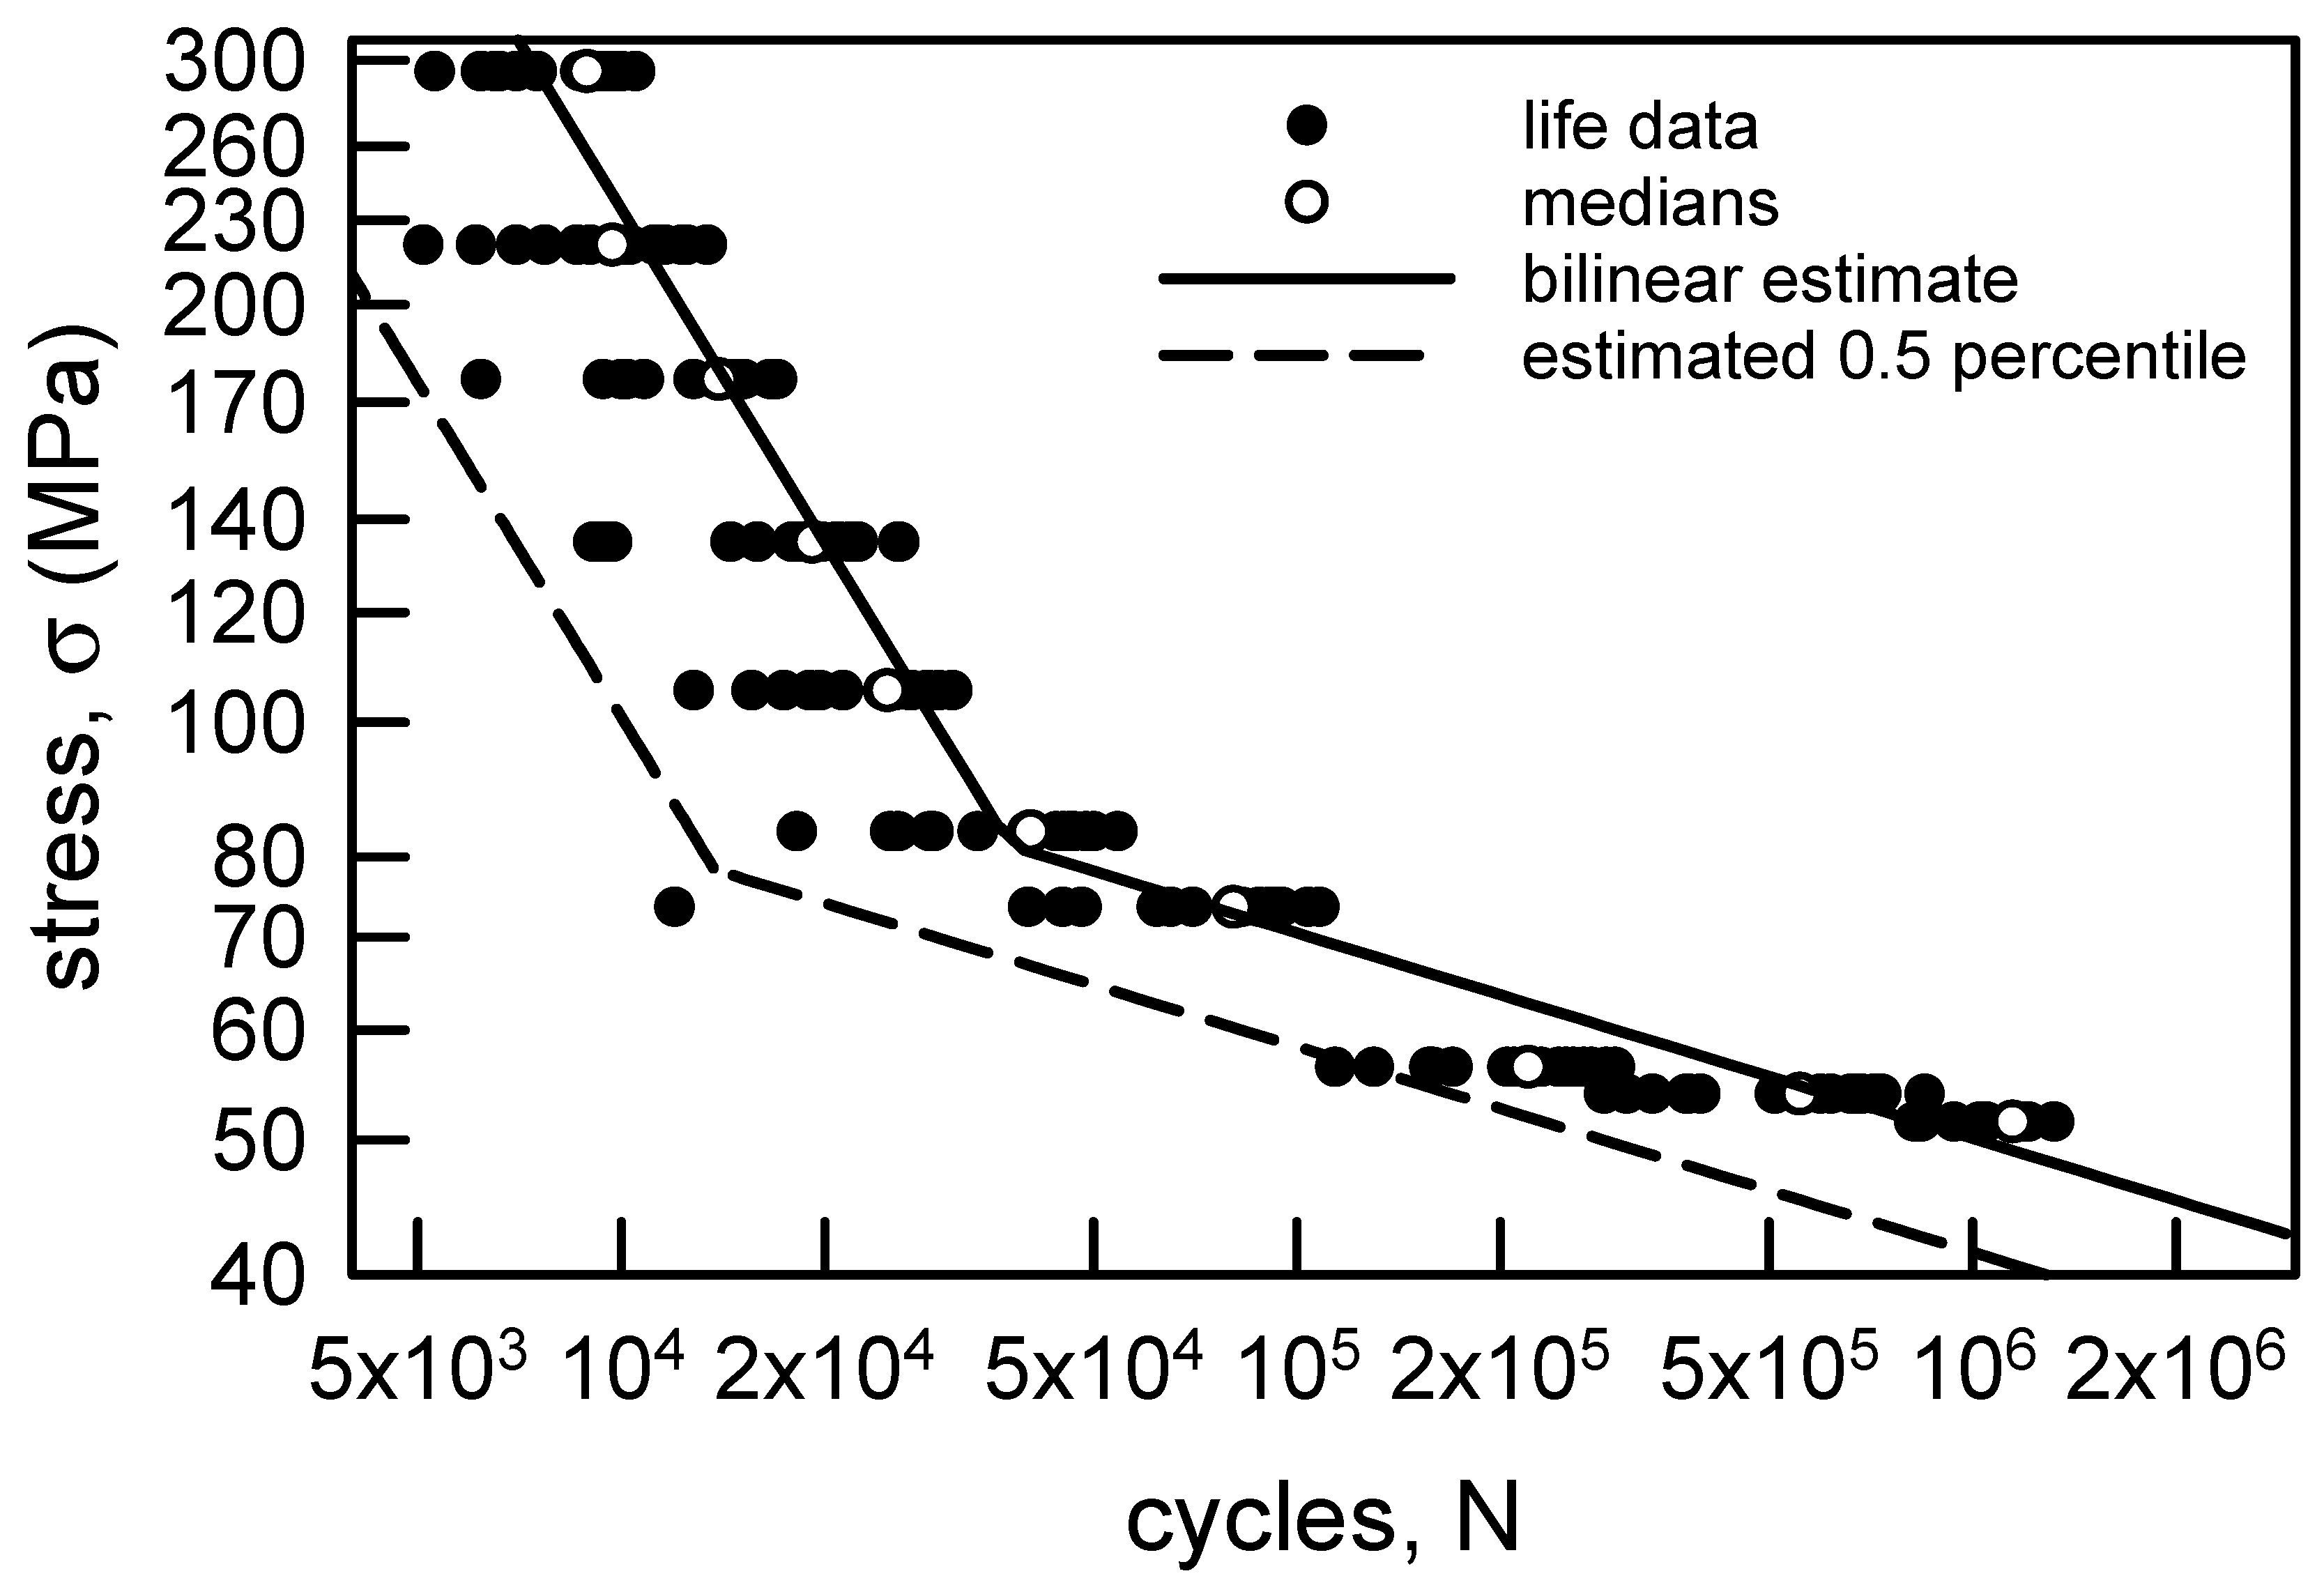
| Stress Amplitude, σ (MPa) | Sample Size | Sample Median | Sample Average | Sample Standard Deviation | Sample cv (%) |
|---|---|---|---|---|---|
| 264.9 | 20 | 11,500 | 11,480 | 3497 | 30.5 |
| 220.7 | 20 | 17,150 | 16,585 | 4492 | 27.1 |
| 186.4 | 20 | 20,900 | 21,705 | 4444 | 20.5 |
| 157.0 | 20 | 33,400 | 33,020 | 8381 | 25.4 |
| 132.4 | 20 | 51,500 | 52,600 | 11,399 | 21.7 |
| 114.8 | 20 | 71,000 | 69,900 | 14,330 | 20.5 |
| 98.1 | 20 | 114,000 | 113,450 | 19,083 | 16.8 |
| 90.7 | 20 | 176,500 | 176,950 | 35,922 | 20.3 |
| 80.9 | 20 | 326,500 | 315,850 | 61,750 | 19.6 |
| 71.1 | 20 | 728,000 | 798,000 | 274,770 | 34.4 |
| Stress Amplitude, σ (MPa) | Sample Size | Sample Median | Sample Average | Sample Standard Deviation | Sample cv (%) |
|---|---|---|---|---|---|
| 294.3 | 20 | 8900 | 8545 | 1616 | 18.9 |
| 220.7 | 20 | 9700 | 9985 | 2538 | 25.4 |
| 176.6 | 20 | 13,950 | 13,170 | 3084 | 23.4 |
| 134.9 | 20 | 19,150 | 18,305 | 5741 | 31.4 |
| 105.5 | 20 | 24,750 | 23,825 | 6004 | 25.2 |
| 83.4 | 20 | 40,350 | 39,440 | 10,292 | 26.1 |
| 73.6 | 20 | 80,500 | 75,100 | 25,319 | 33.7 |
| 56.4 | 20 | 220,000 | 217,300 | 57,424 | 26.4 |
| 54.0 | 20 | 555,500 | 552,150 | 177,149 | 32.1 |
| 51.5 | 20 | 1,146,000 | 1,140,200 | 179,961 | 15.8 |
| σ (MPa) | (cyc) | (cyc) | (%) | KS | AD | |
|---|---|---|---|---|---|---|
| 264.9 | 3.75 | 12,700 | 11,500 | 29.8 | 0.082 | 0.137 |
| 220.7 | 4.31 | 18,300 | 16,600 | 26.2 | 0.093 | 0.305 |
| 186.4 | 5.28 | 23,500 | 21,700 | 21.8 | 0.115 | 0.444 |
| 157.0 | 4.52 | 36,200 | 33,100 | 25.1 | 0.119 | 0.321 |
| 132.4 | 4.89 | 57,100 | 52,400 | 23.4 | 0.124 | 0.406 |
| 114.8 | 5.79 | 75,500 | 69,900 | 20.0 | 0.095 | 0.214 |
| 98.1 | 6.97 | 121,000 | 113,000 | 16.9 | 0.079 | 0.131 |
| 90.7 | 5.94 | 191,000 | 177,000 | 19.5 | 0.080 | 0.182 |
| 80.9 | 6.13 | 334,000 | 316,000 | 19.0 | 0.122 | 0.323 |
| 71.1 | 3.28 | 892,000 | 800,000 | 33.5 | 0.152 | 0.386 |
| σ (MPa) | (cyc) | (cyc) | (%) | KS | AD | |
|---|---|---|---|---|---|---|
| 294.3 | 6.22 | 9190 | 8530 | 18.7 | 0.093 | 0.284 |
| 220.7 | 4.35 | 10,900 | 9960 | 26.0 | 0.113 | 0.251 |
| 176.6 | 5.19 | 14,300 | 13,200 | 22.1 | 0.098 | 0.271 |
| 134.9 | 3.81 | 20,300 | 18,400 | 29.3 | 0.142 | 0.472 |
| 105.5 | 4.36 | 26,100 | 23,800 | 26.0 | 0.112 | 0.292 |
| 83.4 | 4.66 | 43,200 | 39,500 | 24.4 | 0.106 | 0.247 |
| 73.6 | 3.49 | 83,100 | 74,800 | 31.7 | 0.064 | 0.395 |
| 56.4 | 4.52 | 239,000 | 218,000 | 25.1 | 0.106 | 0.297 |
| 54.0 | 3.54 | 615,000 | 553,000 | 31.3 | 0.110 | 0.227 |
| 51.5 | 6.34 | 1,220,000 | 1,130,000 | 18.4 | 0.181 | 0.847 |
| σ (MPa) | (cyc) | (cyc) | (cyc) | (%) | KS | AD | |
|---|---|---|---|---|---|---|---|
| 294.3 | 1.95 | 3660 | 5130 | 8380 | 20.7 | 0.076 | 0.680 |
| 220.7 | 1.81 | 5450 | 4930 | 9780 | 28.4 | 0.064 | 0.484 |
| 176.6 | 2.11 | 7730 | 5990 | 12,800 | 26.6 | 0.073 | 0.628 |
| 134.9 | 1.20 | 9710 | 8830 | 18,000 | 42.6 | 0.146 | 1.669 |
| 105.5 | 1.76 | 12,300 | 12,400 | 23,400 | 27.5 | 0.079 | 0.417 |
| 83.4 | 1.91 | 23,600 | 17,600 | 38,500 | 29.6 | 0.084 | 0.643 |
| 73.6 | 2.03 | 68,100 | 11,600 | 71,900 | 43.3 | 0.111 | 1.142 |
| 56.4 | 1.66 | 115,000 | 110,000 | 213,000 | 29.9 | 0.083 | 0.548 |
| 54.0 | 1.36 | 291,000 | 276,000 | 542,000 | 36.5 | 0.062 | 0.416 |
| 51.5 | 1.74 | 364,000 | 796,000 | 1,120,000 | 17.2 | 0.101 | 0.806 |
Disclaimer/Publisher’s Note: The statements, opinions and data contained in all publications are solely those of the individual author(s) and contributor(s) and not of MDPI and/or the editor(s). MDPI and/or the editor(s) disclaim responsibility for any injury to people or property resulting from any ideas, methods, instructions or products referred to in the content. |
© 2023 by the author. Licensee MDPI, Basel, Switzerland. This article is an open access article distributed under the terms and conditions of the Creative Commons Attribution (CC BY) license (https://creativecommons.org/licenses/by/4.0/).
Share and Cite
Harlow, D.G. Statistically Modeling the Fatigue Life of Copper and Aluminum Wires Using Archival Data. Metals 2023, 13, 1419. https://doi.org/10.3390/met13081419
Harlow DG. Statistically Modeling the Fatigue Life of Copper and Aluminum Wires Using Archival Data. Metals. 2023; 13(8):1419. https://doi.org/10.3390/met13081419
Chicago/Turabian StyleHarlow, D. Gary. 2023. "Statistically Modeling the Fatigue Life of Copper and Aluminum Wires Using Archival Data" Metals 13, no. 8: 1419. https://doi.org/10.3390/met13081419
APA StyleHarlow, D. G. (2023). Statistically Modeling the Fatigue Life of Copper and Aluminum Wires Using Archival Data. Metals, 13(8), 1419. https://doi.org/10.3390/met13081419


