Article

A Novel Quantitative Analysis Method for Lead Components in Waste Lead Paste

1
Key Laboratory for Ecological Metallurgy of Multimetallic Ores (Ministry of Education), Northeastern University, Shenyang 110819, China
2
Key Laboratory for Recycling of Nonferrous Metal Resources, Northeastern University, Shenyang 110819, China
3
School of Metallurgy, Northeastern University, Shenyang 110819, China
*
Authors to whom correspondence should be addressed.
Metals 2023, 13(9), 1517; https://doi.org/10.3390/met13091517
Submission received: 23 July 2023 / Revised: 22 August 2023 / Accepted: 23 August 2023 / Published: 26 August 2023
(This article belongs to the Special Issue Safe and Sustainable Management of Metal in Hazardous Wastes)

Abstract

:
In this study, a method for determining the lead components in waste lead paste was proposed, using simulated and spent lead paste as research objects. To compare the effectiveness of different determining methods, we selected three methods for comparison and investigated the reasons for measurement deviation. The results indicate that the measurement deviation in the current method primarily stems from the following three factors: (1) Pb is soluble in an acetic acid solution under certain conditions; (2) Pb and PbO2 undergo redox reactions; and (3) hydrogen peroxide can undergo redox reactions with Pb. It is feasible to determine the lead content using the kinetic rules of Pb and PbO2 in the acetic acid-hydrogen peroxide system. The method of determination proposed in this paper is as follows. Firstly, lead dioxide is dissolved in hydrogen peroxide under acidic conditions. Subsequently, the concentration of lead dioxide is determined, and the quantity of hydrogen peroxide consumed is recorded. Then, a new sample is taken, and the lead oxide is dissolved in an acetic acid solution. The concentration of lead oxide is determined using the EDTA·2Na titration method. The residue of lead sulfate in the filtrate is dissolved in a sodium chloride solution, and its concentration is determined using the EDTA·2Na titration method. Based on the previously recorded volume of hydrogen peroxide, the remaining lead dioxide in the residue is dissolved in a mixture of acetic acid and hydrogen peroxide. The remaining lead dioxide is then removed from the new sample employing kinetic principles. Finally, the residual metallic lead in the sample is dissolved in a nitric acid solution, and its concentration is determined using the EDTA·2Na titration method.

1. Introduction

According to statistics from the International Lead and Zinc Study Group, approximately 86% of refined lead produced globally each year is used for lead-acid battery production [1]. China is the world’s major producer and consumer of lead. Lead resources are mainly divided into primary lead resources and secondary lead resources. In nature, primary lead resources are predominantly found as lead-rich minerals, specifically galena (PbS), cerussite (PbCO3), and anglesite (PbSO4). Galena is the most widely distributed sulfide mineral, often found in hydrothermal veins or limestone, often associated with sphalerite (ZnS) and pyrite (FeS2) [2,3]. Secondary lead resources mainly come from waste lead-acid batteries. Lead-acid batteries (LABs) are often used as crucial power supply devices [4]. Compared with other rechargeable batteries such as nickel-cadmium batteries and lithium-ion batteries, lead-acid batteries have the advantages of low cost, high safety, and a high power quality ratio [5,6,7]. Although other new energy batteries, especially lithium batteries, have been developed rapidly in recent years, lead-acid batteries, due to their low cost, high safety, and high power quality ratio, still occupy a large proportion in the energy storage market [4,8,9]. With the increasing number of waste lead-acid batteries, waste lead-acid batteries, as secondary lead resources, have become the main source of lead. After crushing and sorting, waste lead-acid batteries are divided into lead paste, grids, plastic, and waste sulfuric acid. The grids can be reused after refining. The plastic particles can be used to manufacture new lead-acid battery casings. Waste sulfuric acid can be purified for use in manufacturing new batteries, or it can be neutralized and transported to wastewater treatment plants [4,10,11]. Spent lead paste, which is mainly composed of PbO, PbSO4, Pb, and PbO2 components, is the most difficult part to recycle in waste lead-acid batteries [12]. If not properly disposed of, waste lead-acid batteries (LABs) can lead to severe environmental pollution and health issues [13,14,15]. Lead is a highly toxic, accumulative heavy metal element, which, once released into the environment, can cause serious contamination of soil and water resources [16,17,18].
The study of the hydrometallurgical processing of waste lead paste adopts various techniques such as the desulfurization conversion–leaching–electrowinning process [19], direct leaching process [20], direct electrolysis [21,22], and organic acid leaching process [23,24,25], leading to differences in the order and methods of resource utilization for each component in waste lead paste. The determination of the content of each component in waste lead paste significantly affects the reagent dosages and other relevant process parameters for each step of the process. In a nitric acid solution, PbO2 in waste lead paste can be quantitatively oxidized with hydrogen peroxide, and the residual hydrogen peroxide can be further oxidized with potassium permanganate. Therefore, the content of PbO2 can be calculated according to the consumption of potassium permanganate. To determine PbO, PbSO4, and Pb, different solutions are typically used for selective dissolution, followed by titration with an EDTA solution. PbO usually dissolves in an acetic acid solution, PbSO4 dissolves in a sodium chloride or ammonium acetate solution, and Pb dissolves in a nitric acid solution. In addition to the differences in solution selection, the order of dissolution of the components in waste lead paste is not consistent in different determination methods. Table 1 lists several typical solutions used in different determination methods. We found that the selective dissolution effect of different solutions and dissolution conditions on each component in waste lead paste is distinct, which may result in biased measurement results.
In the process of waste lead paste recovery and resource utilization, a crucial issue is how to accurately and reliably detect the content of various components in the waste lead paste while precisely analyzing potential errors that may arise during the measurement process. At the current stage, there are still some controversies with regard to the methods used for measuring waste lead paste. Therefore, developing new measurement methods and comprehensively analyzing the factors that may lead to errors is of particular importance, which is a topic that should be addressed in both theoretical and practical fields. The determination of various component contents in waste lead paste can provide a fundamental evaluation of the value of waste lead paste recovery and resource utilization. By accurately determining the content of various components and analyzing potential errors, we can more accurately estimate the recovery value of waste lead batteries, thus influencing market trends and promoting the development of the waste lead battery recycling industry. Furthermore, the measurement of the waste lead paste component content also helps us maximize the resource utilization efficiency of waste lead paste. Accurate determination of the content of various components in waste lead paste can facilitate the optimization of recovery processes, enhance product quality, reduce production costs, and ultimately improve the overall level of resource utilization for waste lead paste. Research on waste lead paste measurement methods also plays a vital role in environmental protection. Through precise determination of waste lead paste component content, we can better predict potential environmental pollutants generated during the waste lead battery recycling process, take timely environmental protection measures, and reduce the negative impact of waste lead battery recycling on the environment. Therefore, researching waste lead paste measurement methods and the causes of potential errors in various measurement methods bears great significance for increasing waste lead paste resource utilization value, promoting the development of the waste lead paste recycling industry, and protecting the environment. This study adopted hydrogen peroxide, nitric acid, acetic acid, and sodium chloride solutions to selectively dissolve and determine each component in lead paste. Using simulated lead paste and waste lead paste as research subjects, a new method for determining the content of each component in waste lead paste was proposed and compared with three typical waste lead paste determination methods. The causes of differences in the results of various determination methods were investigated.

2. Materials and Methods

2.1. Materials and Devices

The waste lead paste samples used in this study were obtained from a lead-acid battery company in Zhejiang province. After drying, crushing, and grinding, the sample was sieved through a 60-mesh sieve for experimental research. The XRD of the samples used in the experiment is shown in Figure 1. The chemical reagents used in the experiment included lead oxide, lead powder, lead dioxide, lead sulfate, acetic acid, sodium acetate, ammonium acetate, hexamethylenetetramine, ethylenediaminetetraacetic acid disodium salt, hydrogen peroxide, potassium permanganate, and nitric acid, all of which were analytical-grade reagents. The necessary experimental equipment mainly included an HH-501 type super constant temperature water bath pot, an EN020 type precision electronic balance, a 101 type electric blast drying oven, a Z-2300 type flame atomic absorption spectrophotometer, an RW20 type overhead stirrer, and a DF-101S type heat-collecting constant temperature magnetic stirrer.

2.2. Methods

2.2.1. The Order of Determination

Figure 2 displays four distinct routes utilized for determining the lead components present in waste lead paste. Routes 1 and 2 are similar in that both measure the lead dioxide content in lead paste indirectly by first taking a sample and dissolving it in a hydrogen peroxide solution. Then, a new sample is taken, dissolved in an acetic acid solution, and the lead sulfate component is dissolved in a sodium chloride solution. Finally, the metallic lead is dissolved in a nitric acid solution. Route 3 follows a different testing sequence from routes 1 and 2. It first dissolves lead oxide in acetic acid solution, followed by dissolving lead from the residue filtered with hot nitric acid solution. Then, it dissolves lead sulfate component in ammonium acetate solution and finally dissolves lead dioxide component in hydrogen peroxide solution.
Route 4 is a modification of routes 1 and 2. Firstly, the lead dioxide is dissolved in hydrogen peroxide under an acidic environment. Subsequently, the concentration of lead dioxide in the sample is determined using the potassium permanganate titration method, and the consumed amount of hydrogen peroxide is recorded. Then, a new sample is taken, and the lead oxide is dissolved in an acetic acid solution, followed by determining the amount of lead oxide using the EDTA·2Na titration method. Next, the lead sulfate residue in the filtrate is dissolved in a sodium chloride solution, and the EDTA·2Na titration method is employed to measure the concentration of lead sulfate in the sample. In subsequent steps, based on the previously recorded hydrogen peroxide content, the remaining lead dioxide in the residue is dissolved in a mixture of acetic acid and hydrogen peroxide, and the lead dioxide is removed from the new sample using the principles of kinetics. Finally, the residual metallic lead in the sample is dissolved in a nitric acid solution, and the metallic lead content is determined by employing the EDTA2·Na titration method. Detailed determination conditions are shown in Section 2.2.2, Section 2.2.3, Section 2.2.4, Section 2.2.5.

2.2.2. Determining the PbO2 Content in Lead Paste

Weighing precisely 0.4 g of the sample (accurate to 0.0001 g), place it in a 15 mL 50% (v/v) nitric acid solution. Accurately add 5 mL of 2.5% (v/v) H2O2 solution using a pipette and gently shake for 30 min. Titrate the resulting solution with a C(KMnO4) = 0.1 mol/L standard solution until it turns light red (no color change for 30 s). Let the volume of potassium permanganate used for the blank experiment and the lead paste sample experiment be Vo (mL) and V (mL), respectively. Let m (g) be the mass of the sample and C (mol/L) be the concentration of the potassium permanganate standard solution. The titration accuracy of this method is ±0.1%. The formula for calculating the percentage content of PbO2 is
ω P b O 2 = 0.598 × C × ( V 0 V ) / m

2.2.3. Determining the PbO Content in Lead Paste

Weighing precisely 3 g of the sample (accurate to 0.0001 g), place it in 60 mL of 5% acetic acid solution. Stir for 20 min, let it sit for 10 min, and then filter it into a 200 mL volumetric flask. Rinse the beaker and the filter with acetic acid solution three times and use the filtrate to determine the content of PbO in the sample. The filter residue is used for the analysis of PbSO4. Dilute the filtrate with deionized water to the mark and shake well. Take 50 mL of the filtrate in a 250 mL Erlenmeyer flask, dilute with deionized water to 100 mL, and add 5 mL of 20% sodium acetate solution, 3 mL of 20% hexamethylenetetramine solution, and three drops of 0.5% xylenol orange. Titrate the solution using a C(C10H14N2O8Na2·2H2O) = 0.05 mol/L EDTA standard solution with a titration degree T (g/mL) calibrated beforehand, until the solution changes from purple-red to bright yellow. The titration accuracy of this method is ±0.1%. Calculate the mass fraction (ω) of PbO using the following formula:
ωPbO = (TVV1)/(mV2)
where V is the volume of the EDTA standard solution used, in mL; V1 is the total volume of the test solution, in mL; V2 is the volume of the test solution taken for analysis, in mL; m is the mass of the sample, in grams; and T is the titration degree of the EDTA standard solution for lead oxide, in g/mL.

2.2.4. Determining the PbSO4 Content in Lead Paste

The collected filter residue for PbSO4 analysis is placed in a beaker and mixed with 150 mL of 25% sodium chloride solution. The mixture is stirred thoroughly and allowed to stand for 1 h before being filtered into a 250 mL volumetric flask. A total of 4 mL of 50% (v/v) nitric acid solution is added to the filtrate, which is then washed three times with 10% sodium chloride solution along with the beaker, residue, and filter paper. The solution is diluted to the mark and mixed well. Then, 50 mL of the solution is transferred to a 250 mL triangular flask, followed by the addition of 5 mL of 20% sodium acetate solution, 3 mL of 20% hexamethylenetetramine solution, and three drops of 0.5% xylenol orange indicator. The titration accuracy of this method is ±0.1%. The solution is titrated with a standardized EDTA solution (with a titration degree of T g/mL) of concentration C (C10H14N2O8Na2·2H2O) = 0.05 mol/L, until the solution changes from purple-red to bright yellow.
ω P b S O 4   =   ( T V V 1 ) / ( m V 2 )
where V represents the amount of EDTA standard solution used, in mL; V1 represents the total volume of the test solution, in mL; V2 represents the volume of the test solution taken for analysis, in mL; m represents the mass of the sample, in grams; and T represents the titration factor of the EDTA standard solution against lead sulfate, in g/mL.

2.2.5. Determining the Pb Content in Lead Paste

The residue for PbSO4 determination is collected in a beaker, and 60 mL of 5% acetic acid and an equivalent molar amount of hydrogen peroxide as the PbO2 determination result are added to the beaker. The mixture is stirred continuously for 5 min and filtered to collect the residue in the beaker. Then, 2% (v/v) nitric acid solution is added to the beaker and heated with sufficient stirring for 1 h until dissolved. The solution is filtered into a 250 mL volumetric flask, and the beaker, residue, and filter are washed 3 times with 2% (v/v) nitric acid solution and diluted to the mark with shaking. Accurate neutralization is performed with 50% (v/v) ammonium hydroxide solution until the white precipitate no longer disappears. Then, 5 mL of 20% sodium acetate solution, 3 mL of 20% hexamethylenetetramine solution, and three drops of 0.5% xylenol orange are added. The solution is titrated with a standardized EDTA standard solution of concentration C(C10H14N2O8Na2·2H2O) = 0.05 mol/L, with a titration factor of T (g/mL), until the solution changes from purple-red to bright yellow. The titration accuracy of this method is ±0.1%.
ωPb = (TVV1)/(mV2)
where V represents the volume of the EDTA standard solution used, in mL; V1 represents the total volume of the test solution, in mL; V2 represents the volume of the test solution taken for analysis, in mL; m represents the mass of the sample, in grams; and T represents the titration factor of the EDTA standard solution against lead, in g/mL.

3. Results and Discussion

3.1. Simulated Lead Paste Test Comparison

In this experiment, four identical simulated lead paste samples were prepared, each weighing 3 g. The study utilized the method described in this paper, as well as three other methods proposed by three other scholars. The results are shown in detail in Figure 3. Among them, 1# represents the components of the simulated lead paste, while 2# [26], 3# [27], and 4# [28] represent the results of other determination methods, and 5# represents the results of the determination method proposed in this study. The results showed that the PbO content was slightly higher than the theoretical content.
Theoretically, the lead oxide content in the simulated lead paste accounts for 12 wt%; however, all four methodologies used for testing yielded a result of 12.7 wt%. This disparity could likely be due to the oxidation of lead powder in the air during the preparation process, resulting in a slightly higher measurement of lead oxide. The amount of PbSO4 determined by methods 2#, 3#, 4#, and 5# was all close to 54.59 wt%, approximating the theoretical value of 55 wt%. Yet, the amount of lead determined by these methods varied considerably. The lead content determined by methods 2#, 3#, 4#, and 5# were, respectively, 2.79 wt%, 12.43 wt%, 14.16 wt%, and 2.45 wt%, which deviated significantly from the theoretical 8 wt% lead content of the simulated lead paste. Likewise, the lead dioxide test results also exhibited differences. The simulated lead paste theoretically contains 25 wt% of lead dioxide, but the result obtained through method 4# was 22.43 wt%, while all the results from methods 2#, 3#, and 5# stood at 32.89 wt%.
Concerning the assessment of total lead, method 3# yielded a result of 113 wt%, above the theoretical content of 100 wt%. We hypothesize that this possibly occurred due to the sequence and the methods chosen during testing, resulting in certain lead components being repeatedly tested. Further research is needed to determine the reasons for the measurement results of Pb and PbO2, as well as the deviation in the total component content.

3.1.1. Analysis of PbO Determination Results

In order to investigate the reason for the overestimation of PbO in the simulated lead paste, we conducted a study on different components of the simulated lead paste. Under the consistent leaching conditions and measurement methods as those used in the lead oxide determination method described in this paper, the measurement results were calculated in terms of lead oxide. The specific measurement results are detailed in Table 2.
According to the results, it was found that the PbO content obtained when Pb exists alone in an acetic acid solution is only 8.3%. This may be due to the fact that lead itself is oxidized to PbO in the air, and PbO can dissolve in acetic acid. In addition, lead itself can also dissolve in an acetic acid solution with an oxygen concentration of less than 80% [29]. When PbO2 exists alone in an acetic acid solution, it does not dissolve. However, when Pb and PbO2 coexist, the measured PbO content increases to 15.0%. This may be because an oxidation-reduction reaction occurs when Pb and PbO2 coexist, and the reaction equation is as follows:
Pb + PbO2 + 4CH3COOH → 2Pb(CH3COO)2 + 2H2O

3.1.2. Analysis of Pb and PbO2 Determination Results

To investigate the sources of measurement deviation between the determined contents of Pb and PbO2 in the simulated lead paste and their theoretical values, this study measured the PbO2 content in the simulated lead paste and presented the results in terms of the PbO2 content. The simulated lead paste was dissolved using a solution of hydrogen peroxide and nitric acid, and the results are shown in Table 3.
Based on the results, it was found that the amount of PbO2 determined was approximately equal to the sum of the amounts of Pb and PbO2. This may be because hydrogen peroxide can not only reduce PbO2 but also oxidize Pb. When titrating the remaining hydrogen peroxide with potassium permanganate, what is measured is the residual amount of hydrogen peroxide consumed by both PbO2 and Pb. The reaction of Pb being oxidized by hydrogen peroxide can be expressed as
Pb + H2O2 + 2HNO3 → Pb(NO3)2 + 2H2O
Other possible reactions include [29]
2H2O2 → 2 H2O + O2
3Pb + 8HNO3 → 3Pb(NO3)2 + 2NO + 4H2O
Pb + 4HNO3 → Pb(NO3)2 + 2NO2 + 2H2O
An alternative method for determining the PbO2 content in waste lead paste is to selectively dissolve and remove other components in the sample first and then dissolve and determine PbO2. Lead is difficult to dissolve in a sodium chloride solution. Based on the previous results shown in Figure 3, it can be inferred that the cause of the Pb measurement error may be due to the redox reaction of PbO2 and Pb in a nitric acid solution. In order to explore the solubility of PbO2 and Pb in a nitric acid solution, this study prepared three simulated lead paste samples with different compositions, dissolved them in a 2% (v/v) nitric acid solution, and determined the lead concentration. The results are shown in Table 4.
The study shows that when only Pb is present, about 29.4% of Pb can be dissolved in a 2% (v/v) nitric acid solution, while when only PbO2 is present, PbO2 is almost insoluble in a 2% (v/v) nitric acid solution. However, when Pb and PbO2 coexist, 0.35 g of lead was detected to be dissolved in the 2% (v/v) nitric acid solution. This result may be due to the solubility of PbO2 in the 2% (v/v) nitric acid solution and the occurrence of a redox reaction in the presence of both Pb and PbO2, as shown in the following equation:
Pb + PbO2 + 4HNO3 → 2Pb(NO3)2 + 2H2O
There is also a reaction for the direct reaction of lead with nitric acid, as shown in reactions (8) and (9). Therefore, regardless of whether the indirect method of using potassium permanganate titration or the direct method of using EDTA titration is employed, the content of PbO2 in the waste lead paste will be affected by the presence of Pb. In addition, based on the results mentioned above, when lead and lead dioxide coexist in a weak or strong acid solution, they will undergo redox reactions. Therefore, we can infer that the reason why the sum of the measured components of sample No. 3 exceeds 100% may be due to the dissolution of a large amount of lead dioxide during the lead measurement, which leads to a higher measured content of lead than the actual content. However, the determination of lead dioxide was retested with a new sample, so it would not affect the determination result of lead dioxide.

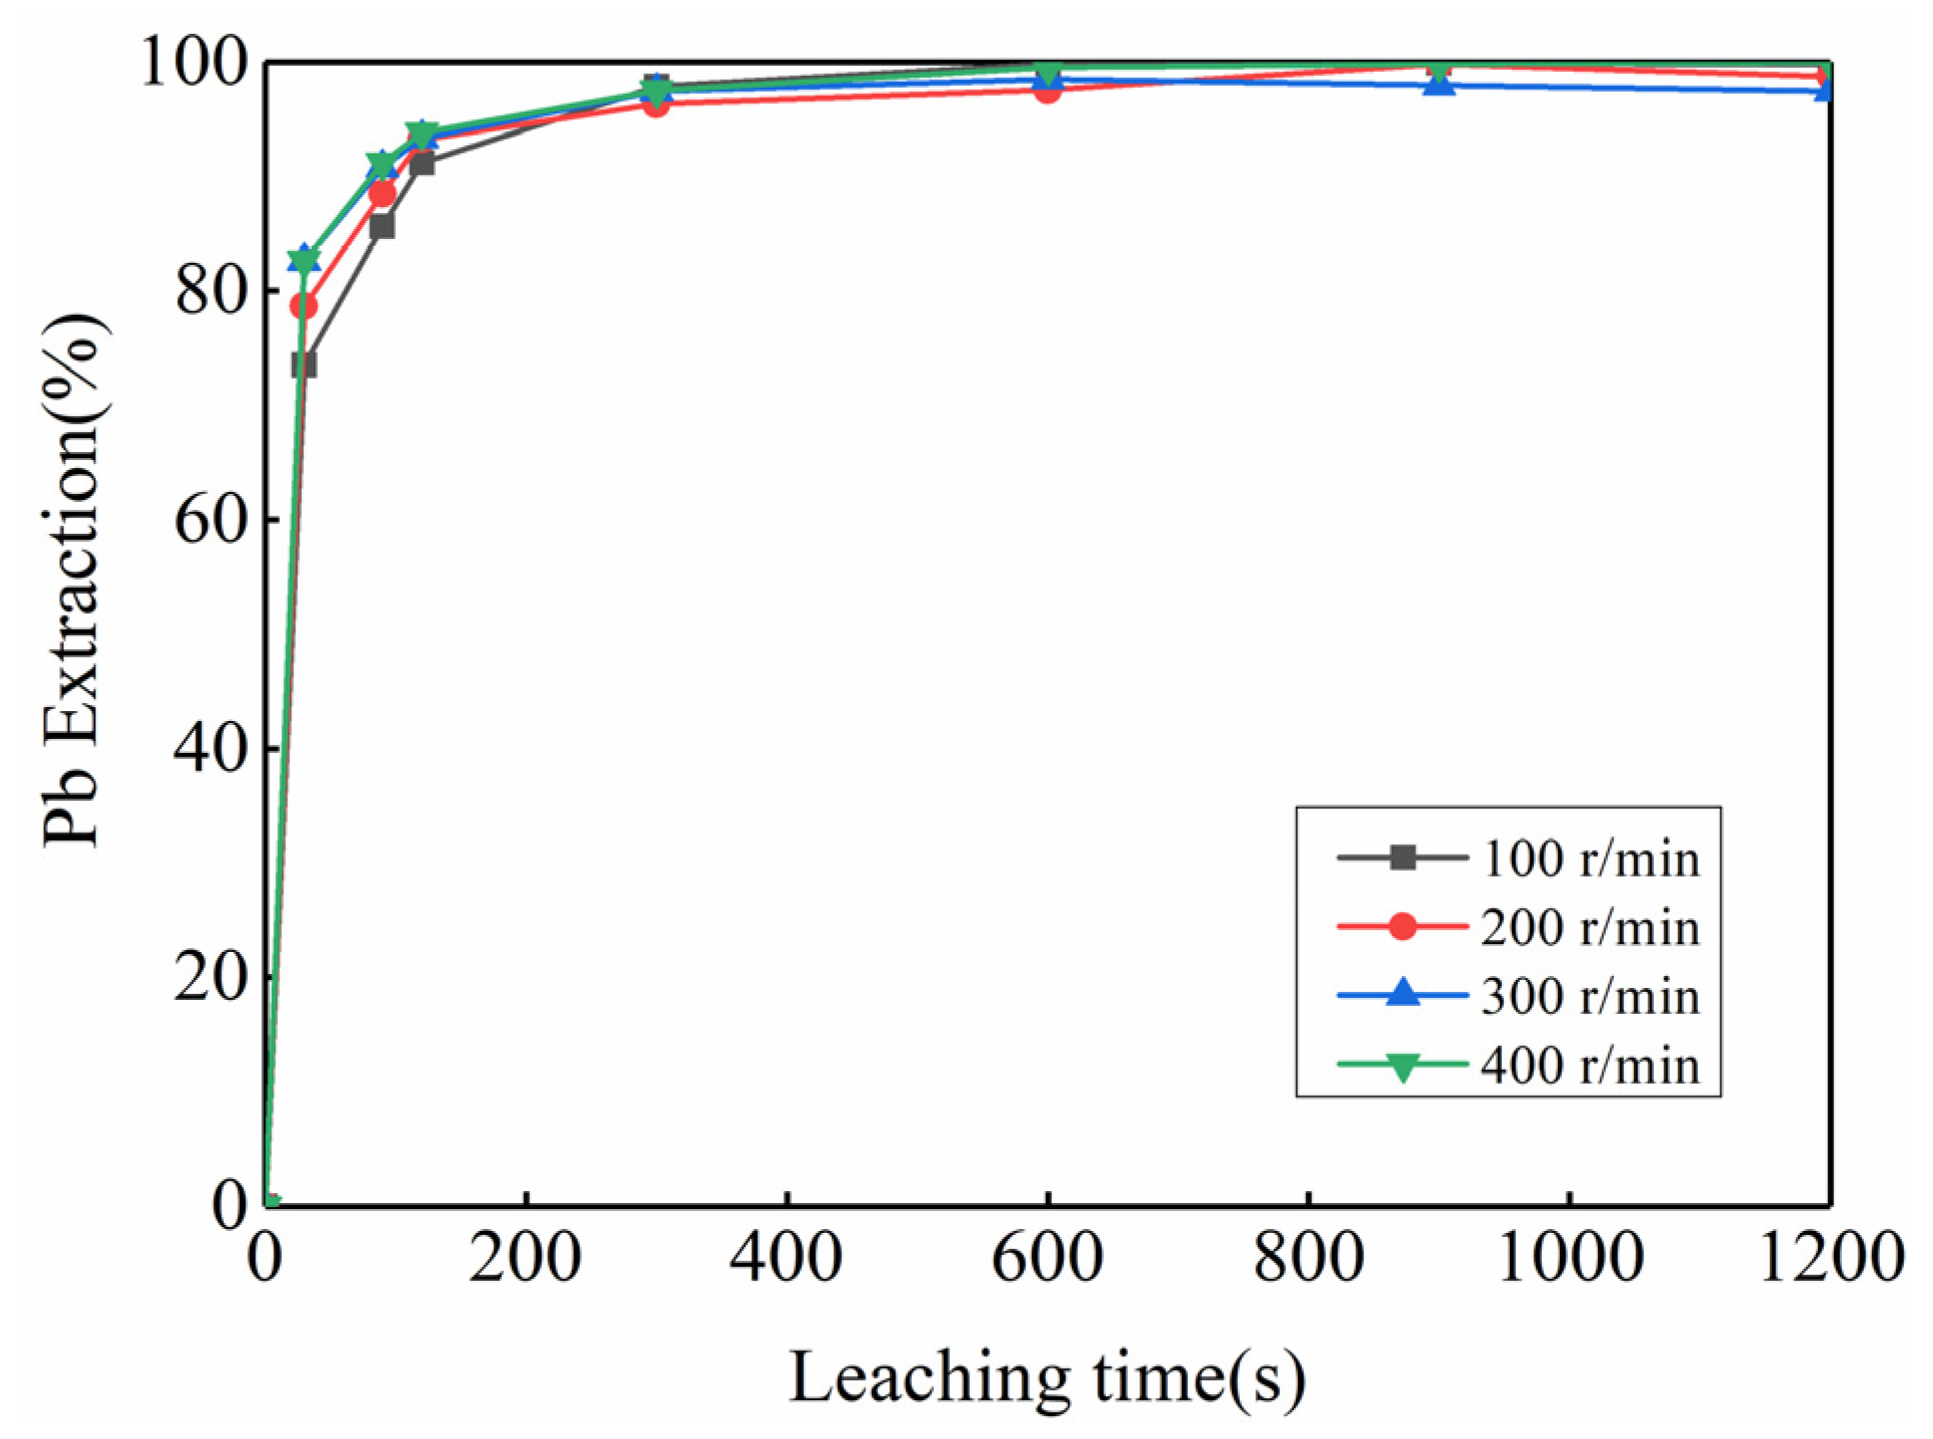
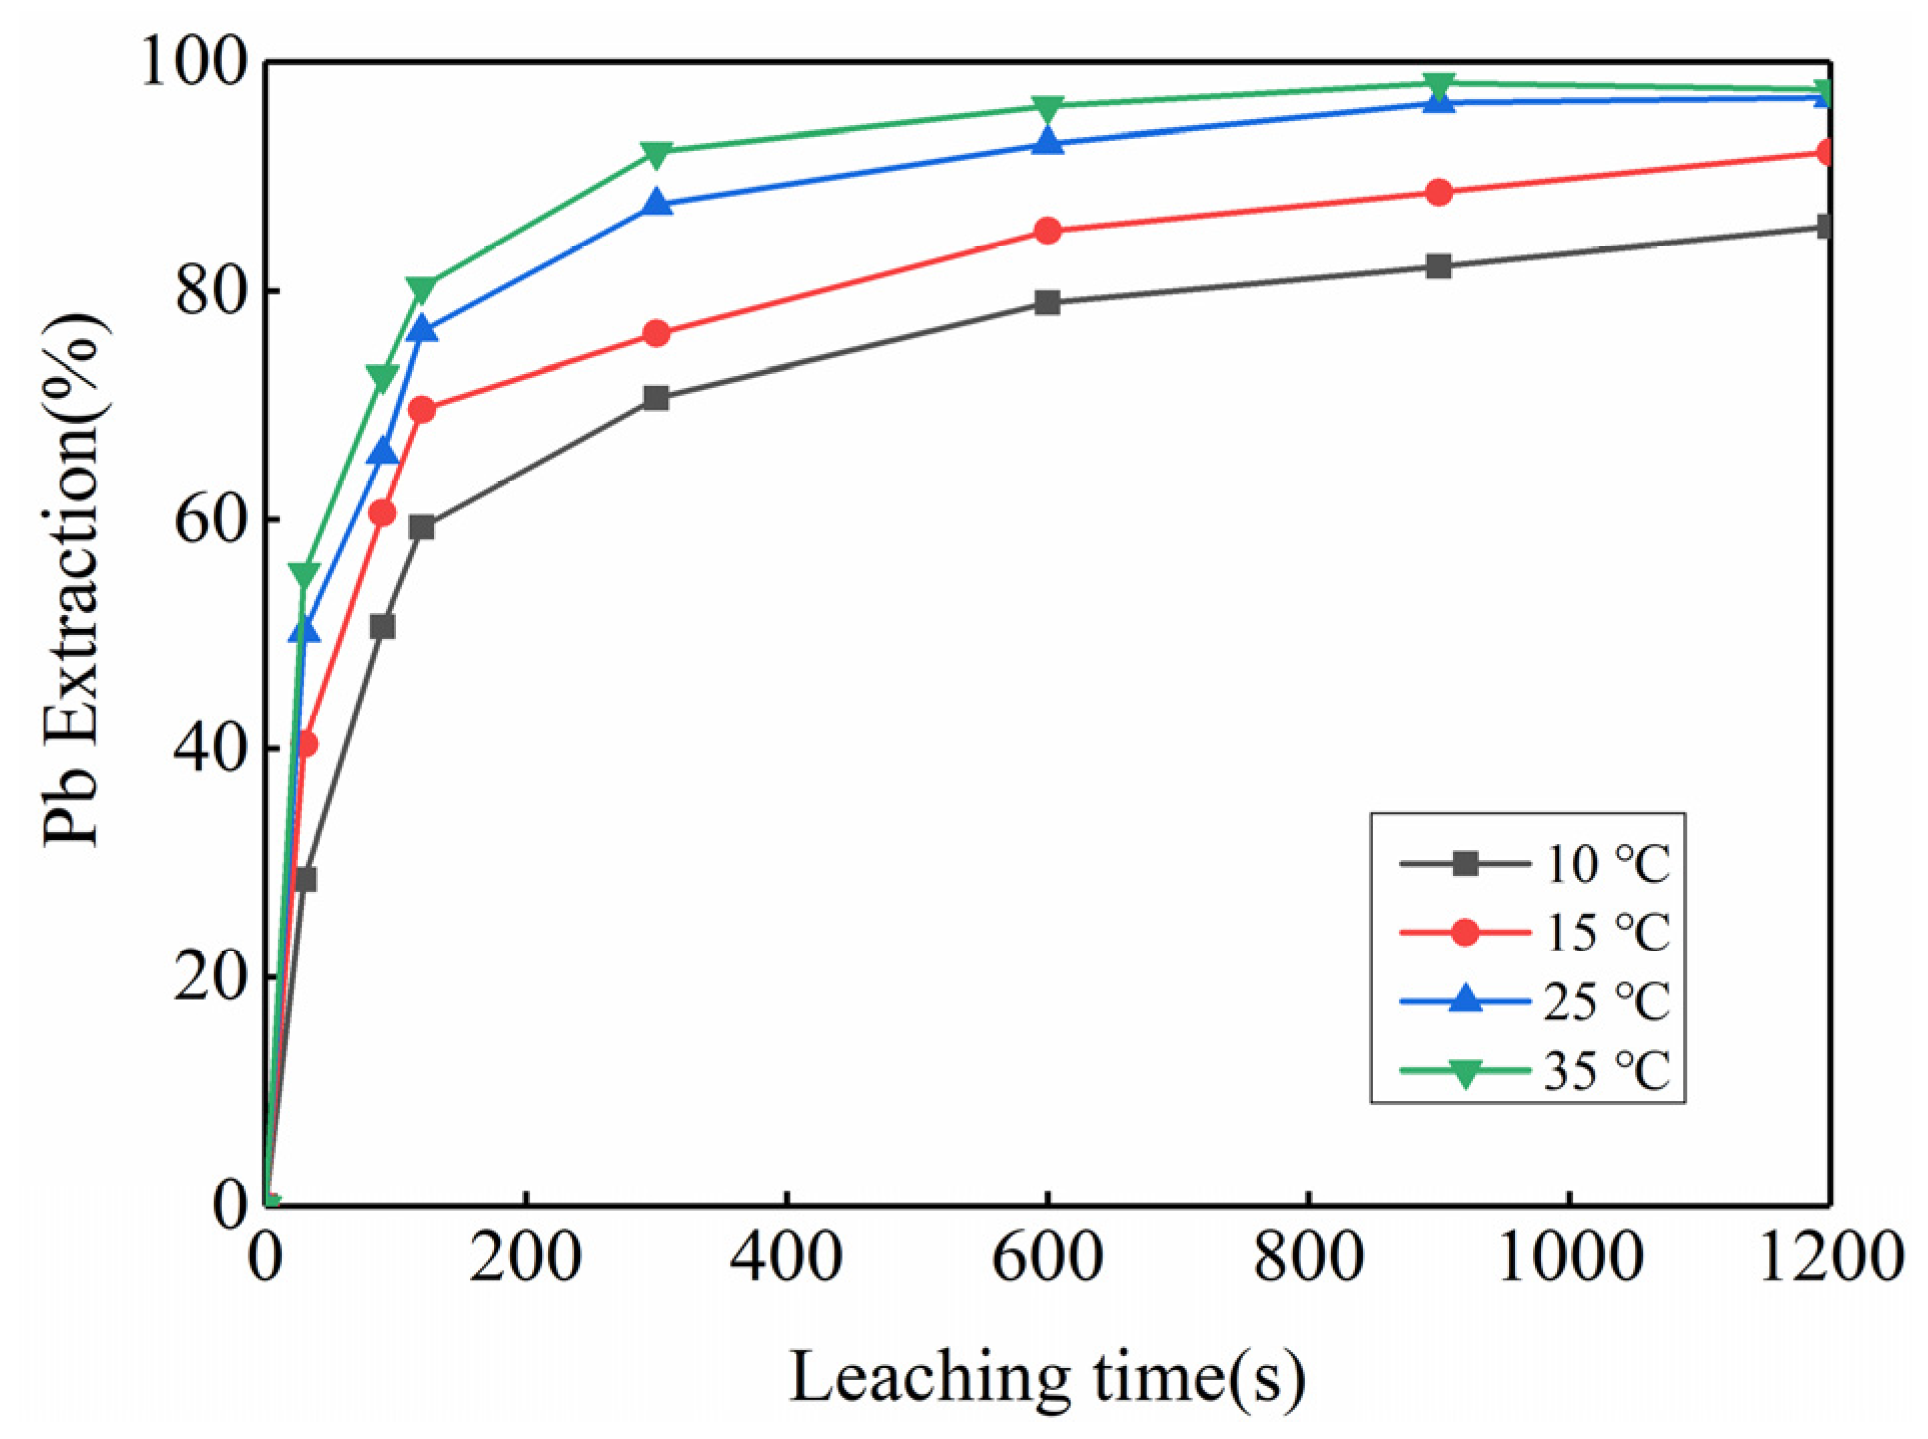
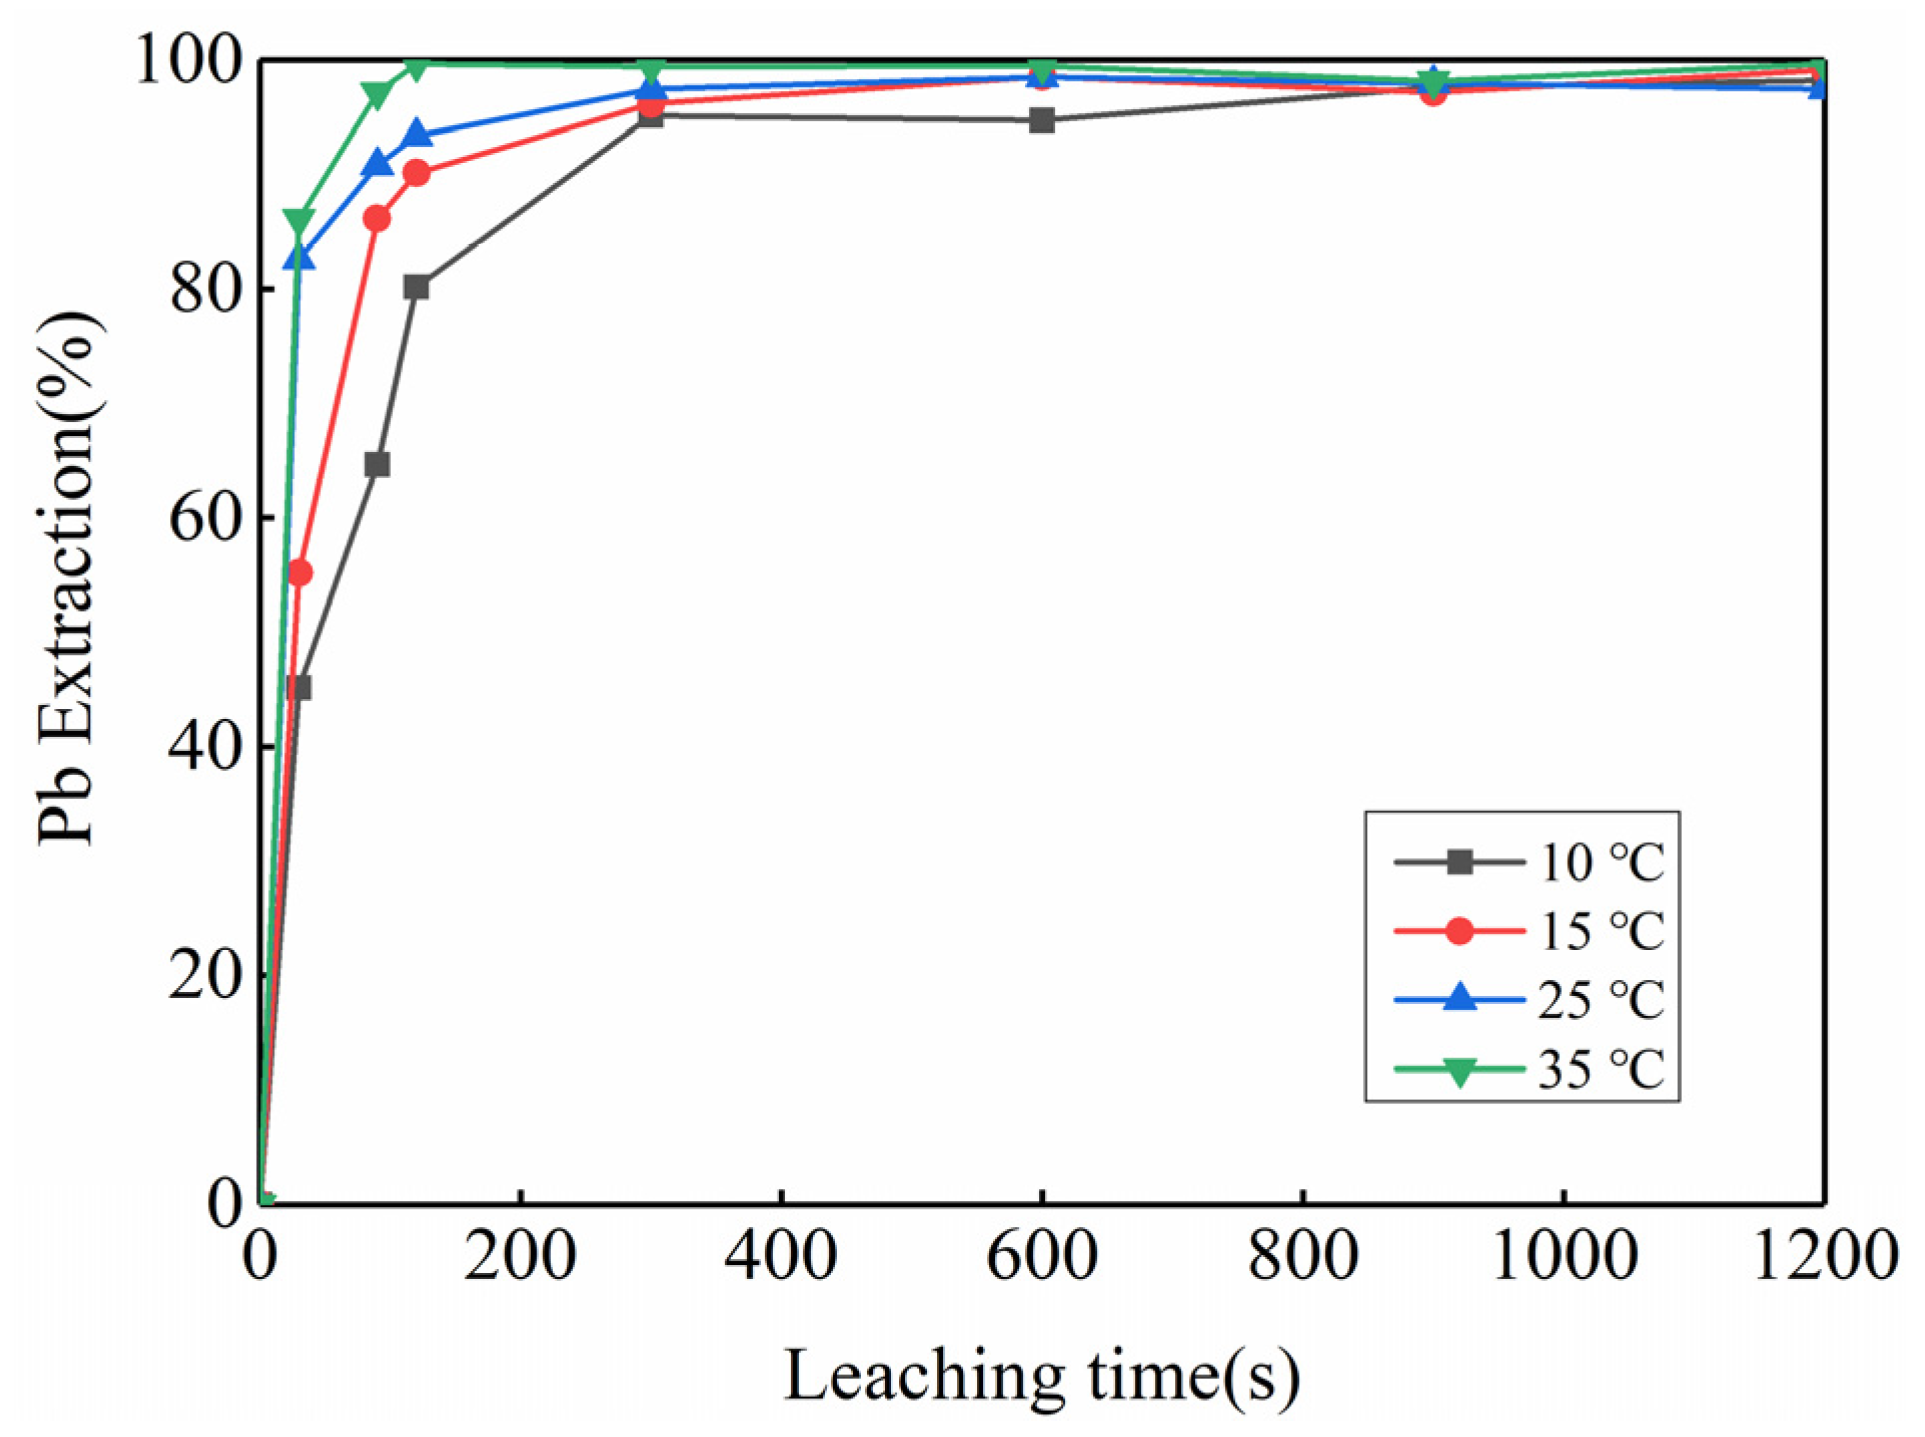
3.2. Feasibility Study of Using Kinetic Rules for PbO2 Removal

In order to explore the possibility of removing PbO2 by adopting kinetic rules, this experiment mainly studies the leaching kinetics of Pb and PbO2 in the acetic acid-lead peroxide system. The experiment first compared the impact of different stirring speeds on the leaching process under the following conditions: a leaching temperature of 25 °C, a liquid-to-solid ratio of 1:40 (i.e., 180 mL 20% acetic acid solution with 4.5 g Pb or 4.5 g PbO2), a hydrogen peroxide concentration of 0.16 mol/L, and stirring speeds of 100, 200, 300, and 400 r/min. At determined time points, 2 mL samples were taken with a syringe and quickly filtered through a PVDF needle filter. The experimental results are shown in Figure 4 and Figure 5. The results showed that in the leaching process of Pb, the impact on the leaching process was minimal when the stirring speed exceeded 300 r/min; in contrast, the stirring speed had no significant effect on the leaching process of PbO2. Therefore, in subsequent experiments, the selected stirring speed was 300 r/min.
Next, we investigated the impact of temperature on the leaching of lead and lead dioxide in the acetic acid-lead peroxide solution at 10 °C, 15 °C, 25 °C, and 35 °C, respectively. The results are shown in Figure 6 and Figure 7. It is evident from the results that at the same temperature, the leaching time of lead dioxide is significantly shorter than that of lead, and the leaching rate is much higher. For instance, at a leaching temperature of 35 °C, lead dioxide can reach a leaching rate of 97% in just 90 s, while under the same temperature and time conditions, the leaching rate of lead could only reach 72.61%. We carried out a fitting analysis on the experimental data, and the results are shown in Table 5.
From the fitting results, it can be seen that when the temperature is 10 °C and 15 °C, the measured data fit the model well. When the temperature is increased to 25 °C and 35 °C, the linear relationship between 1 − (1 − α)1/3 and t is not very obvious. According to Table 5, the apparent rate constants K of lead and lead dioxide at various temperatures in the acetic acid-lead dioxide system were derived. Figure 8 and Figure 9 were yielded by plotting LnK and 1/RT as the y-axis and x-axis, respectively. The slopes of the linear regression equations fitted in Figure 8 and Figure 9, obtained through the application of the Arrhenius equation, enable the computation of the apparent activation energy. Further calculations revealed that the apparent activation energy for lead in the acetic acid-lead dioxide system is 12.58 kJ/mol, while that for lead dioxide is 20.13 kJ/mol. These results revealed that the leaching process of lead in the acetic acid-lead dioxide system is primarily controlled by diffusion, whereas that of lead dioxide is predominantly influenced by mixed control.
By observing the apparent rate constant, we find that at the same temperature, the apparent rate constant K of lead dioxide in the acetic acid-peroxide system significantly exceeds that of lead. Based on kinetic laws, hydrogen peroxide can be used to consume lead dioxide in lead paste, while the dissolution rate of lead in acetic acid is relatively slow. Therefore, this method can remove lead dioxide from waste lead paste to a certain extent. In the chemical analysis detection method for the components of waste lead paste proposed in our study, we use the acetic acid-hydrogen peroxide system to remove PbO2 from the sample when determining the Pb content.

3.3. Spent Lead Paste Determination

We utilized an identical set of preprocessed waste lead pastes to draw a comparison between the determination method proposed in this study and those utilized by other researchers, with the comparison results illustrated in Figure 10. Among them, 1# [26], 2# [27], and 3# [28] each represent another researcher’s determination method, while 4# represents the method employed in this study. All four methods yielded an identical lead oxide content result of 11.53 wt%. In the determination of lead sulfate, the results of the 3# method were slightly higher than the others, with the lead sulfate contents measured by the 1#, 2#, and 4# methods being 35.89 wt%, 35.38 wt%, and 35.38 wt%, respectively. Further, when detecting lead dioxide content, methods 1#, 2#, and 4# yielded the same results at 38.87 wt%, while the results of method 3# were lower, at 32.42 wt%. This difference in results is primarily due to the reaction between lead and lead dioxide during the lead determination process in method 3#, resulting in partial dissolution of lead dioxide. Consequently, its content decreased correspondingly in the subsequent determination of lead dioxide content. Methods 1# and 2#, on the other hand, took a fresh sample for the determination of lead dioxide content, thus avoiding such an occurrence. However, resampling for lead dioxide also resulted in method 2# being higher than the other fractions in calculating the total lead mass fraction.

4. Conclusions

The current titration methods used to determine the content of lead oxide, lead dioxide, and lead in waste lead paste have limitations. Due to the variability in solvent selection and the sequencing of measurement, discrepancies exist among the results of various methods. Nevertheless, the method presented herein avoids the problem of repeated measurements of certain lead-containing components in waste lead paste. Typically, the pure lead within waste lead paste manifests in the form of a grid, which is usually selected individually for recovery during decomposition. As a result, the lead content in the waste lead paste is usually low (below 5% [30,31]). However, any elevation in lead content could have a significant impact on the results of certain methods. In summary, the importance of measuring the content of each component in waste lead paste during the recycling process is important.
The main reasons for the deviation in the measurement results are as follows: (1) under certain conditions, Pb can dissolve in an acetic acid solution; (2) Pb and PbO2 undergo redox reactions; and (3) hydrogen peroxide can undergo redox reactions with Pb. Although the method of removing lead dioxide from waste lead paste using kinetic rules and measuring the lead content is feasible, there is still a margin of error. It is difficult to separate the Pb and PbO2 components during the measurement process. Therefore, when measuring the content of each component in the waste lead paste, measuring the Pb and PbO2 components together can get a more accurate total lead content.

Author Contributions

Z.Z.: Investigation, Data collection, Writing—Original Draft. F.X.: Study design, Data analysis, Writing—Review and Editing. W.W.: Study design, Data analysis, Writing—Review and Editing. Y.-L.B.: Study design, Writing—Review and Editing. All authors have read and agreed to the published version of the manuscript.

Funding

Project (2019YFC1908303) supported by the National Key Research and Development Program of China.

Data Availability Statement

Not available.

Acknowledgments

The authors would like to acknowledge the funding support from the National Key Research and Development Program of China (2019YFC1908303).

Conflicts of Interest

The authors declare that they have no known competing financial interest or personal relationships that could have appeared to influence the work reported in this paper.

References

  1. ILZSG. The World Lead Factbook 2019. Available online: https://www.ilzsg.org/wp-content/uploads/SitePDFs/1_ILZSG%20Lead%20Factbook.pdf (accessed on 18 August 2023).
  2. Hurlbut, C.S. The 22nd Edition of the Manual of Mineral Science: (After James D. Dana); John Wiley & Sons: New York, NY, USA, 2002. [Google Scholar]
  3. Anthony, J.W.; Bideaux, R.A.; Bladh, K.W.; Nichols, M.C. Handbook of Mineralogy; Mineralogical Society of America: Chantilly, France, 2001. [Google Scholar]
  4. Jung, J.; Zhang, L.; Zhang, J. Lead-Acid Battery Technologies: Fundamentals, Materials, and Applications; CRC Press: Boca Raton, FL, USA, 2015; Volume 8. [Google Scholar]
  5. Shen, W.X. State of available capacity estimation for lead-acid batteries in electric vehicles using neural network. Energy Convers. Manag. 2007, 48, 433–442. [Google Scholar] [CrossRef]
  6. Ayeng’o, S.P.; Schirmer, T.; Kairies, K.-P.; Axelsen, H.; Sauer, D.U. Comparison of off-grid power supply systems using lead-acid and lithium-ion batteries. Sol. Energy 2018, 162, 140–152. [Google Scholar] [CrossRef]
  7. Dufo-López, R.; Lujano-Rojas, J.M.; Bernal-Agustín, J.L. Comparison of different lead–acid battery lifetime prediction models for use in simulation of stand-alone photovoltaic systems. Appl. Energy 2014, 115, 242–253. [Google Scholar] [CrossRef]
  8. Amrouche, S.O.; Rekioua, D.; Rekioua, T.; Bacha, S. Overview of energy storage in renewable energy systems. Int. J. Hydrogen Energy 2016, 41, 20914–20927. [Google Scholar] [CrossRef]
  9. Goodenough, J.B. Rechargeable batteries: Challenges old and new. J. Solid State Electrochem. 2012, 16, 2019–2029. [Google Scholar] [CrossRef]
  10. Huang, K.; Liu, H.Y.; Dong, H.L.; Lin, M.; Ruan, J.J. A novel approach to recover lead oxide from spent lead acid batteries by desulfurization and crystallization in sodium hydroxide solution after sulfation. Resour. Conserv. Recycl. 2021, 167, 105385. [Google Scholar] [CrossRef]
  11. Jie, X.; Yao, Z.; Wang, C.; Qiu, D.; Chen, Y.; Zhang, Y.; Ma, B.; Gao, W. Progress in Waste Lead Paste Recycling Technology from Spent Lead–Acid Battery in China. J. Sustain. Metall. 2022, 8, 978–993. [Google Scholar] [CrossRef]
  12. Li, M.; Yang, J.; Liang, S.; Hou, H.; Hu, J.; Liu, B.; Kumar, R.V. Review on clean recovery of discarded/spent lead-acid battery and trends of recycled products. J. Power Sources 2019, 436, 226853. [Google Scholar] [CrossRef]
  13. Khan, M.A.; Ramzani, P.M.A.; Zubair, M.; Rasool, B.; Khan, M.K.; Ahmed, A.; Khan, S.A.; Turan, V.; Iqbal, M. Associative effects of lignin-derived biochar and arbuscular mycorrhizal fungi applied to soil polluted from Pb-acid batteries effluents on barley grain safety. Sci. Total Environ. 2020, 710, 136294. [Google Scholar] [CrossRef]
  14. Yadav, S.K.; Patil, G.P.; Virmagami, A.; Bijalwan, V.; Devi, K.; Chauhan, A.; Gupta, S.K.; Fathima, S.; Naorem, C.D.; Yadav, S.; et al. Occupational lead exposure is an independent modulator of hypertension and poor pulmonary functions: A cross-sectional comparative study in lead-acid battery recycling workers. Toxicol. Ind. Health 2022, 38, 139–150. [Google Scholar] [CrossRef]
  15. Li, Y.M.; Wang, Y.; Chen, M.J.; Huang, T.Y.; Yang, F.H.; Wang, Z.J. Current status and technological progress in lead recovery from electronic waste. Int. J. Environ. Sci. Technol. 2023, 20, 1037–1052. [Google Scholar] [CrossRef]
  16. Helser, J.; Vassilieva, E.; Cappuyns, V. Environmental and human health risk assessment of sulfidic mine waste: Bioaccessibility, leaching and mineralogy. J. Hazard. Mater. 2022, 424, 127313. [Google Scholar] [CrossRef]
  17. Chowdhury, K.I.A.; Nurunnahar, S.; Kabir, M.L.; Islam, M.T.; Baker, M.; Islam, M.S.; Rahman, M.; Hasan, M.A.; Sikder, A.; Kwong, L.H.; et al. Child lead exposure near abandoned lead acid battery recycling sites in a residential community in Bangladesh: Risk factors and the impact of soil remediation on blood lead levels. Environ. Res. 2021, 194, 110689. [Google Scholar] [CrossRef] [PubMed]
  18. Kumar, S.; Rahman, M.A.; Islam, M.R.; Hashem, M.A.; Rahman, M.M. Lead and other elements-based pollution in soil, crops and water near a lead-acid battery recycling factory in Bangladesh. Chemosphere 2022, 290, 133288. [Google Scholar] [CrossRef]
  19. Ferracin, L.C.; Chácon-Sanhueza, A.E.; Davoglio, R.A.; Rocha, L.O.; Caffeu, D.J.; Fontanetti, A.R.; Rocha-Filho, R.C.; Biaggio, S.R.; Bocchi, N. Lead recovery from a typical Brazilian sludge of exhausted lead-acid batteries using an electrohydrometallurgical process. Hydrometallurgy 2002, 65, 137–144. [Google Scholar] [CrossRef]
  20. Andrews, D.; Raychaudhuri, A.; Frias, C. Environmentally sound technologies for recycling secondary lead. J. Power Sources 2000, 88, 124–129. [Google Scholar] [CrossRef]
  21. Yu, J.J.; Cao, J.; Zhou, S.Q.; Wu, L.; Chen, Z.Y.; Fu, F.B.; Rao, Y.Z.; Zhang, R. Directly Recovering Lead and Recycling Electrolyte via Electrolyzing Desulfurized Lead Paste with PVDF as Binder. J. Sustain. Metall. 2023, 9, 172–182. [Google Scholar] [CrossRef]
  22. Dai, F.S.; Huang, H.; Chen, B.M.; Zhang, P.P.; He, Y.P.; Guo, Z.C. Recovery of high purity lead from spent lead paste via direct electrolysis and process evaluation. Sep. Purif. Technol. 2019, 224, 237–246. [Google Scholar] [CrossRef]
  23. Sun, X.; Yang, J.; Zhang, W.; Zhu, X.; Hu, Y.; Yang, D.; Yuan, X.; Yu, W.; Dong, J.; Wang, H.; et al. Lead acetate trihydrate precursor route to synthesize novel ultrafine lead oxide from spent lead acid battery pastes. J. Power Sources 2014, 269, 565–576. [Google Scholar] [CrossRef]
  24. Ye, L.; Duan, L.; Liu, W.; Hu, Y.; Ouyang, Z.; Yang, S.; Xia, Z. Facile method for preparing a nano lead powder by vacuum decomposition from spent lead-acid battery paste: Leaching and desulfuration in tartaric acid and sodium tartrate mixed lixivium. Hydrometallurgy 2020, 197, 105450. [Google Scholar] [CrossRef]
  25. Hu, G.; Zhang, P.Y.; Yang, J.K.; Li, Z.Y.; Liang, S.; Yu, W.H.; Li, M.Y.; Tong, Y.X.; Hu, J.P.; Hou, H.J.; et al. A closed-loop acetic acid system for recovery of PbO@C composite derived from spent lead-acid battery. Resour. Conserv. Recycl. 2022, 184, 106391. [Google Scholar] [CrossRef]
  26. Zhu, X.F. Study on Leaching Process of Spent Lead Battery Paste with Organic Acid and Preparation of Ultrafine Lead Oxide by Calcination at Low Temperature. Ph.D. Dissertation, Huazhong University of Science and Technology, Wuhan, China, 2012. (In Chinese). [Google Scholar]
  27. Wang, Y. Study on the New Hydrometallurgical Process Ofpreparing Lead Chemical Products from Diachylum in Waste Lead Storage Battery. Master’s Thesis, Hefei University of Technology, Hefei, China, 2010. (In Chinese). [Google Scholar]
  28. Zhang, X. Study on New Recovery Technology and Electrochemical performance of High Purity Lead and α-PbO from the Spent Lead Acid Batteries. Ph.D. Dissertation, Beijing University of Chemical Technology, Beijing, China, 2017. (In Chinese). [Google Scholar]
  29. Liu, G.L. Introduction to Lead-Acid Battery Processing; Machine Press: Beijing, China, 2009. [Google Scholar]
  30. Yang, T.Z.; Xie, B.Y.; Liu, W.F.; Zhang, D.C.; Chen, L. An environment-friendly process of lead recovery from spent lead paste. Sep. Purif. Technol. 2020, 233, 116035. [Google Scholar] [CrossRef]
  31. Wu, Y.Z.; Chen, Z.; Yu, Q.; Zhu, W.; Li, S.T.; Han, L.; Li, S.T.; Lu, X.; Yuan, J.L.; Lv, Z.; et al. Preparation of high-purity lead carbonate and lead oxide from spent lead paste. J. Clean. Prod. 2022, 372, 133786. [Google Scholar] [CrossRef]
Figure 1. The XRD pattern of spent lead paste specimen.
Metals 13 01517 g001
Figure 2. Flowchart of different dissolution methods for lead determination.
Metals 13 01517 g002
Figure 3. Different methods of determination results.
Metals 13 01517 g003
Figure 4. Effect of stirring speed on the leaching process of lead.
Metals 13 01517 g004
Figure 5. Effect of stirring speed on the leaching process of lead dioxide.
Metals 13 01517 g005
Figure 6. Effect of temperature on lead leaching process.
Metals 13 01517 g006
Figure 7. Effect of temperature on the leaching process of lead dioxide.
Metals 13 01517 g007
Figure 8. Arrhenius plot of the leaching reaction of lead.
Metals 13 01517 g008
Figure 9. Arrhenius plot of the leaching reaction of lead dioxide.
Metals 13 01517 g009
Figure 10. Determination results.
Metals 13 01517 g010
Table 1. Dissolution conditions for different measurement methods, data from [26,27,28].
PbO2PbOPbSO4PbReference
15 mL 50% (v/v) HNO3; 5 mL 2.5% (v/v) H2O2;
Gently shake for 30 min
60 mL 5% CH3COOH;
Dissolve with stirring for 30 min
150 mL 25% NaCl solution;
Dissolve with continuous stirring for 1 h or leave overnight after stirring
50 mL 2% (v/v) HNO3; Dissolve with continuous stirring for 30 min[26]
10 mL 20% (v/v) HNO3; 5 mL 1% H2O2; Gently shake40 mL 5% CH3COOH;
Dissolve with stirring for 3~5 min; leave for 15 min
25% NaCl solution;
Dissolve with continuous stirring and leave for 1 h
Slightly hot 30 mL 20% (v/v) HNO3 solution;
Rinsed in several times
[27]
3 wt.% H2O220 vol.% CH3COOH;20 wt.% ammonium acetate; Dissolved by heating, slightly boiled for 5 min40 vol.% HNO3;
Dissolve by heating, boil slightly for 5 min
[28]
Table 2. PbO determination results.
NumberSimulated Lead Paste gDetermination of PbO g
PbPbO2
1#0.250/0.02
2#/0.7500.00
3#0.2500.7500.15
Table 3. PbO2 determination results.
NumberSimulated Lead Paste gDetermination of PbO2 g
PbPbO2
1#0.0330.1000.13 g
Table 4. Pb determination results.
NumberSimulated Lead Paste gDetermination of Pb g
PbPbO2
1#0.250/0.07
2#/0.7500.01
3#0.2500.7500.35
Table 5. The fitted equations at different temperature.
TemperaturePbPbO2
Fitted EquationR2Fitted EquationR2
10 °C1 − (1 − α)1/3 = 0.0155 + 0.0022 × t0.96191 − (1 − α)1/3 = 0.0338 + 0.0032 × t0.9512
15 °C1 − (1 − α)1/3 = 0.0298 + 0.0028 × t0.91371 − (1 − α)1/3 = 0.0316 + 0.0052 × t0.9701
25 °C1 − (1 − α)1/3 = 0.0460 + 0.0031 × t0.84361 − (1 − α)1/3 = 0.1109 + 0.0055 × t0.7455
35 °C1 − (1 − α)1/3 = 0.0508 + 0.0036 × t0.85841 − (1 − α)1/3 = 0.1076 + 0.0071 × t0.8401
Disclaimer/Publisher’s Note: The statements, opinions and data contained in all publications are solely those of the individual author(s) and contributor(s) and not of MDPI and/or the editor(s). MDPI and/or the editor(s) disclaim responsibility for any injury to people or property resulting from any ideas, methods, instructions or products referred to in the content.

