Article

Creep Behavior and Deformation Mechanism of a Third-Generation Single Crystal Ni-Based Superalloy at 980 °C

Science and Technology on Advanced High Temperature Structure Materials Laboratory, AECC Key Laboratory of Aeronautical Materials Testing and Evaluation, Beijing Key Laboratory of Aeronautical Materials Testing and Evaluation, Beijing Institute of Aeronautical Materials, Beijing 100095, China
*
Author to whom correspondence should be addressed.
Metals 2023, 13(9), 1541; https://doi.org/10.3390/met13091541
Submission received: 9 August 2023 / Revised: 25 August 2023 / Accepted: 29 August 2023 / Published: 1 September 2023
(This article belongs to the Special Issue High-Temperature Oxidation and Corrosion of Structured Materials)

Abstract

:
As the primary choice for aero-engine turbine blades, creep resistance is an important mechanical property for the developing third-generation single crystal Ni-based superalloys. The creep behavior of the superalloy in the [001] orientation was studied at 980 °C under a series of stress levels, accompanied with scanning electron microscope (SEM) and transmission electron microscope (TEM) observation to investigate the microstructure and deformation mechanism. The deformation mechanism of the alloy is found to be dislocation gliding, propagating and forming a dislocation network in the γ/γ′ interface. Dislocation networks could hinder the movement of dislocation and decrease the creep rate to a constant during the steady-creep stage. The formation of dislocation networks was analyzed due to the interaction of <110> {111} dislocations. Then dislocations cut into γ′ phases as individual <110> super-dislocations, anti-phase boundary dislocation pairs, and stacking faults. The <110> super-dislocation in the γ′ phase may cross-slip into the {001} plane from the {111} plane to form Kear–Wilsdorf locks, which could inhibit dislocations from gliding or cross-slipping and then enhance the creep resistance.

1. Introduction

Single crystal (SX) Ni-based superalloys are prominently favored as primary material choices for aero-engine turbine blades due to their exceptional mechanical properties, particularly under elevated temperatures [1]. Given the operational conditions involving significantly high temperatures, the failure by creep deformation emerges as a primary concern for turbine blade. Addressing this concern has led to a recent emphasis on materials capable of withstanding even higher service temperatures. The addition of the refractory element Re into SX Ni-based superalloys, thereby engendering third-generation superalloys, offers the potential for extended service at elevated temperatures [2,3,4,5]. The inclusion of Re serves to impede the diffusion of the other elements in the alloys, enhancing the resistance to creep and bolstering high-temperature tolerance [6,7]. Moreover, Re’s influence extends to modulating dislocation movement during creep and decreasing the stacking fault energy within the alloys [8].
During creep, the deformation mechanisms within the alloys are closely associated with dislocation movement. In the initial creep stage, the dislocation density in the γ matrix initiates at zero and gradually increases as creep progresses, leading to a decline in the creep strain rate [9]. Notably, the emergence of interfacial dislocation networks during the initial creep phase hampers dislocations shearing into γ′ phases, thus, contributing to the decline in the creep rate [10,11,12,13]. Studies have indicated that denser dislocation networks at the γ/γ′ interface result in lower minimum creep rates during the steady-creep stage [14,15]. Additionally, the incorporation of elements such as Re, Cr, and Co was shown to decelerate the creep strain rate during the steady-creep stage by coupling with interfacial dislocations [16]. As the tertiary creep stage ensues, dislocations shear into γ′ phases and decompose to various configurations. Tian [8] revealed that the configuration of <112> dislocation partials coupled with stacking faults was found during creep at 760 °C in a superalloy containing 2% Re, which was absent at 1070 °C. It is evident that the movement of dislocations is governed by temperature, stress, and chemical composition. The dislocations shearing into the γ′ phase could form configurations such as Kear–Wilsdorf (K-W) locks and K-W locks combined with antiphase boundary (APB), effectively heightening the resistance to deformation within the alloys [17,18,19,20,21]. It is pertinent to note that the majority of these investigations pertain to first- and second-generation superalloys. With the higher content of refractory element Re, a comprehensive understanding of the deformation mechanisms in third-generation SX Ni-based superalloys is imperative.
Therefore, a third-generation SX Ni-based superalloy was used in the present work. The creep behavior and dislocation configuration of the alloy at high temperature (980 °C) were investigated to rationalize deformation mechanisms, especially the formation of interfacial dislocation networks and dislocation configuration in the γ′ phase.

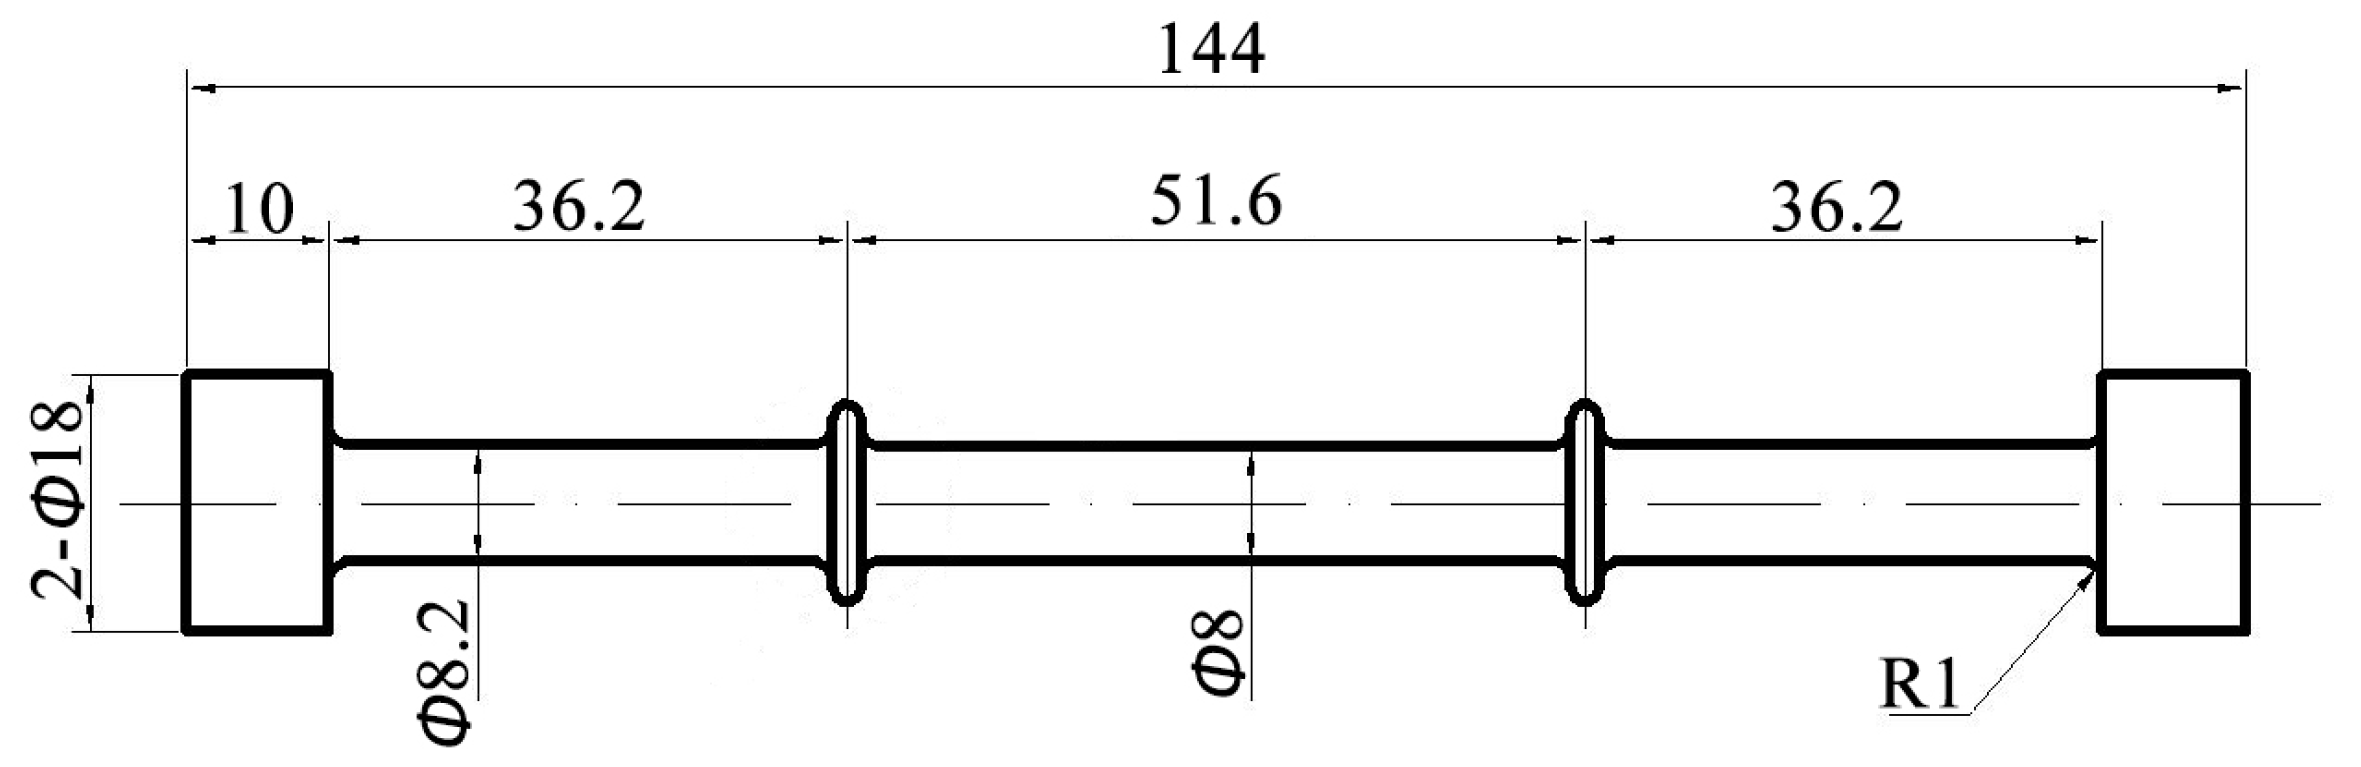
2. Materials and Methods

The investigation employed a third-generation SX Ni-based superalloy for the experiments, which is developed by the Beijing Institute of Aeronautical Materials, China. The alloy composition comprises 4.5 wt.% of Re and a cumulative 16 wt.% of other refractory elements, including W, Mo, Ta, and Nb [2,22]. The chemical compositions are detailed in Table 1. The superalloy specimens were directionally solidified within a vacuum furnace to form single-crystal bars oriented along the [001] crystallographic axis. Only those single-crystal bars deviating within 5° from the [001] orientation were selected for subsequent creep testing. To optimize the morphology and volume of γ′ precipitates, a heat treatment regimen was applied to the alloy, comprising stages of 1613 K/6 h/air cooling + 1393 K/4 h/air cooling + 1143 K/32 h/air cooling. The tensile properties of the alloy at both room temperature (RT) and 980 °C are tabulated in Table 2.
After the heat treatment, the single-crystal bars were machined to creep specimens with dimensions as illustrated in Figure 1. These specimens featured a gage segment measuring 51.6 mm in length and 10 mm in diameter. The creep experiments were conducted at an elevated temperature of 980 °C under varying tensile loads from 200 MPa to 410 MPa. Three additional creep tests were performed at 980 °C/300 MPa, with interruption points at 2 h, 10 h, and 50 h of creep, respectively. During the creep tests, temperature fluctuations were confined within a range of ±2 °C, while extensometers were employed to record the progression of creep strain until the fracture occurred. The microstructure evolution was observed by employing a scanning electron microscope (SEM). The specimens were cut from the gage segments, along with the direction of the applied stresses. The observed surfaces were in the (100) crystal plane. After polishing and metallographic corrosion by a solute of 10% copper sulfate and 60% hydrochloric acid, the specimens were observed by a Quanta FEG 450 microscope (FEI Company, Hillsboro, OR, USA) and EVO 18 microscope (Carl Zeiss AG, Oberkochen, Germany). Furthermore, for transmission electron microscopy (TEM) analysis, specimens were sliced from the midsection of the gage segments, aligned with both [001] and [011] orientations. After reducing their thickness to 50 μm through grinding with metallographic sandpaper, the specimens underwent twin-jet electropolishing, utilizing an electrolyte composed of 10 wt.% perchloric acid and 90 wt.%. absolute ethyl alcohol. The TEM investigations were conducted using a JEM-2010F microscope operating at a voltage of 200 kV, and the images at the diffraction vectors g = 02 2 ¯ , g = 11 1 ¯ , g = 1 1 ¯ 1 , and g = 200 were observed.

3. Results

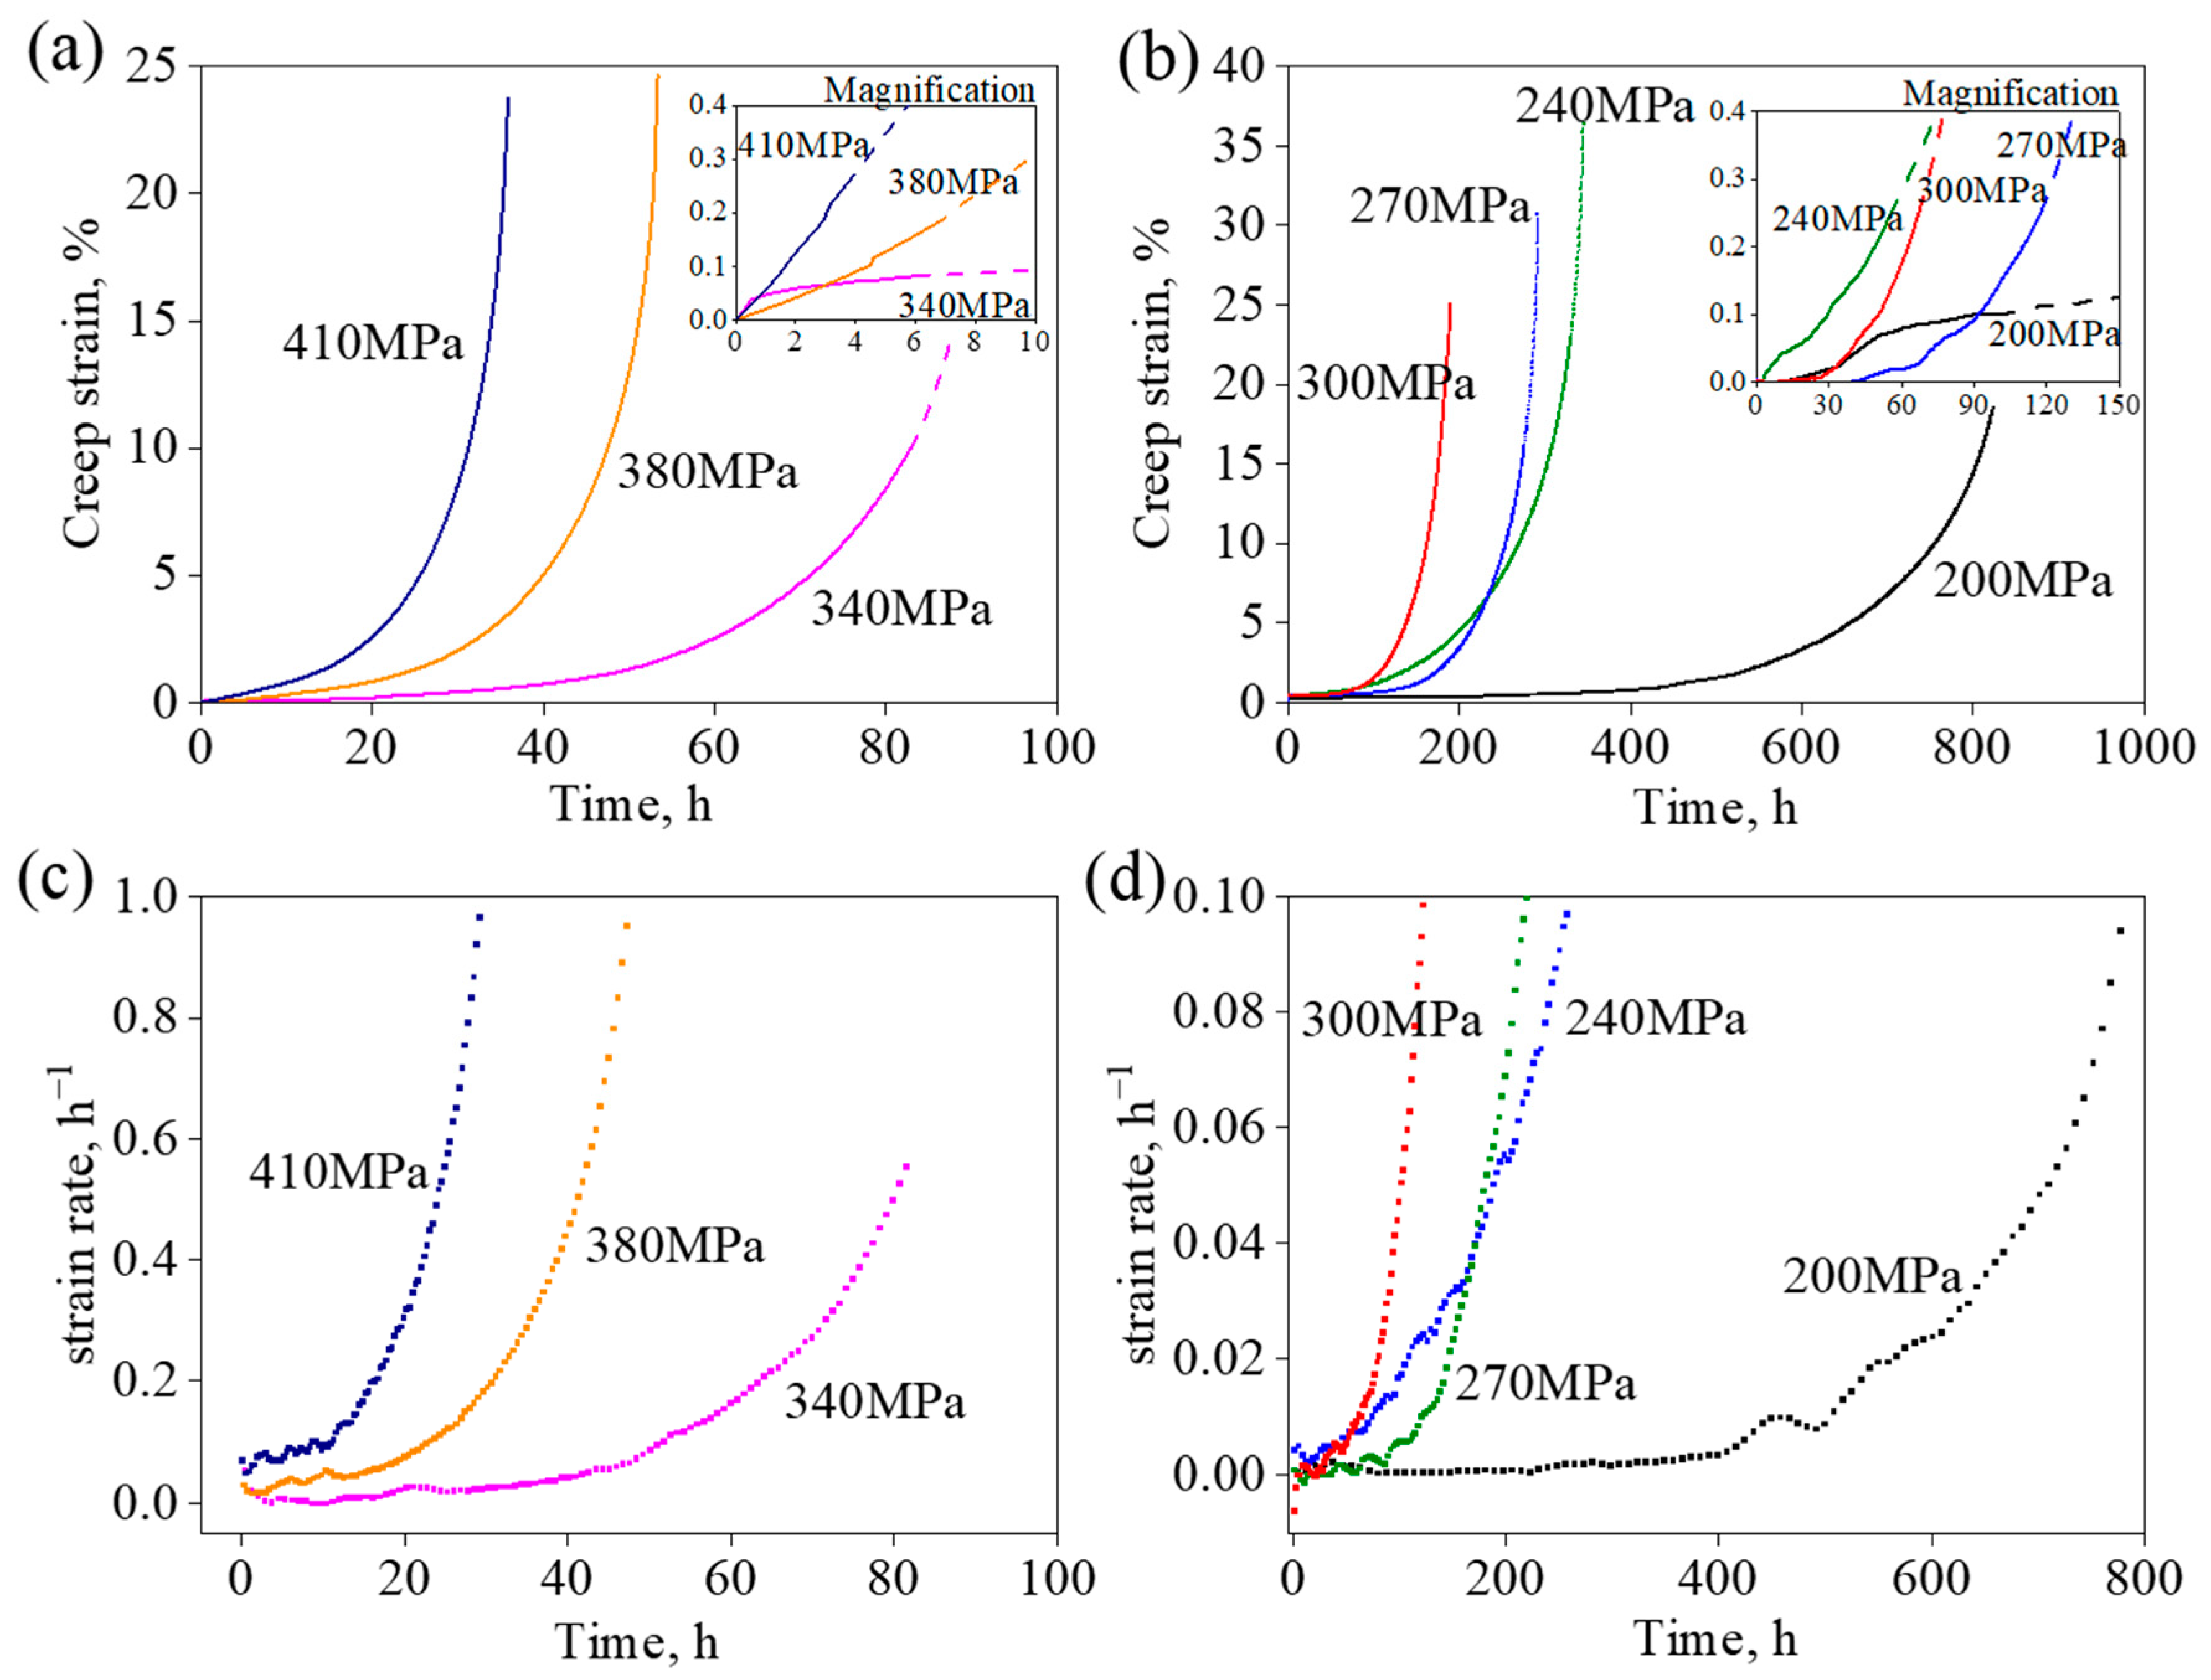
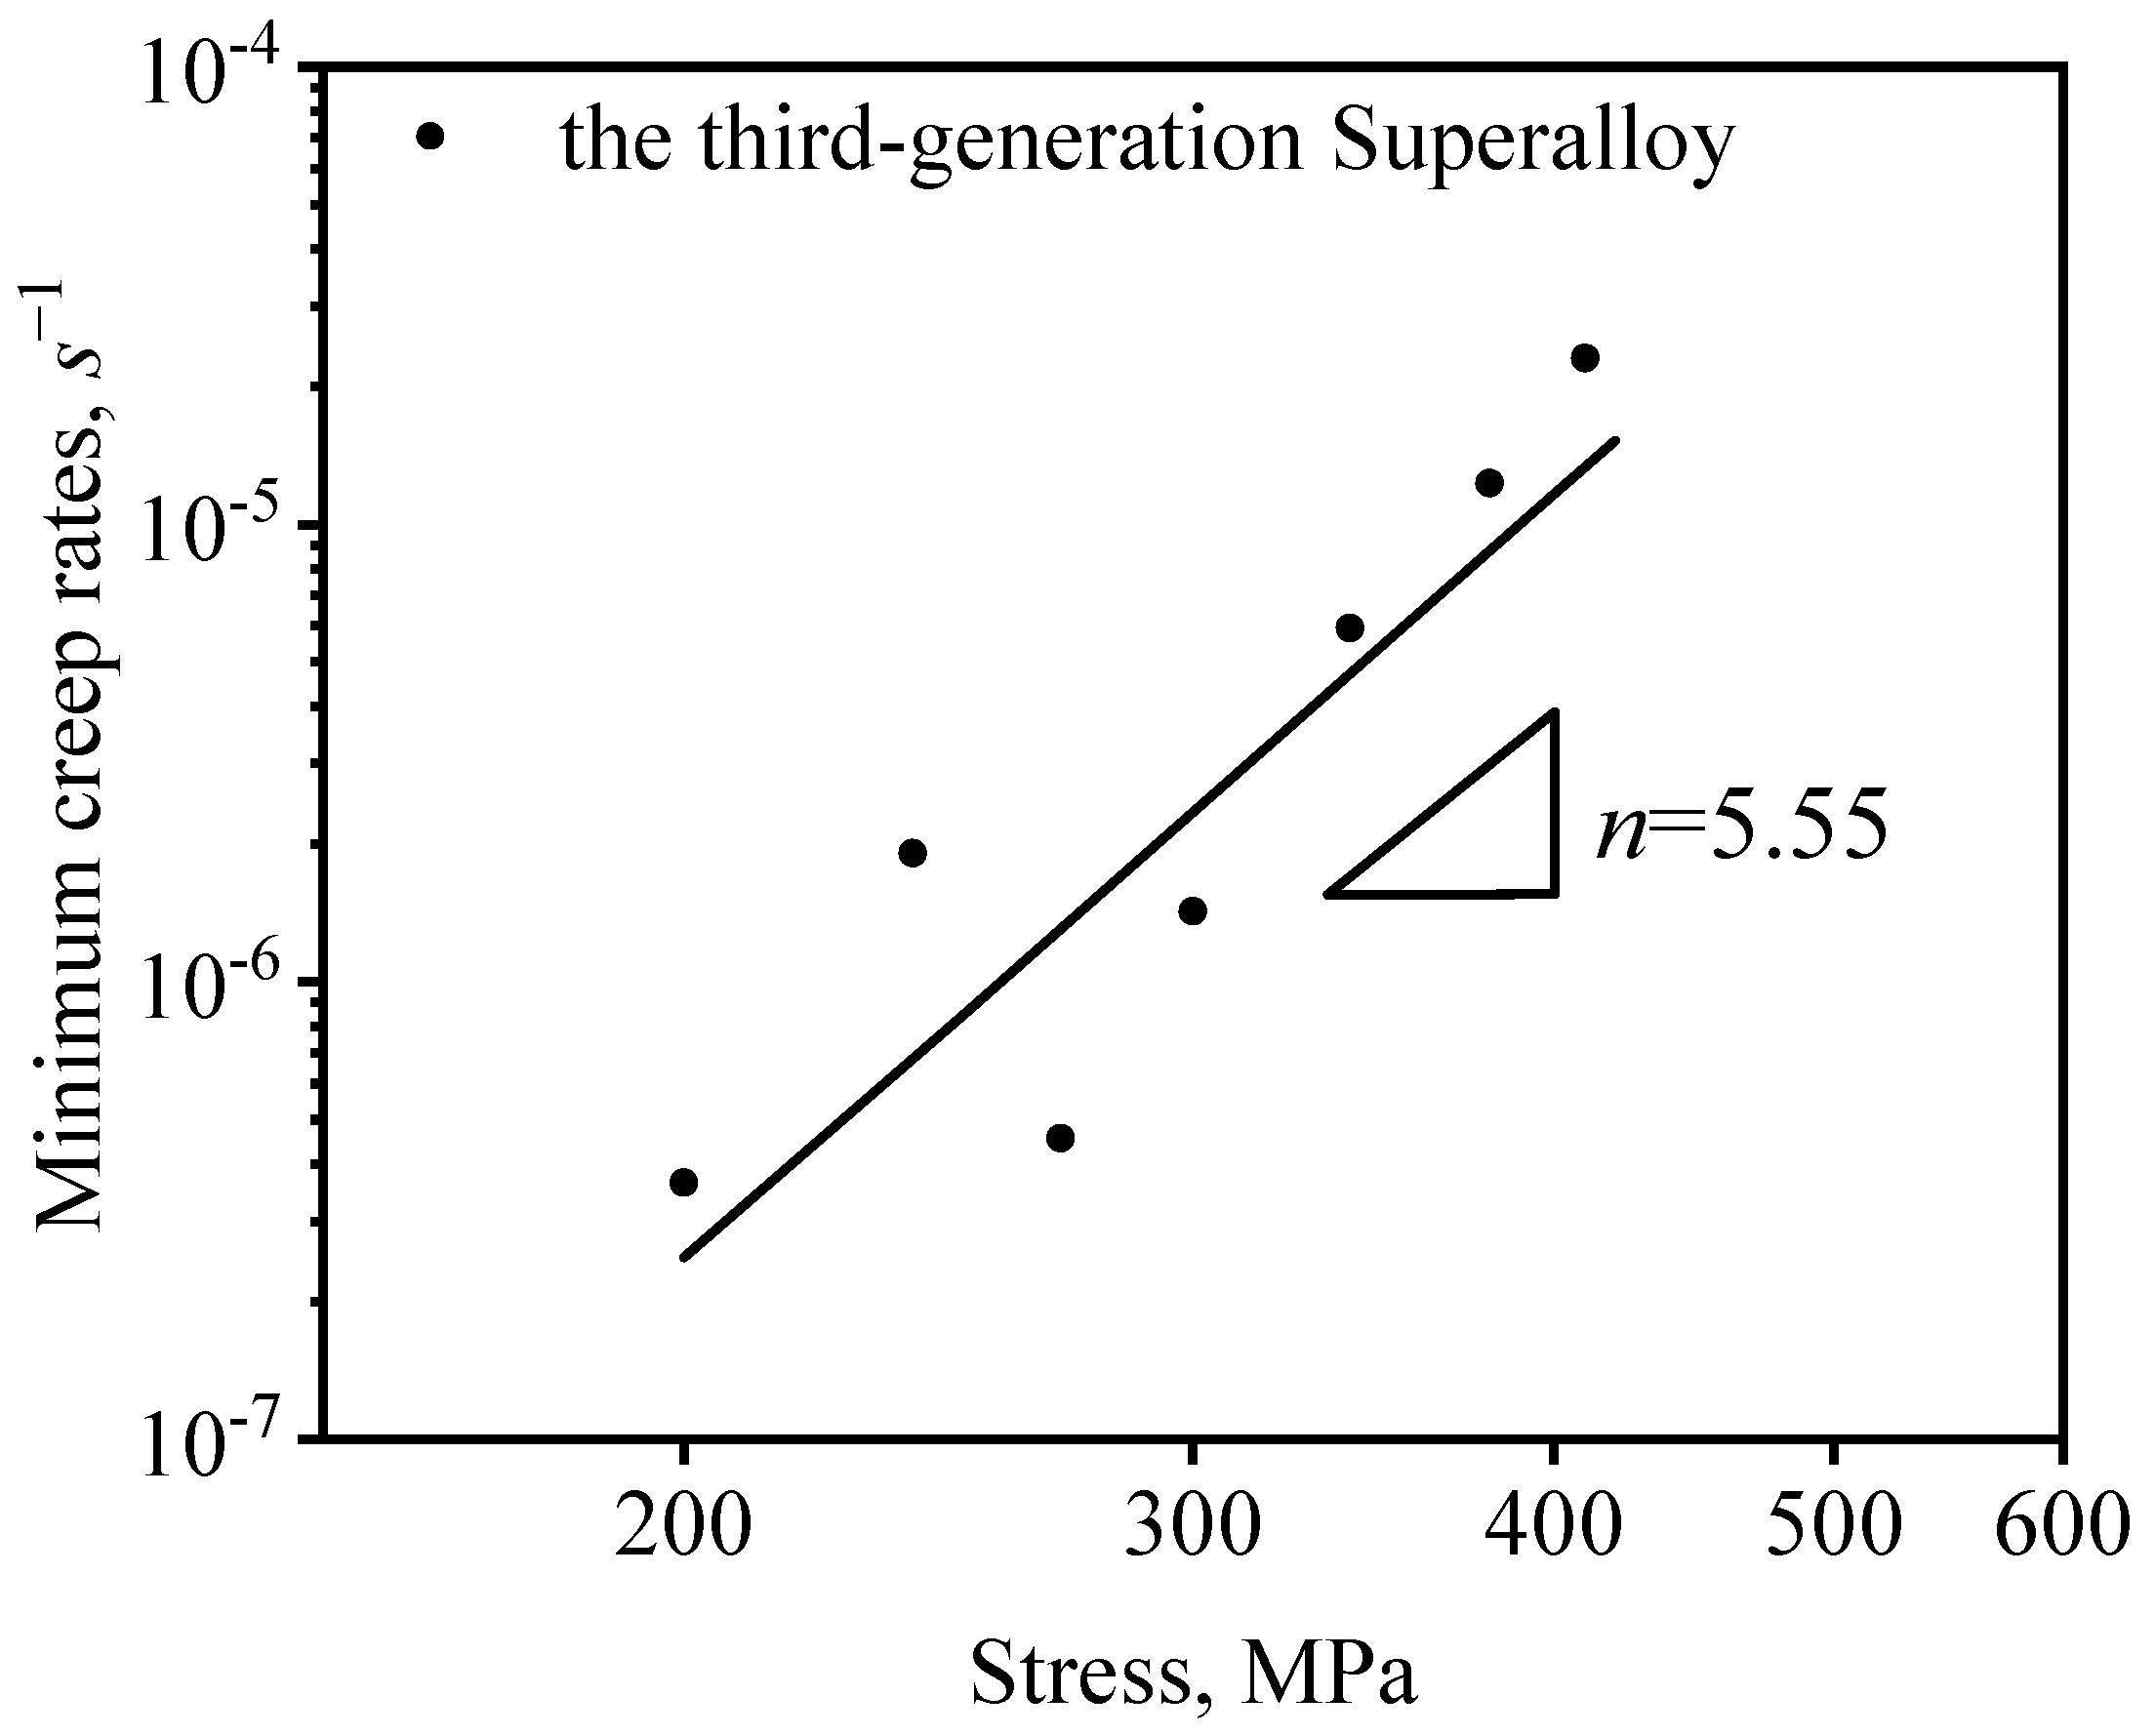
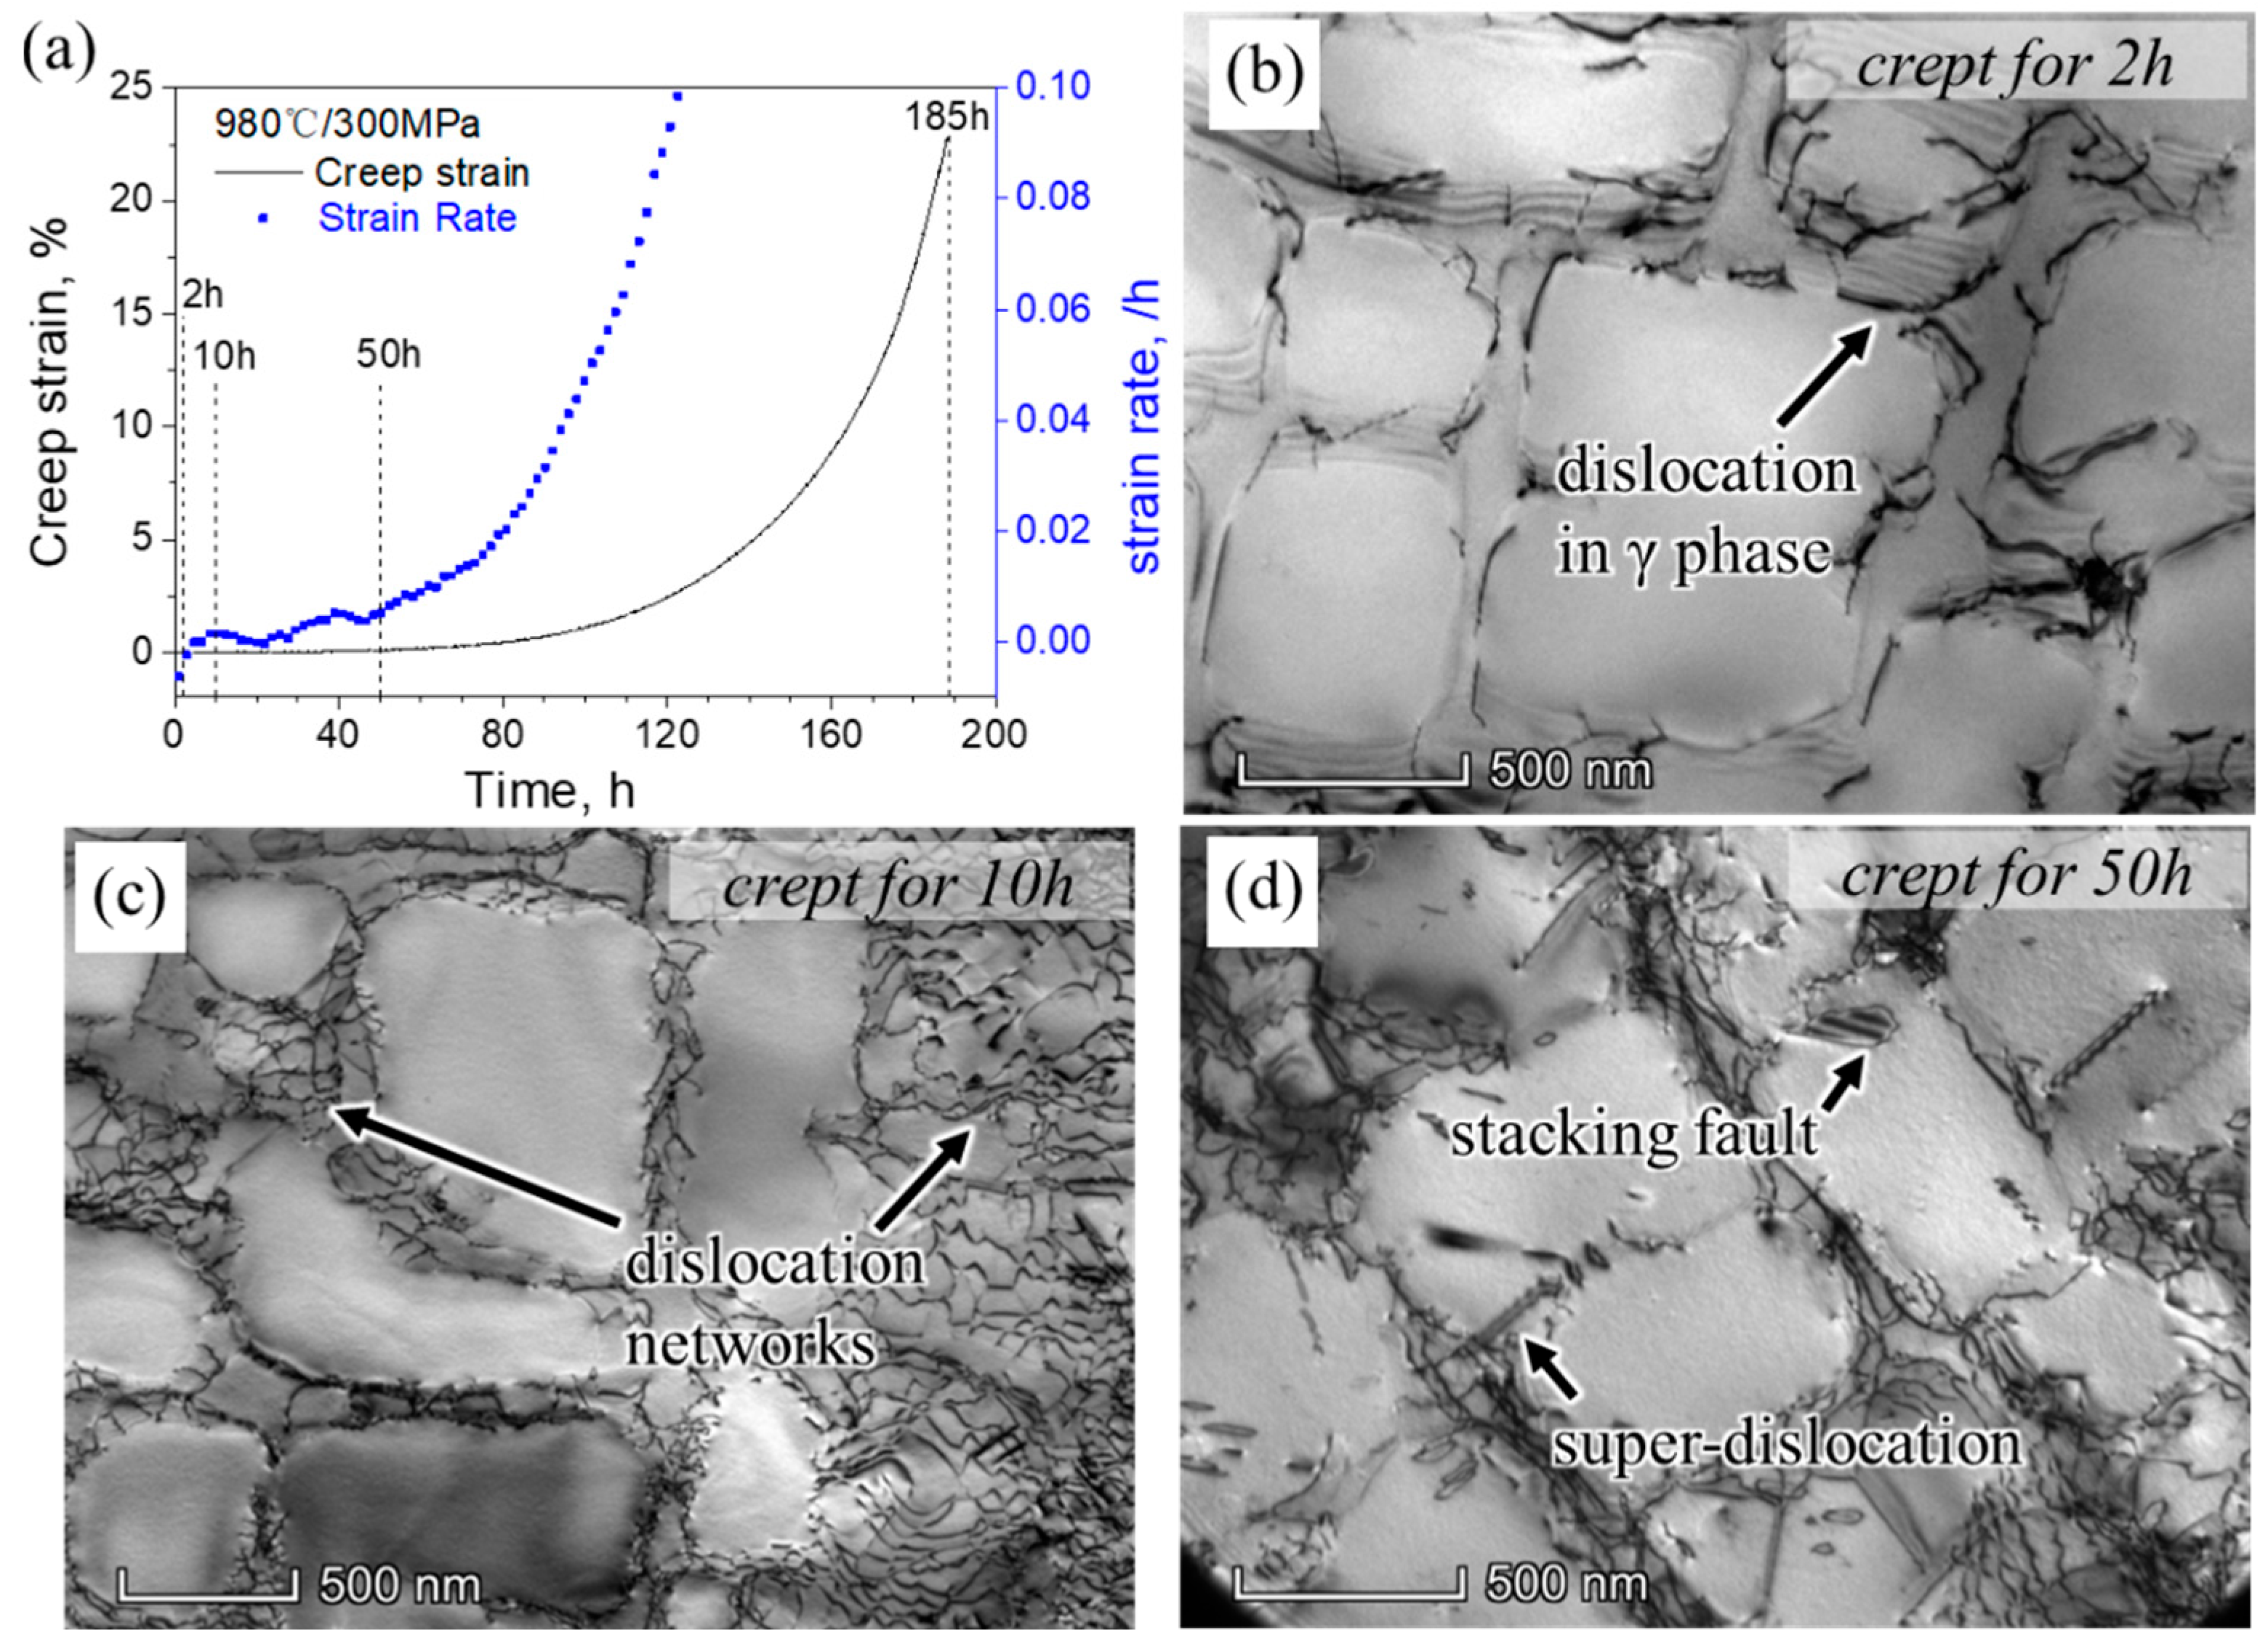
3.1. Creep Behavior and Analysis

Figure 2 presents the creep curves and strain-rate vs. time profiles pertinent to the alloy. The features of creep behaviors were indicated from the creep curves of the alloy in Figure 2a,b: the initial creep stage was almost absent. Only as the applied stresses reached 340 MPa and 200 MPa was the initial creep stage observed with short durations. Following this primary stage, the creep transitions into the secondary stage. Within the confines of the steady-creep stage, the creep strain rates exhibit relative constancy, punctuated by low-level fluctuations. A particularly prolonged instance of this steady-creep stage is witnessed at 200 MPa, wherein the duration extends to approximately 400 h. After the steady-creep stage, the alloy’s strain rates undergo a rapid increase, culminating in final fracture, as is graphically represented in Figure 2c,d.
The observed creep curves reveal a slight decrease in creep strain rates at the onset of creep. This phenomenon can be attributed to the influence of work hardening introduced from deformation. The activation of dislocations and the ensuing increase in dislocation density accompany the deformation process [22]. Once the dislocation density attains a specific threshold, signifying the emergence of dislocation networks, the mobility of partial dislocations becomes impeded. As a result, the creep strain stabilizes, as illustrated in Figure 2c,d. During the ongoing creep, the dislocation networks eventually undergo disruption. In the tertiary creep stage, the formation of creep cavities becomes evident, as is documented in the previous literature [23]. These cavities possess an inclination to interconnect, leading to the initiation of microcrack nucleation. Microcracks, engendered by localized stress concentration, then proceed to propagate along the planes perpendicular to the applied stresses. This phenomenon is further influenced by the heightened strain rates resulting from diminished force-bearing areas and increasing actual stress. When the cracks at different planes kept developing and then connected with others, the alloy rapidly lost its stability, leading to the rupture of the creep [23,24].
Table 3 presents the recorded creep lifetimes and corresponding minimum strain rates of the alloy at an elevated temperature of 980 °C, as gleaned from Figure 2. A discernible trend emerges from Table 3, where the creep lifetimes of the alloy exhibit a diminishing trend with the increase in applied stresses varying from 200 MPa to 410 MPa. Correspondingly, the minimum strain rates registered during the course of creep manifesting an upward trend, increasing from 0.036 × 10 7 s 1 to 2.306 × 10 7 s 1 .
The relationship between minimum creep strain rates and applied stresses during the steady-creep stage at 980 °C aligns with the Dorn’s law [25], which is expressed by the following equation:
ε ˙ = A σ A n exp Q a R T
where ε ˙ is the minimum creep strain rate, A is a material constant, σ A is the applied stress, and n is the apparent stress exponent. A depiction of the interdependence between the minimum creep strain rates and applied stresses is depicted in Figure 3. Evidently, the alloy’s creep behavior at 980 °C is amply captured by Dorn’s rate equation, with the derived stress exponent (n) during the steady-creep stage in the range of applied stress, quantified at 5.55. This empirical finding indicates the deformation mechanism during the steady-creep stage, which is attributed to the dislocation climbing over the γ′ phases.

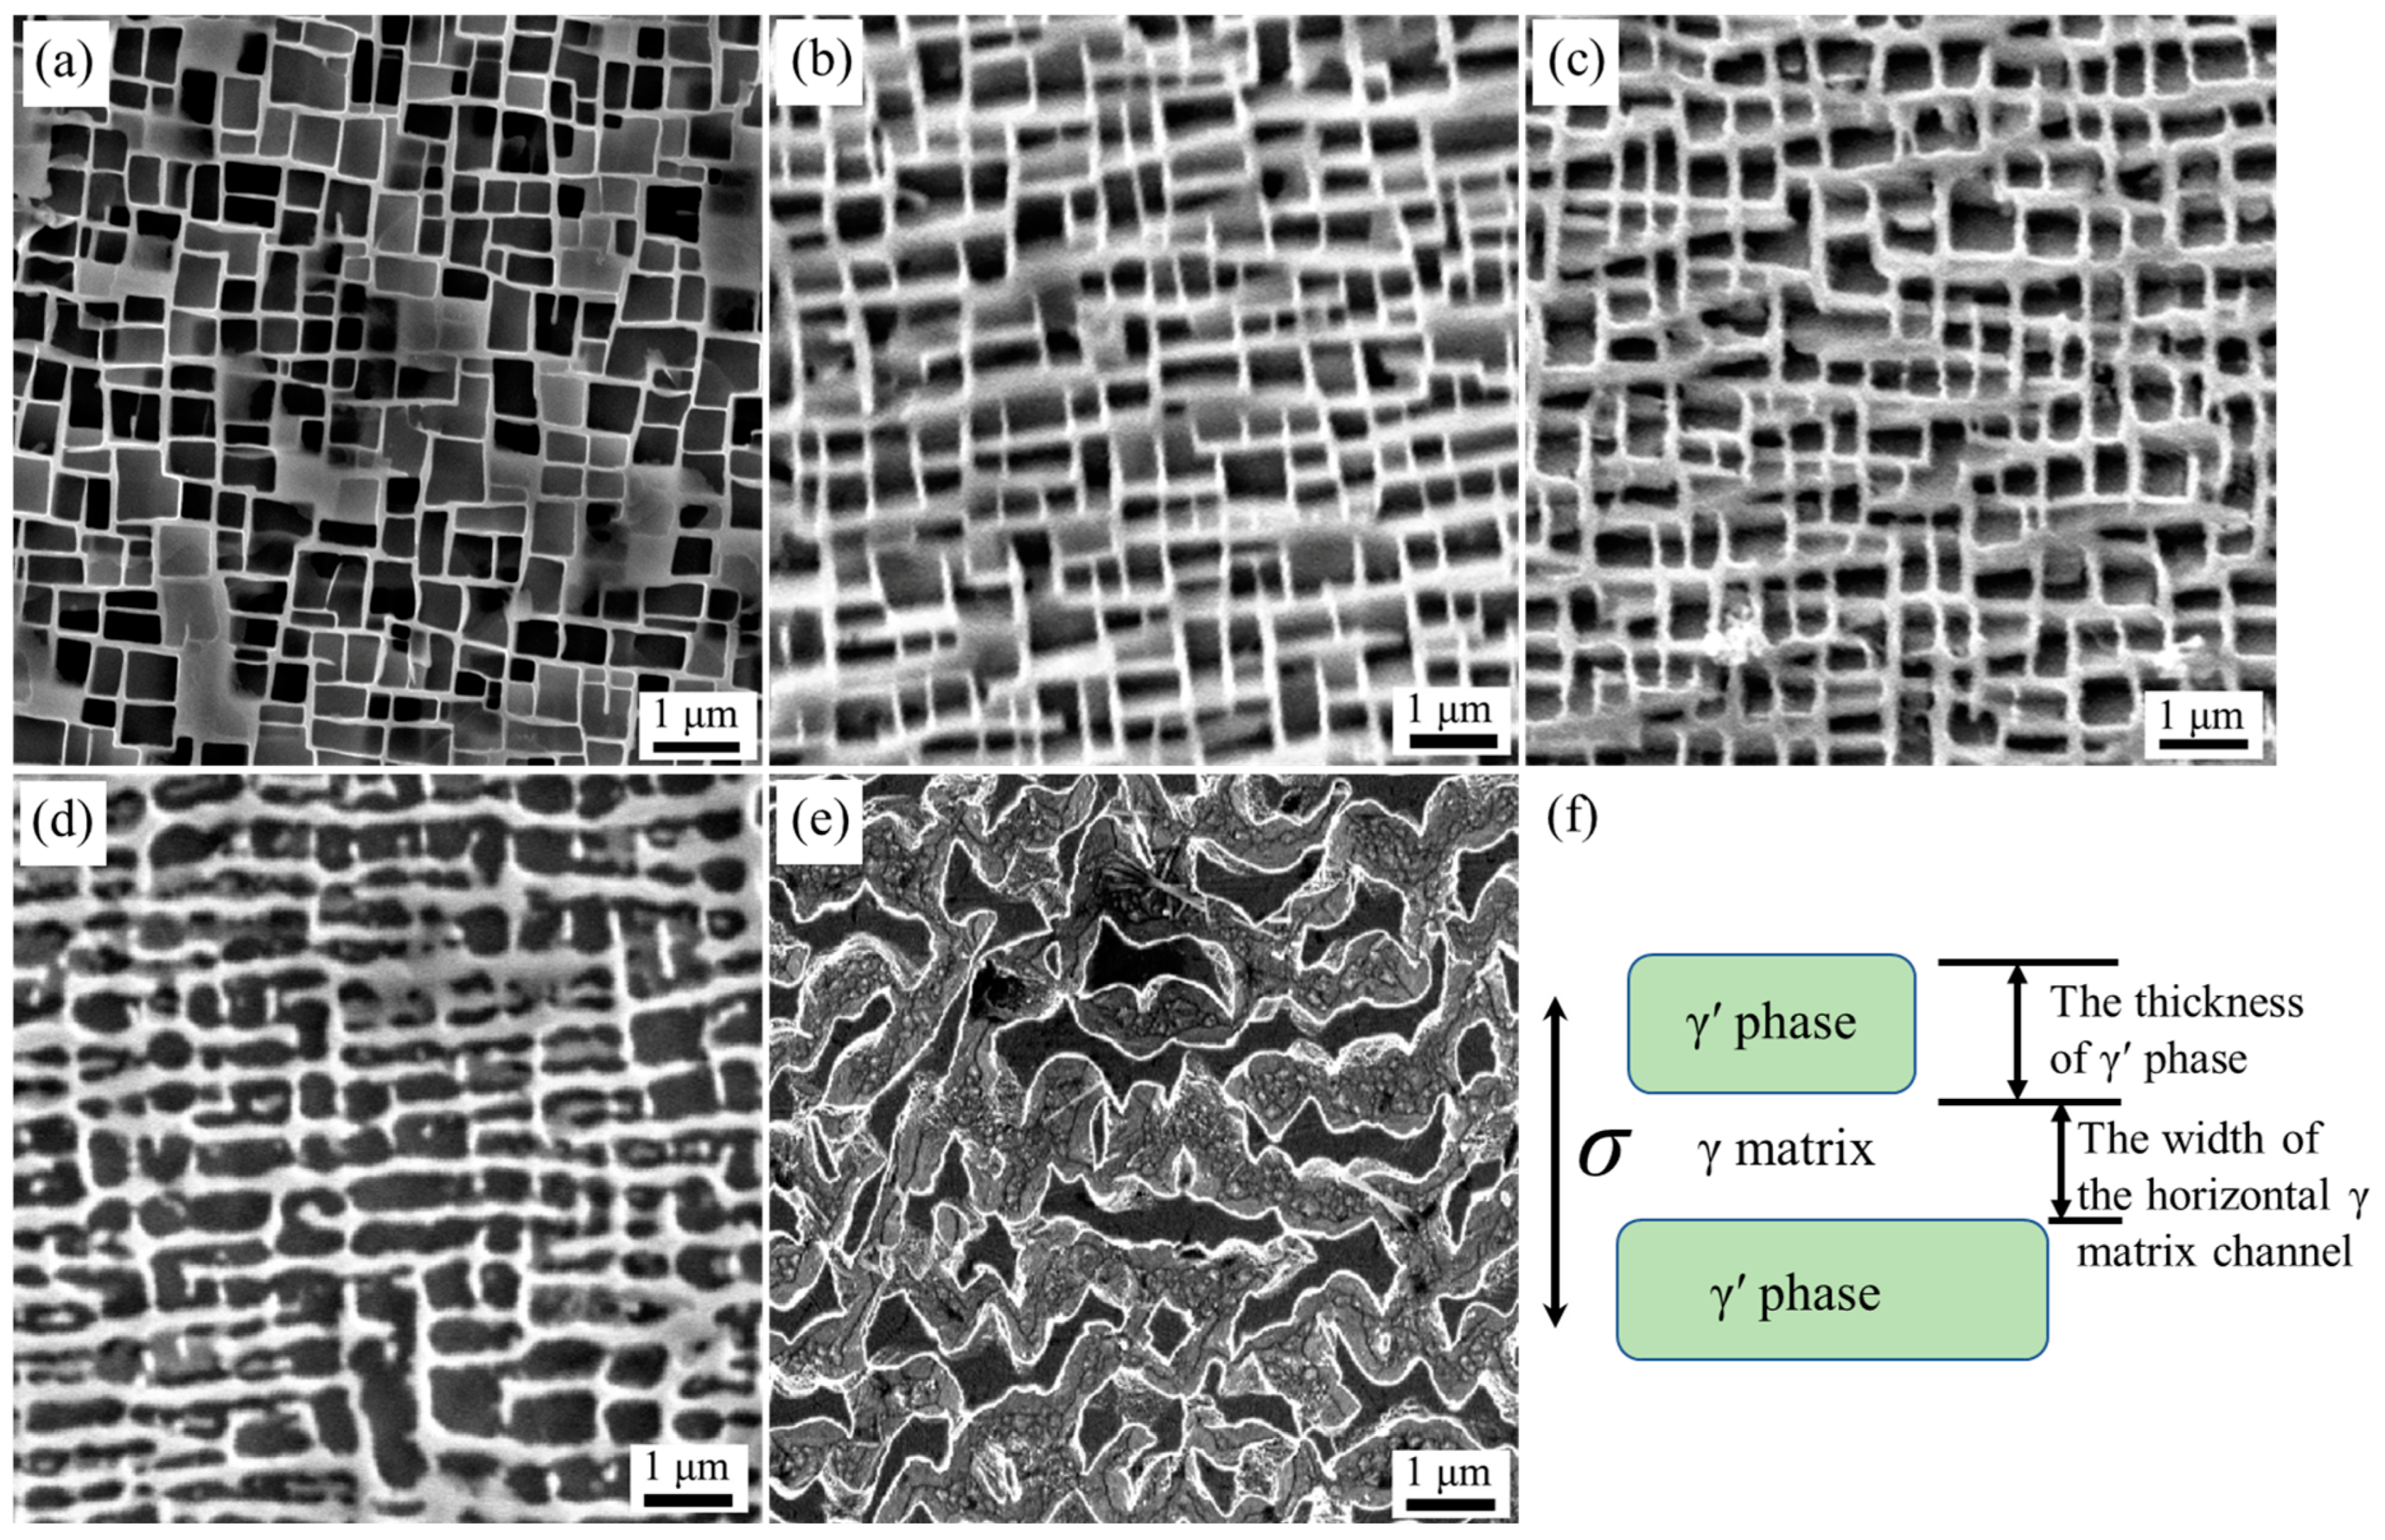
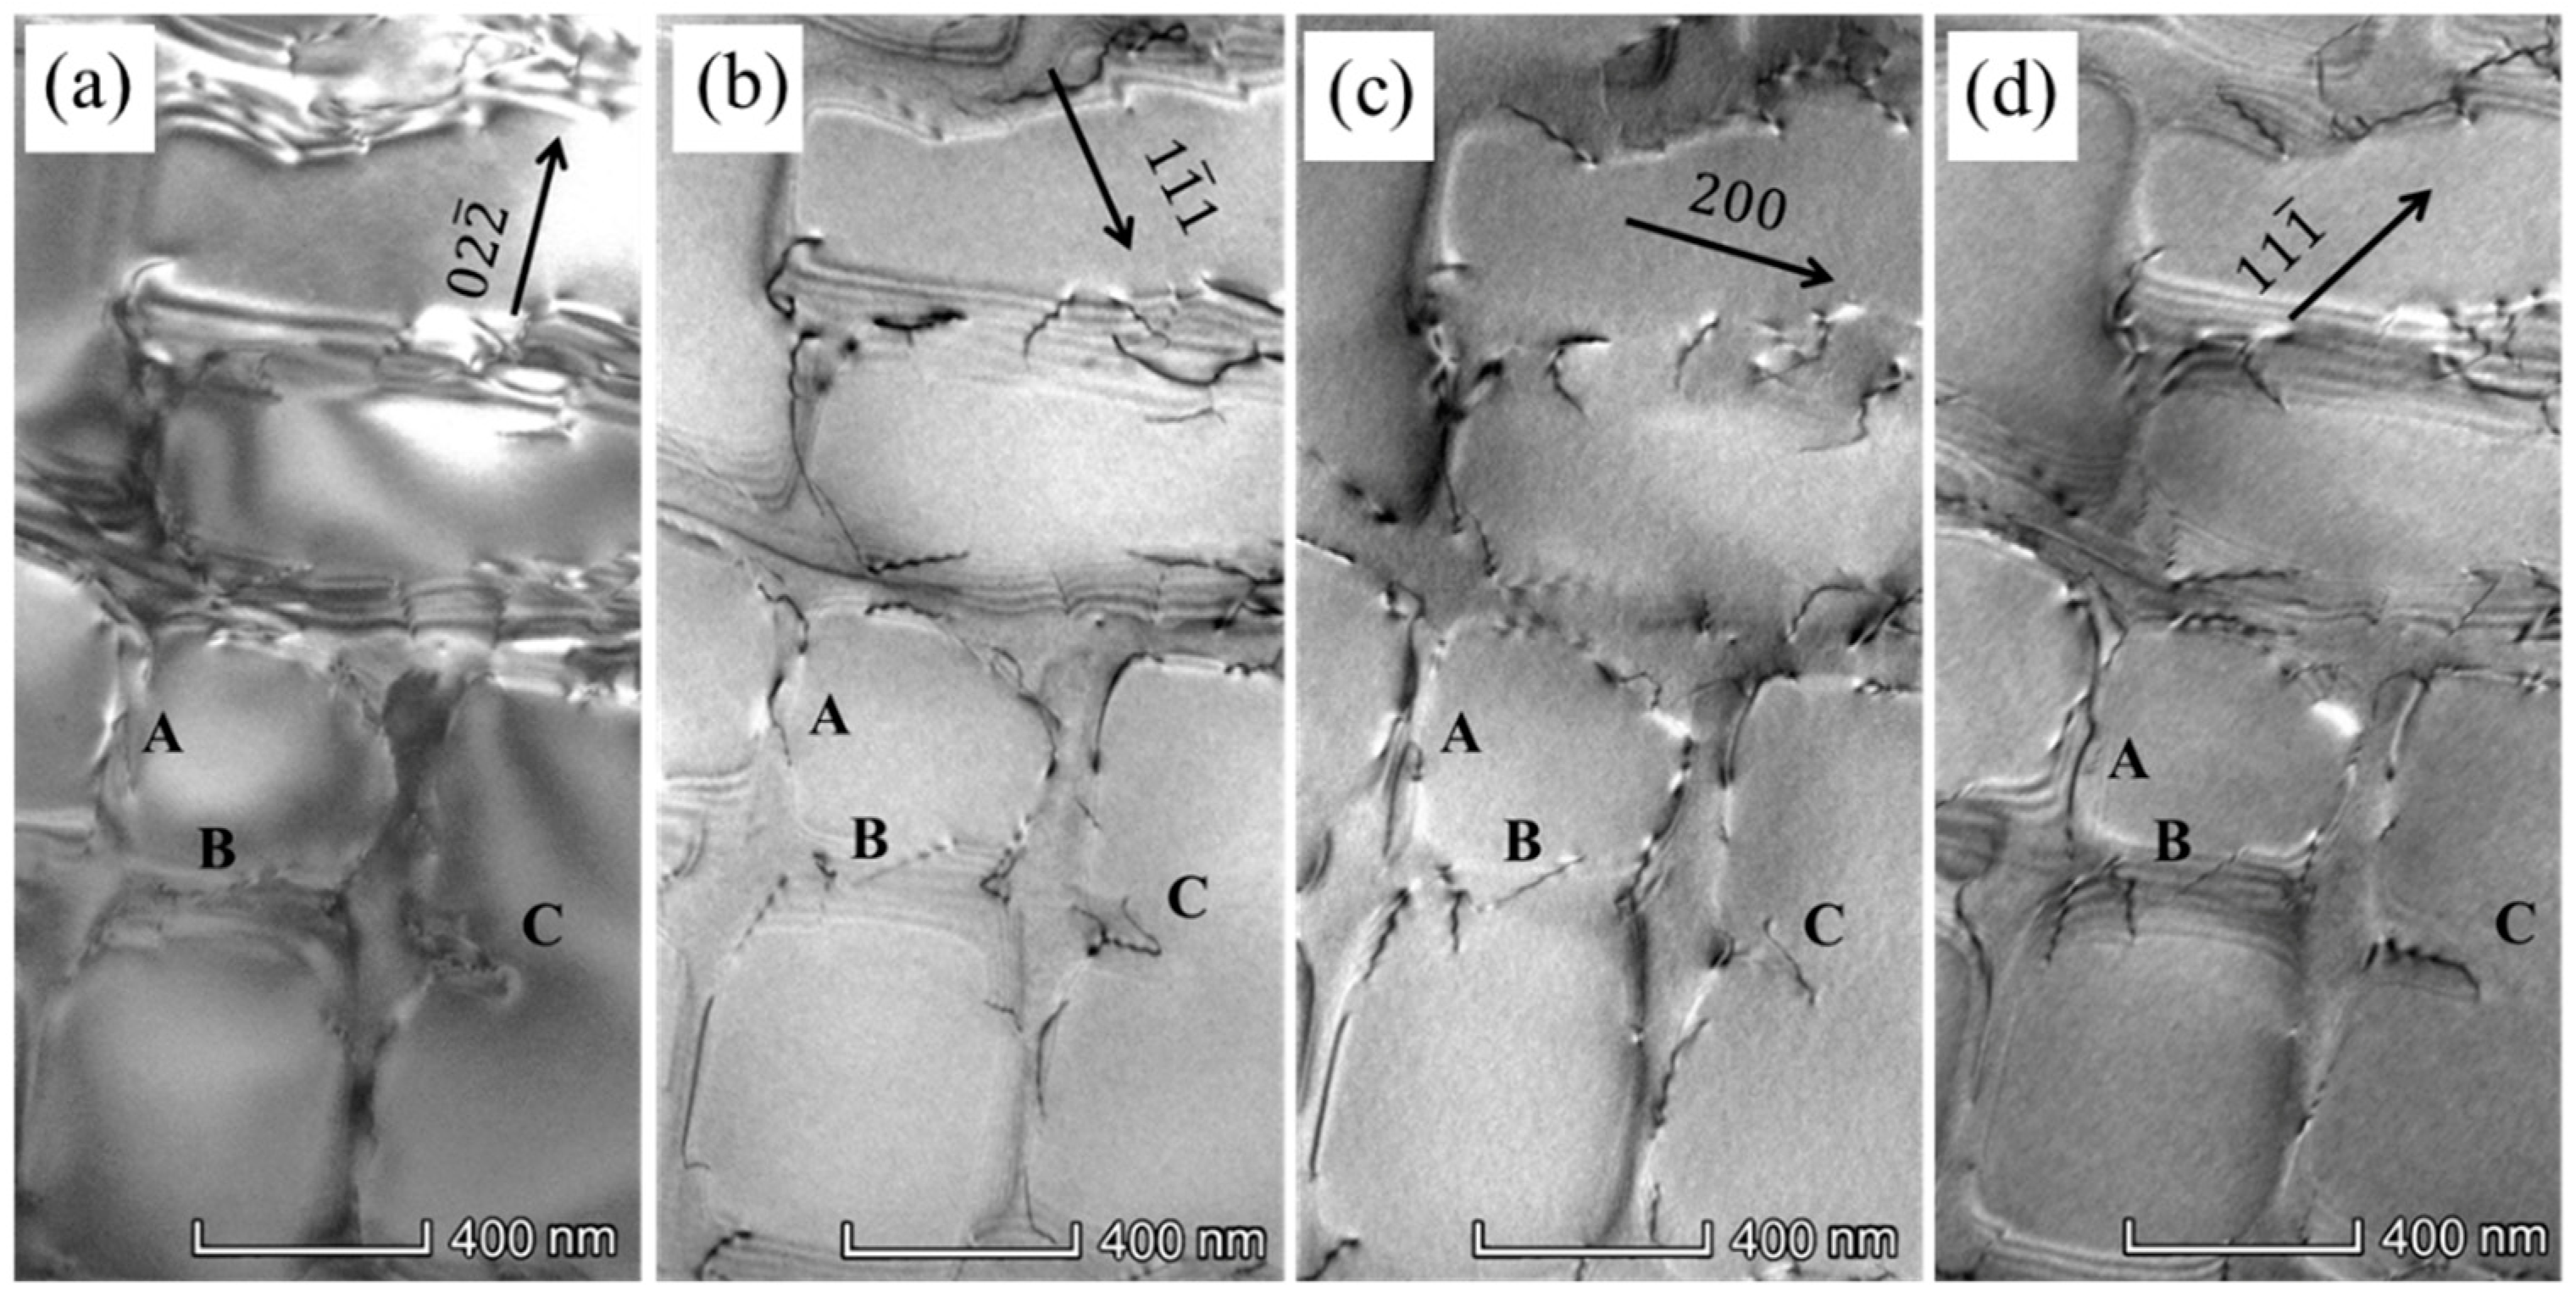
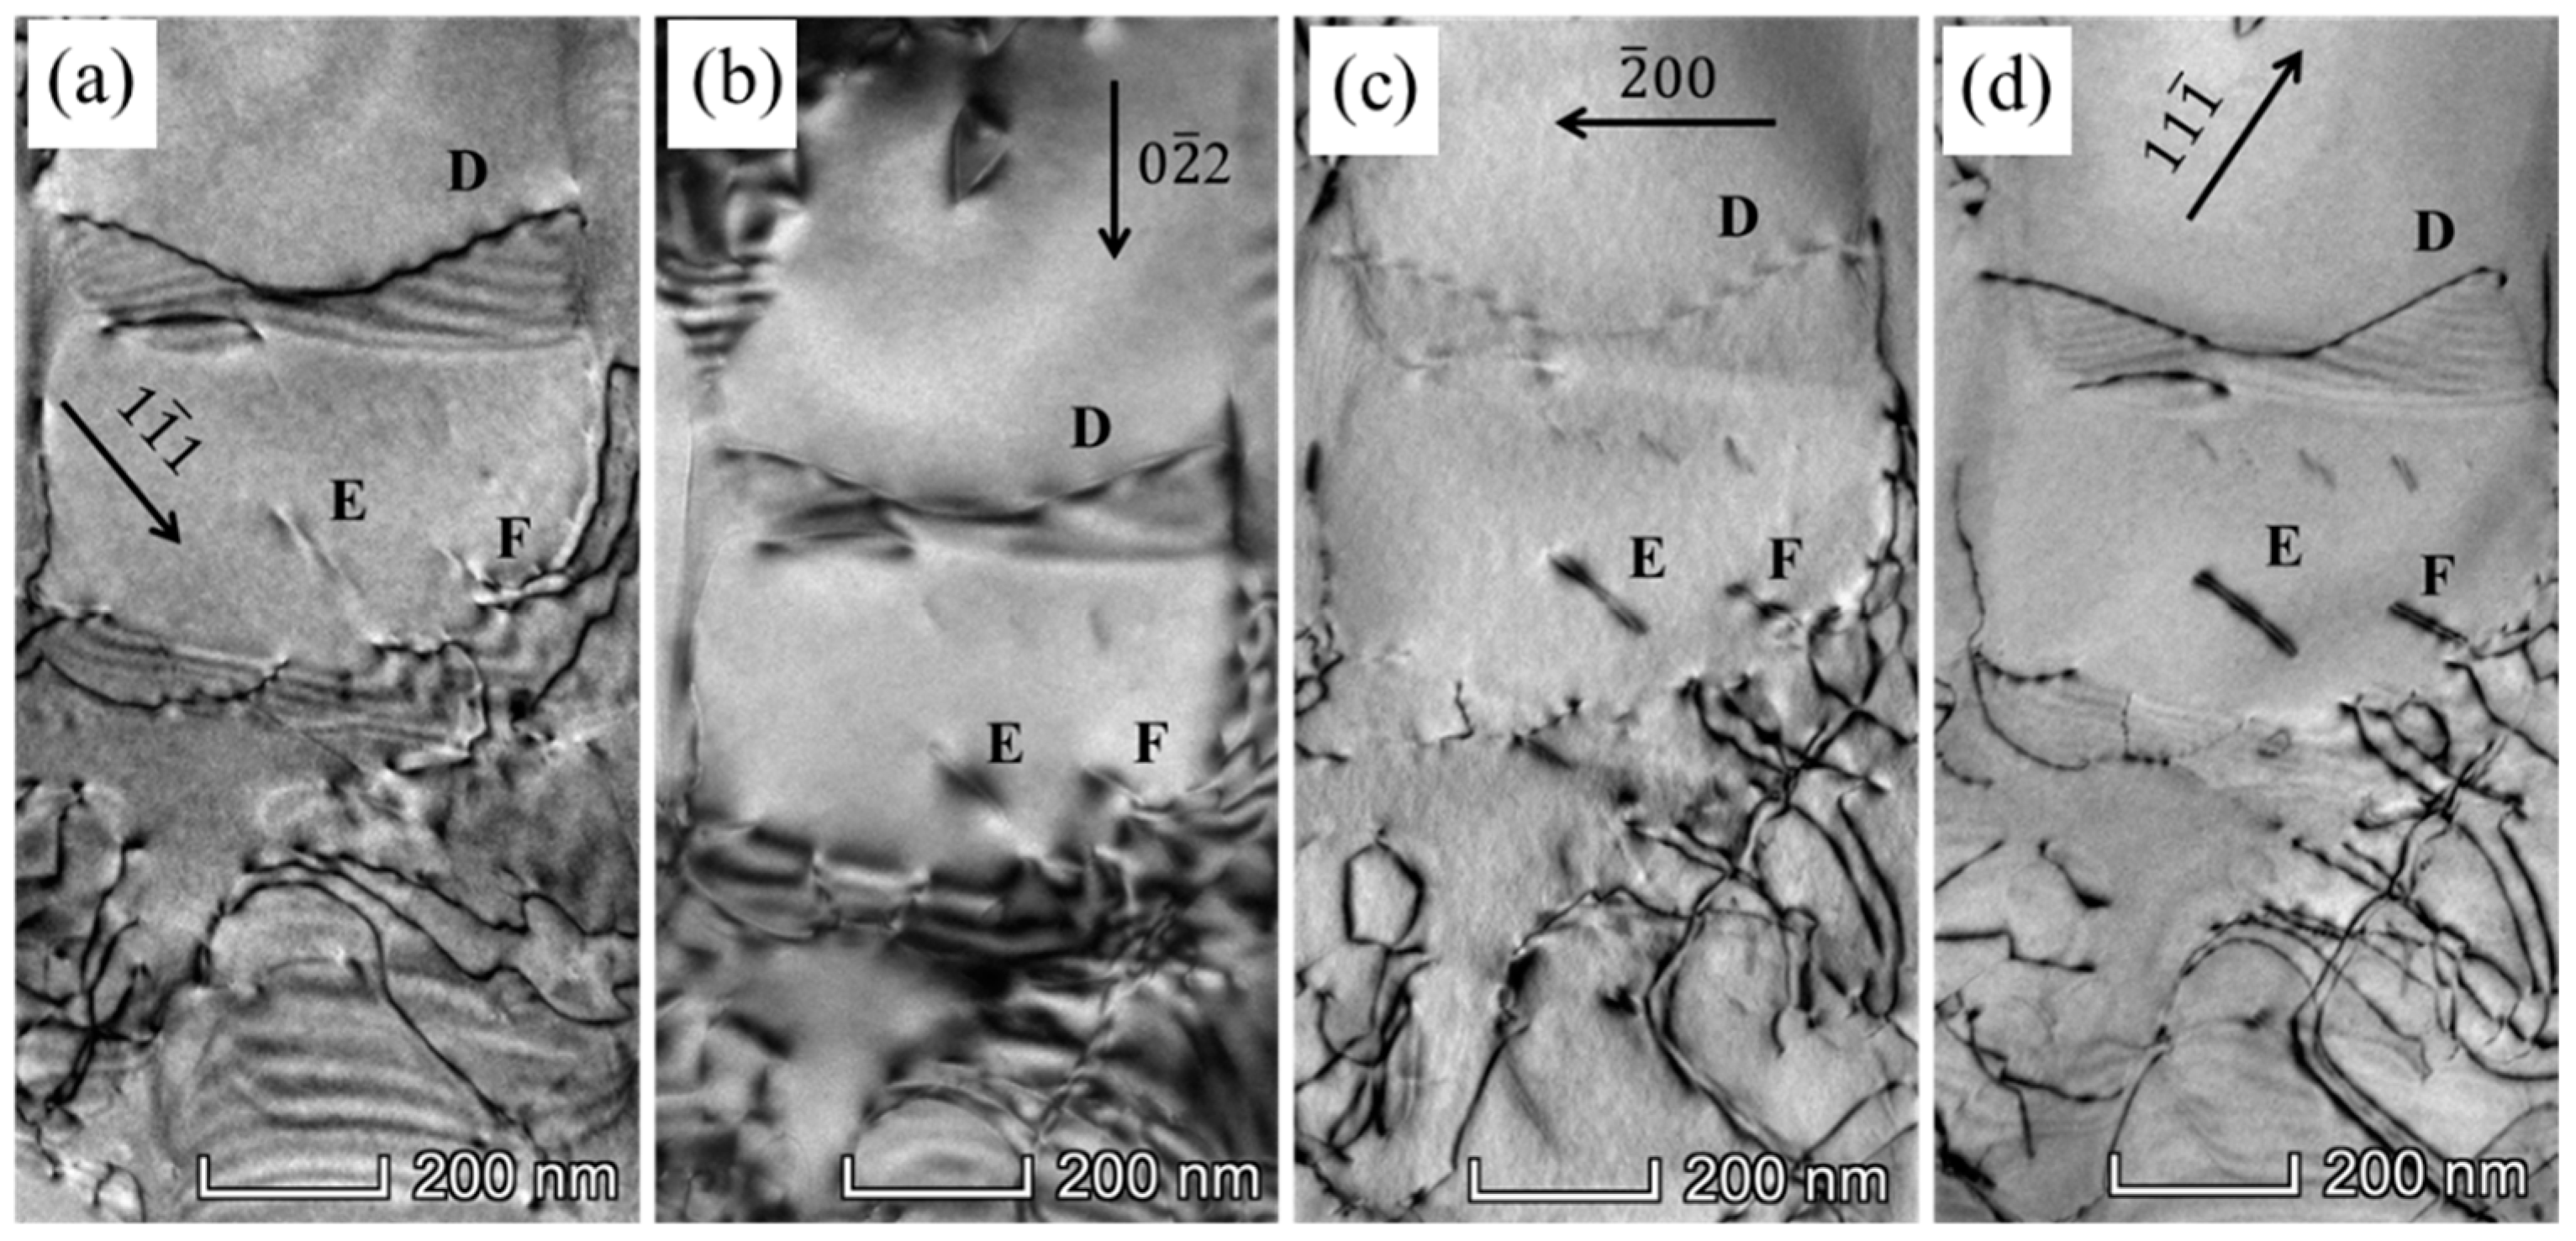
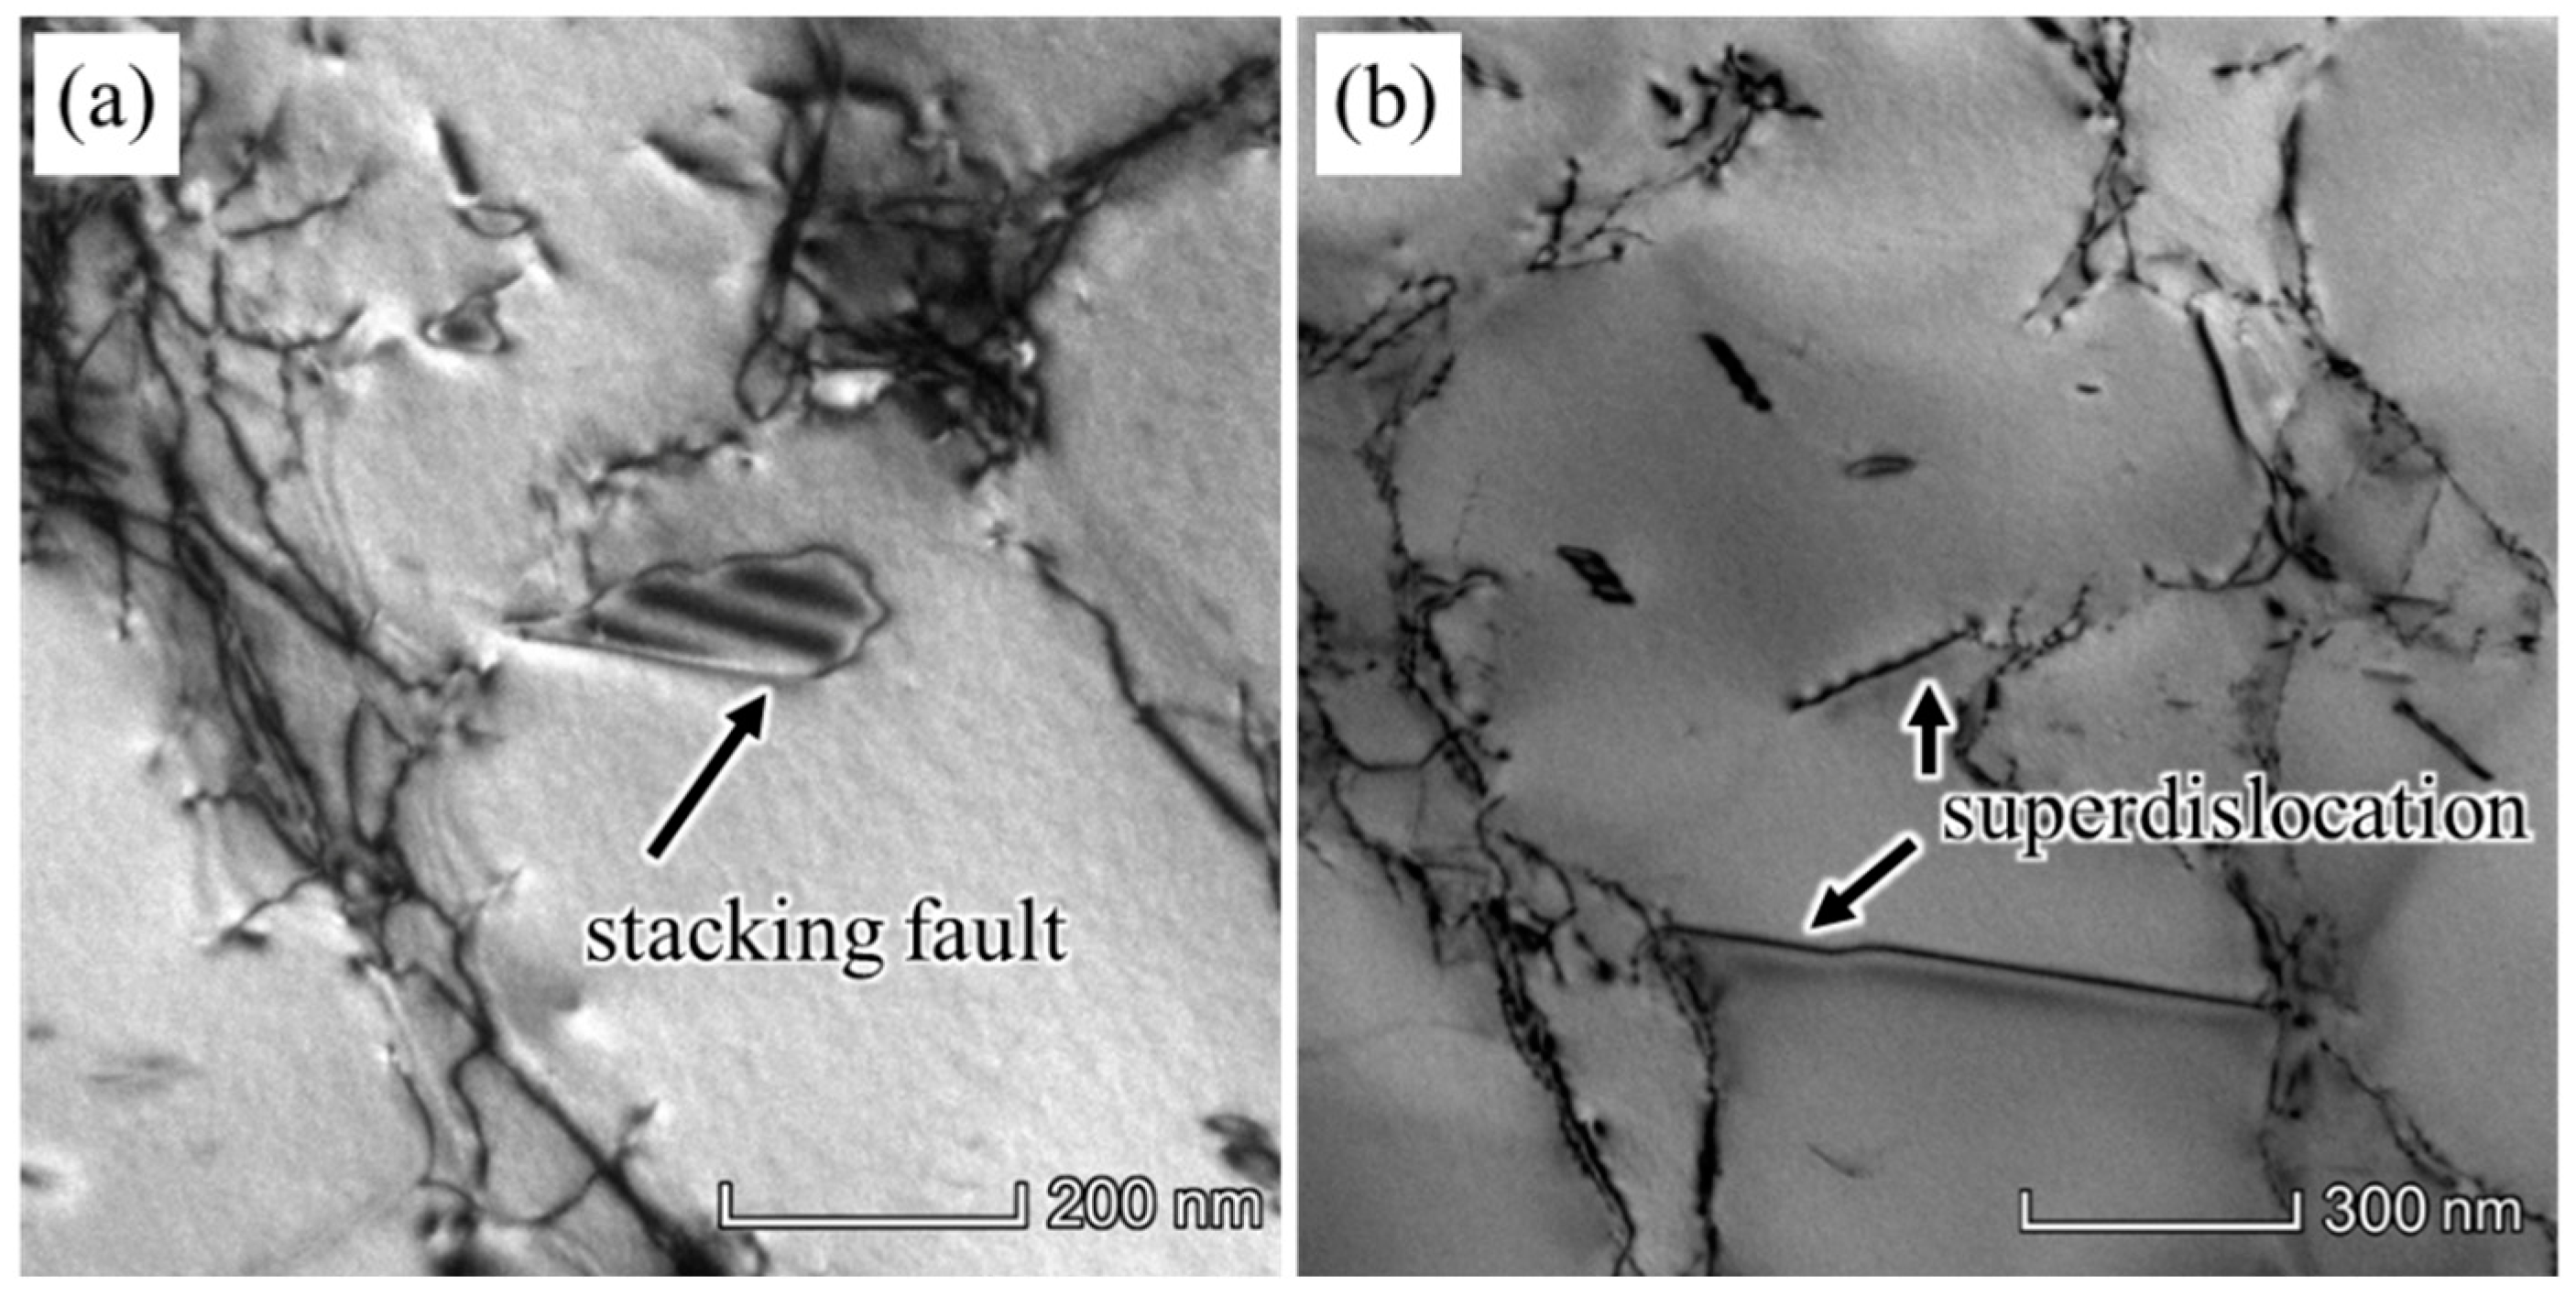
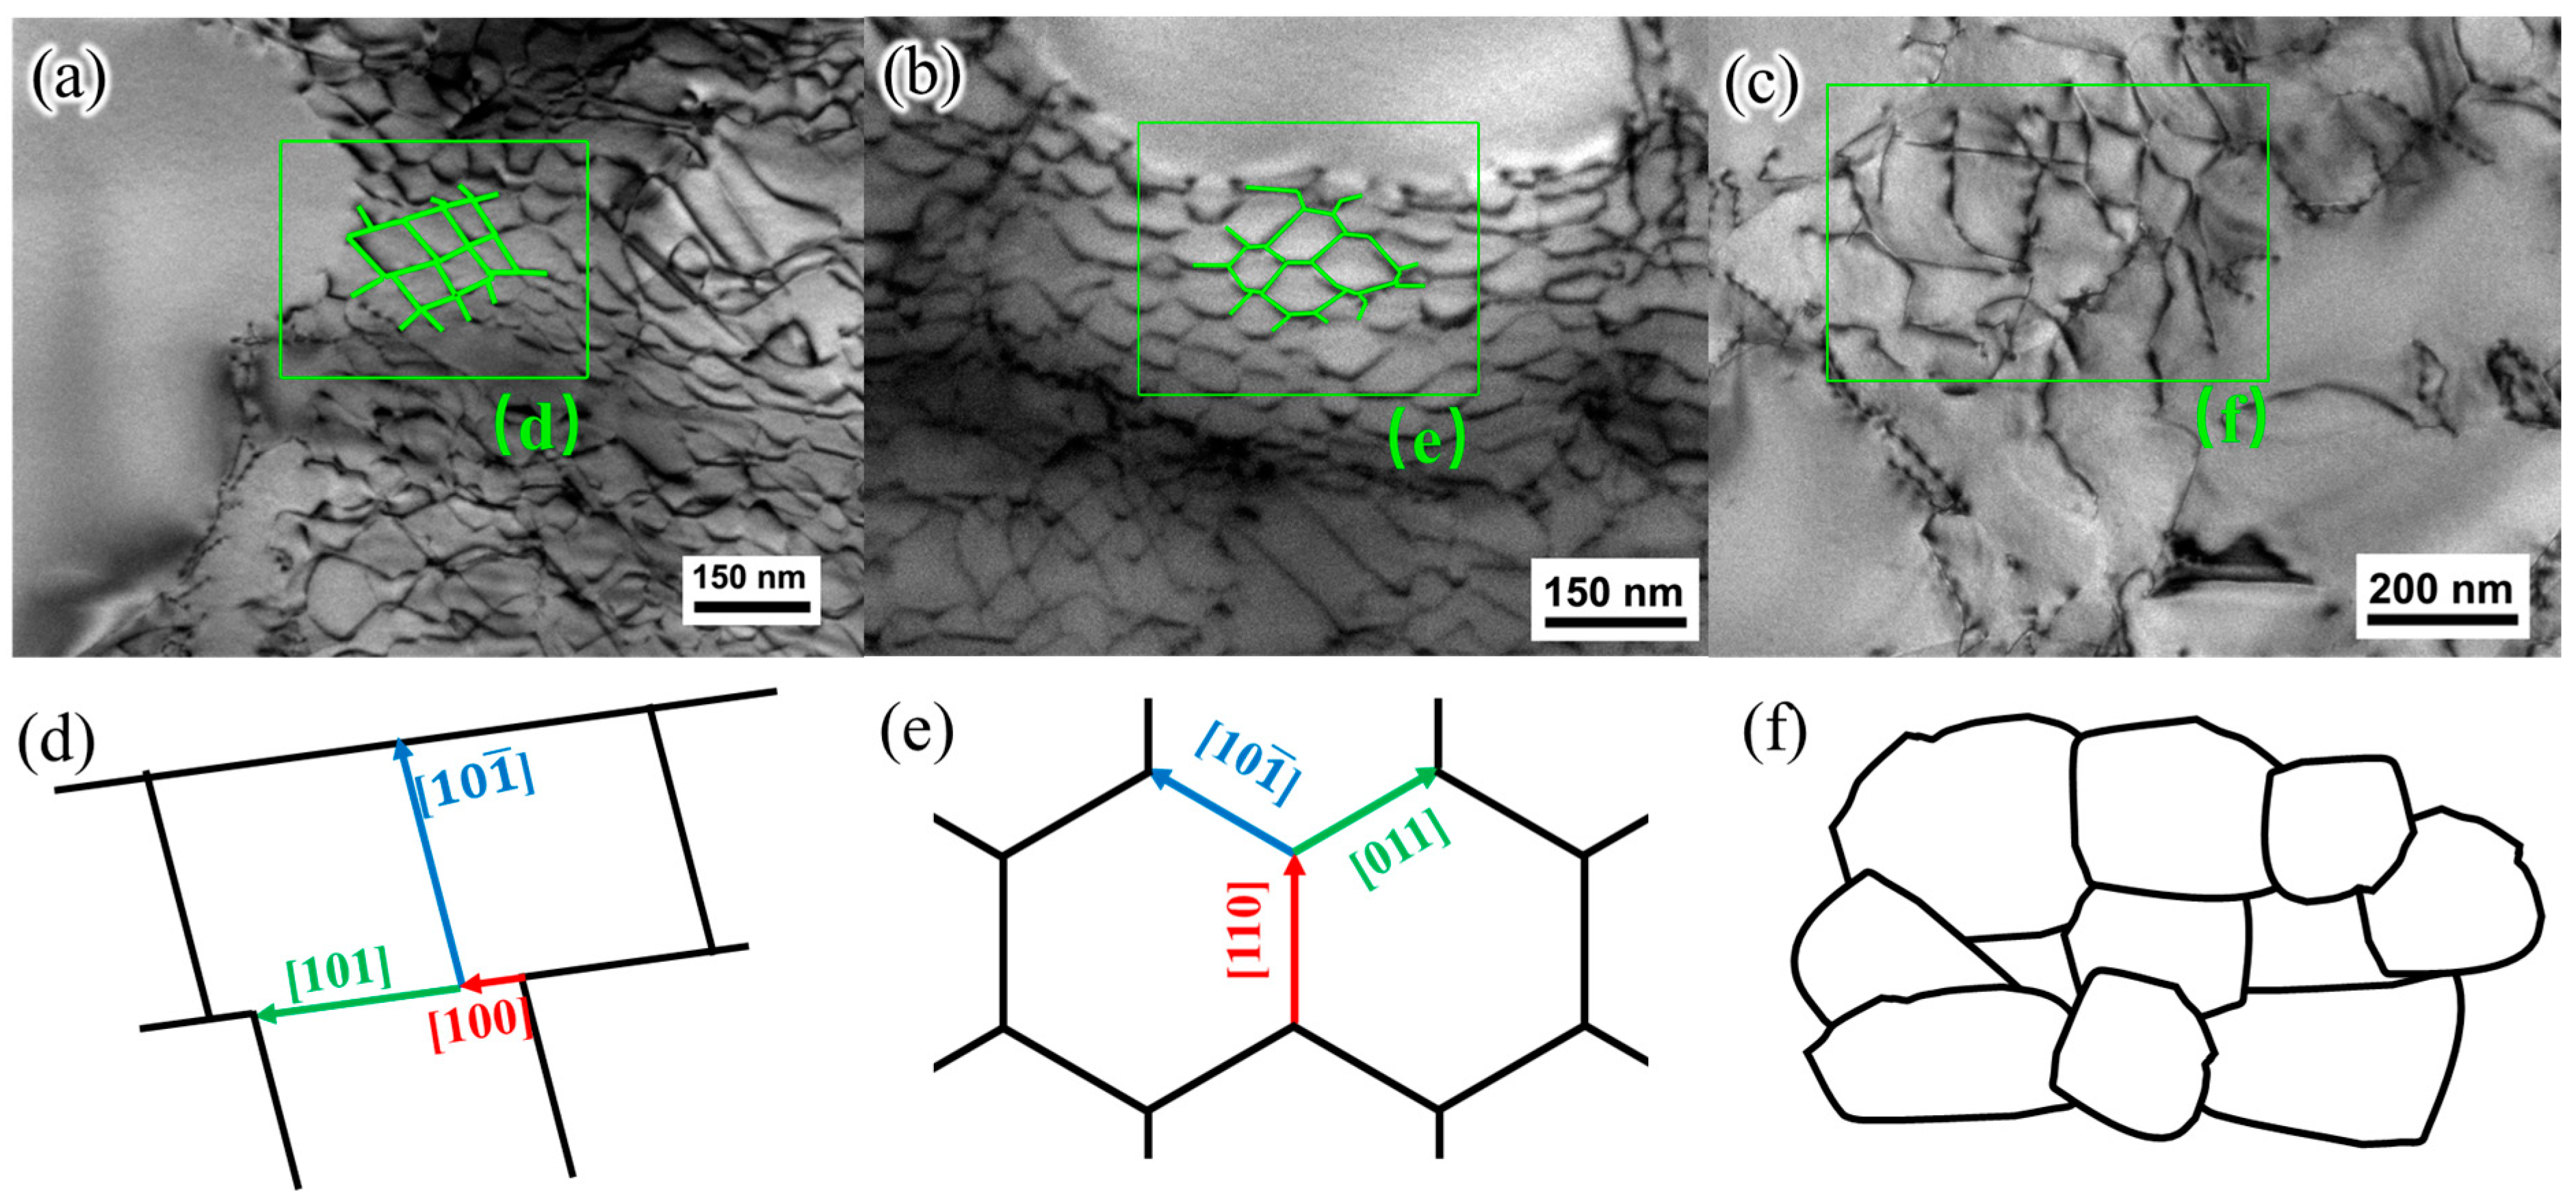
3.2. Microstructure and Dislocation Configuration

After full heat treatment, the cubic γ′ phases were uniformly incorporated into the γ matrix through coherent precipitation, as illustrated in Figure 4a. The average dimensions of the γ′ precipitates measured 410 nm, with the volumetric ratio of the γ′ phase reaching 68%. Upon undergoing different durations of creep at 980 °C/300 MPa, as depicted in Figure 4b–f, the γ′ precipitates exhibited a progressive rafting phenomenon oriented perpendicular to the applied stress. The vertical γ matrix channel displayed a reduction in prominence, ultimately leading to their disappearance, while the horizontal channel experienced expansion. After creeping for 2 h, both the γ and γ′ regions underwent coarsening. The mean dimensions of the γ′ precipitates reached 424 nm, and the mean width of the horizontal γ matrix channel expanded from 65 nm to 81 nm. After creeping for 10 h, negligible observable changes transpired in the average dimensions of both the γ and γ′ regions. However, after creeping for 50 h, a discernible increase in the mean width of the horizontal γ matrix was evident, with some γ′ precipitates jointing together and forming a raft-like structure. Upon reaching the rupture of creep, the γ′ precipitates exhibited rafting, as demonstrated in Figure 4e. The average width of the horizontal γ matrix channel expanded to 325 nm, while the average thickness of the γ′ region increased to 870 nm. The volumetric ratio of the γ′ phase remained at 64%. A topological inversion phenomenon occurs, wherein the continuous γ channels isolating γ′ phase developed into continuous γ′ rafts with the isolated γ phase. This phenomenon of rafting contributed to the reduction in thickness of the γ′ precipitates, attributed to atom diffusion effects [26]. In Figure 4f, the measure method of the dimension of γ/γ′ is described.
It is noted that there is a color change of γ/γ′ phases in Figure 4a–e, which is due to the different microscopes used during the observation. The morphology of Figure 4a–d with a white γ phase and black γ′ phase were observed by the Quanta FEG 450 microscope, which is a field emission scanning electron microscope. The morphology of Figure 4e with a black γ phase and light-color γ′ phase was observed by the EVO 18 microscope, which is a tungsten filament scanning electron microscope.
To understand the deformation mechanism during the steady-creep stage, the specimens that were tested at 980 °C/300 MPa were taken as an example to analyze the movement mechanisms of dislocation. The creep curves and TEM microstructure images of the alloy crept at 980 °C/300 MPa for 2 h, 10 h, and 50 h are shown in Figure 5. After the alloy is crept for 2 h, the misfit dislocations are observed on the γ matrix, as in Figure 5b. Most of the dislocations in the γ matrix are captured by the γ/γ′ interfaces. After creeping for 10 h, the dislocations in the alloy propagated in the γ matrix and formed dislocation networks by dislocation reactions. After creeping for 50 h, some dislocations have cut into the γ′ precipitates. The dislocation pairs coupled with antiphase boundary (APB) and the stacking faults are observed in Figure 5d.
The dislocation configurations of the superalloy after undergoing 2 h of creep at 980 °C/300 MPa are depicted in Figure 6. In this depiction, all dislocations within the γ matrix are short. Specific dislocations are marked by the labels A, B, and C. Notably, dislocation A loses contrast when the diffraction vectors are altered to g = 02 2 ¯ and g = 11 1 ¯ , as in Figure 6a,b. The Burger’s vector of A is determined to be b A = g 02 2 ¯ × g 11 1 ¯ = 011 . The direction of the trace for dislocation A is identified as μ A = 02 2 ¯ . Consequently, the slipping plane for dislocation A is recognized as ( 1 ¯ 00 ) through the application of b × μ . The dislocation B lose its contrast as the diffraction vectors g = 02 2 ¯ , whereas it is visible as the diffraction vectors g = 11 1 ¯  g = 1 1 ¯ 1 , and g = 200 . The Burger’s vector of dislocation B is, therefore, indicated as b B = 211 . Similar to dislocation A, dislocation C becomes invisible when the diffraction vectors are g = 02 2 ¯ and g = 1 1 ¯ 1 . The Burger’s vector is identified as b C = g 02 2 ¯ × g 1 1 ¯ 1 = 011 for dislocation C. The trace direction of dislocation C is determined to be μ C = 21 1 ¯ . Thus, the slipping plane for dislocation C is identified as 1 ¯ 1 1 ¯ . Evidently, the analysis conducted thus far supports the conclusion that the deformation mechanism during the initial creep stage in this alloy is a dislocation motion within the γ matrix, alongside the dislocation climbing over γ′ phase, with the slipping planes encompassing both {111} and {001} planes.
After creeping for 50 h at 980 °C/300 MPa, the microstructure of the alloy during the later period of steady-state creep was indicated in Figure 7. It is shown from Figure 7 that the dislocation networks were distributed in the γ/γ′ interfaces, some dislocations had sheared into γ′ precipitates, and the dislocation D is distributed in the γ matrix. According to the dislocation g · b = 0 invisibility criterion, the Burgers vector of dislocation D is identified as [011]. Furthermore, according to its morphological features, the trace directions of dislocation D are μ = 2 ¯ 1 1 ¯ , μ = 200 , and μ = 21 1 ¯ from left to right. Therefore, the slipping planes can be identified as 1 ¯ 1 ¯ 1 , 001 , and 11 1 ¯ . The dislocations E and F are dislocation pairs that cut into the γ′ phases. These two dislocations are invisible when the diffraction vectors are g = 1 ¯ 1 1 ¯ and g = 0 2 ¯ 2 . They can be identified to be a / 2   110   partial dislocation pairs coupled with APB. The trace directions of dislocations E and F are both μ = 2 ¯ 1 1 ¯ . Thus, the dislocations are slipping in ( 1 ¯ 1 ¯ 1 ) planes. Figure 8 shows another beam bright field image of the alloy after creeping for 50 h at 980 °C/300 MPa close to the [001] zone axis. There is a stacking fault in the γ′ precipitation marked by the black arrow in Figure 8a. The Burgers vector of the lead dislocation that cut into the γ′ phase could be identified as a / 6   1 1 ¯ 2 . Furthermore, in Figure 8b, the   a   010 super-dislocation cut into the γ′ phase along the {111} planes. It is, therefore, indicated that the deformation mechanism during the steady-state creep is controlled by the dislocations gliding in the γ matrix, super-dislocation into γ′ phases, dislocation pairs coupled with APB cutting into γ′ phases, and dislocations with stacking faults in the γ′ phases.

4. Discussion

4.1. Analysis of Dislocation Movement in γ Phase

During the initial creep stage, the predominant deformation mechanism exhibited by the SX alloy involves the movement of dislocations within the γ matrix. Diagrams displaying the progression of the dislocation motion within the γ matrix are provided in Figure 9. These diagrams illustrate phenomena such as dislocation slipping, cross-slipping, and climbing over γ′ phases. Since both γ and γ′ phases have a face-centered cubic (FCC) crystalline structure, the primary activated slip planes are identified as {111} planes [1]. When subject to creep conditions at 980 °C, dislocations are primarily activated along the <110> direction on {111} planes, such as dislocation C in Figure 6. Notably, the projection of this dislocation forms a 45° angle relative to the γ/γ′ interfaces. In instances where <110> dislocations on {111} planes glide towards the γ/γ′ interfaces, their progress might be impeded by γ′ precipitates. In response, these dislocations could potentially undergo cross-slipping onto {100} planes, as the behavior demonstrated by dislocation A in Figure 6. During the latter part of the initial creep stage and the primary period of the steady-creep stage for elevated-temperature SX Ni-based superalloys, dislocation networks are formed at the interface of the γ and γ′ phases. Concurrently, the γ′ precipitates transform into a N-type rafting structure perpendicular to the applied stress direction. Upon the approach of slipping dislocations to the γ/γ′ interfaces, certain dislocations may interact with the aforementioned dislocation networks, as depicted in Figure 6c, consequently influencing the direction of their glide [15]. This could lead to scenarios where dislocations either cross-slip or climb over γ′ precipitates, such as dislocation D in Figure 7.
To understand the formation of dislocation networks and their impact on the creep properties of the SX Ni-based superalloy, the morphologies of the dislocation networks during different creep times at the condition of 980 °C/300 MPa were investigated. According to the analysis with the dislocation networks, the square and hexagonal dislocation networks were observed, as shown in Figure 10a,b. At the initial creep stage, the dislocations of <110> {111} systems proliferated in the γ matrix and then piled up at the interface of γ/γ′ phases. After a series of dislocation reactions, the a / 2   110 dislocations could react to the other a / 2   110 dislocations and then to form various dislocation networks. Based on previous studies [1,12,13], for [001] orientation specimens, the applied stress in [001] direction is dominant for the dislocation activating and gliding, which would lead to primary dislocations with a Burger vector of a / 2 101 type. The primary dislocations are along the [110] or 1 1 ¯ 0 trace directions with a 60° character. Then the secondary and tertiary dislocations are generated by the influence of misfit stresses, when dislocations pile up at the interface of γ/γ′ phases.
The square dislocation networks were observed after creeping for 10 h, as shown in Figure 10a. This kind of dislocation network is usually formed at a small strain deformation during creep. The square dislocation networks are formed by two sets of dislocations with perpendicular lines and different Burgers vectors. As the dislocation networks in Figure 10a,d, the Burger vectors of three dislocations at the joint are b = a / 2 101 , b = a / 2 1 ¯ 01 , and b = a 100 , respectively. The a / 2 101 dislocation and a / 2 1 ¯ 01 dislocation are primary dislocations, gliding at the {111} slip planes. When the primary dislocations slip to the γ/γ′ interface, the a / 2 101 dislocation could cross-slip to the {100} planes and react with the a / 2 1 ¯ 01 dislocation. The reaction leads to the secondary dislocation with a Burgers vector of a 100 [13].
a / 2 101 + a / 2 1 ¯ 01 a   001
The square dislocation networks are not stable. As the dislocation reaction continues, the hexagonal dislocation networks are formed. There are three dislocations with different Burgers vectors at each joint in hexagonal dislocation networks. As shown in Figure 10b and 10e, the Burgers vectors of the dislocations are b = a / 2 011 , b = a / 2 10 1 ¯ , and b = a / 2 110 , respectively. The trace direction of the a / 2 011 dislocation is along 1 ¯ 01 , and the trace direction of the a / 2 10 1 ¯ dislocation is along 01 1 ¯ . Both of the two dislocations are mixed dislocations, characterized by Burgers vector inclined at an angle of 60° toward the dislocation line. Under the action of misfit stress, the a / 2 011 dislocation and a / 2 10 1 ¯ dislocation react to form a secondary dislocation a / 2 110 , which is an edge dislocation along the 1 ¯ 10 trace direction. The angles between these three dislocations are 120°, forming a hexagonal dislocation network.
a / 2 10 1 ¯ + a / 2 011 a / 2 110
For the hexagonal dislocation networks, the dislocations are difficult to cut through γ′ phases [15]. The presence of dislocation networks within the γ phase acts as an impediment to the movement of these dislocations. The creep strain rates are, therefore, staying at a constant, and then the creep enters into a steady-creep stage. When the creep progression goes on, the structural integrity of the dislocation networks becomes destroyed due to stress concentration and the accrual of dislocations at elevated densities, as can be seen in Figure 10c,f. Consequently, dislocations in γ phase shear into γ′ phase, accomplished through the interaction of dislocation pairs featuring APB configurations.

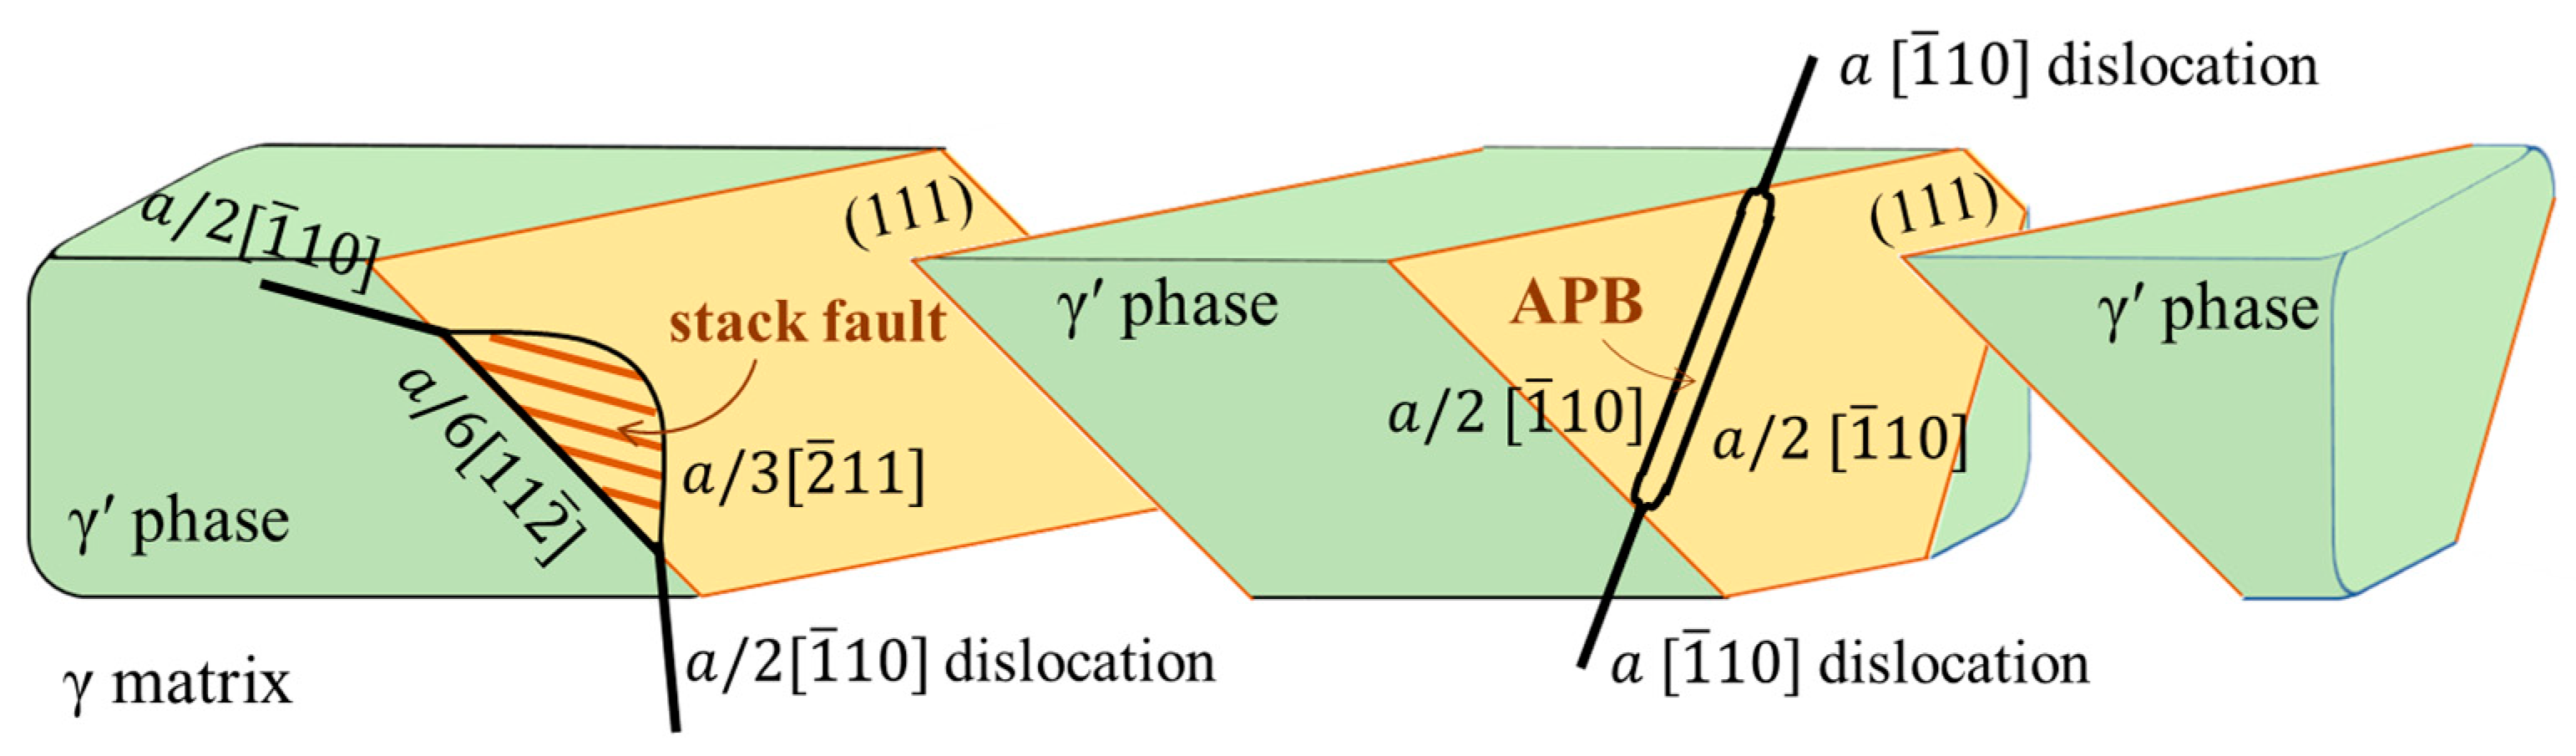
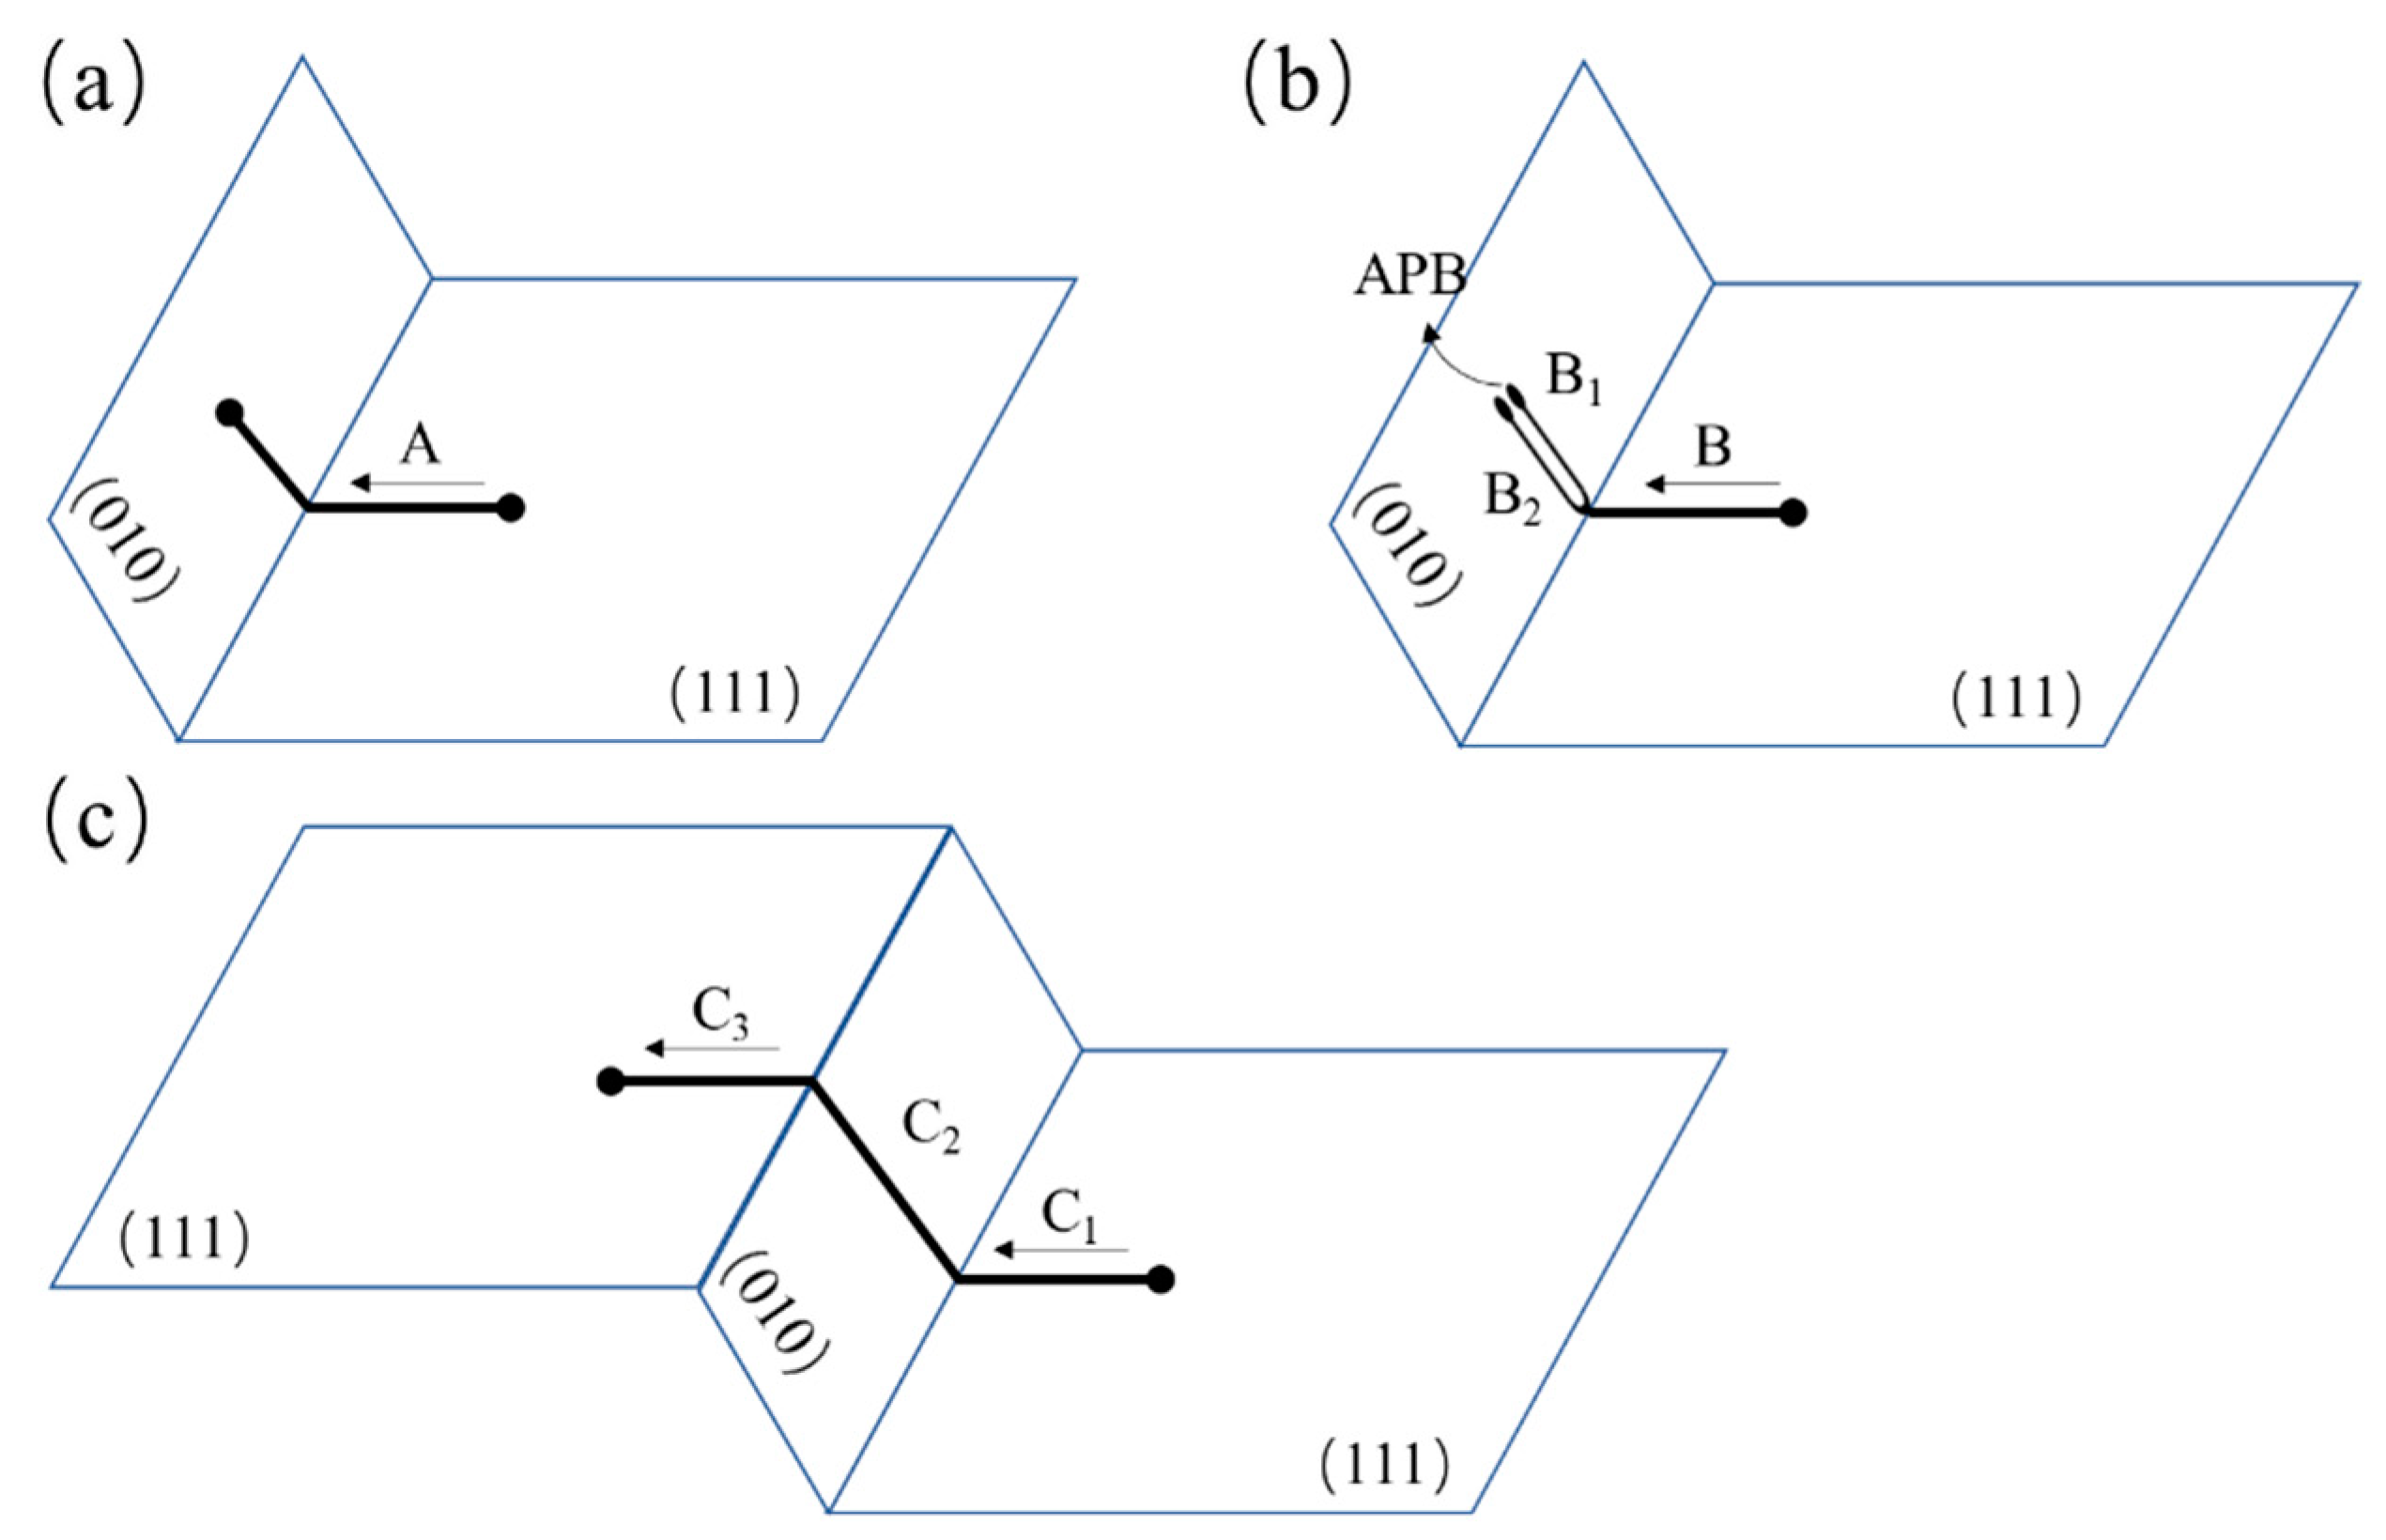
4.2. Mechanism of Dislocations Decomposing in γ′ Phase

As the process of creep progresses, the phenomenon of coarsening becomes evident within the γ/γ′ phases, leading to a decrease in the resistance of the dislocations’ glide within the γ matrix. Based on the investigation conducted by Svoboda and Lukas [27], the phenomenon of rafting and the subsequent coarsening of the γ′ phase can be expounded through the application of a global energetic framework, utilizing the variational formulation of the thermodynamics of irreversible processes. Evidently, at temperatures approximately exceeding 900 °C and accompanied with applied stresses, the process of rafting necessitates a certain plastic deformation within the horizontal channels. This deformation stands as a prerequisite, initiating the onset of rafting. Moreover, it is noteworthy that the requirement for the completion of the rafting process ranges from several hours to tens of hours, aligning with the typical conditions conducive to rafting occurrences.
Additionally, stress concentration arises due to the accumulation of dislocations in the interfaces of the γ/γ′ phases. This accumulation can potentially induce the shearing of dislocations into the γ′ phase, wherein the stress concentration exceeds the critical strength of the γ′ phases. The dislocation shearing into the γ′ phase may undergo a decomposition process, resulting in the formation of partial dislocations accompanied by stacking faults and antiphase boundaries (APB) [28]. A visual representation of the process of dislocation shearing into the γ′ phase is elucidated in Figure 11. The reactions involving dislocation transformations can be expressed as follows:
(1) The <110> dislocations shearing into the γ′ phase are decomposed to the configuration of two a / 2   110 dislocations plus APB [8,29].
a 110 γ a / 2 110 γ + APB + a / 2 110 γ
(2) The dislocations shearing into the γ′ phase may be decomposed to the configuration of <112> super-Shockley partial dislocations plus the stacking fault, which is located between two partial dislocations. The a / 6   112 partial dislocation may be captured by γ/γ′ interface, while the a / 3   112 partial dislocation is located in γ′ phase [1].
a / 2 1 ¯ 10 γ a / 6 11 2 ¯ γ / γ + SISF + a / 3 2 ¯ 11 γ
With the proceeding creep, the super-dislocations in γ′ phase could cross-slip from the {111} to {001} slip system, forming a K-W lock, as shown in Figure 12a. The structure of K-W locks is nonplanar, which could inhibit dislocations from gliding and cross-slipping. The Re element could reduce the diffusion rates of other elements. For K-W locks, the interaction of Re with other elements could enhance the stability of this dislocation configuration. The dislocations in K-W locks could be maintained and are hard to reactivate to release the locks under 980 °C. The super-dislocation that has cross-slipped in the {001} slip system could decompose into two a / 2 110 dislocations with an APB, as shown in Figure 12b. Moreover, temperatures higher than 1070 °C, the thermal activation may promote the dislocations in K-W locks to re-slip in the {111} planes, which means the release of K-W locks [20]. The schematic of the release process is shown in Figure 12c.

5. Conclusions

(1) The creep behaviors of the SX Ni-based superalloy at 980 °C was observed with an almost absent initial creep stage. As the applied stresses increase from 200 MPa to 410 MPa, accordingly, the minimum strain rates of the alloy increase from 0.036 × 10 7 s 1 to 2.306 × 10 7 s 1 at the steady-creep stage. The stress exponent of the alloy at 980 °C is measured to be n = 5.55.
(2) During initial creep at 980 °C, dislocations are mainly activated and glided in γ matrix on the {111} plane. The movement of dislocation in γ matrix included the dislocations slipping, cross-slipping from {111} to {001} planes, and climbing over γ′ phases. The slipping dislocations in γ matrix piled up at γ/γ′ interfaces, forming dislocation networks. The dislocation networks were observed with square, hexagonal and irregular morphology. The formation of dislocation networks was analyzed as the interaction of <110> {111} dislocations.
(3) In the tertiary creep stage, the phenomenon of dislocations shearing into the γ′ phase undergoes decomposition by two mechanisms. The <110> super-dislocation that participates in shearing into the γ′ phase can be decomposed to form the configuration featuring   a / 2   110 partial dislocations with APB. Alternatively, this super-dislocation may also be decomposed into a configuration involving <112> Shockley partial dislocations stacking faults. The mode of decomposition is contingent on the energy of APB and stacking faults. Moreover, the dislocations that engage in shearing into the γ′ phase may exhibit a propensity for cross-slipping, transitioning from {111} planes to {001} planes, thereby giving rise to formations of K-W locks.

Author Contributions

Conceptualization, H.Y.; validation, R.X. and Y.L.; formal analysis, Y.L.; investigation, R.X.; writing—original draft preparation, R.X.; writing—review and editing, H.Y. All authors have read and agreed to the published version of the manuscript.

Funding

This research was funded by the Ye Qisun Science Foundation of National Natural Science Foundation of China, grant number U2141204, the Science Center for Gas Turbine Project, grant number P2021-A-IV-001-001, and the National Science and Technology Major Project, grant number J2019-VI-0002-0115.

Data Availability Statement

The data presented in this study are available on request from the corresponding author.

Conflicts of Interest

The authors declare no conflict of interest. The funders had no role in the design of the study; in the collection, analyses, or interpretation of data; in the writing of the manuscript; or in the decision to publish the results.

References

  1. Reed, R.C. The Superalloys Fundamentals and Applications; Cambridge University Press: New York, NY, USA, 2006. [Google Scholar]
  2. Li, J.R.; Liu, S.Z.; Wang, X.G.; Shi, Z.X.; Zhao, J.Q. Development of A Low-Cost Third Generation Single Crystal Superalloy Dd9. Superalloys 2016, 2016, 55–63. [Google Scholar]
  3. Li, Y.; Wang, L.; Zhao, S.; Zhang, G.; Lou, L. Creep anisotropy of a 3rd generation nickel-base single crystal superalloy in the vicinity of [001] orientation. Mater. Sci. Eng. A 2022, 848, 143479. [Google Scholar] [CrossRef]
  4. Xia, W.; Zhao, X.; Yue, L.; Zhang, Z. Microstructural evolution and creep mechanisms in Ni-based single crystal superalloys: A review. J. Alloys Compd. 2020, 819, 152954. [Google Scholar] [CrossRef]
  5. Shang, Z.; Niu, H.; Wei, X.; Song, D.; Zou, J.; Liu, G.; Liang, S.; Nie, L.; Gong, X. Microstructure and tensile behavior of nickel-based single crystal superalloys with different Re contents. J. Mater. Res. Technol. 2022, 18, 2458–2469. [Google Scholar] [CrossRef]
  6. He, C.; Liu, L.; Huang, T.; Yang, W.; Wang, X.; Zhang, J.; Guo, M.; Fu, H. The effects of misfit and diffusivity on γ′ rafting in Re and Ru containing Nickel based single crystal superalloys—Details in thermodynamics and dynamics. Vacuum 2021, 183, 109839. [Google Scholar] [CrossRef]
  7. Ji, J.; Zhang, Z.; Chen, J.; Zhang, H.; Zhang, Y.; Lu, H. Effect of refractory elements M (=Re, W, Mo or Ta) on the diffusion properties of boron in nickel-based single crystal superalloys. Vacuum 2023, 211, 111923. [Google Scholar] [CrossRef]
  8. Tian, S.; Zhu, X.; Wu, J.; Yu, H.; Shu, D.; Qian, B. Influence of Temperature on Stacking Fault Energy and Creep Mechanism of a Single Crystal Nickel-based Superalloy. J. Mater. Sci. Technol. 2016, 32, 790–798. [Google Scholar] [CrossRef]
  9. Probst-Hein, M.; Dlouhy, A.; Eggeler, G. Interface dislocations in superalloy single crystals. Acta Mater. 1999, 47, 2497–2510. [Google Scholar] [CrossRef]
  10. Boualy, O.; Clément, N.; Benyoucef, M. Analysis of dislocation networks in crept single crystal nickel-base superalloy. J. Mater Sci. 2018, 53, 2892–2900. [Google Scholar] [CrossRef]
  11. Jiang, L.; Cui, Y.; Wu, M.; Li, S.; Han, Y. Creep behavior and dislocation mechanism of Ni3Al based single crystal alloy IC6SX at °C. Prog. Nat. Sci. Mater. Int. 2021, 31, 755–761. [Google Scholar] [CrossRef]
  12. Lv, X.; Zhang, J. Core structure of a <100> interfacial superdislocations in a nickel-base superalloy during high-temperature and low-stress creep. Mater. Sci. Eng. A 2017, 683, 9–14. [Google Scholar]
  13. Lv, X.; Zhang, J. Three-dimensional geometry of “square-like” dislocation network in nickel-base single crystal superalloy. J. Alloys Compd. 2016, 688, 449–455. [Google Scholar] [CrossRef]
  14. Zhang, J.X.; Murakumo, T.; Harada, H.; Koizumi, Y. Dependence of creep strength on the interfacial dislocations in a fourth generation SC superalloy TMS-138. Scr. Mater. 2003, 48, 287–293. [Google Scholar] [CrossRef]
  15. Li, Y.; Wang, L.; He, Y.; Zheng, W.; Lou, L.; Zhang, J. Role of interfacial dislocation networks during secondary creep at elevated temperatures in a single crystal Ni-based superalloy. Scr. Mater. 2022, 217, 114769. [Google Scholar] [CrossRef]
  16. Shu, D.L.; Tian, S.G.; Liang, S.; Zhang, S.B. Deformation and Damage Mechanism of a 4.5% Re-containing Nickel-based Single Crystal Superalloy During Creep at 980 °C. J. Mater. Eng. 2017, 45, 93–100. [Google Scholar]
  17. Chang, C.; Jiang, L.; Wu, M.; Li, S.; Han, Y. Effect of temperature and stress on high temperature creep behavior of Ni3Al-based single crystal superalloy. Prog. Nat. Sci. Mater. Int. 2022, 32, 267–271. [Google Scholar] [CrossRef]
  18. Lv, P.; Liu, L.; Zhao, G.; Guo, S.; Zhou, Z.; Chen, R.; Zhao, Y.; Zhang, J. Creep properties and relevant deformation mechanisms of two low-cost nickel-based single crystal superalloys at elevated temperatures. Mater. Sci. Eng. A 2022, 851, 143561. [Google Scholar] [CrossRef]
  19. Zhao, G.; Tian, S.; Zhang, S.; Tian, N.; Liu, L. Deformation and damage features of a Re/Ru-containing single crystal nickel base superalloy during creep at elevated temperature. Prog. Nat. Sci. 2019, 29, 210–216. [Google Scholar] [CrossRef]
  20. Hirsch, P.B. A new theory of the anomalous yield stress in l12 alloys. Philos. Mag. A 1992, 65, 569–612. [Google Scholar] [CrossRef]
  21. Wang, X.; Li, J.; Liu, J.Y.S.; Shi, Z.; Yue, X. Tensile Anisotropy of Single Crystal Superalloy DD9. Acta Metall. Sin. 2015, 51, 1253–1260. [Google Scholar]
  22. Xu, R.; Li, Y.; Yu, H. Microstructure Evolution and Dislocation Mechanism of a Third-Generation Single-Crystal Ni-Based Superalloy during Creep at 1170 °C. Materials 2023, 16, 5166. [Google Scholar] [CrossRef] [PubMed]
  23. Wen, Z.; Zhang, D.; Li, S.; Yue, Z.; Gao, J. Anisotropic creep damage and fracture mechanism of nickel-base single crystal superalloy under multiaxial stress. J. Alloys Compd. 2017, 692, 301–312. [Google Scholar] [CrossRef]
  24. Zhang, Y.; Hu, J.; Kang, L.; He, Y.; Xu, W. Creep Behavior Characterization of Nickel-Based Single-Crystal Superalloy DD6 Thin-Walled Specimens Based on a 3D-DIC Method. Materials 2023, 16, 3137. [Google Scholar] [CrossRef] [PubMed]
  25. Mukherjee, A.K.; Bird, J.E.; Dorn, J.E. Experimental correlations for high-temperature creep. Trans. ASM 1969, 62, 155–163. [Google Scholar]
  26. Li, Y.; Wang, L.; Zhang, G.; Zheng, W.; Lou, L.; Zhang, J. On the role of topological inversion and dislocation structures during tertiary creep at elevated temperatures for a Ni-based single crystal superalloy. Mater. Sci. Eng. A 2021, 809, 140982. [Google Scholar] [CrossRef]
  27. Svoboda, J.; Lukas, P. Modelling of kinetics of directional coarsening in Ni-superalloys. Acta Mater. 1996, 44, 2557–2565. [Google Scholar] [CrossRef]
  28. Tang, Y.; Huang, M.; Xiong, J.; Li, J.; Zhu, J. Evolution of super dislocation structures during tertiary creep of a nickel-based single-crystal superalloy at high temperature and low stress. Acta Mater. 2017, 126, 336–345. [Google Scholar] [CrossRef]
  29. Bürger, D.; Dlouhý, A.; Yoshimi, K.; Eggeler, G. How Nanoscale Dislocation Reactions Govern Low-Temperature and High-Stress Creep of Ni-Base Single Crystal Superalloys. Crystals 2020, 10, 134. [Google Scholar] [CrossRef]
Figure 1. Geometry and sizes of the creep specimen (unit: mm) (Reprinted from Ref. [22]).
Metals 13 01541 g001
Figure 2. Creep properties of the alloy at 980 °C. The creep curves at applied stress (a) above 300 MPa and (b) below 300 MPa. The insets in (a,b) are the magnifications of the initial creep stage of the creep curves. The strain-rate vs. time curves at applied stress (c) above 300 MPa and (d) below 300 MPa.
Metals 13 01541 g002
Figure 3. Dependence of minimum creep rates and applied stresses for the alloy under applied various stresses 980 °C.
Metals 13 01541 g003
Figure 4. Microstructure of the alloy. (a) after the full heat treatment (Reprinted from Ref. [22]); (bd) after creeping for 2 h, 10 h, and 50 h at 980 °C/300 MPa, respectively; (e) after creeping up to rupture at 980 °C/300 MPa; (f) the schematics of the measurements of the γ and γ′ phases.
Metals 13 01541 g004
Figure 5. (a) Creep curves of the alloy at 980 °C/300 MPa; Transmission electron microscopy images of the alloy after creeping for (b) 2 h, (c) 10 h, and (d) 50 h.
Metals 13 01541 g005
Figure 6. TEM morphology of the alloy after creeping for 2 h at 980 °C/300 MPa: (ad) Dislocations in the γ phases with different diffraction vectors.
Metals 13 01541 g006
Figure 7. TEM morphology of the alloy after creeping for 50 h at 980 °C/300 MPa: (ad) Dislocations in the γ and γ′ phases with different diffraction vectors.
Metals 13 01541 g007
Figure 8. TEM morphology of the alloy after creeping for 50 h at 980 °C/300 MPa: (a) stacking fault, (b) super-dislocation.
Metals 13 01541 g008
Figure 9. Schematic diagrams of the dislocation movement in the γ matrix during creep: (a) dislocation cross-slipping in γ matrix; (b) dislocation climbing over the γ′ phase (Reprinted from Ref. [22]).
Metals 13 01541 g009
Figure 10. TEM images of (a) the square dislocation networks, (b) the hexagonal dislocation networks, and (c) the irregular dislocation networks; (df) the diagram of formation mechanisms of dislocation networks in (ac).
Metals 13 01541 g010
Figure 11. Schematics diagram of dislocation shearing into the rafted γ′ phase and decomposing to a / 6   11 2 ¯ + a / 3   2 ¯ 11 with stacking fault and to two a / 2   1 ¯ 10   dislocations with APB.
Metals 13 01541 g011
Figure 12. Formation of the K-W locks in (a,b), and the release of K-W locks in (c).
Metals 13 01541 g012
Table 1. Chemical composition of the alloy used in this study (wt.%) (data from Refs. [2,22]).
CrCoMoWTaReNbAlHfCYNi
3.5726.57.54.50.55.60.10.0080.001Bal.
Table 2. Tensile properties of our alloy at RT and 980 °C on [001] orientation.
Temperature (°C)OrientationUTS
(MPa)
YS
(MPa)
EL
(%)
RA
(%)
E
(GPa)
20[001]98392920.820.6135.3
980[001]80962729.243.193.3
Table 3. Creep lifetimes and minimum strain rates of the alloy at 980 °C.
Stress/MPa200240270300340380410
Lifetime/h841502292185915335
Minimum   creep   rates / × 10 7 s 1 0.0360.1890.0440.0470.5831.2312.306
Disclaimer/Publisher’s Note: The statements, opinions and data contained in all publications are solely those of the individual author(s) and contributor(s) and not of MDPI and/or the editor(s). MDPI and/or the editor(s) disclaim responsibility for any injury to people or property resulting from any ideas, methods, instructions or products referred to in the content.

