Abstract
Esophageal nitinol stents are an established method for treating swallowing difficulties caused by obstructing cancer. This raesearch investigates the influence of different qualities of raw metal alloys in combination with production technology on corrosion resistance in standardized simulated gastric fluid (SGF). Four different international stent manufacturers produced samples of their standard stents from nitinol sourced from three different alloy manufacturers. The stents were subjected to a 6-week immersion in SGF. During the immersion, the surface was studied at specified intervals using microscopy. The surface of the samples was also studied by X-ray Photoelectron Spectroscopy and after immersion the released ions were analyzed. Results demonstrated that both raw material and certain steps in the manufacturing process negatively affect corrosion resistance. Analysis of the SGF showed that the amount of nickel released is proportional to the degree of corrosion attack. Finally, current accepted standard test methods are inadequate for assessing susceptibility to corrosion by gastric acid and should take the low pH of the implanted environment into account. Conversely, certain measures in the manufacturing process are able to reduce the impact of the base material on corrosion susceptibility.
1. Introduction
The first clinical use of esophageal stents was reported in the 1960s in the treatment of malignant dysphagia [1]. Today, many different stent designs with different parameters are available and their mechanical properties including radial and expansion force, axial rigidity, and conformability vary greatly, depending on the stent skeleton design, as well as the material and method of covering [2,3]. Curiously, despite self-expanding metal stents (SEMS) having been in clinical practice for decades, the understanding of the clinical need and the ideal test methods for stents are poorly understood and still undefined [4].
At present, SEMS for the gastro-intestinal tract are almost universally made of “nitinol”, a nickel-titanium super-alloy [5]. Stents are very often covered with polymers to prevent cancer or reactive granulation tissue from growing into the stent [6]. If the nitinol stent is placed in the esophagus for a long time, the implant may fail due to the corrosive environment of the human body in combination with material fatigue [7]. This applies particularly to stents placed partially or wholly within the stomach, where they are exposed to the low pH of hydrochloric acid contained in gastric secretions. In the case of esophageal carcinoma, 2/3 of tumors occur at the gastro-esophageal junction, requiring the lower end of the stent to be placed in the stomach. Nitinol is an equimolar alloy of titanium and nickel. It exhibits shape memory and superelasticity, as well as acceptable biocompatibility, which are the main reasons this material is used in the production of stents. Mechanical properties and corrosion resistance depend on the phase composition. The phase composition of input material shall be as homogenous as possible. The presence of other phases and impurities may adversely affect the above properties [8,9,10,11]. The corrosion resistance of nitinol is based on the formation of a uniform thin layer of TiO2. This layer is a uniform barrier layer for corrosion prevention [7,12]. In order for the stent to acquire shape-memory with regards to its 3D-configuration, it must be heat-treated, usually with temperatures around 500 °C. Heat treatment, however, affects the thickness of the TiO2 layer. The thickness of the oxide layer increases with the heat treatment temperature [13], as does the fatigue resistance [14]. On the other hand, if the TiO2 layer is too thick, it may have an increased number of defects. Such a defective layer loses its corrosion-protective effects [15,16]. The thickness of the oxide layer can be changed by subsequent surface treatment, e.g., chemical polishing, electropolishing, and plasma electrolytic oxidation (PEO) [17]. Both methods reduce the oxide layer formed by the heat treatment [18].
The application of the surface treatment also improves the fatigue life, as it reduces the amount of surface defects [14]. The mechanical stress to which the stent material is subjected has a significant effect on the corrosion resistance. Mechanical stress causes the oxide layer to crack, exposing the unoxidized metal to the corrosive environment and accelerating the corrosion process [19]. The above-mentioned processes can lead to breakage of the nitinol wires, which can lead to stent failure. And thus, to the deterioration of the patient’s condition. Several cases have been reported in clinical practice where partial or complete fracture of esophageal nitinol stents have occurred [20,21,22,23].
Another risk associated with corrosion of nitinol stents is exposure of the surrounding tissues to higher doses of nickel, which is released into the body during the corrosion process. A poor surface treatment causes a local increase in nickel concentration [24], which, in vascular animal experiments, can cause inflammation and stenosis of stented arteries [25].
In the production of nitinol stents, the quality of the raw input material on corrosion resistance plays a key role. Although suppliers are bound by strict standards, there is still space for minor variations, in particular the amount of inclusions, the state of the surface (oxide layer thickness), and the final processing of the wire (e.g., etching). At present, it is possible to produce stents from wires with different chemical compositions with different history of heat treatment and surface quality. Different surface qualities show different corrosion resistance [26].
The aim of this study is to determine the effect of different quality of input materials in combination with different production processes on the corrosion resistance of esophageal nitinol stents in a simulated gastric environment.
2. Materials and Methods
Experiments were conducted on nitinol esophageal stents made from 4 different manufacturers (A to D) by standard manufacturing process of each manufacturer. Each manufacturer was asked to supply stent samples of approximately 25 mm × 100 mm from batches of 0.25 mm nitinol wire acquired from three different wire suppliers (1 to 3). Because testing focused on the corrosion resistance of the stent skeleton, the samples were not provided with a polymer or other covering that can change the corrosion resistance.
The surface of the samples was studied by stereomicroscope Olympus DF Plapo 1 X (Olympus, Tokyo, Japan) and by scanning electron microscope (SEM) Tescan Vega3 LMU (Tescan, Brno, Czech Republic) before, during, and after the immersion in simulated gastric fluid (SGF). The composition of the raw wires was verified by Energy Dispersive Spectrometer (EDS) OXFORD Instruments INCA 350 (Abingdon, UK).
The chemical composition of the surface layer before and after immersion in SGF was analyzed by XPS. An ESCAProbeP (Omicron Nanotechnology Ltd., London, UK) was used for analysis. An aluminium anode with an excitation energy of 1486.7 eV was used as the X-ray source. CasaXPS software 2.3.15 (Casa Software Ltd., Devon, IK)was used to evaluate the spectra.
The calculation of the oxide layer thickness was based on the free flight path of the electron between two inelastic collisions [27,28]. These calculated thicknesses are only approximate; only pure oxides were considered in the calculations, which, however, do not occur on the examined samples; here, they are always mixtures.
The concentration of the released ions within the SGF after 6-week immersion was measured by Atomic Absorption Spectroscopy (GBC 932Plus, Dandenong, Australia).
Most stent manufacturers test corrosion susceptibility according to the generic ASTM standard F-2129, which was originally aimed at biliary stents. However, the high pH of this does not reflect the hostile environment of esophago-gastric stents. Therefore, simulated gastric fluid prepared according to the ASTM 2528-06 standard [29] for gastrostomy tubes was chosen for testing, to reproduce the low pH and components of gastric juice encountered in the lower esophagus due to stent-induced reflux [30,31], or because the stent may need to be placed with its lower end within the stomach [32].
Table 1 shows the composition of SGF. All used substances were in p.a. quality. The value of pH was 1.2. The pH of the solution was also measured after immersion. Immersion was conducted at 37 °C.

Table 1.
Composition of SGF.
During immersion, the stents were withdrawn from the SGF at the regular intervals (after 3 days of immersion and then weekly up to 6 weeks) to conduct analysis (optical microscopy, SEM, radial forces measurement), rinsed with ethanol and distilled water, and returned to SGF. This procedure was previously tested and compared with non-interrupted immersion. There were no differences in the results in both procedures.
The electrochemical measurement was realized in the standard three electrode set up with silver-silver chloride reference electrode (SSCE) and glassy carbon counter electrode. The measurement consists of the 1 h stabilization of the open circuit potential (OCP) followed by 1 mV/s polarization in the range ±20 mV/OCP. The polarization resistance, which is reciprocal to the corrosion rate, was then evaluated. The Reference600 (Gamry, Warminster, PA, USA) potentiostat was used. The measurement was realized on the knitted out wires from individual stents. The exposed area was defined by galvanic tape 3M 470 (3M, St. Paul, Minnesota, USA), which has sufficient adhesion to prevent crevice corrosion and to eliminate the influence of the free end of the wire on the results (the surface state at the shear point is different from the rest of the surface).
Radial resistive force (RRF) is the force exerted by the pressure-resistant stent against compression. Chronic outward force (COF) is the force the stent exerts on the surrounding environment during expansion. Forces were measured with a dedicated TTR2 radial force measuring instrument (Blockwise, Tempe, AZ, USA). Measurement was conducted at a temperature of 37 °C. Parameters of measurement are listed in Table 2.
Table 2.
Parameters of radial force measurement.
Two manufacturers supplied straight stents; two supplied stents with larger ends (flared and dog-bone shaped)
The initial diameter in the case of measurement of samples from manufacturer D was 28 mm. This is due to the fact that the stent ends were of a larger diameter than the trunk. To accommodate this, an initial diameter of the compression tool was chosen so that there was no deformation of the stent before the beginning of the measurement.
The final diameter in case of measurement of samples from manufacturer C was set at 7.8 mm, because the radial force of the stents was so high the machine could not compress stents to 4 mm diameter (the resulting force was above the upper limit of the machine).
This research was conducted on 3 stent samples from each manufacturer and each sample was manufactured from different wire. Since the stent manufacturers did not provide a larger number of samples, it was not possible to replicate the measurements several times. Since the stents were manufactured using a standard manufacturing process, it can be assumed that this process is fully validated. A validated process gives repeatable results, so it can be concluded that the samples would also show repeatable and reproducible behavior.
3. Results
3.1. Surface State
The composition of the individual raw wires was 50.3 ± 0.6 at% Ti and 49.7 ± 0.6 at% Ni. Figure 1 shows the surface of all studied samples before the immersion in SGF using optical microscopy. The depth of the blue discoloration depends on the thickness of the TiO2 layer caused by the heat treatment [33]. Factors for this are the concentration of oxygen during the annealing, the reactivity of the alloy, and any subsequent surface finishing. The darker color (dark gray and black) of the samples reflects the surface characteristics of the raw nitinol, as each stent manufacturer produced samples by their standard production process. Slight differences in the alloy result in different surface qualities, resulting in a darker color, which reflects the dark, black, or thin oxide layer [34,35,36,37]. The metallic color of some samples is caused by the surface treatment associated with the removal of oxidized material (e.g., grinding, polishing, electropolishing, chemical etching) [18].
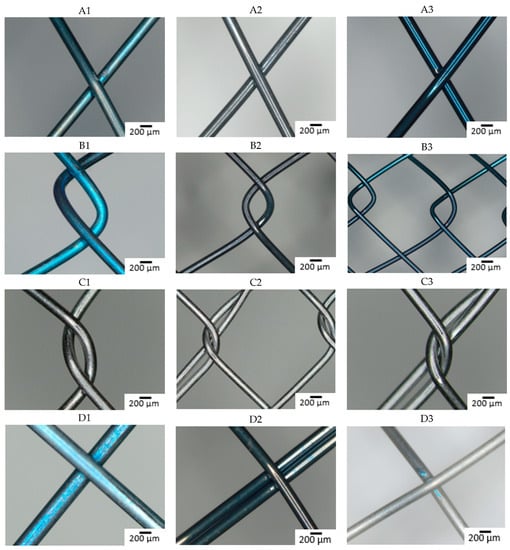
Figure 1.
Optical microscopy images of the stents surface before immersion (A–D: individual manufacturers, 1–3: different raw wire).
Manufacturers A and B did not apply any surface finish and the different coloration is a consequence of different oxidization of the nitinol wire.
With manufacturer C, the surface is metallically shiny, regardless of the type of input wire, reflecting a more aggressive surface treatment in the finishing process, removing most of the passive layer.
Samples from manufacturer D show a greater variation in color, with the sample from wire 3 appearing metallically shiny, but the other two samples show different degrees of surface (dis-)coloration. These samples also underwent some surface treatment after annealing, but the quality of the raw material here is seen to have a greater effect on the final product.
The surface state was also studied by SEM (Figure 2). The raw wire 1 has an etched surface; on the raw wires 2 and 3, a thick oxide layer is visible. Based on the structure and color of the surface, the layer on wire 2 is thicker.
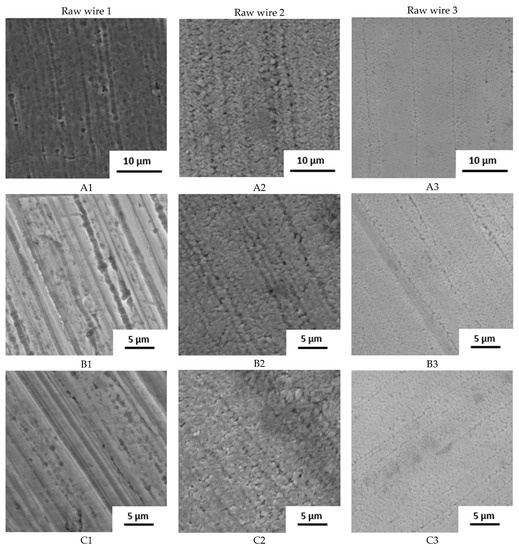
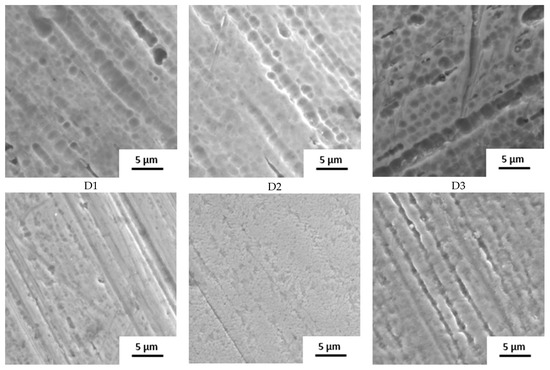
Figure 2.
Surface of samples before the immersion in SGF studied by SEM (A–D: individual manufacturers, 1–3: different raw wire).
The influence of the processing is well visible. Manufacturers A and B use the wire in its original state. No other surface treatment except shape setting was used and the differences in surface structure are preserved. In the case of manufacturer C, the three samples look very similar with very little oxide layer on the surface, indicating the etching of the final stents. Manufacturer D also used etching but probably in weaker etchant because the original surface structure can still be identified.
Table 3 summarizes the results from XPS analysis. The chemical composition of the surface layer and the thickness of the TiO2 layer were investigated simultaneously.
Table 3.
XPS analysis before and after 6-week immersion in SGF.
The original surfaces of the samples from stent manufacturers A, B. and D contained different concentrations of nickel depending on the type of wire used. In contrast, the chemical composition of the surface layer samples from manufacturer C only showed minimal differences. These samples, together with sample D3, showed the thinnest TiO2 layer. This reflects the fact that these manufacturers apply an additional surface treatment in the finishing process of the stent. Whether other manufacturers use any surface treatment in the production process cannot be determined on the basis of this analysis and this information was not provided by them.
The surface concentration of nickel decreases with the application of chemical etching [38]. After immersion in SGF, the concentration of nickel decreases, indicating that it is preferentially released from the surface of the material.
3.2. Immersion in SGF—Corrosion Behavior
Figure 3 shows the surface of all studied samples after the 6-week immersion in SGF using optical microscopy. Degradation due to corrosion of the material was most extensive on a sample from manufacturer B made of wire 2. A corrosion attack was initiated on a “free” surface, not at the intersection of individual wires. Other samples showed no corrosion pits or pits were so small that they were undetectable by optical microscopy. To better understand the effect of the combination of input material quality and manufacturing process on the corrosion resistance of the input material, the samples were subjected to further analyses (XPS).
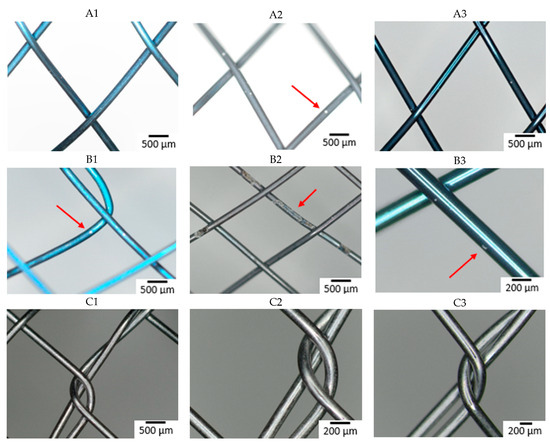
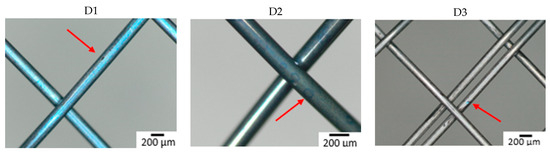
Figure 3.
Surface of samples after 6-week immersion in SGF studied by optical microscopy. The arrow indicates the corrosion damage on the wire (A–D: individual manufacturers, 1–3: different raw wire).
The time when the first pit was caused by the corrosion attack was also observed (see Table 4). All samples from manufacturer A showed corrosion attack after one week of exposure. This probably means that similar corrosion resistance can be expected regardless of the quality of the input material. In the case of samples from manufacturer B, the first pit appeared after two weeks in the case of wires 1 and 3. In the sample from wire 2, the first corrosion attack occurred after 3 days (first control of the samples). This means that from a corrosion resistance point of view, the production process depends on the quality of the input material. Samples from manufacturer C showed the longest delay to corrosion attack (wires 2 and 3) or not at all within 6 weeks (wire 1). This is likely due to the fact that the manufacturer applies a surface treatment during the production process, which thoroughly removes the oxide layer caused by the heat treatment. The layer formed during heat treatment is removed because it is not tight and blocks the possibility of creating a tight passive layer.
Table 4.
Time to detection of first corrosion pit.
In the case of manufacturer D, wire 2 showed the longest resistance to the corrosion attack. This is in contrast with other manufacturers, where wire 2 showed poor corrosion resistance. This variation demonstrates the impact of the finishing process.
Based on the comparison with the E-pH diagram of NiTi at low pH, TiO2 is formed and nickel in the form of Ni2+ ion dissolves [39]. The higher corrosion activity of NiTi alloy at lower pH was experimentally verified [40]. It should be noted that the E-pH diagram neglects the effect of the passive layer, which serves as protection against nickel dissolution. This is the main reason for detecting the first pit on samples at different times.
XPS analysis was also performed after immersion to monitor changes in surface chemical composition. All samples (except sample C3) had a decrease in Ni concentration on the surface (Table 3). Sample B2 showed the highest nickel concentration after exposure, which was probably due to the increased corrosion activity of this sample. Furthermore, there was no reduction in TiO2 thickness of all samples after immersion.
AAS analysis of SGF was performed to determine the amount of Ni and Ti released from the materials after immersion (Table 5). Most nickel was released from the samples with the largest amount of that element in the surface layer before immersion (samples A2 and B2). Ti in SGF was also detected in these samples due to more extensive corrosion attack. The lowest amount of Ni after immersion was released from samples C1 to C3 (concentration was under detection limit of the machine). Vojtěch et al. reported that nickel ions release decreases with application of additional surface treatment after the heat treatment [38]. The range of the corrosion attack and first pitting detection was directly proportional to the amount of the released ions. It is evident especially for the Ni concentration. Ti was detected only in the case of an exerted corrosion attack.
Table 5.
AAS analysis of SGF after 6-week immersion.
Based on the surface images, evaluation of first corrosion pit and XPS analysis, it can be said that the Ni content on the surface has the greatest effect on the corrosion resistance of the material. We assume that the release or elution of Ni into the environment creates weaknesses in the passive layer leading to pit formation. This theory is supported by the fact that the attack did not occur at the point of wire crossing, but on the “free” surface, and therefore depending only on the quality of the surface layer, its chemical composition, and any inclusions or defects.
The corrosion resistance parameters are summarized in Table 6. The results show that the processing of the input material affected the corrosion resistance of the final product. While the wires of suppliers 1 and 2 showed an order-of-magnitude increase in corrosion rate due to processing, wire from supplier 2 showed a decrease (except for case B2). For wires 1 and 3, post-processing played a less significant role. The values of the polarization resistances for all manufacturers are approximately the same. For wire 2, processing no longer plays a significant role. For manufacturers C and D, the final products were probably etched (see Figure 2), which increased the corrosion resistance. Also, within individual wires, there are minimal differences between these manufacturers. For manufacturers A and B, the corrosion resistance is strongly dependent on the condition of the input material. The large variances in the individual measurements indicate uneven corrosion attack.
Table 6.
Open circuit potential (OCP) and polarization resistance (Rp) after 1 h immersion in SGF. Data are presented as average ± confidence (α = 0.05).
3.3. Immersion in SGF—Radial Forces Measurement
During the exposure, the samples were subjected to radial force measurements at regular intervals. The results of this measurement are summarized in Figure 4. It can be seen from the graphs that the radial resistive force (RRF) of all samples decreased during exposure. In the case of chronic outward forces (COF), the trend is no longer so clear-cut. For samples from manufacturer A, a slight decrease in this force was observed during the immersion. The same applies to samples from manufacturer B. However, the sample made of wire 2 showed a sharp decrease in COF after 4 weeks of immersion. Due to the low number of samples, it is not possible to state with sufficient accuracy whether this decrease was caused by a measurement error or a corrosion process.
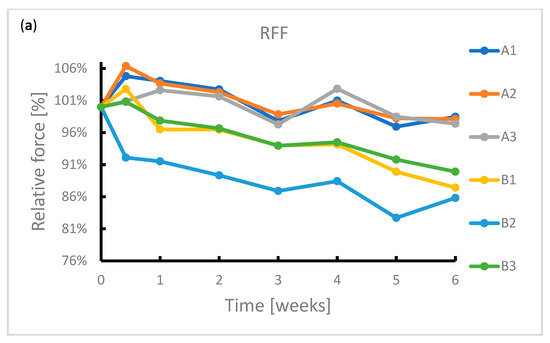
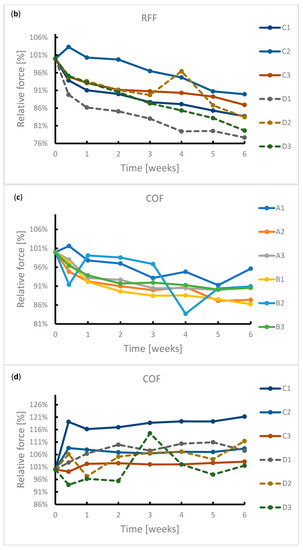
Figure 4.
Reduction in radial forces (RRF—radial resistive force and COF—chronic outward force) during the 6-week immersion in SGF: (a) RRF of samples A1–B3, (b) RRF of samples C1–D3, (c) COF of samples A1–B3, (d) COF of samples C1–D3.
In the case of samples from manufacturer C, COF stabilized after 3 days of immersion. This statement correlates with the fact that no signs of extensive corrosion were found on the surface of the samples after exposure.
The COF of the samples from manufacturer D did not show a significant change. The variance of values is probably due to the design of the samples. The samples did not have a tubular shape but were provided with flares which had a larger diameter than the stent body. These flares exerted a different force on the jaws of the measuring machine than the stent body, so the COF values showed greater variance.
The significant change of mechanical properties of sample B2 could be caused by exerted corrosion activity associated with hydrogen embrittlement, when potential may change locally, but not sufficiently enough to reflect on a macroscopic scale. Hydrogen embrittlement may occur upon immersion in an acidic environment [41]. Stent failure due to hydrogen embrittlement is also described by Volenec et al. [42].
4. Discussion
The effect of the surface finish of stents on their corrosion susceptibility is poorly understood. Not all stent manufacturers submit the stents to corrosion testing and no specific guidelines exist. Where corrosion testing is undertaken it usually follows the ASTM standard F2129-19 (“Standard Test Method for Conducting Cyclic Potentiodynamic Polarization Measurements to Determine the Corrosion Susceptibility of Small Implant Devices”). However, this does not reflect the challenges presented to stents placed in or around the stomach, where they are exposed to a very low pH. For that reason, the ASTM standard F2528-06 (“Standard Test Methods for Enteral Feeding Devices with a Retention Balloon”) was chosen, which was originally designed to assess the resilience of gastrostomy retention balloons. We recommend that future test standards take into account the additional challenges of a low pH environment, which accelerate corrosion. Unexpectedly, it was found that the corrosion attack is initiated on the “free” surface and not at the points of crossing of individual wires, where there are potential crevices. A higher amount of nickel in the surface layer has a negative effect on the corrosion resistance. In keeping with this, the range of corrosion attack and first pit detection was proportional to the amount of nickel ions released. Ti was detected only in the case of an exerted corrosion attack. This was also confirmed by the polarization resistance measurement, when the smallest polarization resistance was shown by the stent from which the most nickel was released into the environment. The best in vitro results were achieved with the combination of wire 1 and a surface finish of the final stent removing as much of the surface layer after heat treatment as possible. The results of that research provide initial results in the field of corrosion resistance of esophageal nitinol stents. It must be noted that in real life, additional factors play a role. Implanted stents are subjected to cyclic stress and exposure to a wide range of food and fluids, as well as bacterial flora. Furthermore, esophageal stents are very often provided with a covering which, among other things, reduces the exposure of the metal skeleton to gastric acid to a variable extent. For these reasons, stents may exhibit different corrosion resistance in vivo.
5. Conclusions
Our results demonstrate the effects of a combination of different input material treatment and manufacturing technology on the corrosion resistance of esophageal nitinol stents.
Significant differences in corrosion susceptibility were demonstrated between the three nitinol wires. In addition, after 6 weeks of immersion in SGF, it was found that production technology can increase or reduce the corrosion resistance further. Finishing techniques are able to reduce the impact of the quality of input materials on corrosion resistance, but the exact finishing methods of each manufacturer were not disclosed.
It was also found that an inappropriate combination of input wire and production process can lead to a significant deterioration in corrosion resistance. A stent surface that contains a larger amount of nickel on the surface after production process is much more susceptible to corrosion attack in simulated gastric fluid.
Etching appears to help improve corrosion resistance, but due to the nature of this study, it is not possible to suggest a precise treatment procedure for the stents.
Author Contributions
D.A.: Investigation, formal analysis, writing—original draft, writing—review and editing, funding acquisition; J.F.: Conceptualization, investigation, formal analysis, writing—original draft, writing—review and editing, visualization, supervision, project administration, funding acquisition; E.K.: Investigation, formal analysis; D.W.E.: Conceptualization, writing—original draft, validation, resources; H.-U.L.: Conceptualization, writing—original draft, validation, resources. All authors have read and agreed to the published version of the manuscript.
Funding
This research was funded by the Technology Agency of the Czech Republic, grant number FW03010583.
Data Availability Statement
The datasets used and analyzed during the current study are available from the corresponding author on reasonable request.
Acknowledgments
The authors would like to thank Ella-CS, MI Tech, S&G Biotech, and TaeWoong for their generous support.
Conflicts of Interest
The authors declare no conflict of interest.
References
- Provan, J.L. Use of Celestin tube for palliation of malignant oesophageal obstruction. Thorax 1969, 24, 599–602. [Google Scholar] [CrossRef][Green Version]
- Hirdes, M.M.; Vleggaar, F.P.; de Beule, M.; Siersema, P.D. In vitro evaluation of the radial and axial force of self-expanding esophageal stents. Endoscopy 2013, 45, 997–1005. [Google Scholar] [CrossRef]
- Mbah, N.; Philips, P.; Voor, M.J.; Martin, R.C.G., 2nd. Optimal radial force and size for palliation in gastroesophageal adenocarcinoma: A comparative analysis of current stent technology. Surg. Endosc. 2017, 31, 5076–5082. [Google Scholar] [CrossRef]
- Laasch, H.-U.; Milward, G.D.; Edwards, D.W. ‘Radial force’ of colonic stents: A parameter without consistency, definition or standard. Int. J. Gastrointest. Interv. 2020, 9, 99–105. [Google Scholar] [CrossRef]
- Hindy, P.; Hong, J.; Lam-Tsai, Y.; Gress, F. A comprehensive review of esophageal stents. Gastroenterol. Hepatol. 2012, 8, 526–534. [Google Scholar]
- Liang, D.H.; Hwang, E.; Meisenbach, L.M.; Kim, M.P.; Chan, E.Y.; Khaitan, P.G. Clinical outcomes following self-expanding metal stent placement for esophageal salvage. J. Thorac. Cardiovasc. Surg. 2017, 154, 1145–1150. [Google Scholar] [CrossRef]
- Stoeckel, D.; Pelton, A.; Duerig, T. Self-expanding nitinol stents: Material and design considerations. Eur. Radiol. 2004, 14, 292–301. [Google Scholar] [CrossRef]
- Kocich, R.; Szurman, I.; Kursa, M. The methods of preparation of Ti–Ni–X alloys and their forming. In Shape Memory Alloys-Processing, Characterization and Applications; IntechOpen: London, UK, 2013; pp. 28–35. [Google Scholar] [CrossRef]
- Shiva, S.; Palani, I.A.; Mishra, S.K.; Paul, C.P. Investigations on the influence of composition in the development of Ni–Ti shape memory alloy using laser based additive manufacturing. Opt. Laser Technol. 2015, 69, 44–51. [Google Scholar] [CrossRef]
- Sun, F.; Jordan, L.; Albin, V.; Lair, V.; Ringuedé, A.; Prima, F. On the High Sensitivity of Corrosion Resistance of NiTi Stents with Respect to Inclusions: An Experimental Evidence. ACS Omega 2020, 5, 3073–3079. [Google Scholar] [CrossRef]
- Kanca, M.S.; Kök, M.; Qader, I.N. Corrosion behavior and crystal-microstructural analysis of non-equiatomic NiTi shape memory alloys. J. Therm. Anal. Calorim. 2022, 147, 1–11. [Google Scholar] [CrossRef]
- Martinez, A.L.; Saugo, M.; Flamini, D.O.; Saidman, S.B. Enhancing the corrosion behavior of Ti–6Al–4V and Nitinol alloys by simple chemical oxidation in H2O2. Mater. Chem. Phys. 2023, 295, 127069. [Google Scholar] [CrossRef]
- Vojtech, D.; Joska, L.; Leitner, J. Influence of a controlled oxidation at moderate temperatures on the surface chemistry of nitinol wire. Appl. Surf. Sci. 2008, 254, 5664–5669. [Google Scholar] [CrossRef]
- Vojtěch, D.; Voděrová, M.; Kubásek, J.; Novák, P.; Šedá, P.; Michalcová, A.; Fojt, J.; Hanuš, J.; Mestek, O. Effects of short-time heat treatment and subsequent chemical surface treatment on the mechanical properties, low-cycle fatigue behavior and corrosion resistance of a Ni–Ti (50.9at.% Ni) biomedical alloy wire used for the manufacture of stents. Mater. Sci. Eng. A 2011, 528, 1864–1876. [Google Scholar] [CrossRef]
- Zhu, L.; Pelton, A.R.; Fino, J.M. Oxidation of nitinol and its effect on corrosion resistance. In Proceedings of the ASM Materials & Processes for Medical Device Conference, St. Paul, MN, USA, 25–27 August 2004; pp. 156–161. [Google Scholar]
- Ohtsu, N.; Hirano, Y.; Yamaguchi, K.; Yamasaki, K. Surface characteristics, Ni ion release, and antibacterial efficacy of anodized NiTi alloy using HNO3 electrolyte of various concentrations. Appl. Surf. Sci. 2019, 492, 785–791. [Google Scholar] [CrossRef]
- Wu, G.; Li, L.; Sun, M.; Wang, Y.; Luo, F.; Zhang, Q.; Liu, R.; Chen, Z.; Yao, J. Microstructural evolution and biological properties of PEO coating on SLM-prepared NiTi alloy. Surf. Coat. Technol. 2023, 452, 129065. [Google Scholar] [CrossRef]
- Hassel, A.W. Surface treatment of NiTi for medical applications. Minim. Invasive Ther. Allied Technol. 2004, 13, 240–247. [Google Scholar] [CrossRef]
- Dos Reis Barros, C.D.; Gomes, J.A.d.C.P. Strain induced localized corrosion of NiTi, NiTiCo and NiTiCr alloys in 0.9% NaCl. J. Mech. Behav. Biomed. Mater. 2020, 112, 104015. [Google Scholar] [CrossRef]
- Khara, H.S.; Diehl, D.L.; Gross, S.A. Esophageal stent fracture: Case report and review of the literature. World J. Gastroenterol. 2014, 20, 2715–2720. [Google Scholar] [CrossRef]
- Wiedmann, M.; Heller, F.; Zeitz, M.; Mössner, J. Fracture of a covered self-expanding antireflux stent in two patients with distal esophageal carcinoma. Endoscopy 2009, 41 (Suppl. S2), E129–E130. [Google Scholar] [CrossRef]
- Rana, S.S.; Bhasin, D.K.; Sidhu, G.S.; Rawal, P.; Nagi, B.; Singh, K. Esophageal nitinol stent dysfunction because of fracture and collapse. Endoscopy 2009, 41 (Suppl. S2), E170–E171. [Google Scholar] [CrossRef]
- Wadsworth, C.A.; East, J.E.; Hoare, J.M. Early covered-stent fracture after placement for a benign esophageal stricture. Gastrointest. Endosc. 2010, 72, 1260–1261. [Google Scholar] [CrossRef] [PubMed]
- Shokri, N.; Safavi, M.S.; Etminanfar, M.; Walsh, F.C.; Khalil-Allafi, J. Enhanced corrosion protection of NiTi orthopedic implants by highly crystalline hydroxyapatite deposited by spin coating: The importance of pre-treatment. Mater. Chem. Phys. 2021, 259, 124041. [Google Scholar] [CrossRef]
- Nagaraja, S.; Sullivan, S.J.L.; Stafford, P.R.; Lucas, A.D.; Malkin, E. Impact of nitinol stent surface processing on in-vivo nickel release and biological response. Acta Biomater. 2018, 72, 424–433. [Google Scholar] [CrossRef] [PubMed]
- Kay, L. Cyclic Potentiodynamic Survey of Medical Materials. Master’s Thesis, Purdue University Fort Wayne Campus, Fort Wayne, IN, USA, 2010. [Google Scholar]
- Carlson, T.A.; McGuire, G. Study of the X-ray photoelectron spectrum of tungsten—Tungsten oxide as a function of thickness of the surface oxide layer. J. Electron Spectrosc. Relat. Phenom. 1972, 1, 161–168. [Google Scholar] [CrossRef]
- Strohmeier, B.R. An ESCA method for determining the oxide thickness on aluminum alloys. Surf. Interface Anal. 1990, 15, 51–56. [Google Scholar] [CrossRef]
- ASTM Standard F2528-06; Standard Test Methods for Enteral Feeding Devices with a Retention Balloon. ASTM International: West Conshohocken, PA, USA, 2006.
- Pandolfino, J.E.; Richter, J.E.; Ours, T.; Guardino, J.M.; Chapman, J.; Kahrilas, P.J. Ambulatory esophageal pH monitoring using a wireless system. Am. J. Gastroenterol. 2003, 98, 740–749. [Google Scholar] [CrossRef] [PubMed]
- Washington, N.; Steele, R.J.; Wright, J.W.; Bush, D.; McIntosh, S.L.; Wilkinson, S.; Washington, C. An investigation of lower oesophageal redox potentials in gastro-oesophageal reflux patients and healthy volunteers. Physiol. Meas. 1997, 18, 363–371. [Google Scholar] [CrossRef]
- Kaltsidis, H.; Mansoor, W.; Park, J.H.; Song, H.Y.; Edwards, D.W.; Laasch, H.U. Oesophageal stenting: Status quo and future challenges. Br. J. Radiol. 2018, 91, 20170935. [Google Scholar] [CrossRef]
- De Almeida, B.; Elias, C. Influence of heat treatment on color and flexibility of nickel-titanium endodontic instruments. RGO Rev. Gaúcha Odontol. 2020, 68, e20200044. [Google Scholar] [CrossRef]
- Furukawa Techno Material Co., Ltd. Ni-Ti Tubes for Medical Devices. Available online: https://www.furukawa-ftm.com/tokusyu/english/wp-content/themes/furukawa/assets/pdf/Ni-Ti_tube.pdf (accessed on 15 May 2023).
- Fort Wayne Metals. Nitinol. Available online: https://www.fwmetals.com/materials/nitinol/ (accessed on 15 May 2023).
- Patel, M.M.; Gordon, R.F. An investigation of diverse surface finishes on fatigue properties of superelastic Nitinol wire. In Proceedings of the International Conference on Shape Memory and Superelastic Technologies, SMST-2006, Pacific Grove, CA, USA, 7–11 May 2006; pp. 7–11. [Google Scholar]
- PEIERTECH. Nitinol Round Wires Lingual Arch Wire NiTi Wire for Orthodontic. Available online: https://www.peiertech.cn/Nitinol-Round-Wires-Lingual-Arch-Wire-NiTi-Wire-for-Orthodontic-pd48474233.html (accessed on 15 May 2023).
- Vojtěch, D.; Fojt, J.; Joska, L.; Novák, P. Surface treatment of NiTi shape memory alloy and its influence on corrosion behavior. Surf. Coat. Technol. 2010, 204, 3895–3901. [Google Scholar] [CrossRef]
- Ding, R.; Shang, J.-X.; Wang, F.-H.; Chen, Y. Electrochemical Pourbaix diagrams of NiTi alloys from first-principles calculations and experimental aqueous states. Comput. Mater. Sci. 2018, 143, 431–438. [Google Scholar] [CrossRef]
- Clarke, B.; Carroll, W.; Rochev, Y.; Hynes, M.; Bradley, D.; Plumley, D. Influence of Nitinol wire surface treatment on oxide thickness and composition and its subsequent effect on corrosion resistance and nickel ion release. J. Biomed. Mater. Res. Part A 2006, 79A, 61–70. [Google Scholar] [CrossRef] [PubMed]
- Ogawa, T.; Yokozawa, E.; Oda, T.; Maruoka, K.; Sakai, J.i. Hydrogen embrittlement behavior of Ni-Ti shape memory alloy with different microstructures in acidic fluoride solution. Int. J. Mech. Mater. Eng. 2015, 10, 12. [Google Scholar] [CrossRef]
- Volenec, K.; Pohl, I. The challenges: Stent materials from the perspective of the manufacturer. Gastrointest. Interv. 2016, 5, 98–104. [Google Scholar] [CrossRef]


Disclaimer/Publisher’s Note: The statements, opinions and data contained in all publications are solely those of the individual author(s) and contributor(s) and not of MDPI and/or the editor(s). MDPI and/or the editor(s) disclaim responsibility for any injury to people or property resulting from any ideas, methods, instructions or products referred to in the content. |
© 2023 by the authors. Licensee MDPI, Basel, Switzerland. This article is an open access article distributed under the terms and conditions of the Creative Commons Attribution (CC BY) license (https://creativecommons.org/licenses/by/4.0/).