Article

Influence of UV Illumination on the Corrosion Behavior of New 3Ni Weathering Steel in Marine Atmospheric Environments

1
Collaborative Innovation Center of Steel Technology, University of Science and Technology Beijing, Beijing 100083, China
2
State Key Laboratory of Metal Material for Marine Equipment and Application, Anshan 114009, China
*
Author to whom correspondence should be addressed.
Metals 2023, 13(9), 1543; https://doi.org/10.3390/met13091543
Submission received: 26 July 2023 / Revised: 6 August 2023 / Accepted: 14 August 2023 / Published: 1 September 2023
(This article belongs to the Topic Materials for Corrosion Protection)

Abstract

:
We investigate the effect of pure darkness and UV illumination on the corrosion process of 3Ni weathering steels involved in both marine atmospheric environments. The corrosion behavior of 3Ni steel in both environments was assessed by cyclic acceleration experiments, electrochemical measurements, morphological analysis and physical phase analysis. The results show that UV illumination affects the corrosion process through the photovoltaic effect of the corrosion products, with photoelectrons and photo-vacancies participating in the redox reaction between the substrate and the atmospheric environment, thereby affecting the corrosion rate of 3Ni steel, the physical composition of the corrosion products and the denseness of the rust layer.

1. Introduction

Atmospheric corrosion is the corrosion of metals that occurs in the natural atmospheric environment, such as bridges, cars, ships and other metal buildings constantly exposed to the corrosion of the atmospheric environment [1,2]. The nature of the atmospheric environment, the state of the rust layer and the metal material itself all influence the corrosion process and corrosion rate of metal materials [3,4,5]. A large number of pitting failures occur in bridges, ships and other metal structures in the harsh ocean environment with high humidity and high Cl concentrations; thus, much research has been carried out to explore the effects of temperature, humidity, corrosive media and the corrosion of metal materials [6,7,8,9,10].
UV illumination is also an important element affecting the corrosion of metallic materials. In the marine atmospheric environment, metallic materials receive direct exposure to UV illumination very frequently. While UV illumination reduces the humidity of the air, which greatly alters the atmospheric environment of metallic materials. Moreover, the β-FeooH, γ-FeooH, Fe2O3, CuO [11] and other metal oxides in the metal rust layer have semiconductor properties that produce photovoltaic effects. Under the conditions of UV illumination, the entry of photogenerated electrons puts the electrons in the valence band (VB) of the corrosion products in an excited state and leap into the conduction band (CB), producing photogenerated holes, which can participate in oxidation reactions and photoelectrons in reduction reactions [12]; thus, they also play an important role in the process of corrosion. However, there is less research on UV illumination and no clear mechanism to elucidate the role of UV light in the corrosion process.
Jiang et al. [13] explored the semiconductor nature of the corrosion products using photovoltammetric curves, and they found that there was a significant photoelectrochemical effect on the corrosion products. Song et al. [12] studied the effect of UV illumination on the corrosion of 09CuPCrNi weathering steel in the presence of NaCl. They found that UV illumination affects the rate of atmospheric corrosion, the formation of corrosion products and their properties; furthermore, a photovoltaic effect results on corrosion products with semiconductor properties, accelerating the corrosion of weathering steel. Guo et al. [14]. simulated the corrosion behavior of 316 stainless steel under UV illumination in a salt lake atmospheric environment and found that UV illumination changed the relative amount of corrosion products and inhibited the corrosion rate of 316 stainless steel. A study by Wu et al. [15] on the corrosion process of nickel-containing weathering steel in the marine atmosphere showed that nanoscale NiFe2O4 was significantly enriched in the inner rust layer, resisting chloride ions and increasing the corrosion potential of the material in the marine atmosphere. UV illumination causes a photovoltaic effect that accelerates the corrosion process of metallic materials, as shown in the study by Li et al. [16] on the atmospheric corrosion process of NaCl-induced pure copper using photoelectrochemical methods, the study by Song et al. [17] on NaCl-induced atmospheric corrosion of pure zinc, and the study by Lin et al. [18] on the accelerated atmospheric corrosion of Ag showed.
Although the presence or absence of UV illumination impacts on the corrosion process is discussed in some papers, the mechanism of the influence of UV illumination on the corrosion process in atmospheric conditions in practice needs to be further clarified. This paper presents a qualitative study of the processes involved in the corrosion of a new 3Ni steel in two marine atmospheric environments, pure darkness and with UV illumination. Scanning electron microscopy (SEM), X-ray energy spectrometry (EDS), X-ray diffractometry (XRD), Raman spectroscopy (Roman) and electrochemical testing were used to characterise the corrosion process and corrosion products from laboratory darkness and UV illumination accelerated cyclic corrosion experiments. The new 3Ni weathering steel adopts the design concept of ultra-low carbon and 3 wt.% Ni + 2 wt.% Mo, which is suitable for bridges in harsh marine environments, such as high temperature, high humidity and high Cl concentration. The 3 wt.% Ni content refines the grain of the internal rust layer and improves its denseness; Ni exists in the rust layer in the form of Ni2+ compounds, taking the place of Fe2+ and forming a NiFe2O4 structure with cation selectivity, which makes the rust layer resistant to Cl invasion [19]. A small proportion of Mo improves the corrosion resistance of the steel and reduces the ageing brittleness of Cu. The +6 valence molybdate acts as a corrosion inhibitor and also promotes the formation of amorphous oxide films [20]. By comparing the involvement of UV illumination in the corrosion process of 3Ni weathering steel with and without UV illumination, this work provides some reference for the atmospheric corrosion behavior and mechanism of this weathering steel.

2. Materials and Methods

2.1. Experimental Materials

The experimental steel is a new 3Ni weathering steel with the elemental composition shown in Table 1.

2.2. Accelerated Cycle Corrosion

A 30 × 20 × 1 mm corrosion sample of the new 3Ni weathering steel was made, using three parallel samples to reduce the error. In addition, a 10 × 10 × 3 mm sample was made and was used for morphological observation. After preparation, the length, width and thickness of the corrosion samples were measured using vernier calipers and recorded, and the initial mass was measured using a balance with an accuracy of 0.0001 g and recorded for subsequent corrosion rate calculations.
After the preparation work was completed, the sample was placed in the corrosion salt spray tester (Teamsoul Inc., Dongguan, China) and UV weathering chamber (Teamsoul Inc., Dongguan, China). The corrosion test salt spray machine was set in a dark environment for a 12 h cycle. This was carried out for 48, 96, 192 and 384 h, with test temperature of 40 °C and test humidity of 80 RH. An accelerated cycle of experimental solution of 3.5 wt.% NaCl solution was used, using a pipette gun to apply a 40 mL/cm2 of standard injection solution to the surface of the specimen. The UV weathering test chamber was set with an 8 h UV illumination + 4 h dark environment as a cycle. This was carried out for 48, 96, 192 and 384 h, with a UV light wavelength range of 220 to 300 nm, 90% of the energy concentrated at 253.7 nm and light intensity of 1 W·m−2. The test temperature was 40 °C, dark environment test temperature was 40 °C, test humidity was 80 RH, the solution used was 3.5 wt.% NaCl solution and a pipette gun was used to inject a standard solution at 40 mL/cm2 onto the surface of the specimen. After one CCT cycle, the specimens were removed, rinsed using deionised water and alcohol, dried and reinjected with the solution. After each stage was completed, the samples were removed and, after cleaning and drying, the corrosion products were first scraped off the surface of the specimens for mechanical descaling. This involved a descaling solution (500 mL HCl + 3.5 g hexamethyltetramine + 950 mL deionised water), supersaturated NaHCO3 solution, deionised water and alcohol for chemical descaling, followed by drying and calculating the corrosion weight loss. The corrosion rate V (g/m2) and the annual corrosion volume R (mm/y) were calculated as follows:
V = m 0 m 1 S
and
R = C m 0 m 1 ρ S t ,
where V is the corrosion rate, g/m2; R is the average annual corrosion thinning, mm/y; m0 and m1 are the mass of specimens before corrosion and the resulting mass of rust, respectively, g; S is the effective corrosion area, cm2; C is the constant factor, 8.76 × 10⁴; ρ is the density of steel, 7.85 g/cm3; t is the corrosion time, h.

2.3. Electrochemical Testing

Electrochemistry was carried out using the three-electrode system of the VersaSTAT3 workstation (Ametek Trading Co., Shanghai, China). In this system, a saturated calomel electrode was used as the reference electrode, a platinum electrode as the auxiliary electrode, platinum electrode as the auxiliary electrode and a rusted steel sample with an exposed area of 1 cm2 as the working electrode. The new 3Ni weathering steel was made into a 10 × 10 × 3 mm electrochemical specimen, which was cold mounted using epoxy resin. The test time of open circuit potential (OCP) was 3600 s. The scanning rate of polarization curve(PD) was 0.167 mV/s, and the scanning potential range was −0.9~0.5 V, the frequency range of the electrochemical impedance spectrum was 10−2–10−5 Hz, and the impedance spectrum was measured twice to ensure the reliability of the results. The specimens were first ground from 240 # to 2000 # using metallographic sandpaper. The electrochemical measurements were divided into bare steel and rusted test steel. The rusted test steel was placed in the test steel together with the specimens for accelerated cyclic corrosion and left for 48, 96, 192 and 384 h before being removed, cleaned and dried and finally tested electrochemically. The potential range of the Mott–Schottky (M–S) curves was −1 V~0 V at 1000 Hz and the AC voltage amplitude was 10 mV.

2.4. Corrosion Product Mineral Analysis

The cross section of the rust layer was analysed by scanning electron microscopy and energy spectroscopy (ZEISS ULTRA 55, Carl Zeiss AG, Oberkochen, German). A 20 × 1 mm interface was exposed and the remainder of the specimen was surrounded by epoxy, then sanded from 240 # to 2000 #, using metallographic sandpaper, polished and carbon blasted; after which, the cross section was observed using a Gemini SEM500 at an accelerating voltage of 15 kV, and the surface and point distributions of the elements were observed.
The corrosion product was ground into a powder and then examined for its physical composition using an X-ray diffractometer (D8 Advance, Bruker Corporation, Rheinstetten, German). The test was carried out using a step scan with an angle of 10–90°, a step size of 0.02 and an interval time of 0.6 s.
The elemental composition of the corrosion products was confirmed by X-ray photoelectron spectroscopy (K-Alpha, Thermo Fisher Scientific Inc, Shanghai, China), with the test current set at 2 μA. The measured binding energy was corrected using the standard C 1s peak (binding energy of 284.6 eV), and the data were fitted and analysed.
The physical composition of the rust layer was further confirmed by microscopic Raman spectroscopy (WiTECH R300, Oxford Instruments Inc., Oxford, UK) with an output power range of 0.5~1 mW, a spectral acquisition time of 45 s and a displacement range of 0 to 1800 cm−1, and then the data were fitted.

3. Result

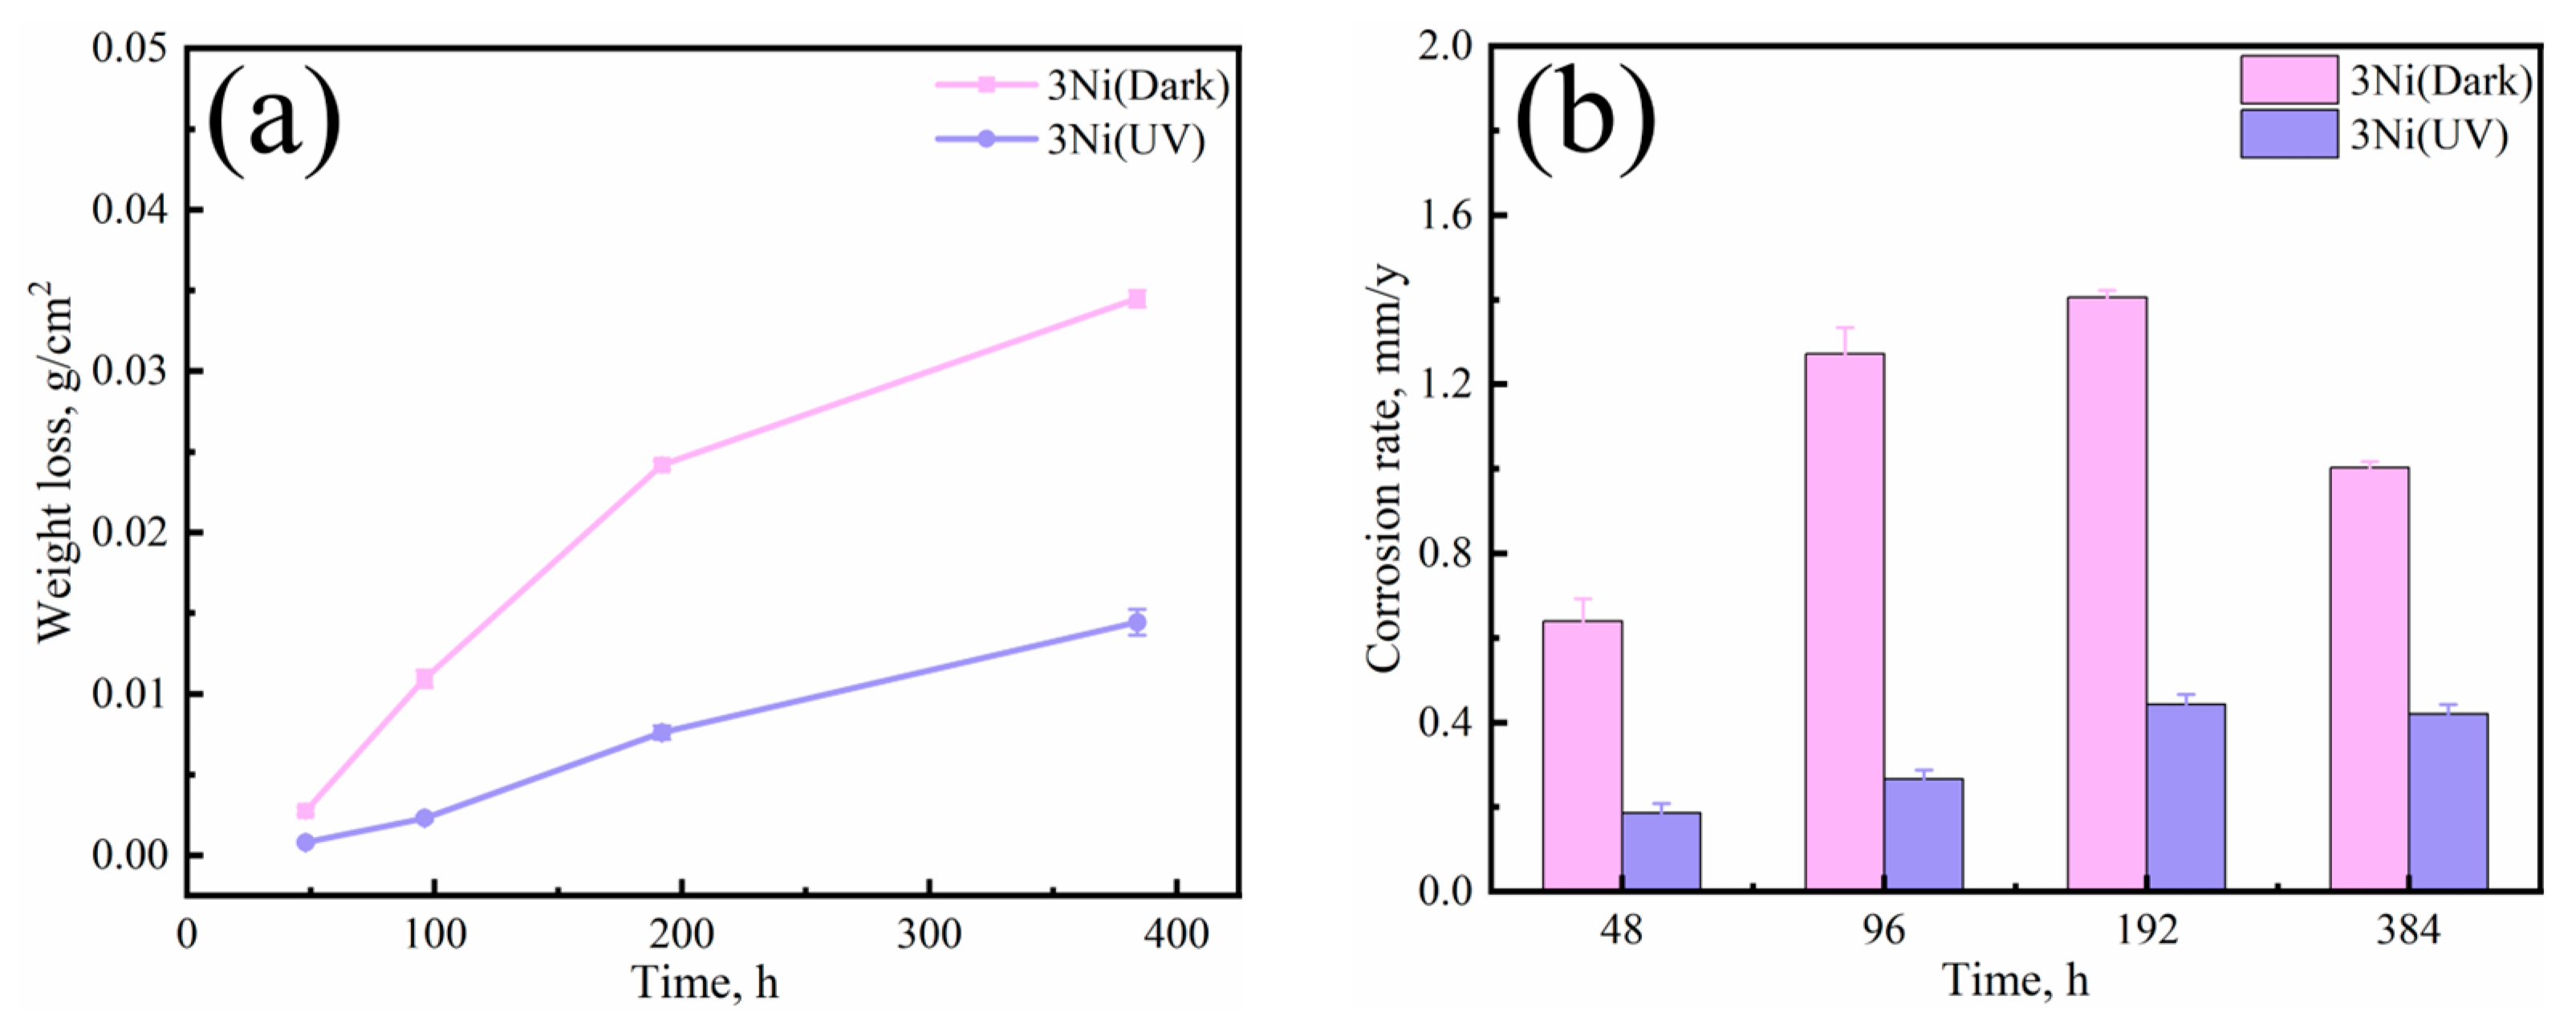
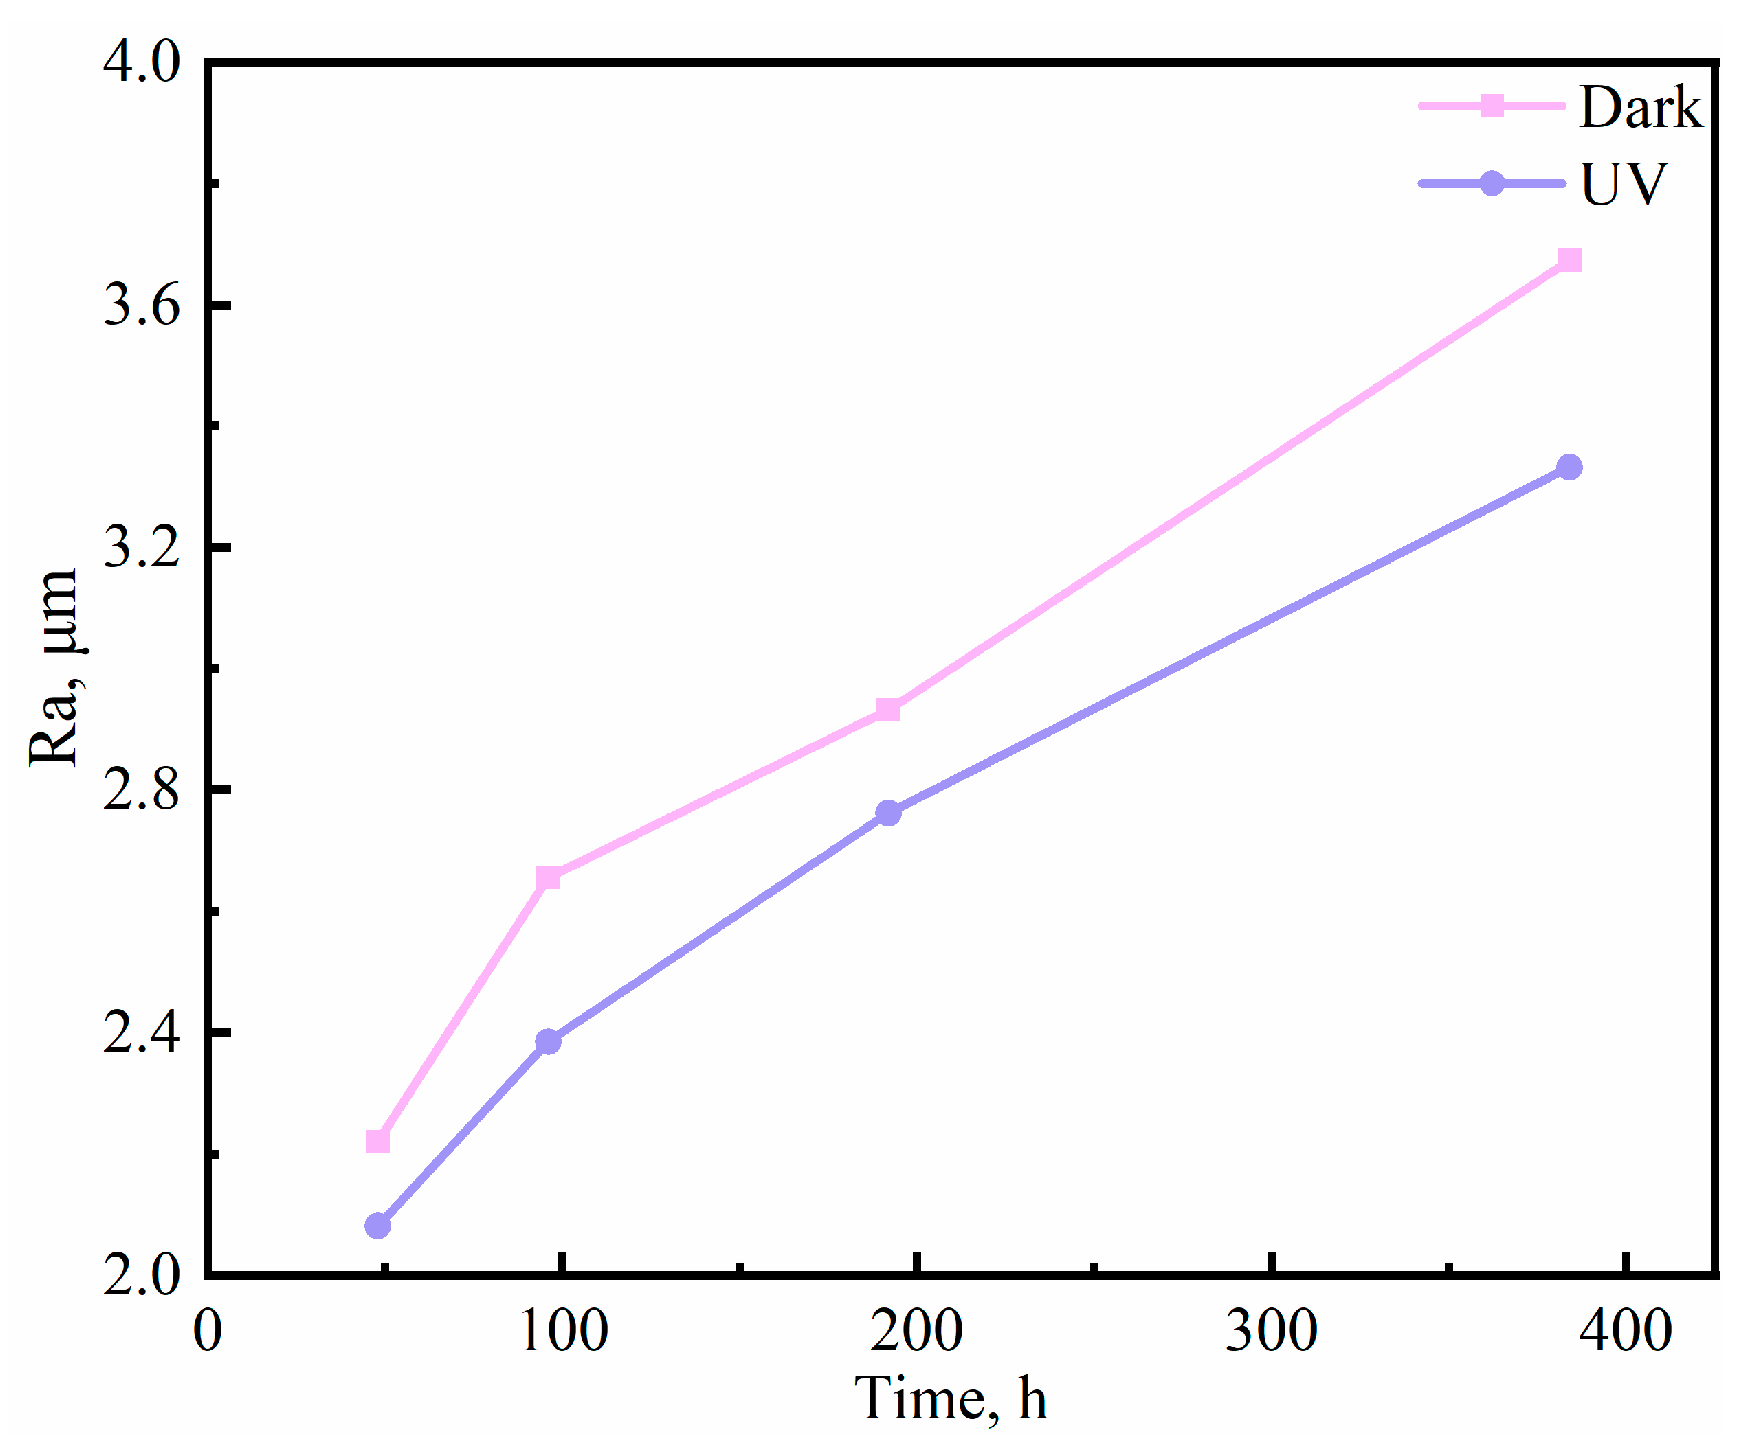
3.1. Corrosion Kinetics

Figure 1a shows the microstructure of the new 3Ni weathering steel. It can be seen that the 3Ni steel is dominated by granular bainite and a small amount of M/A islands of mixed tissue with fine and homogenous grains. Figure 1(b1,b2) and Figure 1(c1,c2) show the macroscopic morphology after 96 h and 384 h under two environments, respectively. At the beginning of corrosion, corrosion products are unevenly present on the surface of the specimen, which is caused by contaminants or surface defects on the surface of the specimen. When the cycle test is carried out to 384 h, the corrosion products are uniformly distributed on the surface of the specimen, and the surface is completely covered by corrosion products. Comparing the two environments, under darkness and illumination, there is a lower corrosion rate in the illuminated environment, the corrosion product is more fine and average, and the densification of the rust layer is improved. Figure 1d,e show the descaling microscopic morphology of 3Ni steel after 384 h in both environments. The corrosion morphology in the dark environment is uneven, with a large number of corrosion pits of uneven size, forming a fine, sharp flake layer. In contrast, the corrosion morphology in the illuminated environment includes a large corrosion pit surrounded by small corrosion pits, and the corrosion pit morphology is also a fine, sharp flake layer, which is also finer and more well-distributed than that of the dark environment specimen.
Figure 2 illustrates the corrosion weight loss and corrosion rate of two samples of steel in the dark and ultraviolet-illuminated environments. In Figure 2a, the corrosion weight loss graph can be seen, with the two samples of steel showing initial corrosion acceleration, followed by corrosion deceleration, and the corrosion weight loss in the illuminated environment is about half of the dark environment. In Figure 2b, the corrosion rate also first increases, followed by decreasing, and the 3Ni steel corrosion rate is also less in the ultraviolet-illuminated environment. The lowest, protective rust layer formed quickly; thus, the cost of achieving a stable rust layer is low.

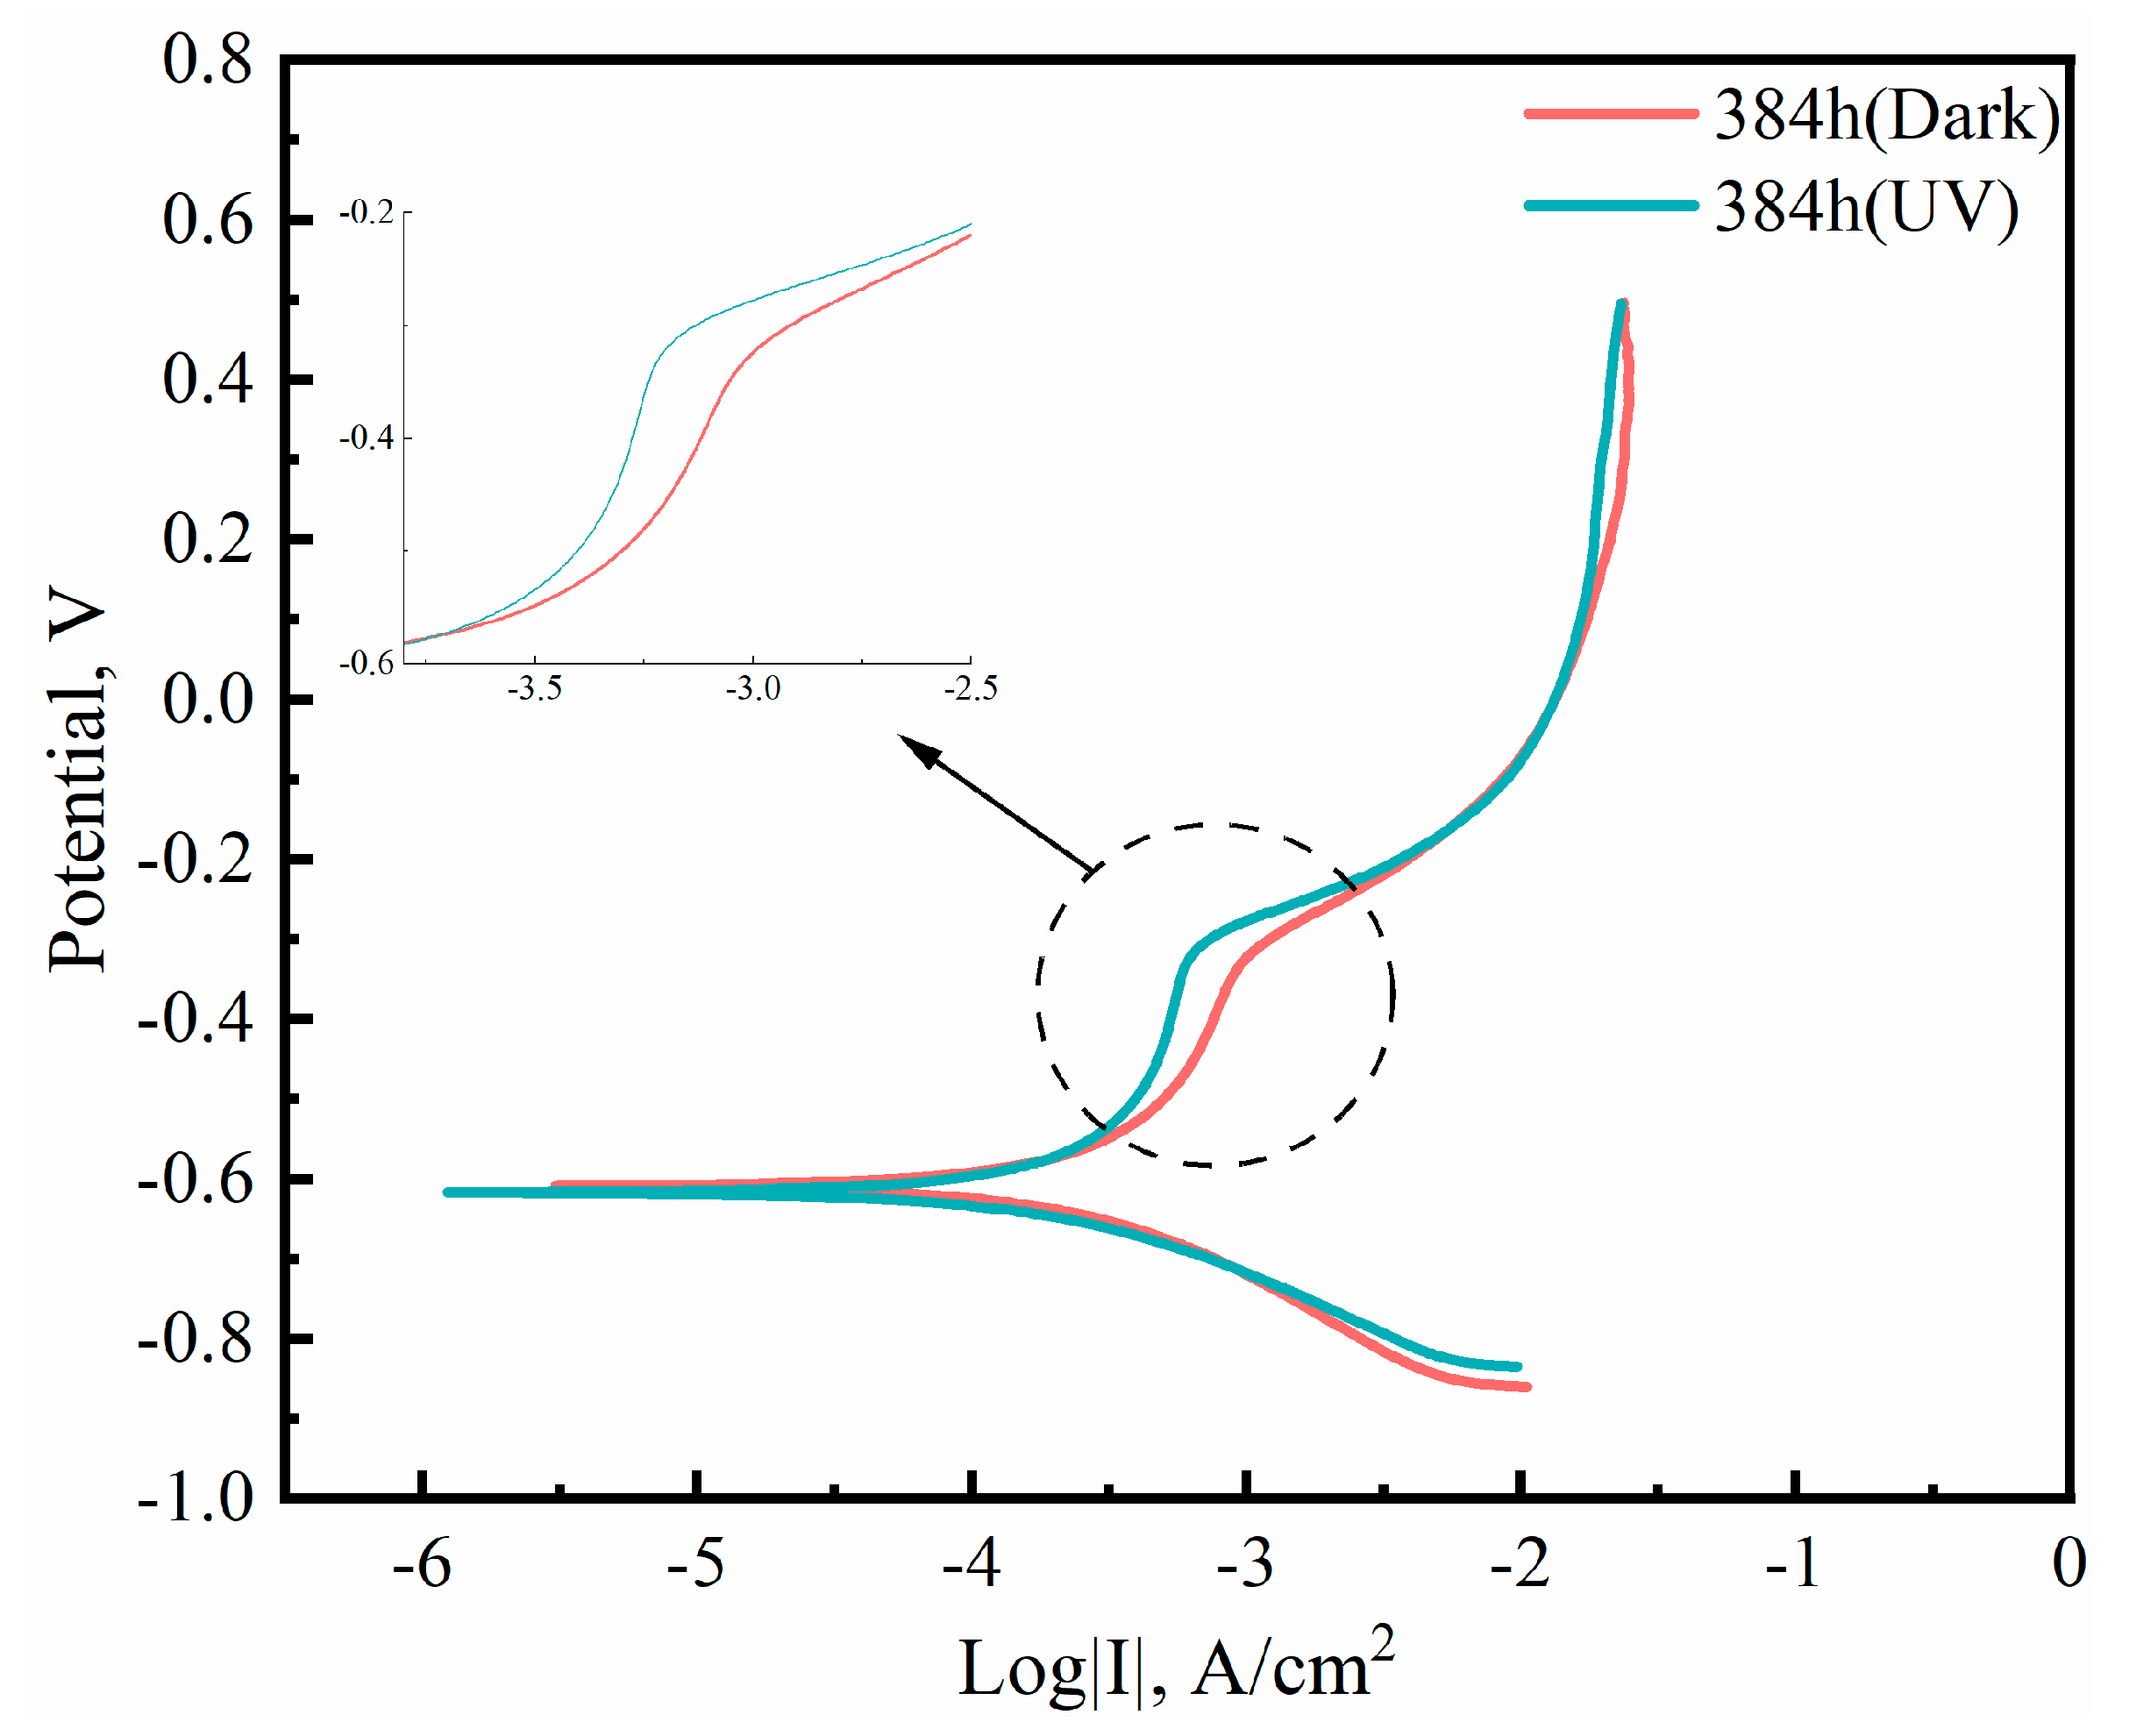
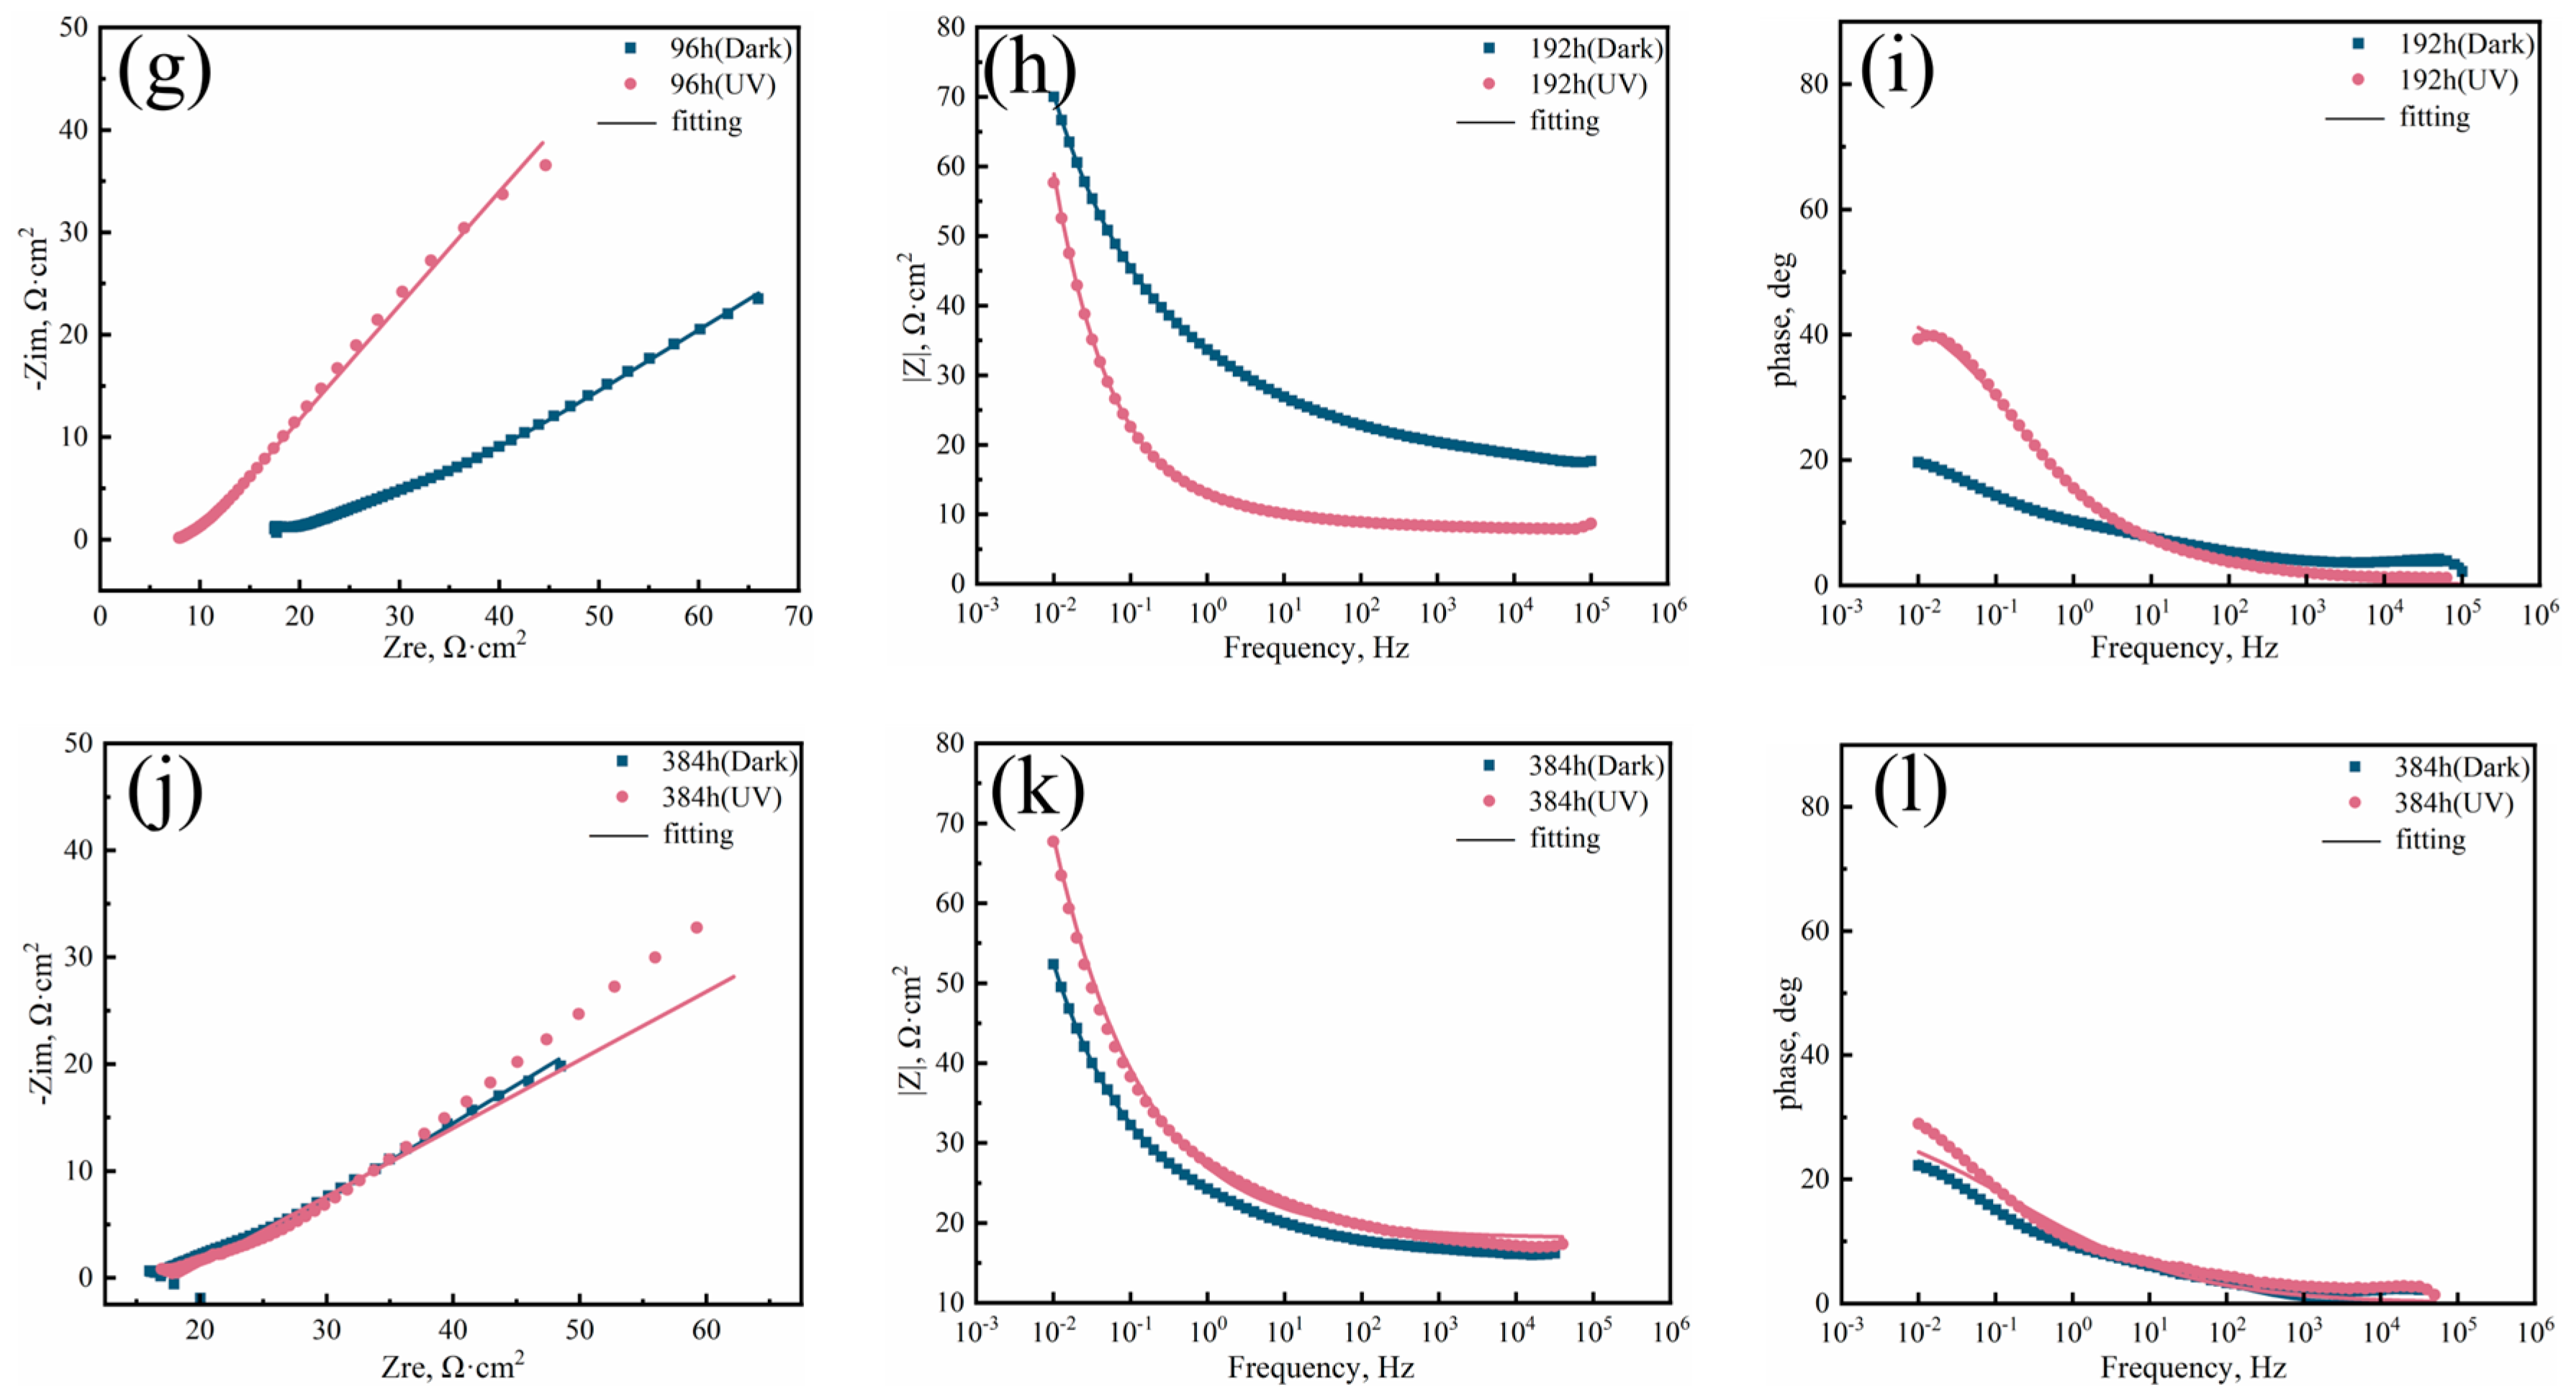
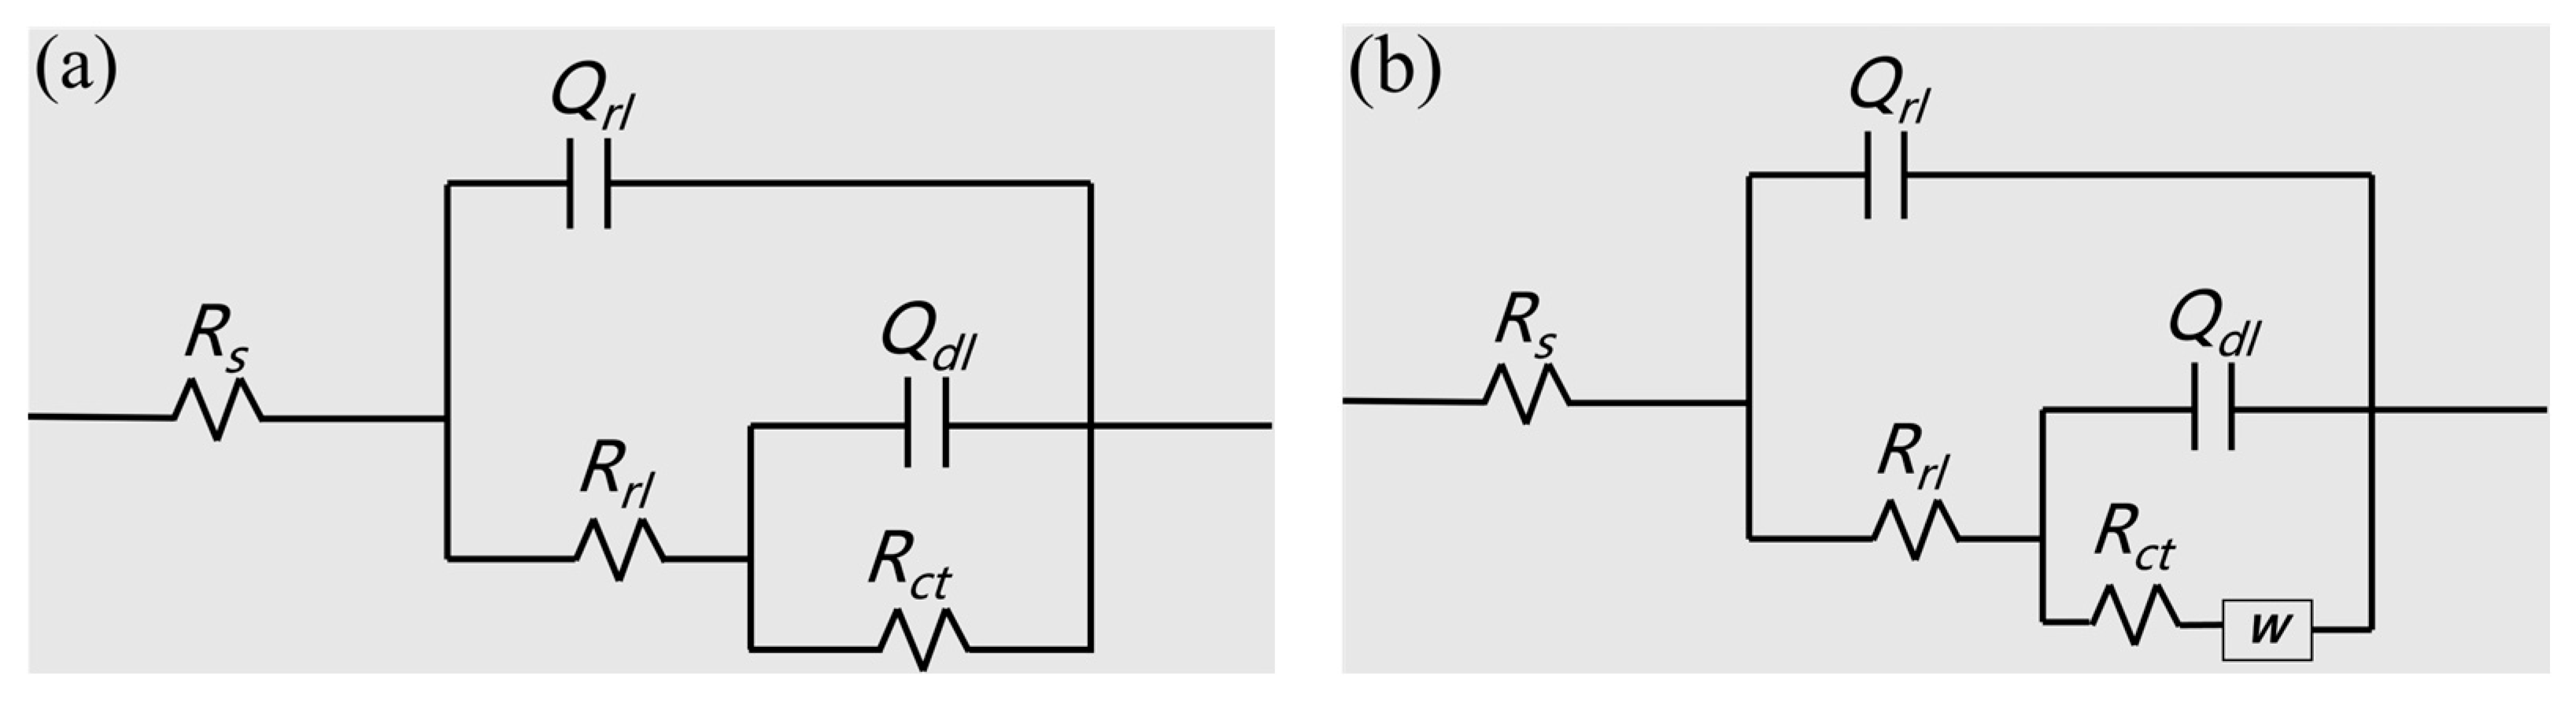
3.2. Electrochemical Testing

Figure 3 shows the dynamic potential polarization curves after 384 h cycles of corrosion in dark and illuminated environments. The cathodic Tafel curves in both environments are almost identical, and the anodic Tafel curves in both environments are almost identical in shape. The corrosion potential at 384 h (UV) was negatively shifted and the self-corrosion current density was reduced due to severe anodic polarization; it can be seen that cathodic protection has occurred, while the experimental steel in the anodic region in both environments undergoes an obvious pseudopassivation phenomenon. However, the semi-passivation of the experimental steel was more obvious in the illuminated environment and the process of anodic dissolution at the beginning of corrosion was inhibited [21]. The structural analysis of the rust layer shows that the enrichment of Ni, Mo and other alloying elements and the dense rust layer are the main reasons for the pseudopassivation.
The electrical properties of the corrosion product layer were investigated by measuring the capacitance as a function of the applied potential. In this paper, the electrical properties and carrier density of the corrosion products of 3Ni steel after 384 h exposure in both dark and illuminated participation environments are analyzed by means of Mott–Schottky relations. Figure 4 shows the positive slope portion of the Mott–Schottky plot obtained for the rusted sample in a 3.5% NaCl solution at 1000 Hz, indicating that the corrosion product layer has electrical properties similar to those of an n-type semiconductor.
The Mott–Schottky relationship [9,22,23] describes the relationship between the differential capacitance of the space charge layer of a semiconductor and the potential of the semiconductor surface with respect to the body, as communicated below:
1 C 2 = 2 E E f b k T e e ε ε 0 N D ,
where C is the capacitance of the space charge layer in the semiconductor; ND is the carrier density; E is the applied potential; Efb is the flat-band potential; k is the Boltzmann constant; T is the temperature; e is the elemental charge; ε is the relative permittivity of the semiconductor and ε0 is the permittivity of free space.
The carrier density ND can be calculated from the slope of the Mott–Schottky plot Figure 4 and the metric (3). The ND of corrosion products after 384 h exposure in a dark environment is 4.71 × 1022 cm−3, while the ND value of corrosion products in the UV-illuminated environment is 5.17 × 1023 cm−3, which shows that the conductivity of corrosion products in the illumined environment is much higher than than the conductivity of corrosion products in the dark environment.
The involvement of UV illumination in the environment increases the conductivity of the corrosion products and thus, the carrier density, mainly because of the redox reaction of photoelectrons with γ-FeOOH. According to Stratman et al. [24], the reaction, during which OH occupies an O-site, transforms γ-FeOOH into γ-Fe-OH-OH with the same crystal structure, but from an electron semiconductor to an electron conductor.
γ-FeOOH with semiconductor properties excites electrons from the valence band (VB) to the conduction band (CB) through the photovoltaic effect, thereby leaving holes in the conduction band. Photogenerated electrons are easily trapped by γ-FeOOH, which changes the state of the corrosion product, increases the electron mobility of the corrosion product and increases the carrier density of the corrosion product layer.
In Figure 5, the different symbols are the actual measured data points and the solid line is the result after fitting through the equivalent circuit. According to the fitting of the two equivalent circuits, the electron transfer behavior and corrosion process of the analyzed 3Ni weathering steel in 3.5% NaCl solution can be explained more clearly.
There are two sets of double capacitance structures between the rusted experimental steel and the test solution. The capacitive arc in the high frequency region reflects the double capacitance structure of the rust layer and the electrolyte solution [25]; the capacitive arc in the low and medium frequency region reflects the charging and discharging behavior of the double capacitance at the interface between the electrolyte solution and the substrate entering the surface of the experimental steel [25,26].
The Nyquist plots in Figure 5a,d,g,j show that the capacitive arcs in the low frequency region of the rusted samples with illumination are all stronger than those of the rusted samples in the dark environment. In the early stages of corrosion, an equivalent circuit Figure 6a was fitted, i.e., an internal double capacitance consisting of the capacitance of the entire rust layer of Qrl and the resistance of the electrolyte solution of Rrl, and there was already an external double capacitance consisting of the capacitance of the double layer of Qdl and the charge transfer resistance of Rct. After fitting, the capacitive arc radii of the rusted samples with UV illumination are all greater in the low and medium frequency regions than the rusted samples in the dark environment, which shows that the rusted samples with UV exposure have a higher conductivity and better corrosion resistance, forming a more stable, dense rust layer. The impedance spectra of the rusted samples in the dark and light environments during the later stages of corrosion exhibit semi-infinite diffusion in the low frequency region; thus, the equivalent circuit, Figure 6b, was fitted using an external double capacitor to add a Warburg impedance. After fitting, the rust layer of the rusted samples under visible illumination also had a larger radius of capacitive arc resistance and showed better corrosion resistance.
The modal values in the low frequency region from the Figure 5b,e,h,k Bode-|Z| plot represent the polarization resistance, which to some extent reflects the magnitude of corrosion resistance. In the later stages of corrosion, the UV-illuminated rusted samples have greater polarization resistance in the low frequency region and show better corrosion resistance. The peak phase angle of the Figure 5c,f,i,l Bode-phase plot also correlates with corrosion resistance, and it can be seen that the peak of the UV-illuminated rusted samples is the largest and the corrosion resistance is better.
Through the results of the EIS fit in Table 2, we can see that the corrosion resistance of the corroded rust layer in the UV-illuminated environment is greater than that of the corroded rust layer formed in the dark environment for the same exposure time, indicating that the conductivity of the corroded rust layer in the illuminated environment is greater than that of the corroded rust layer in the dark environment. The Rct values for the UV-illuminated rusted samples were greater than the Rct values for the rusted samples in the dark environment, indicating that the corrosion reaction at the steel-rust interface was suppressed in the UV-illuminated samples. The n1 value of the rusted samples in the UV-illuminated environment is greater than the n1 value of the rusted samples in the dark environment, indicating that the dispersion effect is attenuated to some extent by UV illumination. n1 values represent the characteristics of the dispersion effect, caused by the uneven current density on the electrode surface. Hence, the n1 value is higher.

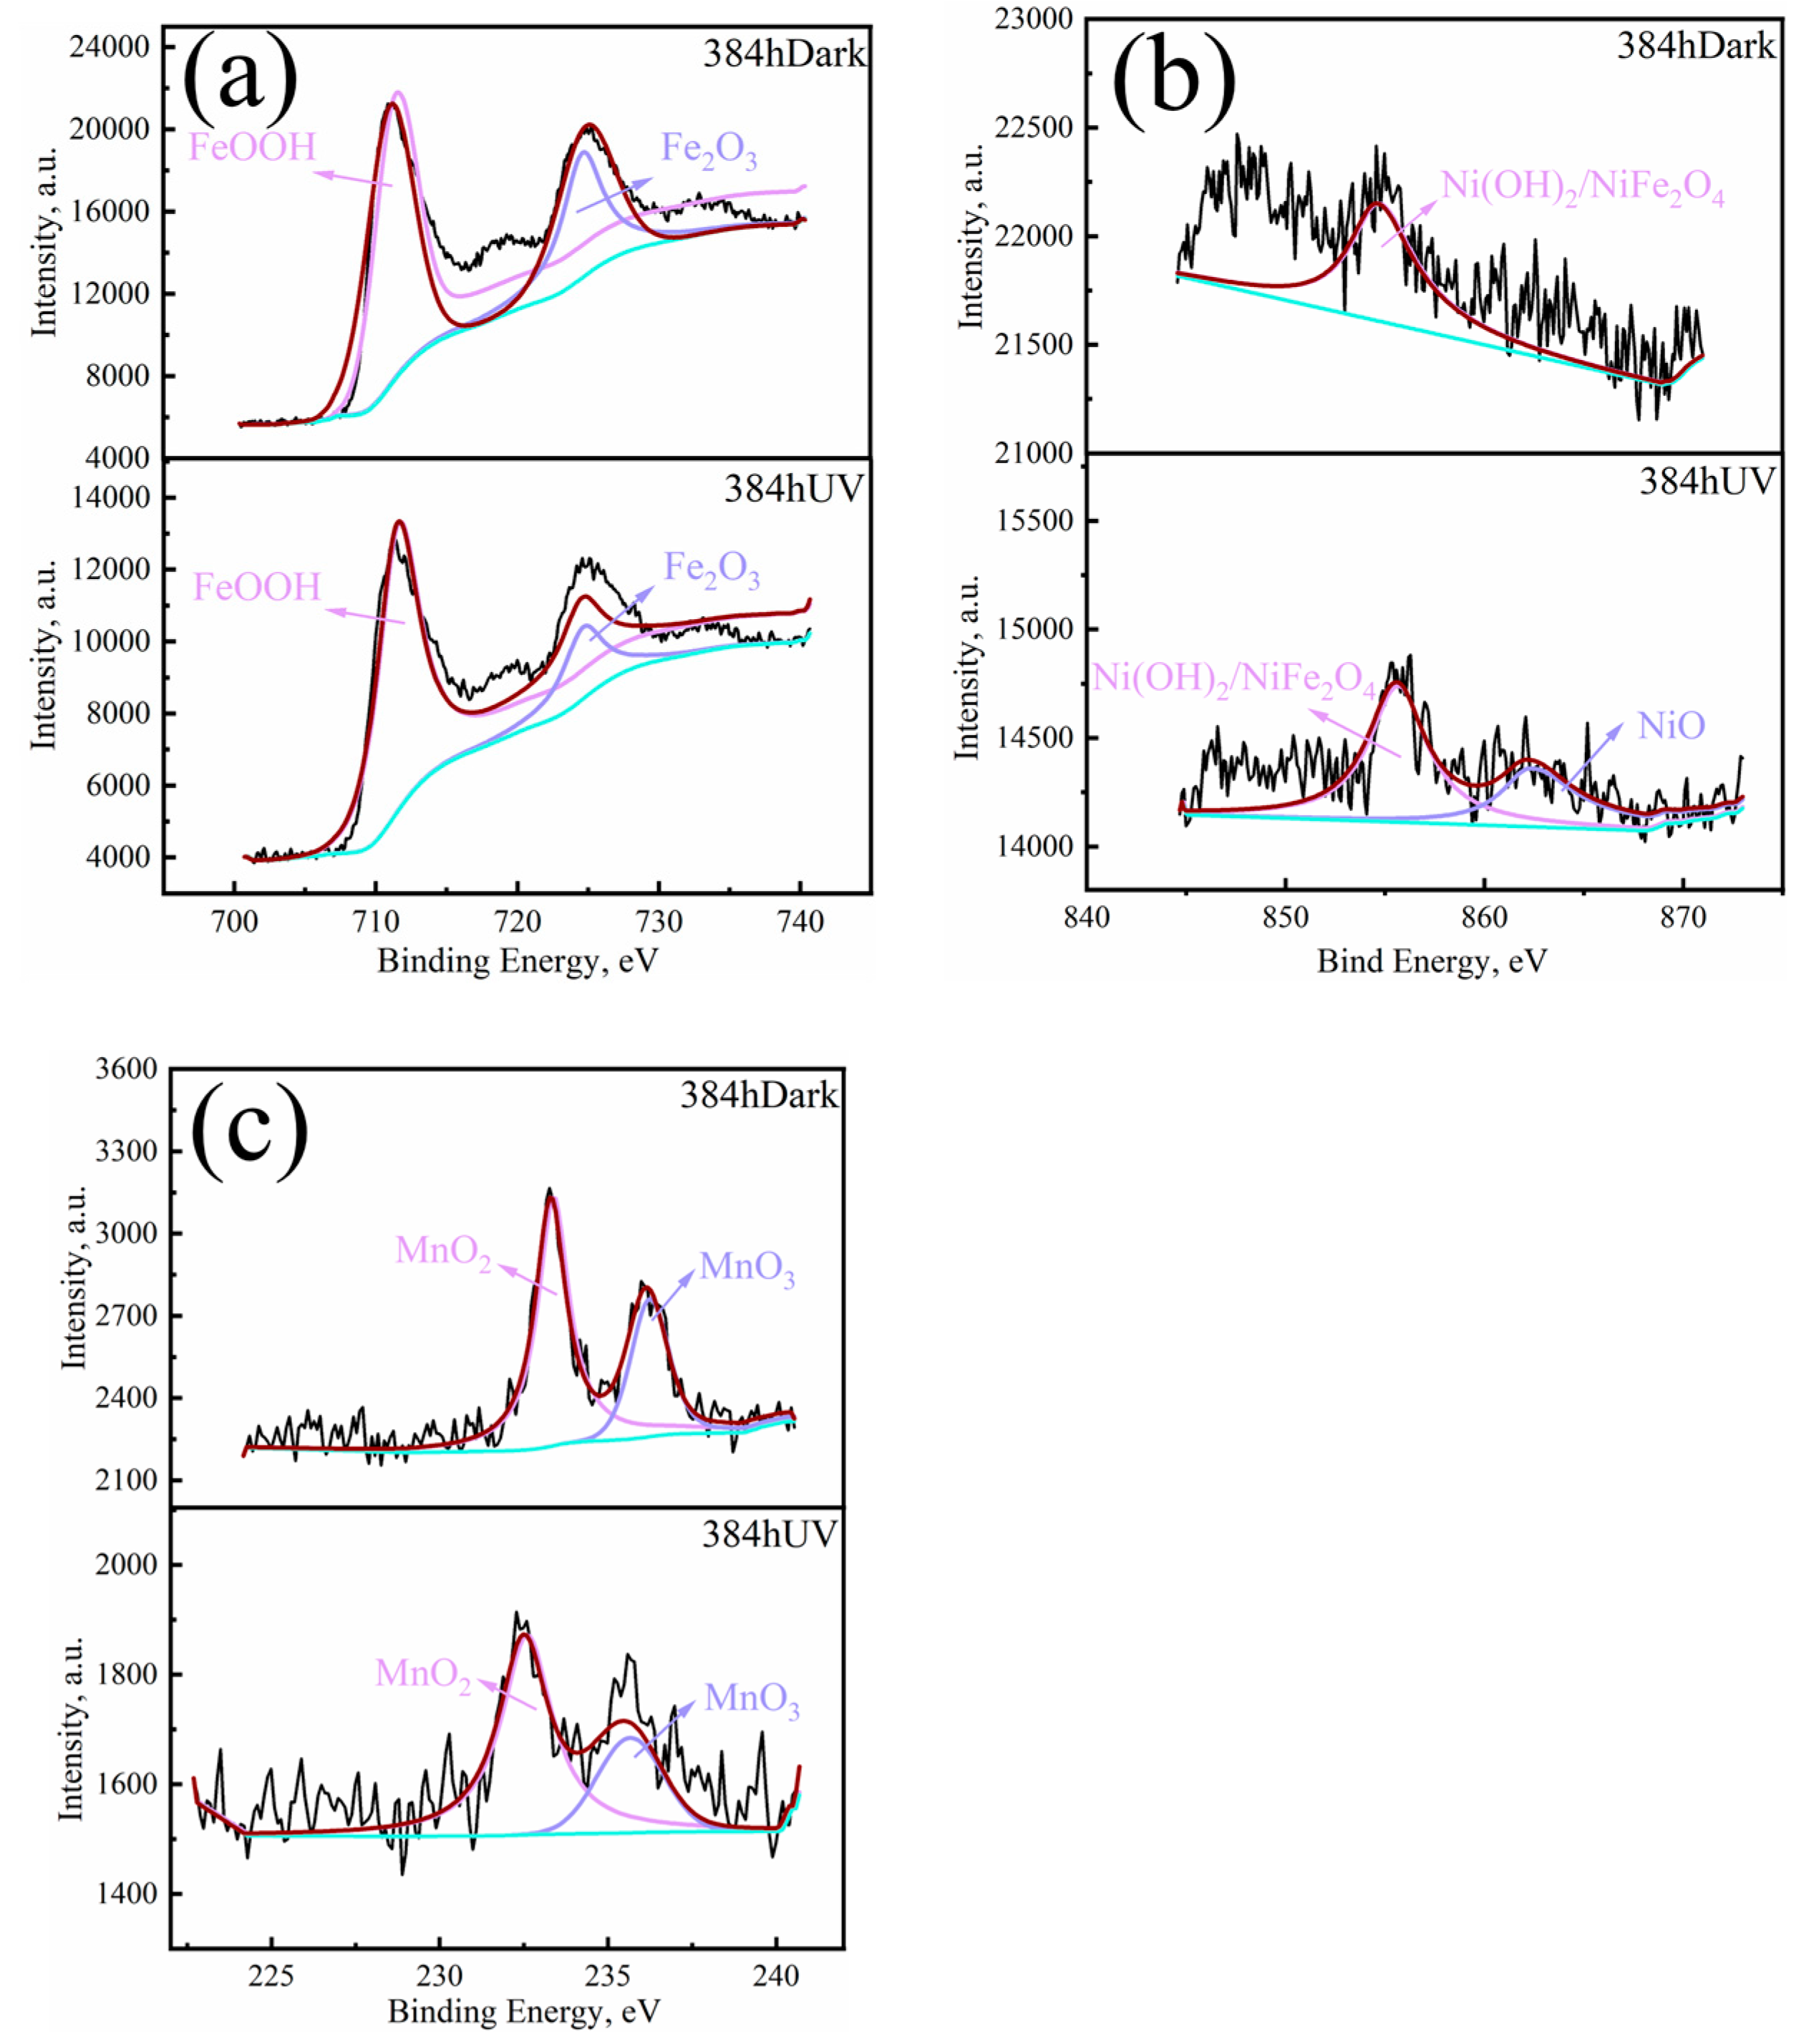
3.3. Composition of the Material Phase
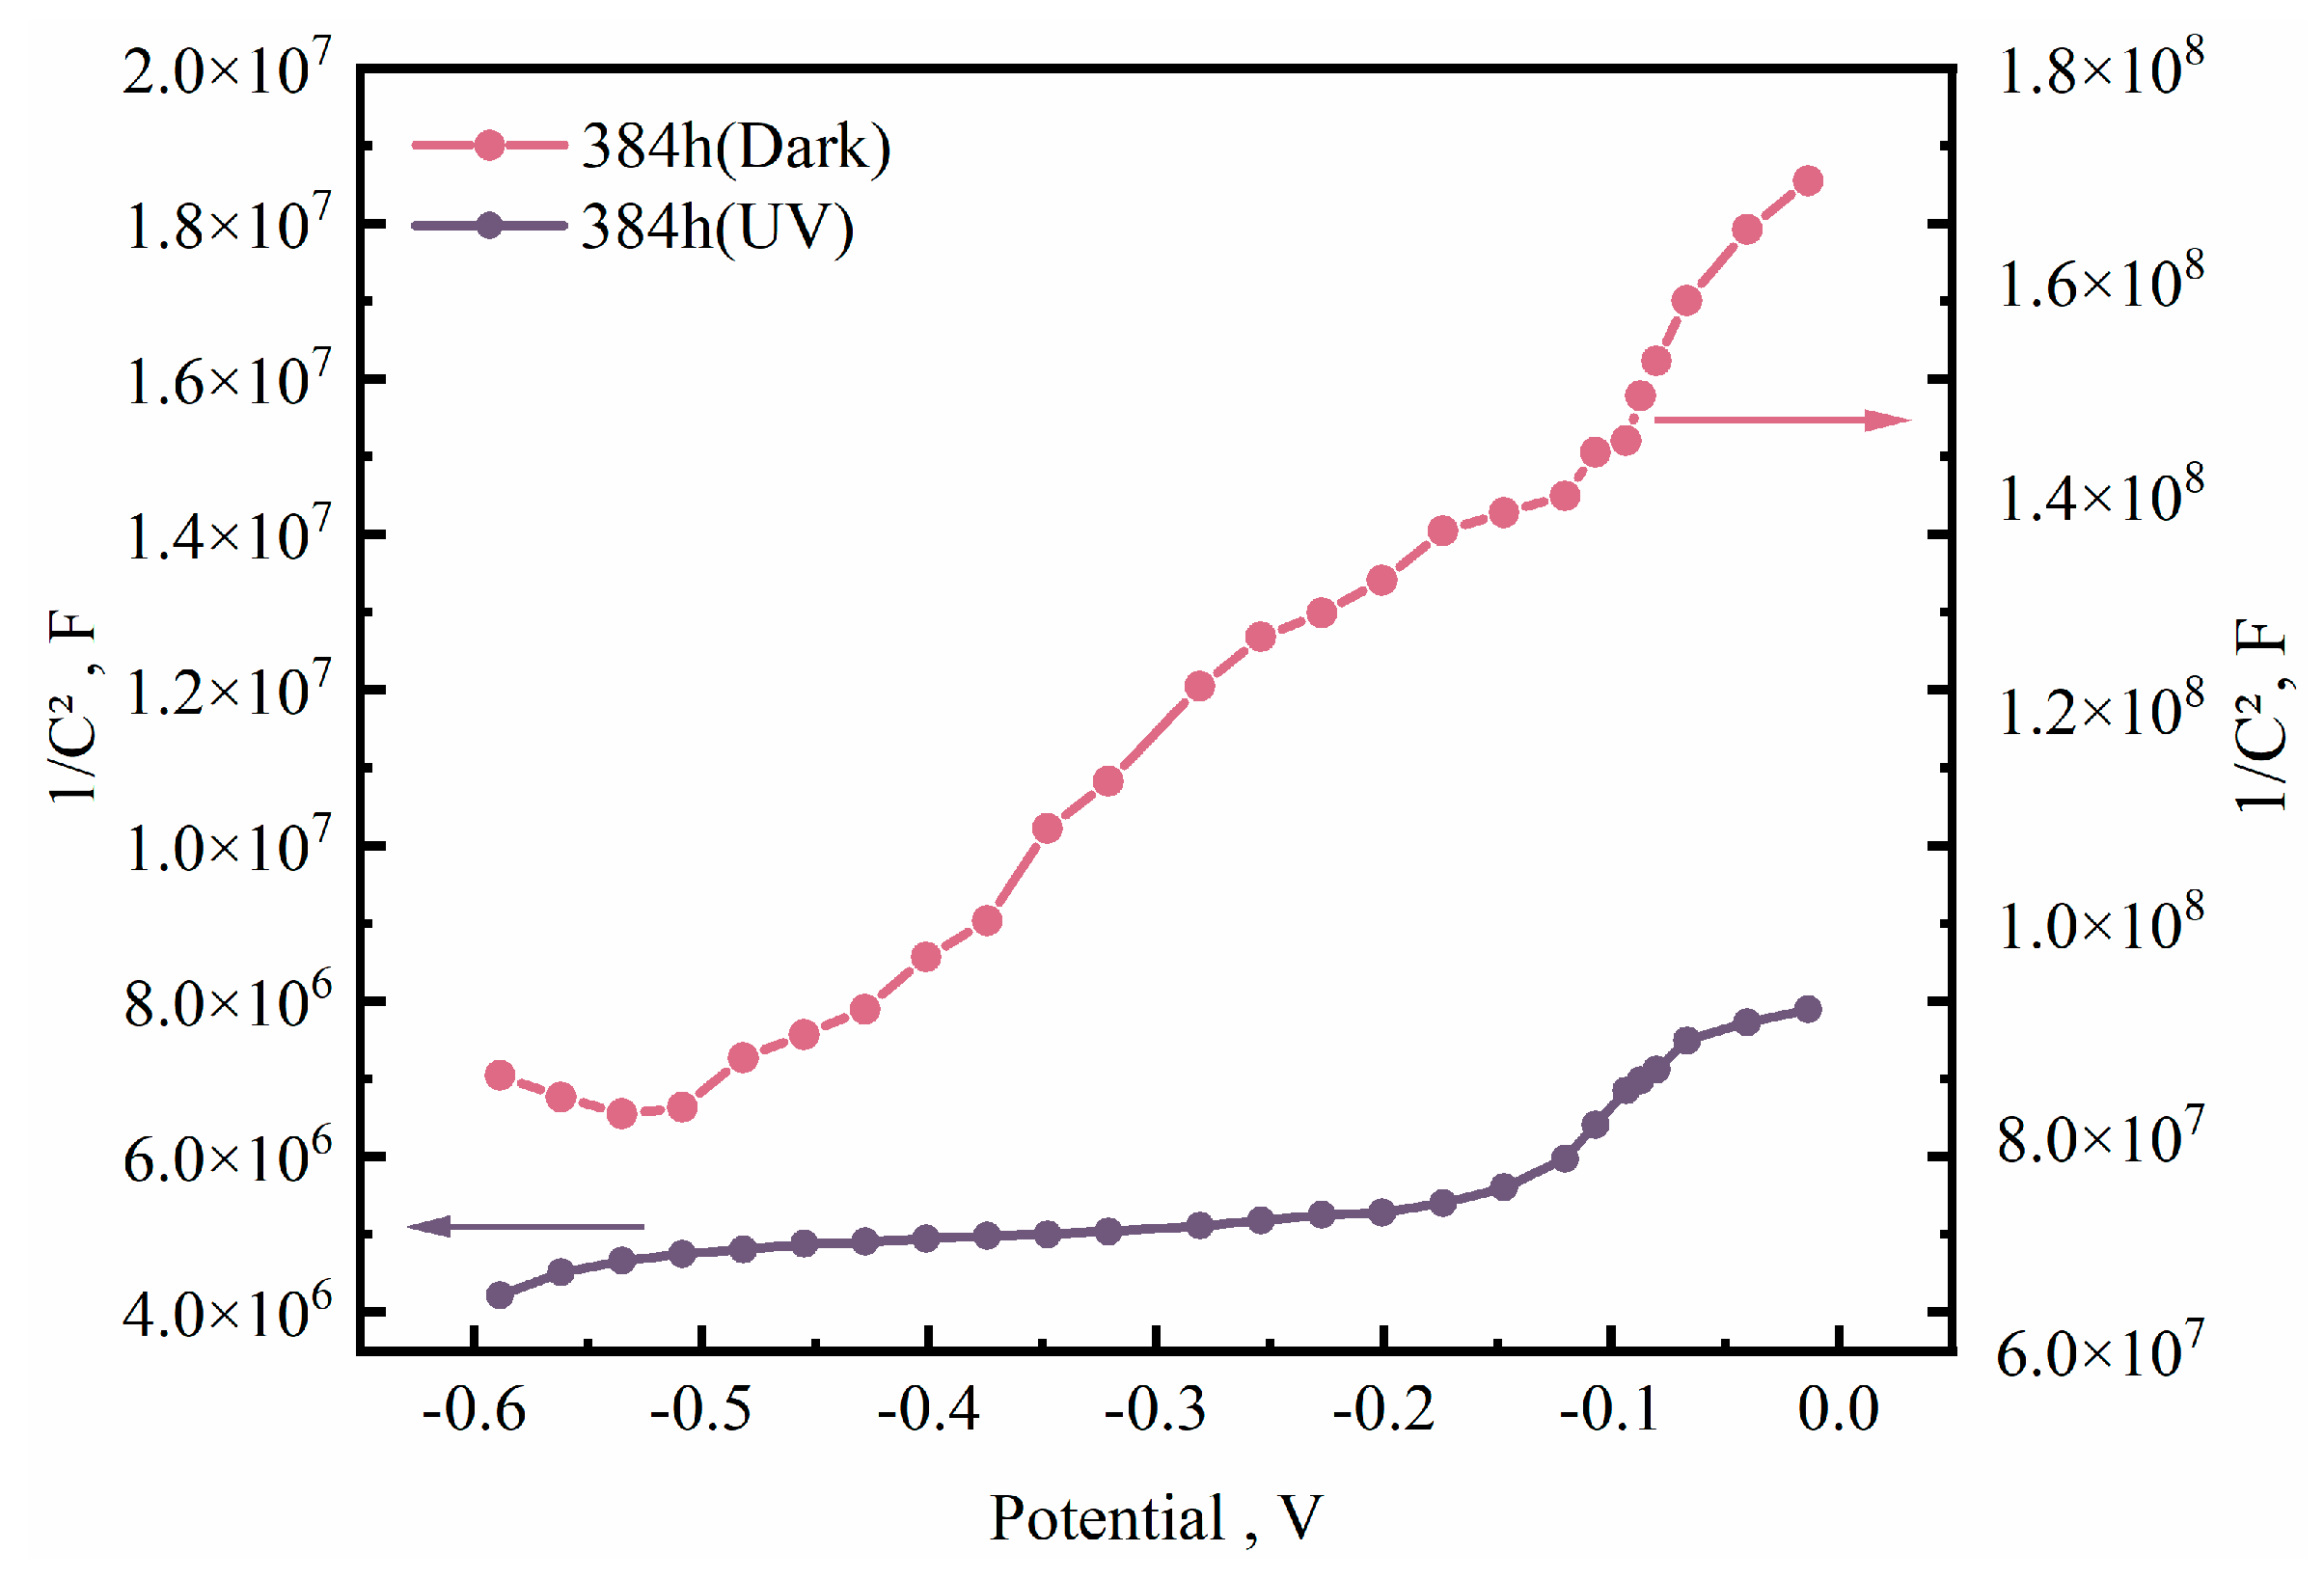
From Figure 7, it can be concluded that the rust layer is mainly composed of four corrosion products, α-FeOOH, β-FeOOH, γ-FeOOH and Fe3O4. α-FeOOH is the stable phase; β-FeOOH, γ-FeOOH and Fe3O4 are all sub-stable phases [10,27,28]. Figure 7a shows that the main phase composition of corrosion products in the dark environment is γ-FeOOH and Fe3O4, with Fe3O4 dominating in the early stage of corrosion and γ-FeOOH and α-FeOOH dominating in the late stage of corrosion. The results in Figure 7b show that the phase composition of corrosion products in the lighted environment is dominated by γ-FeOOH and Fe3O4, with α-FeOOH and β-FeOOH accounting for a smaller proportion of both. Figure 7c is the physical phase composition of the inner embroidered layer of corrosion products after 384 h in both environments of the experimental steel. Figure 7d is the physical phase composition of the inner embroidered layer of corrosion products after 384 h in both environments of the experimental steel; it can be seen that the inner rust layer in the dark environment is mainly composed of α-FeOOH and γ-FeOOH, while the outer rust layer is mainly composed of γ-FeOOH and Fe2O3. In contrast, in the lighted environment, the inner rust layer is mainly composed of α-FeOOH and Fe3O4, while the outer rust layer is mainly composed of β-FeOOH, γ-FeOOH and Fe3O4.
In the dark environment, the percentage content of α-FeOOH in the corrosion products gradually increases and the percentage content of β-FeOOH gradually decreases, because β-FeOOH is not a pure phase. With the extension of corrosion time, this is gradually transformed into stable α-FeOOH and the percentage content of Fe3O4 also gradually decreases. Fe3O4 is also a thermodynamically substable phase, and can be reduced to γ-FeOOH; thus, the percentage content of γ-FeOOH also gradually increases [29,30,31]. The physical phase of the rust layer in the dark environment is mainly composed of γ-FeOOH and Fe3O4, mainly due to the semiconductor nature of γ-FeOOH in the role of photovoltaic absorption of photoelectrons for redox reactions. In the formation of electric conductor γ-Fe-OH-OH with α-FeOOH within the rust layer dense, H2O and O2 are unable to participate in the reaction, which gradually leads to Fe3O4 transformation.
To further elucidate the forms of Ni and Mo present, detailed XPS spectra and physical phase analysis are shown in Figure 8. As can be seen from Figure 8a, the element Fe is dominated by two chemical states, FeOOH and Fe2O3, and the corrosion products under the UV-illuminated environment are dominated by FeOOH. As can be seen through Figure 8b the element Ni presents three chemical states, Ni(OH)2, NiO and NiFe2O4, and as can be seen in Figure 8c, the element Mo is mainly present in two states, MoO2 and MoO3. Ni in the steel produces Ni(OH)2 by reacting with H2O and O2, and part of Ni(OH)2 is hydrolysed into NiO2, while part of Fe2+ is formed into NiFe2O4 by Ni2+. NiFe2O4 is an electronegative oxide that can prevent the erosion due to Cl- and improve the protection of the rust layer [32], while NiO is a highly stable oxide that will not be further transformed. NiO can act as a nucleation site for γ-FeOOH, refining the rust layer and improving the denseness of the rust layer.
Mo elements in the form of MoO2 and MoO3 are enriched at the inner embroidery layer and near the substrate. MoO2 is a highly stable insoluble oxide, which can prevent the sprouting and expansion of cracks [33], while MoO42− formed as Mo6+ can act as an anodic corrosion inhibitor, inhibiting the dissolution of the anode and, thus, hindering the development of pitting corrosion. The intensity of both Ni and Mo oxides in the dark environment is higher than the intensity values of oxides in the illuminated environment. On the one hand, due to the dark environment, the corrosion rate is faster and there are more corrosion products, including more Ni and Mo oxides in the corrosion products. On the other hand, the higher density of the rust layer in the illuminated environment hinders the oxidation process of H2O and O2 with corrosion resistant elements.

3.4. CPF Analysis

Figure 9 shows the cross-sectional morphology and energy spectrum analysis of the corrosion products of 3Ni weathering steel under a dark environment in cyclic accelerated experiments. The rust layer thickened from 96 μm to 283 μm as the corrosion time increased, and the rust layer was looser at 48 h and 96 h. The rust layer became denser and more closely bonded to the substrate as it thickened, and the initial loose rust layer gradually changed into a double layer structure with a dense inner embroidery layer and a loose outer embroidery layer. After 192 h, a dense rust layer formed with fewer holes in it.
The results of the EDS surface scan show that the Fe content of the rust layer is weaker than that of the matrix, while O is mainly enriched in the rust layer; thus, the rust layer is mainly an oxide of Fe. Cl is mainly enriched in the defects of the rust layer, such as holes and microscopic cracks, and the holes that destroy the denseness of the rust layer gradually shift from the outer to the inner rust layer. Corrosion-resistant alloy elements such as Cu, Ni and Mo are enriched in the inner rust layer during the formation of the rust layer, resisting the erosion of Cl ions and promoting the formation of a dense rust layer [34,35].
Figure 10 shows the cross-sectional morphology and energy spectrum of the corrosion products of 3Ni weathering steel in the accelerated cyclic experiment with UV illumination. The 48 h rust layer has not yet formed and, from 96 h to 384 h, the rust layer thickens from 38 μm to 165 μm. This rust layer thickness is only half of that in the pure dark environment, until 384 h, when it forms a dense rust layer. However, the entire rust layer consists of almost dense, internal embroidery. There is clearly a difference between the rust layer in the illuminated environment and the dark environment, with a lower corrosion rate. The surface scan results also show that the enrichment of Cl in the rust layer gradually decreases and that corrosion resistant alloy elements such as Cr, Ni and Mo are enriched in the rust layer to a higher degree than in the pure dark environment, due to the photovoltaic effect, resisting the Cl well and promoting the formation of the dense rust layer [36].
Table 3 shows the content of the main elements and microhardness values of the corrosion products at different locations after 384 h in both environments. Points 1 and 4 correspond to the intersection of the matrix and rust layer; points 2 and 5 are the inner rust layer andpoints 3 and 6 are the outer rust layer, in the dark environment. Cl is the least enriched in the matrix, the highest enriched in the inner rust layer, and the outer rust layer is also enriched to a certain extent. While Ni and Mo elements are the most enriched in the matrix and in the inner rust layer, Ni and Mo are the most enriched and have the best effect in resisting Cl erosion. Cu is also enriched in the matrix, reducing the hygroscopicity and electrical conductivity of the rust layer and improving the weathering resistance of the matrix. Under the illuminated environment, Cl is the least enriched in the matrix and the highest enriched in the inner rust layer, and the percentage of enrichment is also higher than that of the dark environment. As the degree of Cl enrichment increases, the enrichment of Ni, Mo and Cu elements also increases. The conductivity of the rust layer is positively correlated to a certain extent with the enrichment of alloying elements due to the higher degree of Cl enrichment.
By comparing the microhardness at different locations, it can be seen that the microhardness value of the inner rust layer is the highest in both environments, and the values at the interface between the corrosion product and the substrate and the outer rust layer are slightly lower. It can be seen that the denseness of the rust layer is mainly determined by the inner rust layer, and the redox reaction near the substrate and the atmospheric environment is strong, with low chemical stability and lower microhardness values, while the outer rust layer is loose and hollow and has lower hardness values. Comparing the microhardness in the dark and illuminated environments, it can be seen that the denseness of the rust layer is higher and the microhardness value is higher in the illuminated environment, where the inner rust layer of the corrosion product layer accounts for a large proportion and the hardness value of the outer rust layer is also higher.
The three-dimensional morphology after over corrosion and its surface roughness results were quantified to characterize the evolution process of the steel rust interface at different corrosion cycles. A 1.28 × 1.28 mm area after rust removal was selected for three-dimensional characterization and the surface roughness was calculated and the results are shown in Figure 11 and Figure 12. As the corrosion time increases, the depth of the corrosion pits gradually increases, and the surface roughness also gradually increases.
Figure 11a shows the corrosion morphology of samples in the dark environment at different times, illlustrating the initial stage of corrosion from the local pitting and the local corrosion pits gradually becoming deeper and wider, causing pitting corrosion on the surrounding surface. The corrosion time ranged from 48 h to 384 h, corrosion pit depth ranged from 34.7 μm to 131.5 μm and the surface roughness increased from 2.22 μm to 3.67 μm. Figure 11b shows the corrosion profile at different times in the illuminated environment. However, as the corrosion time increases, the localised pitting changes to uniform corrosion over the whole surface, with the depth of the corrosion pits developing from 28.7 μm to 86.5 μm and the surface roughness increasing from 2.08 μm to 3.33 μm. Examining the results of laser confocal in the dark environment and the lighted environment, it can be seen that there are good correlations between the depth of corrosion pits and the surface roughness and corrosion rate. With deeper corrosion pits and greater surface roughness, the corrosion rate of the experimental steel increases, indicating that local pitting and the surface roughness of the experimental steel are important factors affecting the corrosion process of 3Ni steel in the marine atmospheric environment.

4. Discussion

This paper systematically investigated the corrosion behavior and mechanism of new 3Ni weathering steel in two marine atmospheric environments involving darkness and UV illumination. It is well known that atmospheric corrosion of metallic materials is a redox reaction between metallic materials and their environment, where the reaction generates oxides and other compounds. The origin of corrosion of the specimen surface starts at local pitting [37], with deepening and expansion of pitting, finally covering the entire surface of the specimen. With the extension of corrosion time, corrosion products gradually form a dense rust layer.
Figure 13 shows a model of the corrosion evolution of 3Ni weathering steel in two environments; the corrosion anodic reaction of 3Ni is as follows:
Fe → Fe2++2e,
Fe2+ + H2O → Fe(OH)+ + H+,
2Fe(OH)+ + O2 + e → 2γ-FeOOH,
2FeOOH + Fe2+ → Fe3O4 + 2H+
and
Fe(Cl)+ + 1/2O2 + H2O → β-FeOOH.
Fe2+ will further hydrolyse to form Fe(OH)+ (4) [38], and dissolved oxygen or other strong oxidizing radicals will cause the rapid oxidation and precipitation of Fe(OH)+ to form γ-FeOOH (5). Moreover, some of the Fe2+ will further oxidize to become Fe3+, due to the presence of large amounts of chloride ions in the marine atmospheric environment. The initial corrosion products, γ-FeOOH and Fe3O4 (7) and partial β-FeOOH (8) [39], are similar in both environments, but with the intervention of photoelectrons in the UV-illuminated environment, the corrosion process differs from that in the dark environment:
γ-FeOOH → FeOX(OH)3−2X → α-FeOOH,
2Fe3O4 + ½O2 → 3Fe2O3,
3Fe3O4 + 3/4O2 + 9/2H2O → 9γ-FeOOH
and
β-FeOOH → α-FeOOH.
β-FeOOH, γ-FeOOH and Fe3O4 formed in the dark environment are all sub-stable phases with poor electrochemical stability and inability to provide protection for the substrate. In this environment, the corrosion reaction will continue; part of γ-FeOOH will be transformed into amorphous iron hydroxide and generate α-FeOOH with high electrochemical stability through solid state phase transformation, part of Fe3O4 will continue to be oxidized to Fe2O3 (11) and another part of Fe3O4 will be oxidized to γ-FeOOH (11) and eventually transformed to α-FeOOH (9) through solid state transformation. β-FeOOH also transforms to stable α-FeOOH (12) [40,41]. As the content of α-FeOOH continues to increase, the rust layer gradually thickens, impeding the transport of O2 and ions, the dissolution of anode Fe2+ is inhibited, the content of γ-FeOOH and Fe3O4 decreases, the corrosion rate decreases and a stable dense rust layer gradually forms.
Under the UV-illuminated environment, since β-FeOOH and γ-FeOOH are n-type semiconductors and Fe3O4 is an electric conductor, both respond to visible light. γ-FeOOH will capture photoelectrons and get γ-Fe-OH-OH (13) of electric conductor through reduction reaction, while the electrons in the valence band are excited into the conduction band, the photogenerated holes in the valence band will flow to the substrate, the photogenerated holes have strong oxidation ability and can adsorb Cl near the substrate, the reaction generates Fe(Cl)+, which further promotes the generation of β-FeOOH (14). The lattice distortion produced in the process of obtaining γ-Fe-OH-OH promotes the transformation of γ-FeOOH to α-FeOOH. β-FeOOH is also a substable phase, which also transforms into the stable phase α-FeOOH.
γ-FeOOH + e + H+ → γ-Fe-OH-OH
Fe(Cl)+ + 1/2O2 + H2O → β-FeOOH
With the gradual thickening of the rust layer, more α-FeOOH is formed in the corrosion products, and because α-FeOOH is an electrical insulator, it is difficult for photogenerated electrons to react with the reduction of γ-FeOOH, and it is difficult for photogenerated holes to capture Cl. Hence, the substrate’s redox reaction with the atmospheric environment is inhibited, the corrosion rate is reduced, and the interface between the base metal and the corrosion product layer will enter an oxygen-deficient environment. However, Fe3O4 is an electrical conductor and can be used as a channel for electron migration after anode dissolution. Both β-FeOOH and γ-FeOOH are highly reductive and can react with photoelectrons and substrates to convert to Fe3O4 by (15) and (16) [39,42], respectively, in these reactions:
3γ(β)-FeOOH + H+ + e →Fe3O4 + 2H2O
and
Fe2+ + 8γ(β)-FeOOH + 2e → 4Fe3O4 + 4H2O.
A comparison of the corrosion products in dark and illuminated environments shows that the difference in conductivity of the corrosion products leads to a difference in the composition of the corrosion product phase. The difference in the composition of the phase leads to differences in the distribution of corrosion resistant elements in the rust layer and the denseness of the rust layer. Consequently, the composition of the rust layer phase and the denseness both originate from the electrochemical reaction between the substrate and the atmospheric environment.

5. Conlusions

This paper investigates the corrosion process of the new 3Ni steel under two marine atmospheric environments, darkness and UV illumination, with the following main findings:
(1)
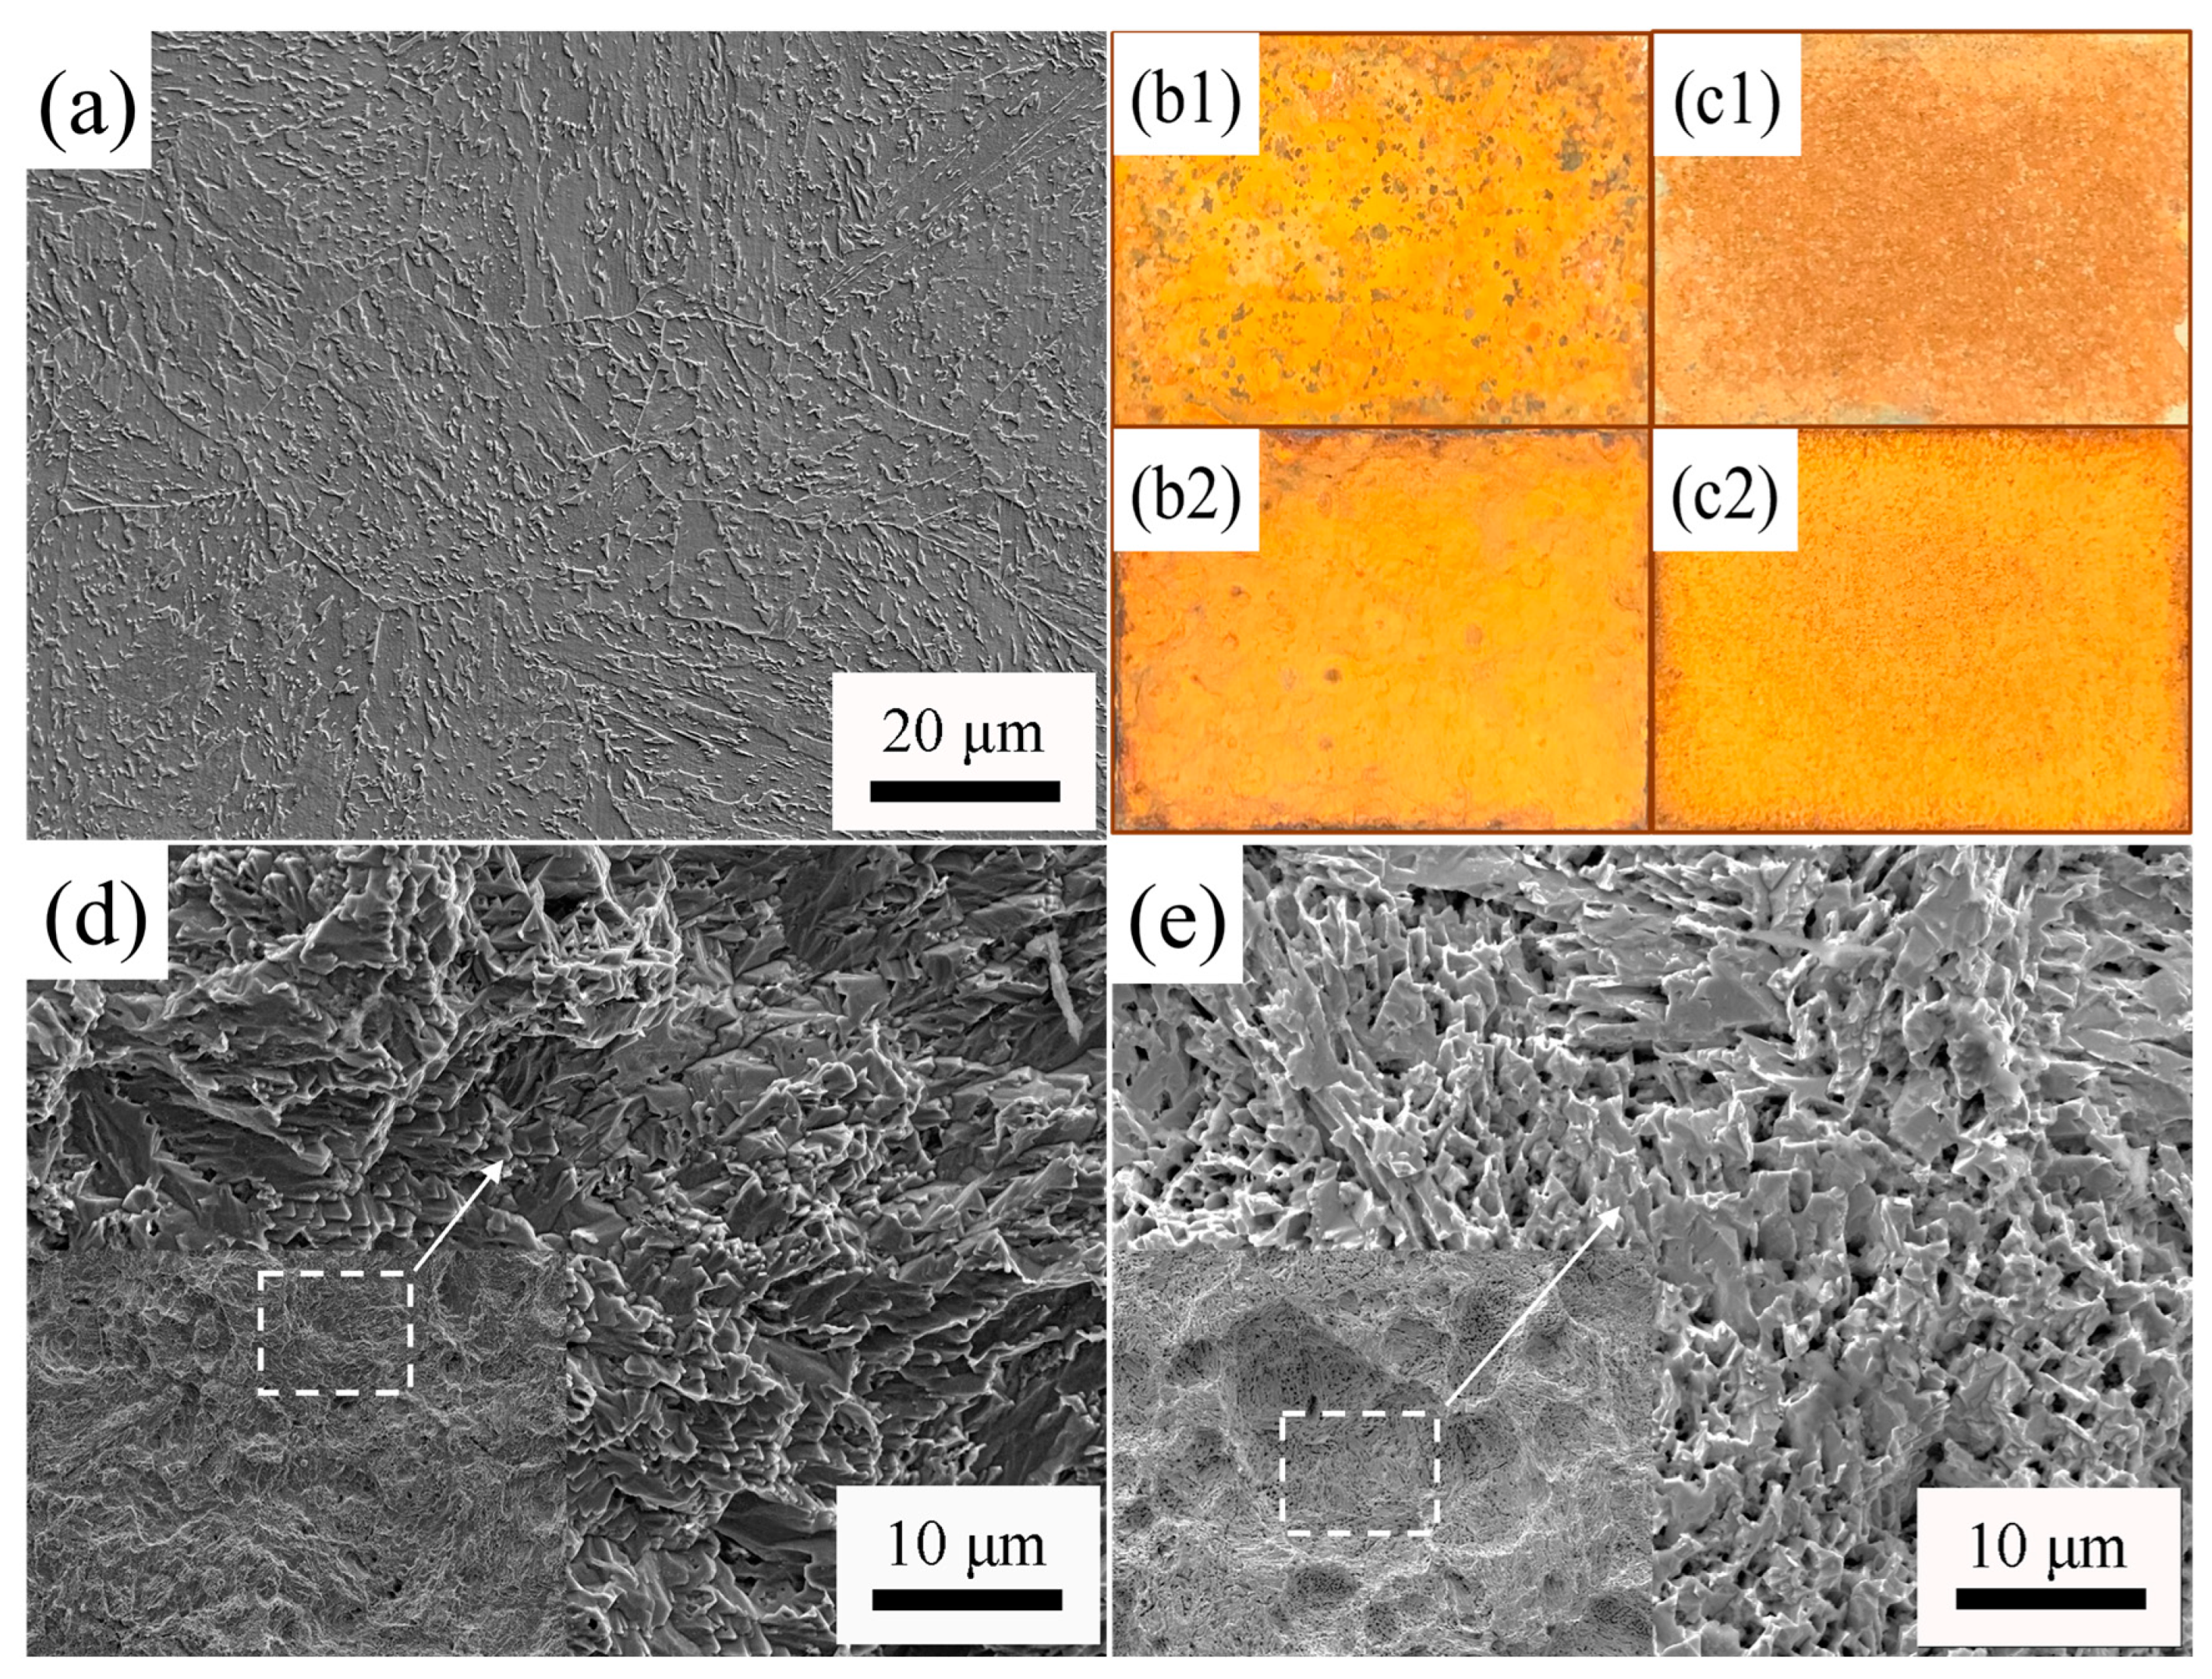
Comparing the corrosion process of 3Ni steel in two marine atmospheres with darkness and UV illumination, it can be seen that 3Ni steel in the two environments show different corrosion rates, corrosion morphology, physical composition of corrosion products and properties.
(2)
The influence of the marine atmospheric environment on the corrosion process of 3Ni steel with the involvement of UV illumination is related to the photovoltaic effect of corrosion products with semiconductor properties.
(3)
The marine atmospheric environment, in which UV exposure occurs, increases the conductivity of corrosion products through the photovoltaic effect of the corrosion products, which in turn alters the physical phase composition of the corrosion products and improves the densification of the corrosion products.

Author Contributions

H.X.: conceptualisation, methodology, formal analysis, investigation, data management, writing—original draft; R.Y. and Z.Z.: conceptualisation, methodology, writing—review and editing; Y.Y. and Y.W.: conceptualisation, investigation, data management and supervision; P.Z. and X.M.: conceptualisation, project management, funding acquisition and supervision; H.W.: investigation, conceptualisation, methodology, data management, writing—review and editing, funding access, supervision. All authors have read and agreed to the published version of the manuscript.

Funding

This research was funded by National Key R&D Program of China (No. 2021YFB3701700).

Data Availability Statement

Not applicable.

Acknowledgments

Thanks to the funding of National Key R&D Program of China (No. 2021YFB3701700).

Conflicts of Interest

The authors declare no conflict of interest.

References

  1. Tian, H.; Cui, Z.; Ma, H.; Zhao, P.; Yan, M.; Wang, X.; Cui, H. Corrosion evolution and stress corrosion cracking behavior of a low carbon bainite steel in the marine environments: Effect of the marine zones. Corros. Sci. 2022, 206, 110490. [Google Scholar] [CrossRef]
  2. Dong, B.; Liu, W.; Zhang, T.; Chen, L.; Fan, Y.; Zhao, Y.; Li, H.; Yang, W.; Sun, Y. Clarifying the effect of a small amount of Cr content on the corrosion of Ni-Mo steel in tropical marine atmospheric environment. Corros. Sci. 2023, 210, 110813. [Google Scholar] [CrossRef]
  3. Xu, X.; Zhang, T.; Wu, W.; Jiang, S.; Yang, J.; Liu, Z. Optimizing the resistance of Ni-advanced weathering steel to marine atmospheric corrosion with the addition of Al or Mo. Constr. Build. Mater. 2021, 279, 122341. [Google Scholar] [CrossRef]
  4. Chen, H.; Cui, H.; He, Z.; Lu, L.; Huang, Y. Influence of chloride deposition rate on rust layer protectiveness and corrosion severity of mild steel in tropical coastal atmosphere. Mater. Chem. Phys. 2021, 259, 123971. [Google Scholar] [CrossRef]
  5. Li, Z.; Song, J.; Chen, J.; Yu, Q.; Xiao, K. Corrosion behavior of a high-strength steel E690 in aqueous electrolytes with different chloride concentrations. J. Mater. Res. Technol. 2023, 22, 596–604. [Google Scholar] [CrossRef]
  6. Li, G.; Wu, W.; Chai, P.; Yang, X.; Song, L. Influence of Cr and Ni elements on the electrochemical and early corrosion behavior of FeMnAlC low-density steel. J. Mater. Res. Technol. 2023, 23, 5892–5906. [Google Scholar] [CrossRef]
  7. Di Sarno, L.; Majidian, A.; Karagiannakis, G. The Effect of Atmospheric Corrosion on Steel Structures: A State-of-the-Art and Case-Study. Buildings 2021, 11, 571. [Google Scholar] [CrossRef]
  8. Li, N.; Zhang, W.; Xu, H.; Cai, Y.; Yan, X. Corrosion Behavior and Mechanical Properties of 30CrMnSiA High-Strength Steel under an Indoor Accelerated Harsh Marine Atmospheric Environment. Materials 2022, 15, 629. [Google Scholar] [CrossRef]
  9. Kim, K.M.; Kim, G.-I.; Son, G.-H.; Yoo, Y.-H.; Hong, S.; Kim, J.-G. New Accelerated Corrosion Test Method Simulating Atmospheric Corrosion of Complex Phase Steel Combining Cyclic Corrosion Test and Electrochemically Accelerated Corrosion Test. Materials 2023, 16, 3132. [Google Scholar] [CrossRef]
  10. Krivy, V.; Kubzova, M.; Kreislova, K.; Urban, V. Characterization of Corrosion Products on Weathering Steel Bridges Influenced by Chloride Deposition. Metals 2017, 7, 336. [Google Scholar] [CrossRef]
  11. Xu, Y.; Schoonen, M.A. The absolute energy positions of conduction and valence bands of selected semiconducting minerals. Am. Mineral. 2000, 85, 543–556. [Google Scholar] [CrossRef]
  12. Song, L.; Ma, X.; Chen, Z.; Hou, B. The role of UV illumination on the initial atmospheric corrosion of 09CuPCrNi weathering steel in the presence of NaCl particles. Corros. Sci. 2014, 87, 427–437. [Google Scholar] [CrossRef]
  13. Jing, J.; Chen, Z.; Feng, C. Using the photoinduced volt-ampere curves to study the p/n types of the corrosion products with semiconducting properties. J. Electroanal. Chem. 2021, 881, 114961. [Google Scholar] [CrossRef]
  14. Guo, M.; Lu, X.; Tang, J.; Pan, C.; Wang, Z. Corrosion Behavior of 316 Stainless Steel Exposed to a Simulated Salt lake Atmospheric Environment under UV Illumination. Int. J. Electrochem. Sci. 2021, 16, 210457. [Google Scholar] [CrossRef]
  15. Wu, W.; Zeng, Z.; Cheng, X.; Li, X.; Liu, B. Atmospheric Corrosion Behavior and Mechanism of a Ni-Advanced Weathering Steel in Simulated Tropical Marine Environment. J. Mater. Eng. Perform. 2017, 26, 6075–6086. [Google Scholar] [CrossRef]
  16. Li, H.; Chen, Z.; Liu, X.; Hou, J.; Sun, M.; Zeng, R. Study on the Mechanism of the Photoelectrochemical Effect on the Initial NaCl-Induced Atmospheric Corrosion Process of Pure Copper Exposed in Humidified Pure Air. J. Electrochem. Soc. 2018, 165, C608–C617. [Google Scholar] [CrossRef]
  17. Song, S.; Chen, Z. Effect of UV Illumination on the NaCl-Induced Atmospheric Corrosion of Pure Zinc. J. Electrochem. Soc. 2014, 161, C288–C293. [Google Scholar] [CrossRef]
  18. Lin, H.; Frankel, G.S. Accelerated Atmospheric Corrosion Testing of Ag. Corrosion 2013, 69, 1060–1072. [Google Scholar] [CrossRef]
  19. Toshiyasu Nishimura, H.K.K.N.; Kodama, T. Effect of Co and Ni on the corrosion behavior of low alloy steel in wet/dry environments. Corros. Sci. 2000, 9, 1611–1621. [Google Scholar] [CrossRef]
  20. Hao, L.; Zhang, S.; Dong, J.; Ke, W. A study of the evolution of rust on Mo–Cu-bearing fire-resistant steel submitted to simulated atmospheric corrosion. Corros. Sci. 2012, 54, 244–250. [Google Scholar] [CrossRef]
  21. Hao, L.; Zhang, S.; Dong, J.; Ke, W. Evolution of atmospheric corrosion of MnCuP weathering steel in a simulated coastal-industrial atmosphere. Corros. Sci. 2012, 59, 270–276. [Google Scholar] [CrossRef]
  22. Cheng, Y.F.; Luo, J.L. Electronic structure and pitting susceptibility of passive film on carbon steel. Electrochim. Acta 1999, 17, 2947–2957. [Google Scholar] [CrossRef]
  23. Feng, Z.; Cheng, X.; Dong, C.; Xu, L.; Li, X. Passivity of 316L stainless steel in borate buffer solution studied by Mott–Schottky analysis, atomic absorption spectrometry and X-ray photoelectron spectroscopy. Corros. Sci. 2010, 52, 3646–3653. [Google Scholar] [CrossRef]
  24. Stratmann, M.; Bohnenkamp, K.; Engell, H.-J. An electrochemical study of phase-transitions in rust layers. Corros. Sci. 1983, 23, 969–985. [Google Scholar] [CrossRef]
  25. Wu, W.; Cheng, X.; Zhao, J.; Li, X. Benefit of the corrosion product film formed on a new weathering steel containing 3% nickel under marine atmosphere in Maldives. Corros. Sci. 2020, 165, 108416. [Google Scholar] [CrossRef]
  26. Ma, Y.; Li, Y.; Wang, F. Corrosion of low carbon steel in atmospheric environments of different chloride content. Corros. Sci. 2009, 51, 997–1006. [Google Scholar] [CrossRef]
  27. Wang, Y.; Li, J.; Zhang, L.; Zhang, L.; Wang, Q.; Wang, T. Structure of the rust layer of weathering steel in A high chloride environment: A detailed characterization via HRTEM, STEM-EDS, and FIB-SEM. Corros. Sci. 2020, 177, 108997. [Google Scholar] [CrossRef]
  28. Qian, Y.; Ma, C.; Niu, D.; Xu, J.; Li, M. Influence of alloyed chromium on the atmospheric corrosion resistance of weathering steel. Corros. Sci. 2013, 74, 424–429. [Google Scholar] [CrossRef]
  29. Rubim, J.C.; Sousa, M.H.; Silva, J.C.O.; Tourinho, F.A. Raman spectroscopy as a powerful technique in the characterization of ferrofluids. Braz. J. Phys. 2001, 31, 402–408. [Google Scholar] [CrossRef]
  30. de Faria, D.L.A.; Silva, S.V.; de Oliveira, M.T. Raman microspectroscopy of some iron oxides and oxyhydroxides. J. Raman Spectrosc. 1997, 28, 873–878. [Google Scholar] [CrossRef]
  31. Chourpa, I.; Douziech-Eyrolles, L.; Ngaboni-Okassa, L.; Fouquenet, J.-F.; Cohen-Jonathan, S.; Soucé, M.; Marchais, H.; Dubois, P. Molecular composition of iron oxide nanoparticles, precursors for magnetic drug targeting, as characterized by confocal Raman microspectroscopy. Analyst 2005, 130, 1395. [Google Scholar] [CrossRef] [PubMed]
  32. Díaz, I.; Cano, H.; Lopesino, P.; de la Fuente, D.; Chico, B.; Jiménez, J.A.; Medina, S.F.; Morcillo, M. Five-year atmospheric corrosion of Cu, Cr and Ni weathering steel in a wide range of environments. Corros. Sci. 2018, 141, 146–157. [Google Scholar] [CrossRef]
  33. Zhang, T.; Liu, W.; Chen, L.; Dong, B.; Yang, W.; Fan, Y.; Zhao, Y. On how the corrosion behavior and the functions of Cu, Ni and Mo of the weathering steel in environments with different NaCl concentrations. Corros. Sci. 2021, 192, 109851. [Google Scholar] [CrossRef]
  34. Yuan, R.; Wu, H.; Gu, Y. Effect of alloyed Cr on corrosion behavior of low-alloy steel in wet atmosphere. Mater. Corros. 2022, 73, 918–931. [Google Scholar] [CrossRef]
  35. Yuan, R.; Yu, X.; Zhang, Y.; Wu, H.; Guo, H. Research on corrosion mechanism of microstructure on low alloy steel in humid atmosphere. Mater. Today Commun. 2022, 31, 103715. [Google Scholar] [CrossRef]
  36. Zhang, Y.; Yuan, R.; Yang, J.; Xiao, D.; Luo, D.; Zhou, W.; Tuo, C.; Wu, H.; Niu, G. Effect of tempering on corrosion behavior and mechanism of low alloy steel in wet atmosphere. J. Mater. Res. Technol. 2022, 20, 4077–4096. [Google Scholar] [CrossRef]
  37. Gong, K.; Wu, M.; Liu, G. Comparative study on corrosion behavior of rusted X100 steel in dry/wet cycle and immersion environments. Constr. Build. Mater. 2020, 235, 117440. [Google Scholar] [CrossRef]
  38. Misawa, T.; Asami, K.; Hashimoto, K.; Shimodaira, S. The mechanism of atmospheric rusting and the protective amorphous rust on low alloy steel. Corros. Sci. 1974, 14, 279–289. [Google Scholar] [CrossRef]
  39. Nishimura, T.; Tanaka, K.-I.; Shimizu, Y. Effect of NaCl on rusting of steel in wet and dry corrosion cycle. Tetsu-Hagané 1995, 11, 1079–1084. [Google Scholar] [CrossRef]
  40. Watkinson, D.; Lewis, M.R.T. The Role of βFeOOH in the Corrosion of Archaeological Iron. MRS Proc. 2004, 852, OO1-6. [Google Scholar] [CrossRef]
  41. Ishikawa, T.; Takeuchi, K.; Kandori, K. Nakayama Transformation of γ-FeOOH to α-FeOOH in acidic solutions containing metal ions. Colloids Surf. A Physicochem. Eng. Asp. 2005, 266, 155–159. [Google Scholar] [CrossRef]
  42. Ma, Y.; Li, Y.; Wang, F. The effect of β-FeOOH on the corrosion behavior of low carbon steel exposed in tropic marine environment. Mater. Chem. Phys. 2008, 112, 844–852. [Google Scholar] [CrossRef]
Figure 1. Microstructure and corrosion morphology of the experimental steel (a) microstructure; (b1,b2) macroscopic morphology after 96 h and 384 h in dark environment; (c1,c2) macroscopic morphology after 96 h and 384 h in illuminated environment; (d) descaling microscopic morphology after 384 h in dark environment; (e) descaling microscopic morphology after 384 h in illuminated environment.
Metals 13 01543 g001
Figure 2. Corrosion kinetic curves of experimental steel (a) Corrosion weight loss; (b) Corrosion rate.
Metals 13 01543 g002
Figure 3. Dynamic potential polarization curves of experimental steel in two environments.
Metals 13 01543 g003
Figure 4. Mott–Schottky diagram of rusted 3Ni weathering steel after 384 h exposure to two environments.
Metals 13 01543 g004
Figure 5. EIS analysis of 3Ni weathering steel after different corrosion cycles (a,d,g,j) Nyquist Figure; (b,e,h,k) Bode-|Z| Figure; (c,f,i,l) Bode-phase Figure.
Metals 13 01543 g005aMetals 13 01543 g005b
Figure 6. Equivalent circuit used to fit EIS data under dark and UV illumination. Rs is the solution resistance. Rct indicates the charge transfer resistance. Qdl is the double-layer capacitance of the electrolyte solution and the steel substrate surface. Qrl and Rrl are the capacitance and resistance of the corrosion products formed during exposure, respectively. W is the Warburg impedance. (a) Double Capacitance Equivalent Circuit; (b) Dual Capacitance Equivalent Circuit with Warburg Impedance.
Metals 13 01543 g006
Figure 7. X-ray diffraction spectra and Raman spectra of experimental steel after different times of accelerated cyclic corrosion after 384 h (a,c) Dark environment; (b,d) Illuminated environment.
Metals 13 01543 g007
Figure 8. XPS analysis of the main elements of the experimental steel after 384 h in different environments. (a) Fe 2p3/2; (b) Ni 2p3/2; (c) Mo 3d3/2.
Metals 13 01543 g008
Figure 9. Cross-sectional morphology and energy spectrum analysis of corrosion products of 3Ni weathering steel under dark environment in cyclic accelerated experiments (a) 96 h; (b) 192 h; (c) 384 h 1, 2, 3 are energy spectrum points.
Metals 13 01543 g009
Figure 10. Cross-sectional morphology and energy spectrum analysis of corrosion products of 3Ni weathering steel in an accelerated cyclic experiment with UV illumination (a) 96 h; (b) 192 h; (c) 384 h, 4, 5, 6 are energy spectrum points.
Metals 13 01543 g010
Figure 11. Three-dimensional morphology of rusted steel sections of 3Ni weathering steel with different corrosion cycles (a) dark environment; (b) UV-illuminated environment.
Metals 13 01543 g011
Figure 12. Surface roughness statistics of the experimental steel after different corrosion cycles.
Metals 13 01543 g012
Figure 13. Model of corrosion evolution of experimental steel in two environments.
Metals 13 01543 g013
Table 1. Chemical composition of the experimental steel (wt.%).
SteelCSiMnPSNiMoCuFe
3Ni0.080.251.020.090.043.171.980.23Bal
Table 2. EIS fitting results based on R(Q(R(QR)))) and R(Q(R(Q(Q(RW)))) equivalent circuits.
SteelRs (Ω·cm2)CPF (Ω−1 cm−2.sn)Rrl (Ω·cm2)CPF (Ω−1 cm−2.sn)Rct (Ω·cm2)W × 10−3
Qrln1Qdln2
3Ni
Dark
487.9610.1370.61842.8772.6080.8341847\
9610.140.11410.44142.4879.9480.82041051\
1926.8450.003820.161415.050.02660.311267.30.0263
38417.190.00070.33980.26550.056930.363136.490.0295
3Ni
UV
486.5180.063270.7141228.22.0080.6349359.5\
965.430.090890.59654.5386.2290.67512739\
1928.0010.034670.48694.5760.049490.57342911\
38418.080.0520.36194.5341.5210.848110021.009
Table 3. Content of major elements (wt.%) and microhardness (HV) of the corrosion products at different locations after 384 h in both environments.
PositionClNiMoCuHV
Dark10.621.661.180.6971
21.441.950.84\96
31.940.550.73\51
UV41.252.13.970.9769
53.462.342.55\116
62.181.661.55\84
Disclaimer/Publisher’s Note: The statements, opinions and data contained in all publications are solely those of the individual author(s) and contributor(s) and not of MDPI and/or the editor(s). MDPI and/or the editor(s) disclaim responsibility for any injury to people or property resulting from any ideas, methods, instructions or products referred to in the content.

